
Abstract
Background:
Despite several interventions, India has made little progress in reducing hidden hunger, micronutrient malnutrition. Food fortification of staple foods could be useful in addressing the above problem. Nonetheless, it may lead to an increase in economic stress among people by increasing inflation and monthly budget expenditure.
Objective:
The prime objective was to see whether or not mandatory food fortification will lead to an increase in inflation and the family’s budget expenditure.
Methods:
The study was based on secondary data. Decomposition approach has been used—inflation was decomposed into contributions of each commodity and which was further divided into base, weight, and inflation effects. To estimate the impact of mandatory food fortification on the family’s budget expenditure, monthly per capita expenditure has been assessed by considering both the situations—with and without fortification.
Results:
Results suggest that mandatory food fortification has a very negligible effect on inflation, suggesting no rise in inflation due to mandatory food fortification in India. Also, the study suggests a minimal increase in monthly per capita expenditure in both rural and urban sectors of India.
Conclusions:
Though adopting mandatory food fortification in India will not have an impact on inflation, there would be 2 major challenges: high dependency on food items processed locally and unawareness of benefits of fortified food items. Therefore, the government can first start food fortification of staple food with safety nets programs like NFSA, focusing on the most vulnerable groups of the society, and then scale up at a large scale.
Keywords
Introduction
India had recently shown its aspiration to become a five trillion-dollar economy. However, it remains facing a triple burden of malnutrition - the percent of people consuming insufficient calories to meet their energy requirements and the prevalence of undernutrition and micronutrient deficiency especially among children and women remains high. On another hand, the problem of obesity among both men and women increased rampantly. Latest figures (Table 1) show that 38% of children younger than 5 are affected by stunting—children too short for their age due to lack of nutrients, suffering irreversible damage to brain capacity. About 21% of children younger than 5 are defined as “wasted” or “severely wasted”—meaning they do not weigh enough for their height. Over half of women of reproductive age—51%—have anemia—a serious condition that can have long-term health impacts for mother and child. More than 22% of adult women are overweight. Micronutrient malnutrition (MNM) affects all age groups, but children and women are at greater risk. Three most common forms of MNM are iron, vitamin A, and iodine deficiency. Together, these affect at least one-third of the world’s population, the majority of whom are in developing countries including India. 1 Malnutrition is a major cause of poor health, which, further, causes low labor productivity and henceforth low economic growth. 2 It is, therefore, a great threat to India’s ambition of becoming global economic power.
Glimpses of Malnutrition in India in 2015-16 and 2005-06.a
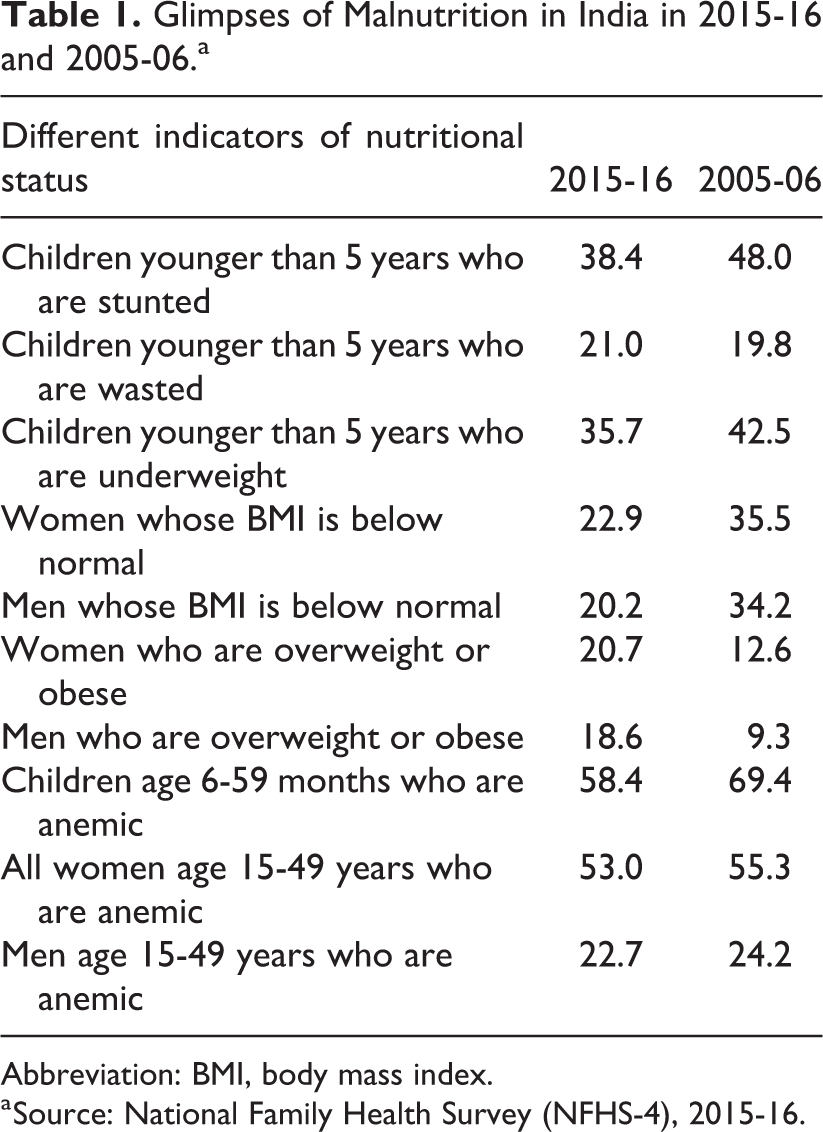
Abbreviation: BMI, body mass index.
a Source: National Family Health Survey (NFHS-4), 2015-16.
Multiple factors contribute to malnutrition in India—poverty, inadequate nutrition or food intake, poor health care, limited access to sanitation and safe drinking water, poor feeding practices and childcare, and women’s status and education. 3 Therefore, India has adopted multiple measures to combat the above problem—covering a range of approaches—from income-based approach (ie, Mahatma Gandhi National Rural Employment Guarantee Act) and food-based approach (ie, National Food Security Act, Mid-Day Meal Scheme) to sanitation-based approach (ie, Swachh Bharat Mission). These measures focus on both individuals and households—covering each stage of life from fetus in the womb to late adulthood. Due to these efforts, India has made good progress to reduce hunger problem. However, these have made little progress on reducing hidden hunger, MNM. 1,4 -7 It is estimated that more than 2 billion people suffer from “hidden hunger” globally, with nearly half living in India. 7
Here, food fortification of staple foods could be useful because it is an effective, easy, fast, safe, and relatively inexpensive 8,9 . There are several successful stories of food fortification starting from 1923 when it was first used in Switzerland. Few of them are Mandatory large-scale fortification of enriched cereals grain with folic acid in the United States 10 ; Mandatory Iodine Fortification of Salt in Australia 11 ; Tanzania’s food fortification program, 12 Costa Rica’s fortification program (Martorell et al, 2015) 13 .
The US Food and Drug Administration authorized addition of folic acid to enriched grain products in March 1996, with compliance mandatory by January 1998. Honein et al, 10 observed that the prevalence of neural tube defects (NTDs) was dramatically reduced to 0.66 in 1000 pregnancies within 5 years of the above initiative. In 2009, Australia introduced mandatory iodine fortification of salt in bread to address population-level mild iodine deficiency. Charlton et al, 11 has observed that iodine status of women has improved since the introduction of mandatory iodine fortification in Australia. Noor et al, 12 evaluated the effectiveness of Tanzania’s food fortification program by examining folate levels for women of reproductive age, 18 to 49 years, and observed that food fortification program with folic acid resulted in significant improvements in folate status among women of reproductive age. The fortification program in Costa Rica has also improved iron status and decreased anemia (Martorell et al, 2015).
Food fortification does not only contribute to nutritional security, while it also plays a significant role in employment generation and environmental sustainability. It has been estimated that food fortification industry can provide additional business of about ₹1100 crore to the fortificant industry (Table 2), if it is made mandatory in India, which, in turn, will create an environment for this industry to take place and will finally end up with some additional employment. Similarly, food fortification also helps in coping the adverse impact of climate change. We may take an example of increasing incidence of heavy rain and flood due to climate change, which, further, causes to land degradation, leading to the loss of minerals like iron, zinc, and so on in food items. These minerals can be rejuvenated through food fortification to minimize the adverse effect of land degradation.
Business Value of Micronutrients to be Generated by Fortificant Industry.a
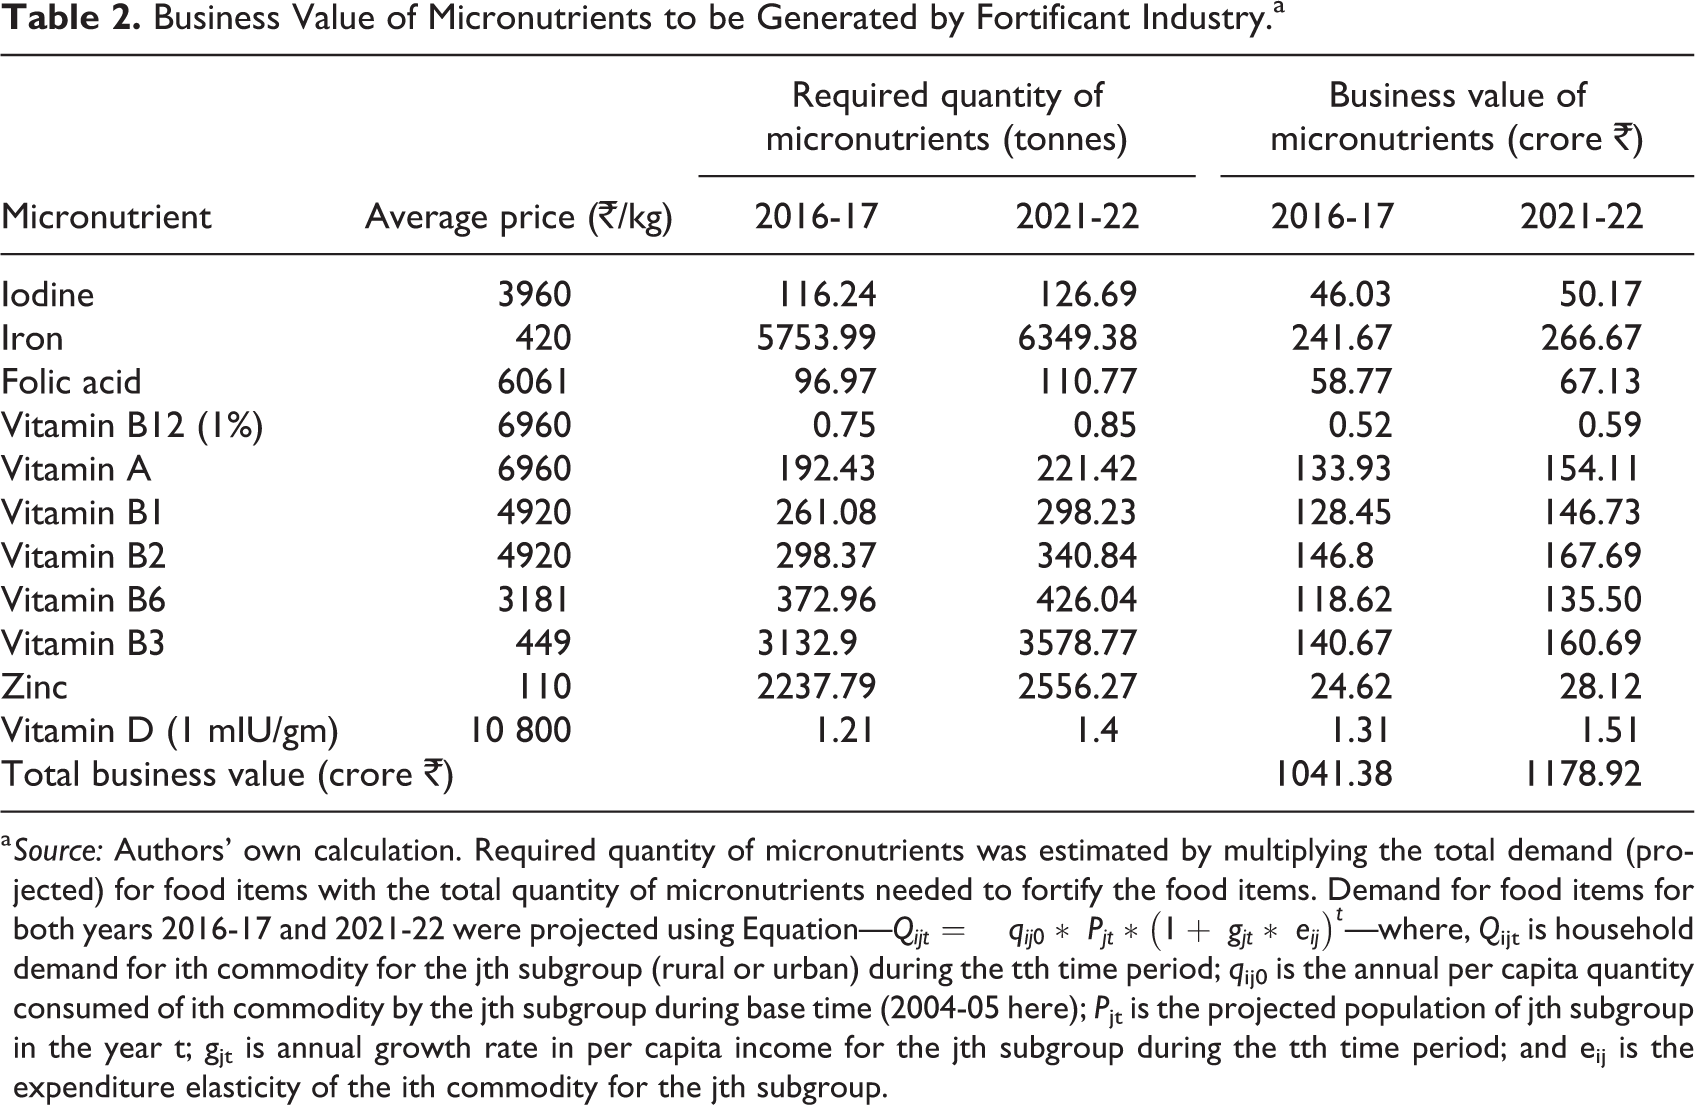
a Source: Authors’ own calculation. Required quantity of micronutrients was estimated by multiplying the total demand (projected) for food items with the total quantity of micronutrients needed to fortify the food items. Demand for food items for both years 2016-17 and 2021-22 were projected using Equation—
Statement of Research Problem
Fortification is the process of increasing existing nutrient value of food by adding additional nutrients, for example, iodized salt in India. India is one of the countries which has accepted iodine deficiency as a national public health problem and resolved to ensure the provision of iodized salt to its population. On the recommendation of the Central Council of Health in 1984, the Government of India took a policy decision to iodize the entire edible salt in the country by 1992. This program started in April 1986 in a phased manner, and in 1992 it was renamed as the “National Iodine Deficiency Disorder Control Program.” 14,15 Food fortification has 3 major types—home fortification, biofortification, and commercial fortification. In this research work, the prime focus is on commercial fortification, which is also pronounced as food fortification for the simplicity in the remaining part of the article.
Food fortification could lead to the problem of a severe price rise. Three different scenarios of price rise due to food fortification could be imagined here. Scenario 1, if there are few suppliers of premixes, they may form a cartel and raise prices of premixes that are used to fortify the food items. Because of a high rise in the price of raw materials, the cost of fortification will increase, which, will further increase the prices of fortified food items. To handle this problem, a regulating authority with an objective of monitoring of prices of micronutrients/premixes regularly could be constructed. Scenario 2, there may be a limited supply of premixes and hence the moment demand for premixes will increase, their prices will also upsurge automatically. To deal with this situation, subsidized imports of premixes and, simultaneously, focus on domestic production would be helpful. Scenarios 3, due to food fortification, we will face the situation of product differentiation. Such a situation provides an opportunity for the firm to charge a much higher price for differentiated products, which are fortified food items in our case. Mandatory fortification would be effective in controlling the above rise in prices.
The Government of India is therefore suggested to adopt the policy of mandatory food fortification along with 2 supporting measures—(1) a regulatory authority to monitor prices and supply of premixes and fortified food items, and (2) supports to premix manufacturer to install requisite production capacity. Here, whether mandatory fortification will increase inflation becomes a policy-relevant question. It would be very difficult for a welfare state to adopt such measures if mandatory food fortification leads to high inflation in the economy. Against this backdrop, the article tries to estimate the impact of mandatory fortification of selected food items on inflation. We further estimate its effect at household level in both rural and urban sectors of India.
Methods
Inflation is a sustained increase in the general level of prices for goods and services. There are 2 types of inflation—demand pull inflation and cost push inflation. 16 Here, our focus is on cost push inflation because food fortification will increase prices of food items by increasing cost of manufacturing. There are 2 important costs associated with food fortification—costs of premixes and capital costs. Premix is the mixture of micronutrients used to fortify any food. Earlier one is related to the variable costs, it is hence accounted in price determination, while later one is associated with the fixed costs and it is therefore not accounted in the price of fortified food items.
In India, inflation is measured using wholesale price index (WPI), which is aggregated price index of prices of 697 commodities. Hence, inflation can be decomposed into contributions of each commodity. The contribution of any single commodities can further be divided into base, weight, and inflation effects.
17
It is demonstrated below by taking first difference of Equation 1 and dividing by
where
Multiplying and dividing the right-hand expression by
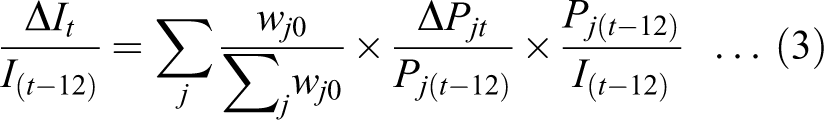
The first term on the right denotes the relative weight of commodity j in the overall commodity basket, the second term is the inflation of the commodity, and the third term is the price index of the commodity relative to the overall price index during the same month in the previous year; this is the base effect.
In addition, we tried to see impact of food fortification on monthly per capita expenditure (MPCE) for both rural and urban sectors separately. To calculate change in MPCE due to fortification, first this figure is estimated with and without fortification separately for urban and rural sectors and then, both estimates of each sector are compared with each other. Information on MPCE without fortification is collected from the latest round of National Sample Survey on Household Consumer Expenditure, which was conducted in year 2011-12. Monthly per capita expenditure with fortification is calculated using information on per capita monthly quantity of food items consumed by an average household and price change due to fortification.
Commodities
India’s food basket incorporates rice, wheat, coarse cereals, pulses, edible oils, vegetables, fruits, milk, meat, fish, eggs, sugar, spices, and salts. Among these items, rice, wheat flour, edible oils, milk, and salts occupy significant space in Indian diets across the country. Therefore, these 5 food items were selected for the purpose of the study. Besides, the Food Safety and Standards Authority of India categorized these food items for food fortification in India. Tables 3 and 4 presents monthly per capita intake of these food items. Table 3 refers to rural India, whereas Table 4 to urban India. There are 2 sources of availability of rice and wheat—open market and public distribution system (PDS). Therefore, source-wise estimates of food intake for the above items are presented in both the tables. Figures presented in both tables show that wheat is relatively consumed more in the Northern (ie, Punjab, Haryana, Uttar Pradesh, etc) and the Central (ie, Rajasthan and Madhya Pradesh) parts of India, while people located in Eastern (ie, Assam, Odisha, West Bengal, etc) and Southern (ie, Andhra Pradesh, Kerala, Tamil Nadu, etc) parts of the country have more preferences toward rice consumption than consumption of products based on wheat. Consumers from the Western part of India—mainly Gujrat and Maharashtra—prefer wheat as staple food. More interesting, there is no difference in food preferences between rural and urban India, and it is observed true across each part of the country.
Monthly per Capita Intake of Selected Food Items in Rural India During 2011-12.a
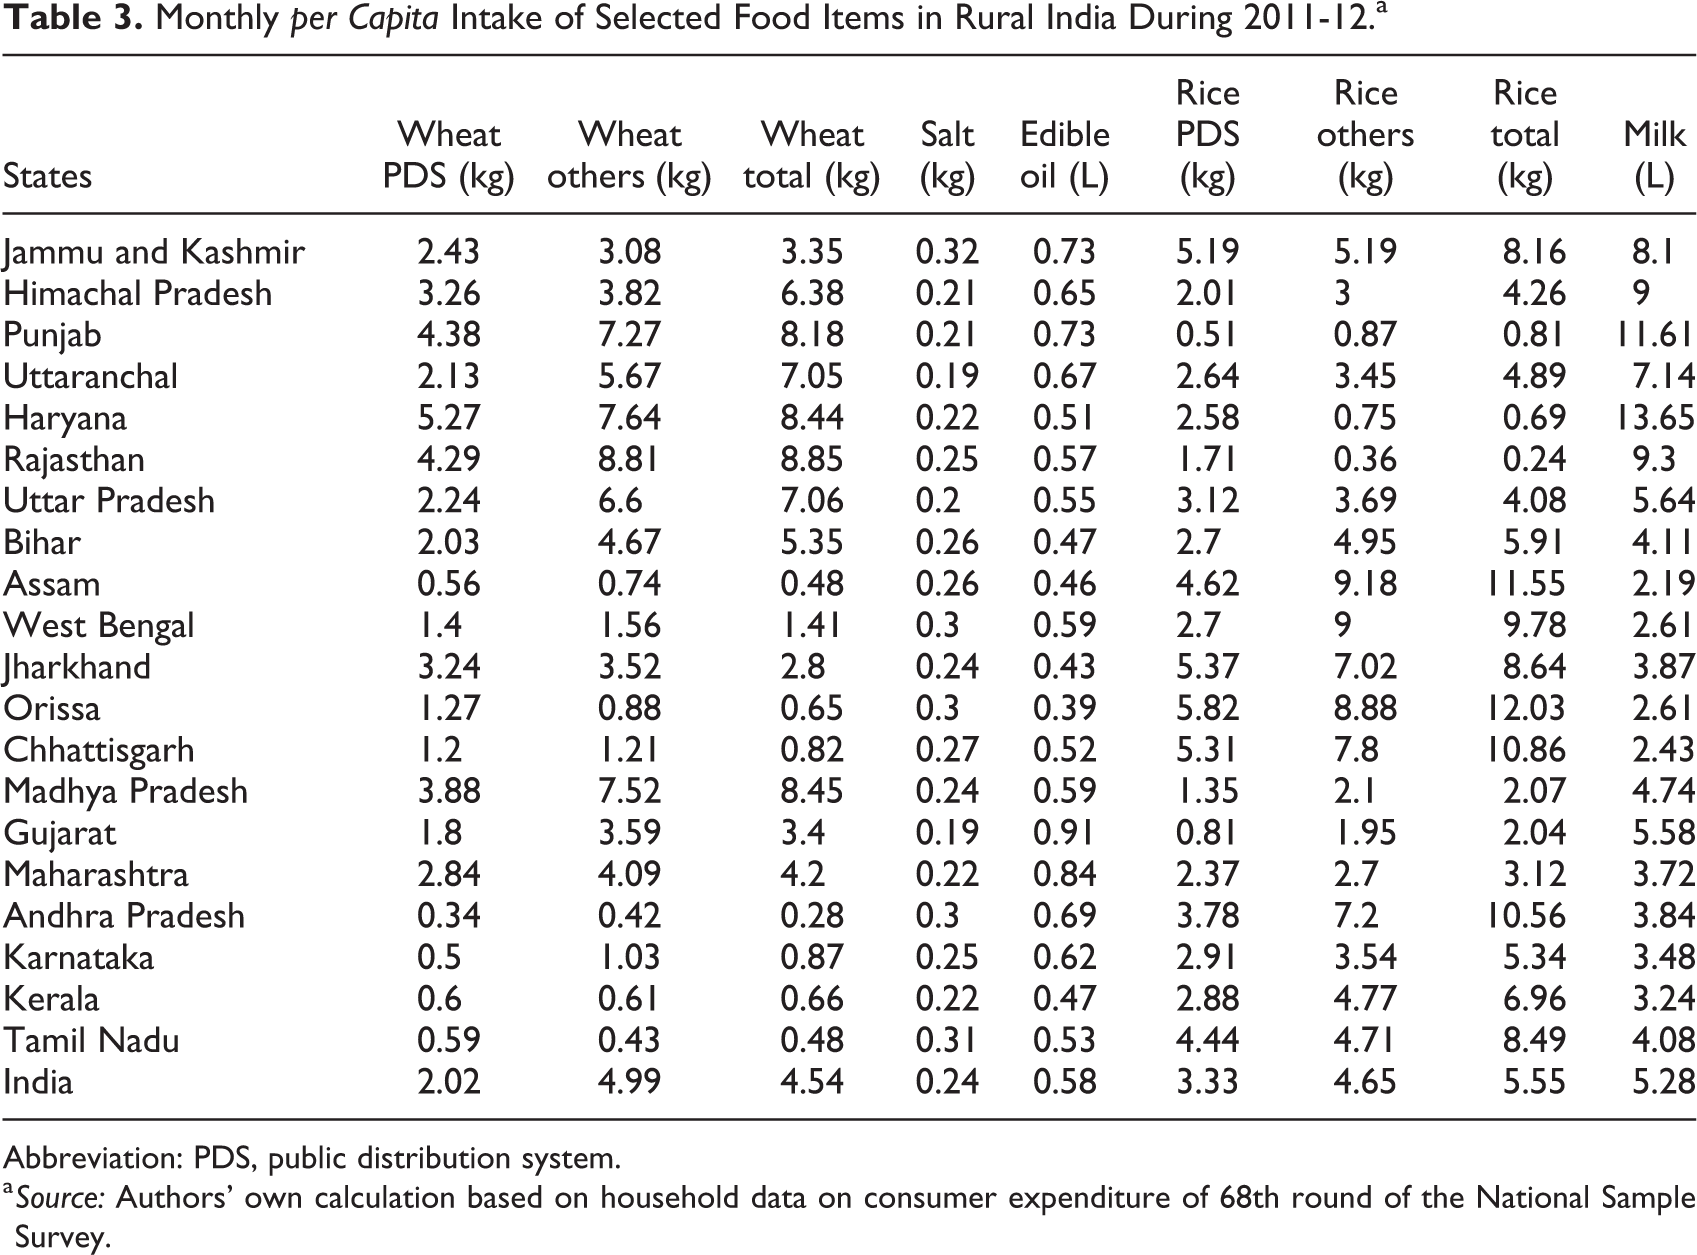
Abbreviation: PDS, public distribution system.
a Source: Authors’ own calculation based on household data on consumer expenditure of 68th round of the National Sample Survey.
Monthly per Capita Intake of Selected Food Items in Urban India During 2011-12.a
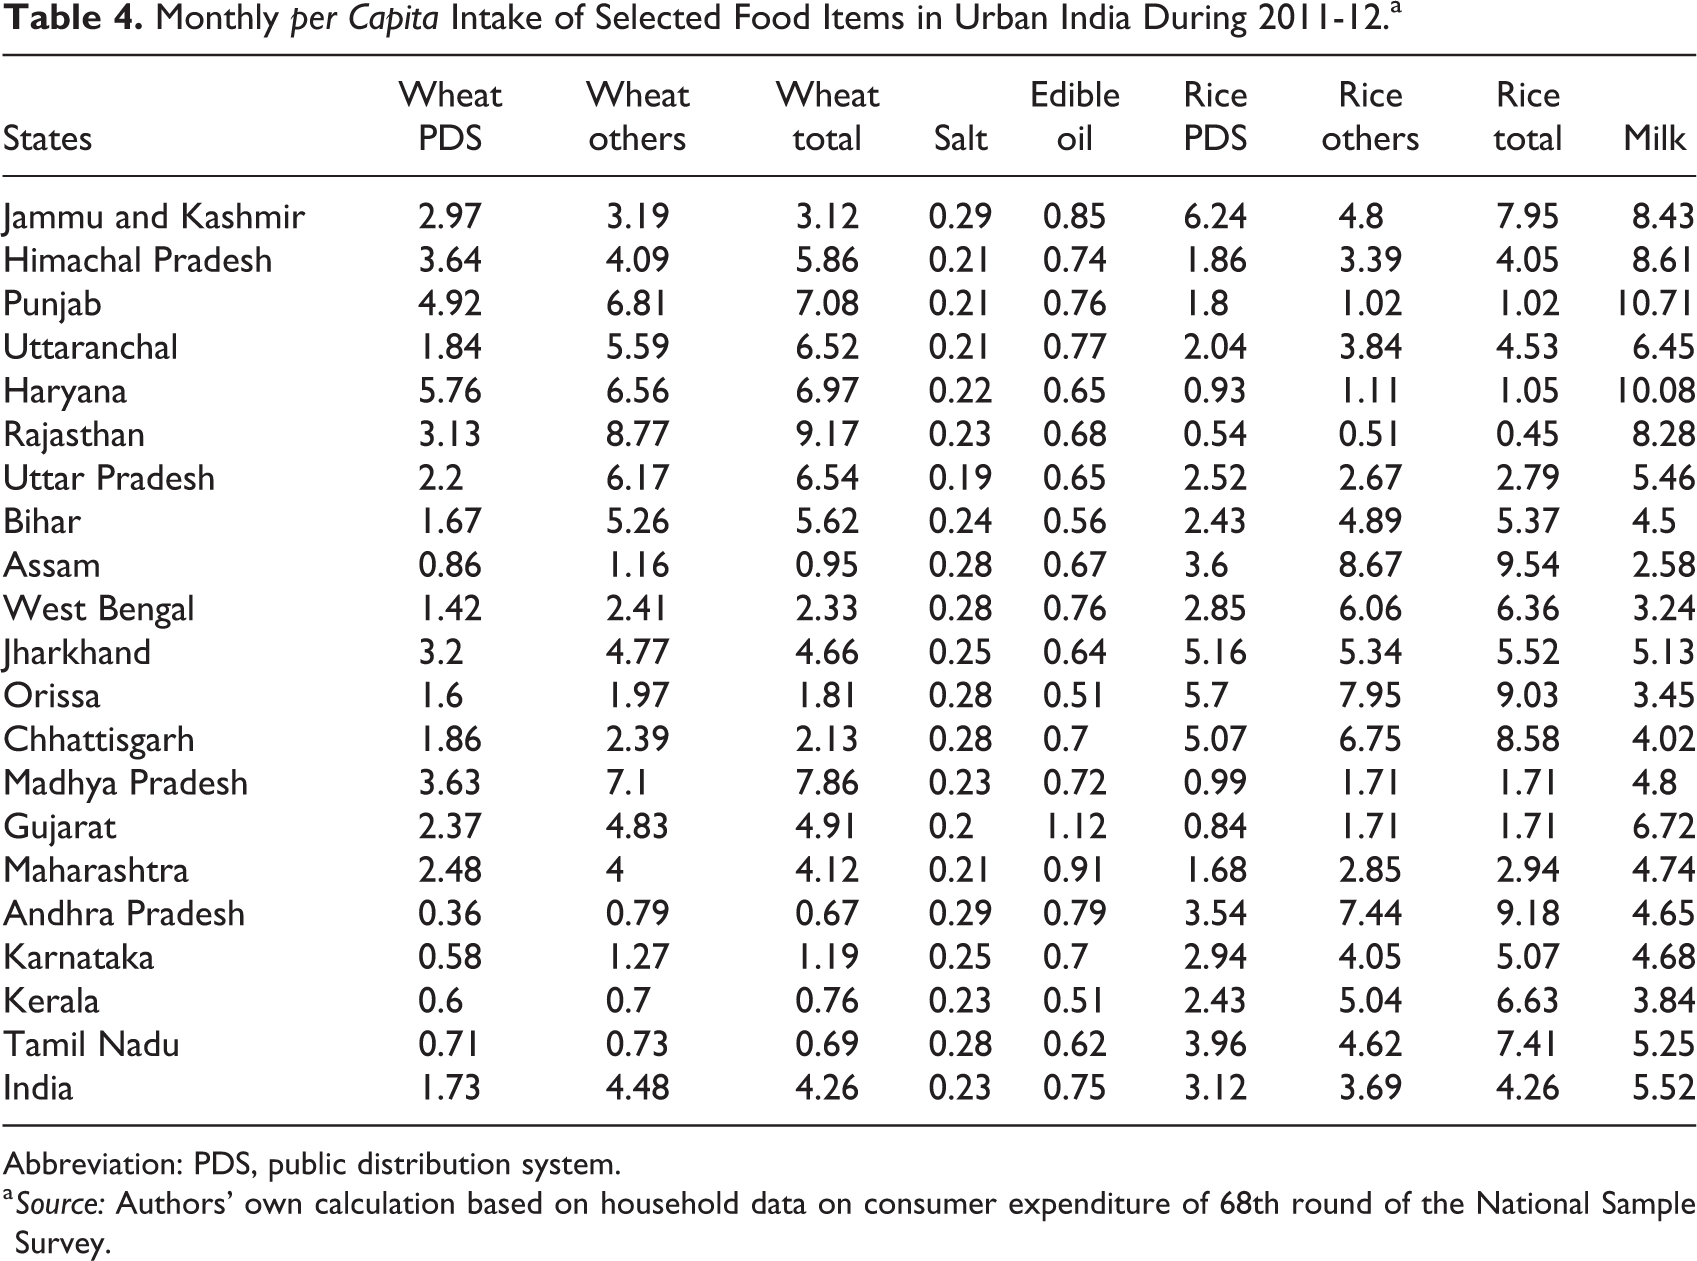
Abbreviation: PDS, public distribution system.
a Source: Authors’ own calculation based on household data on consumer expenditure of 68th round of the National Sample Survey.
Milk intake is observed at about 5.3 and 5.5 L per person per month for rural and urban sectors of India, respectively. Milk intake is observed much higher in Haryana, Punjab, and Rajasthan than other states. Intakes of salt and edible oil in Rural India are observed at about 0.24 kg and 0.58 L per person per month. These figures for the urban sector are observed at 0.23 kg and 0.75 L per person per month. No significant difference in consumption pattern of salt and edible is observed across the country, as is reflected from Tables 3 and 4.
Sources of Data
There are 2 important sources for price indexes in India—(1) the WPI, which is available at the commodity level from the Office of the Economic Adviser at the Indian Ministry of Commerce and Industry, and (2) the CPI (rural, urban, and combined), which is available at the commodity level from the Central Statistics Office in the Ministry of Statistics and Programme Implementation. In this article, we use WPI at aggregate India level because of its availability over a longer period. Though the base of the all-India level has been revised from 2004-05 to 2011-12, data on WPI for the base year 2004-05 have been used due to unavailability of data for the base year 2011-12 at the time of the present study initiated. The number of items included in the calculation of WPI for base 2004-05 is 676. Each item has its own weight which shows the importance of the item in the basket. Of all, 676 items are divided into 3 commodity groups—primary articles, fuel & power, and manufacturing products. The weight of each group is given in Figure 1.
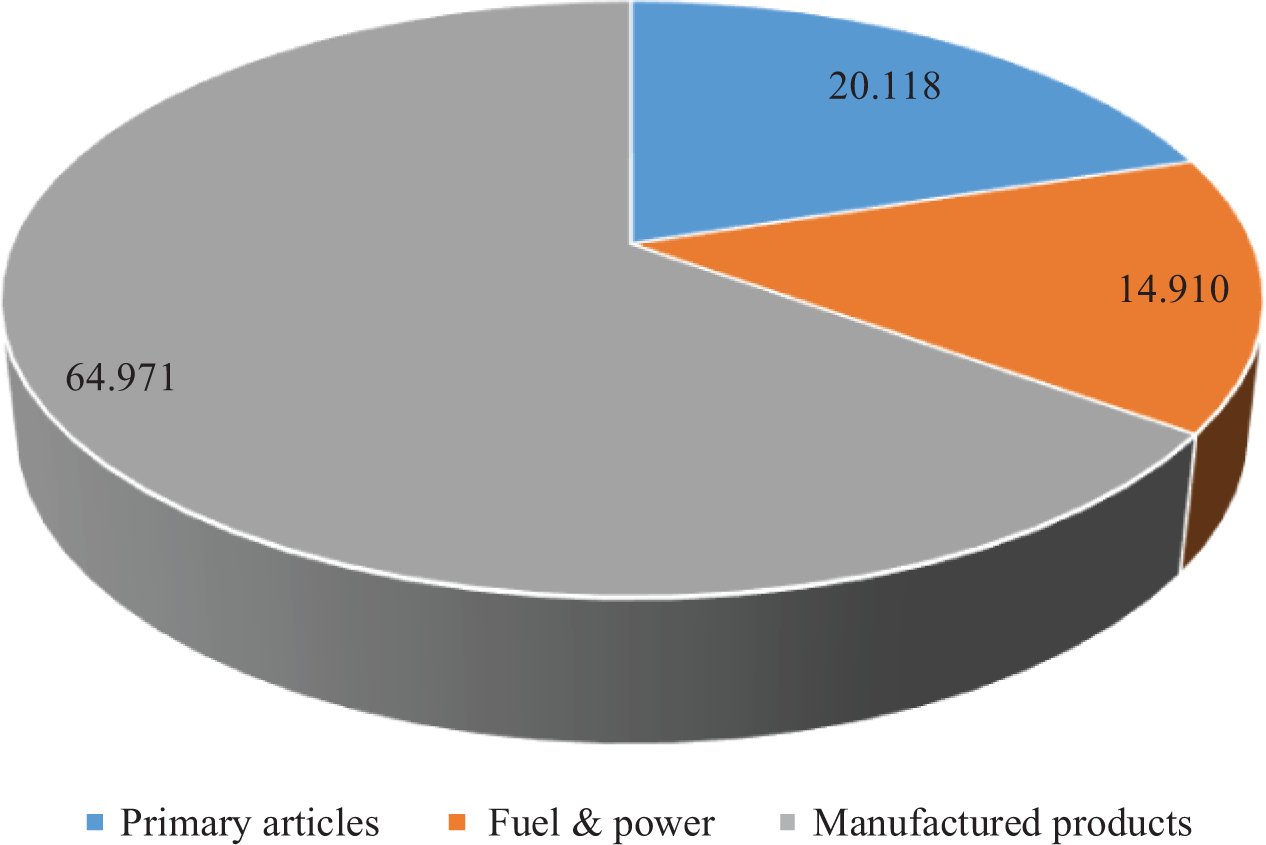
Weight structure of the major commodity groups. Note: Each value is given in percentage. Source: Office of the Economic Advisor, Department of Industrial Policy & Industry, Ministry of Commerce & Industry, Government of India.
To calculate the cost of fortification, 2 information are important—(1) the unit price of premixes and (2) recommended dosage of premixes required for the fortification of each chosen food item. The first information is collected from suppliers of premixes through a survey conducted in March 2017, whereas the second information is collected from the Food Safety and Standards Authority of India (see Table 5). Premix is the mixture of micronutrients used to fortify any food. Since different micronutrients at different quantities are recommended to be added to different food items, both dosage and nature of premix vary from item to item. Standards of micronutrients recommended for different food items are presented in Table 6.
Recommended Dosages and Average Price of Premixes.a
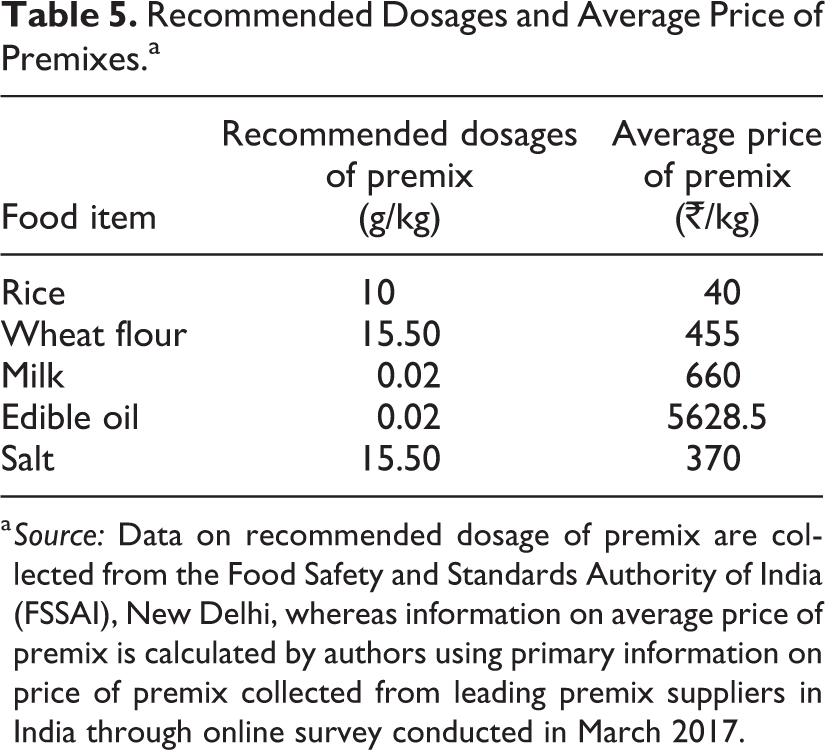
a Source: Data on recommended dosage of premix are collected from the Food Safety and Standards Authority of India (FSSAI), New Delhi, whereas information on average price of premix is calculated by authors using primary information on price of premix collected from leading premix suppliers in India through online survey conducted in March 2017.
Food Safety and Standards Authority of India Standards for Fortification of the Selected Food Items.a
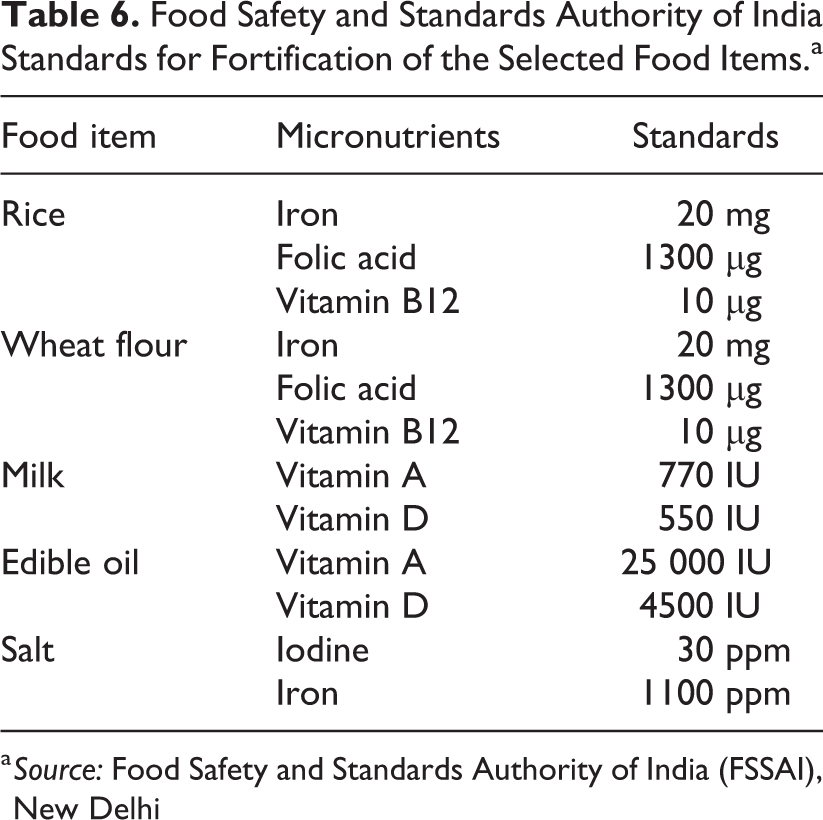
a Source: Food Safety and Standards Authority of India (FSSAI), New Delhi
Further, information on monthly per capita consumed quantity of food items and monthly per capita total consumption and food expenditure are used to accomplish the potential impact of fortification on households separately for both urban and rural sectors. These information are collected from unit level data provided by the 68th National Sample Survey round on Household Consumer Expenditure. In the 68th round, 2 types of schedule have been used—type 1 and type 2. The difference is related to reference periods. In the type 1 schedule, 2 reference periods have been used—of 30 days and 365 days. In the type 2 schedule, 3 reference periods have been used—of 7 days, 30 days, and 365 days. We use the type 1 schedule to ensure comparability between 61st and 68th rounds of data. The type 1 schedule surveyed 101 662 households, out of which 59 695 households were in rural areas and 41 967 households were in urban areas.
Results and Discussions
First, the contribution of broad commodity groups (food and nonfood) was estimated using monthly data on WPI for the period from 2006-07 to 2016-17. Results presented in Figure 2 show that nonfood group played a dominant role in overall inflation in India during the mentioned period except for 2 years 2009-10 and 2014-15. In both exceptional years, there was a food shortage in India due to bad weather conditions. The performance of agriculture was unsatisfactory in both the years, as is reflected from the facts that agriculture grew at the rate of 0.4% and −0.2% in 2009-10 and 2014-15, respectively. The nonfood group accounted for about 74% of India’s overall inflation, whereas only 26% of the country’s overall inflation was contributed by food group. Hence, one can infer that price change in the nonfood group has more effect on inflation in India.
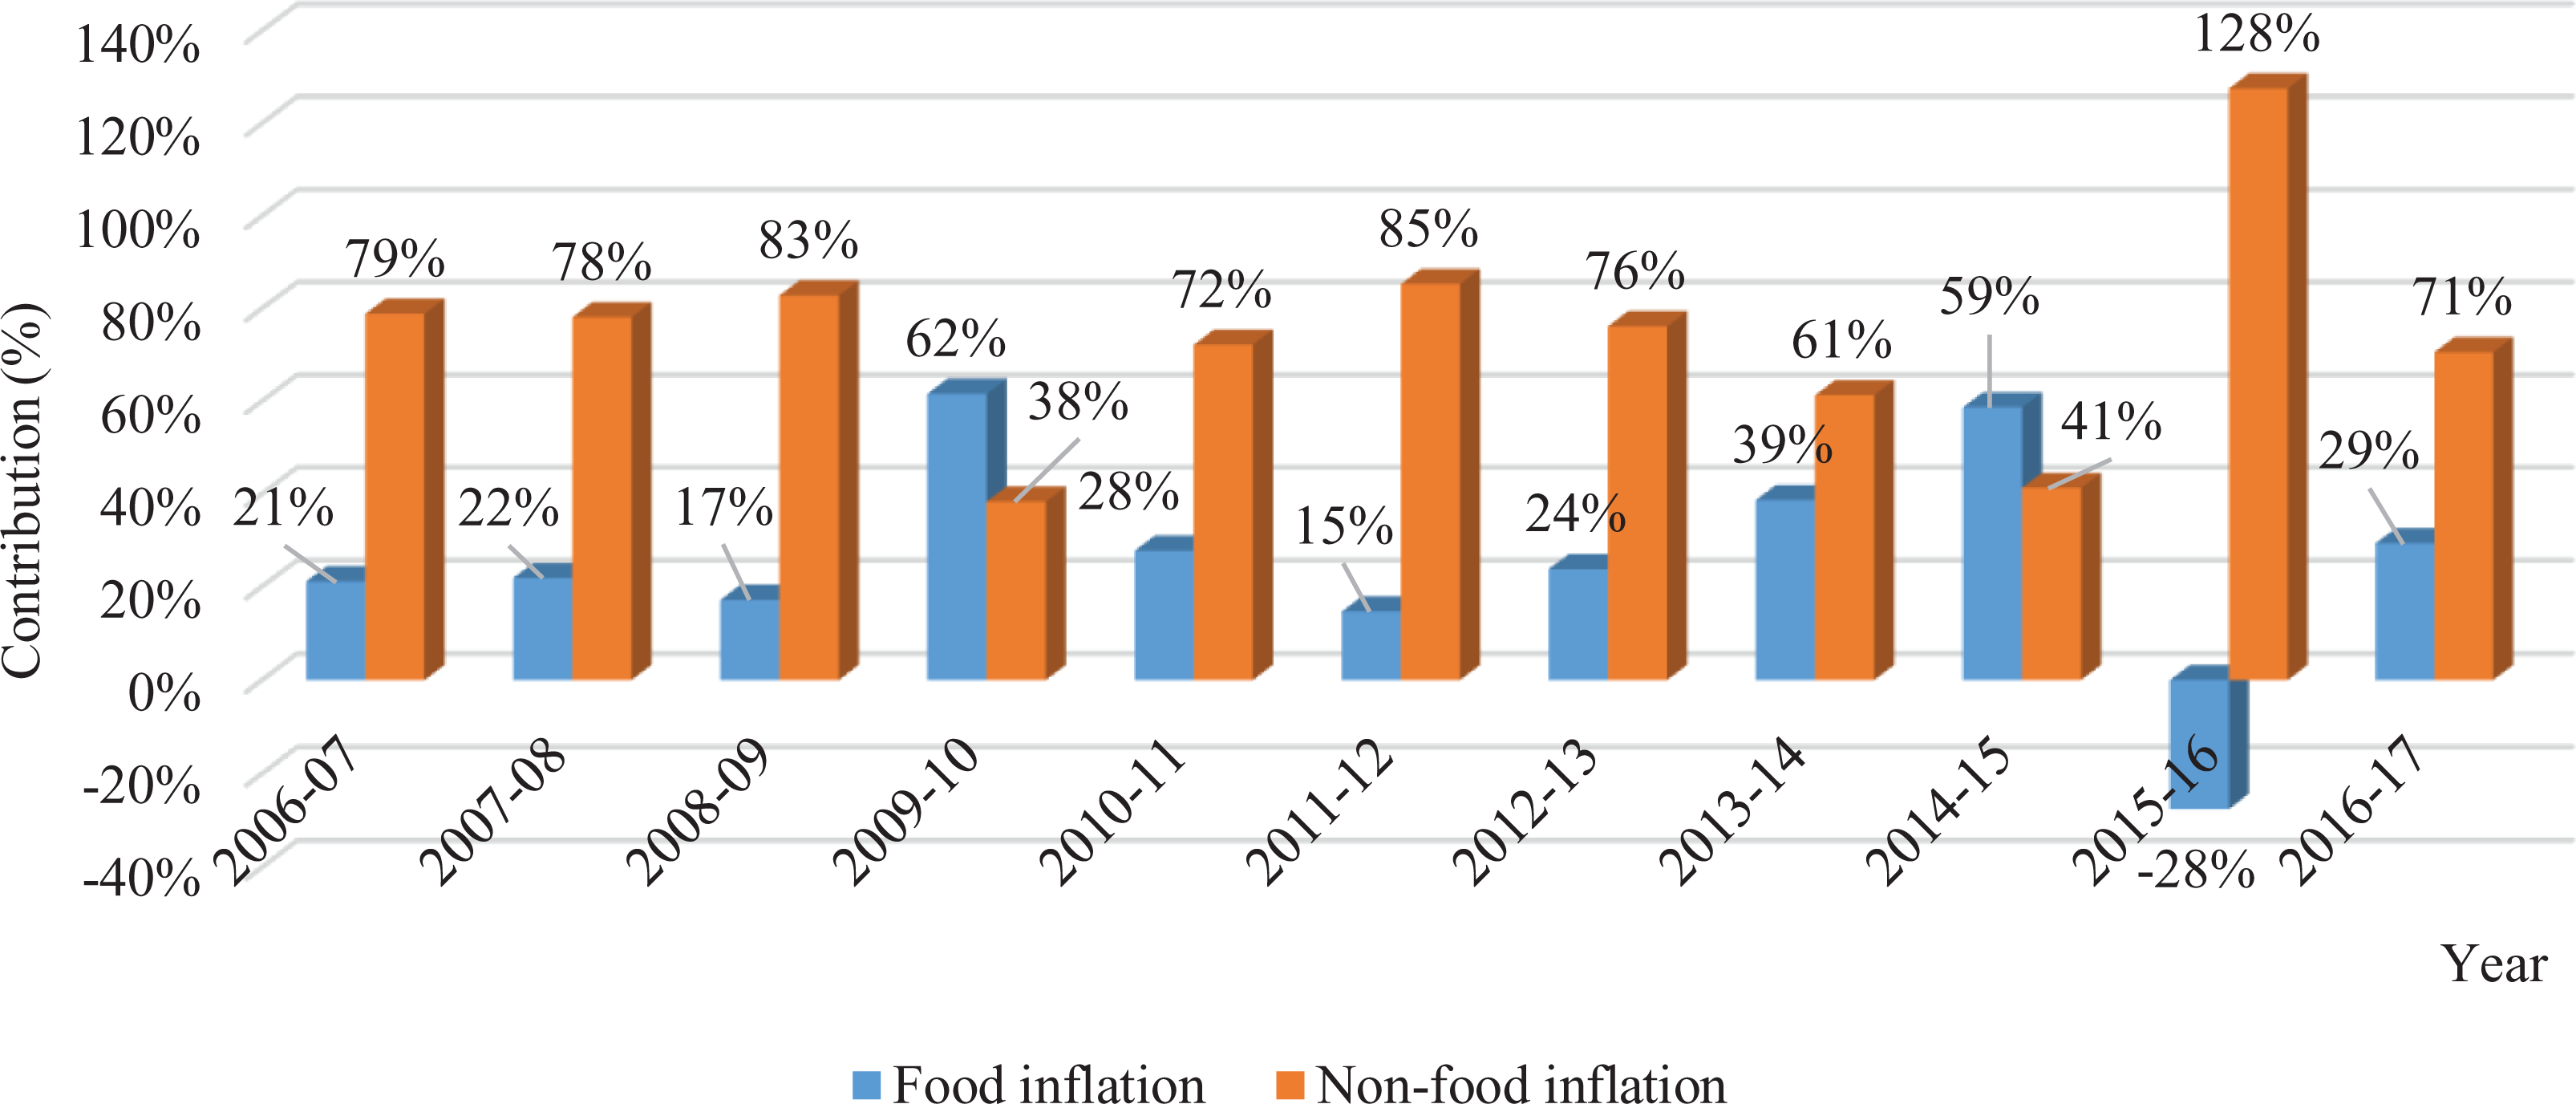
Contribution of food and nonfood group to overall inflation. Source: Authors’ own calculation using data collected from Office of the Economic Advisor, Department of Industrial Policy & Industry, Ministry of Commerce & Industry, Government of India.
Similarly, we assessed the contribution of the select food items to overall inflation using the same data set and period. These food items are rice, wheat flour, milk, edible oil, and salt. These 5 commodities together accounted for about 13% of the country’s overall inflation (Figure 3). Among these commodities, the largest contributors to overall inflation in India are milk and the least contributor is salt. The contribution of rice, wheat flour, and edible oil is about 3.6%, 1.6%, and 1.5%, respectively.
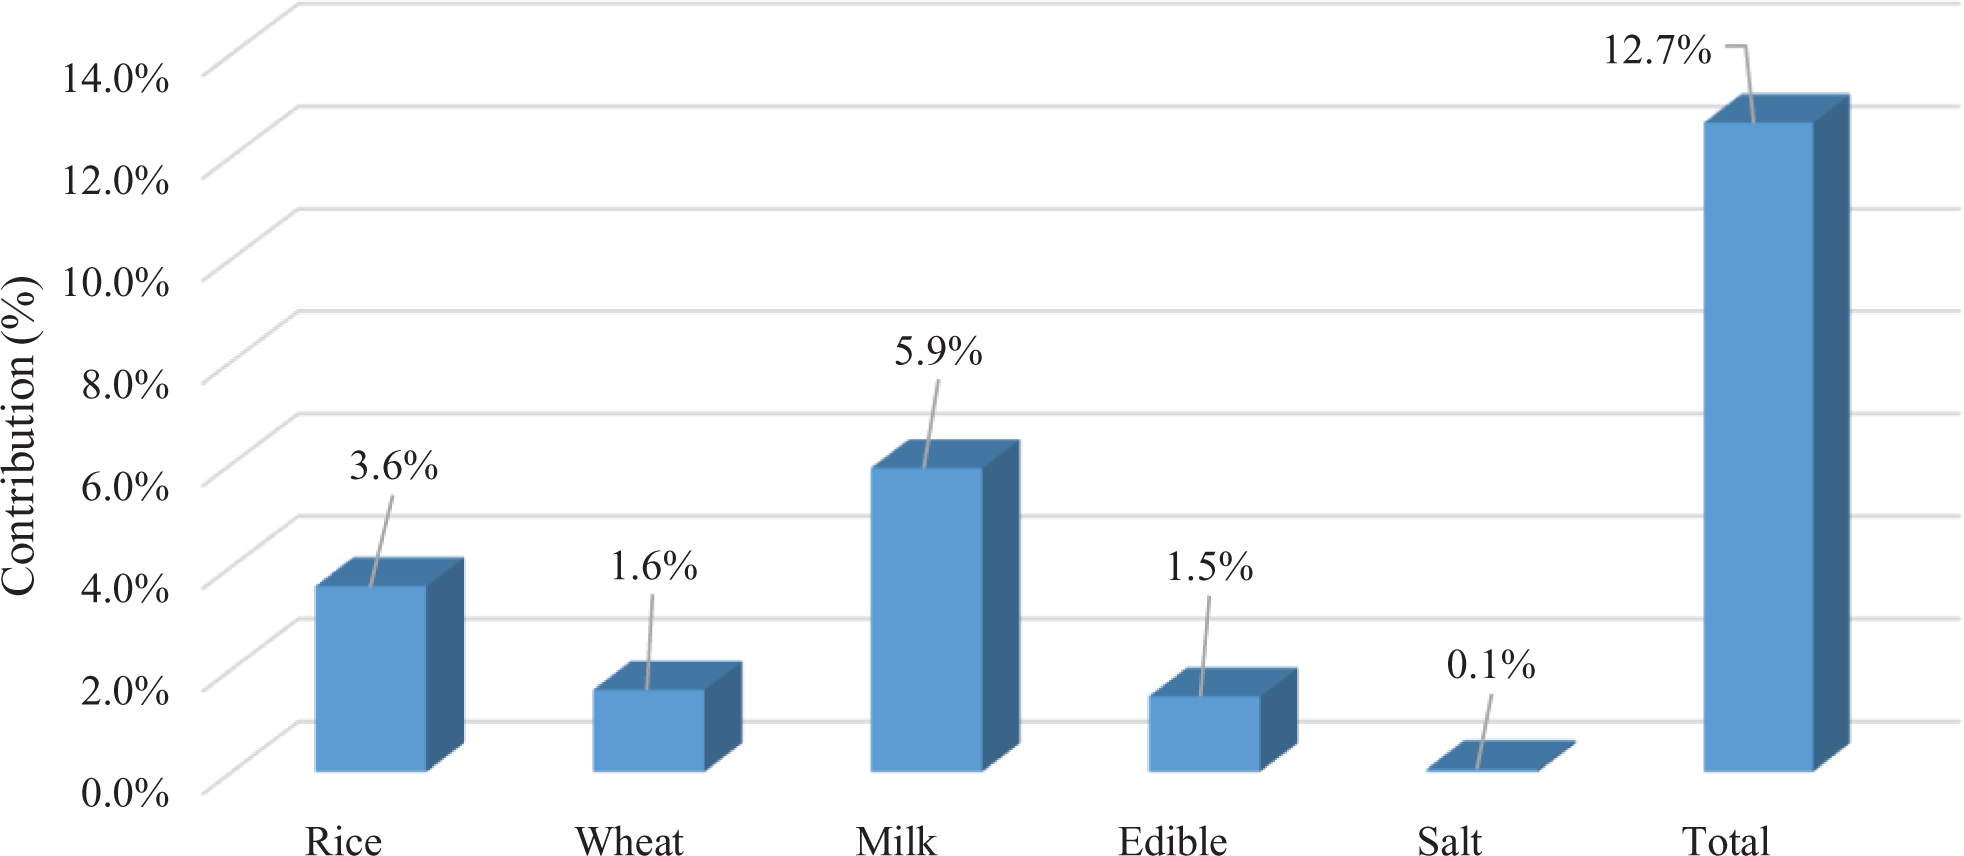
Contribution of the select food items to overall inflation. Source: Authors’ own calculation using data collected from Office of the Economic Advisor, Department of Industrial Policy & Industry, Ministry of Commerce & Industry, Government of India.
After calculating the contribution of the select commodities to overall inflation, cost of fortification and price change due to fortification were estimated. Estimates are presented in Table 7. There are 2 costs of fortification—fixed costs and variable costs—and the nature and intensity of both costs vary by product. Let us take the example of wheat flour. The most common way to fortify wheat flour is by using a feeder which adds premix to flour at predetermined rates in the flour production process. In addition, millers have to establish a laboratory for quality and standard check. Along with these fixed costs, millers have to buy premix regularly for adding to wheat flour. If commercial millers would have already made investments in both a feeder and a laboratory, procuring premix will raise their total variable cost, and they will pass on this additional monetary burden to consumers by increasing the prices of the fortified items to meet their total average costs.
Price Rise in the Selected Food Items Due to Fortification.a,b,c
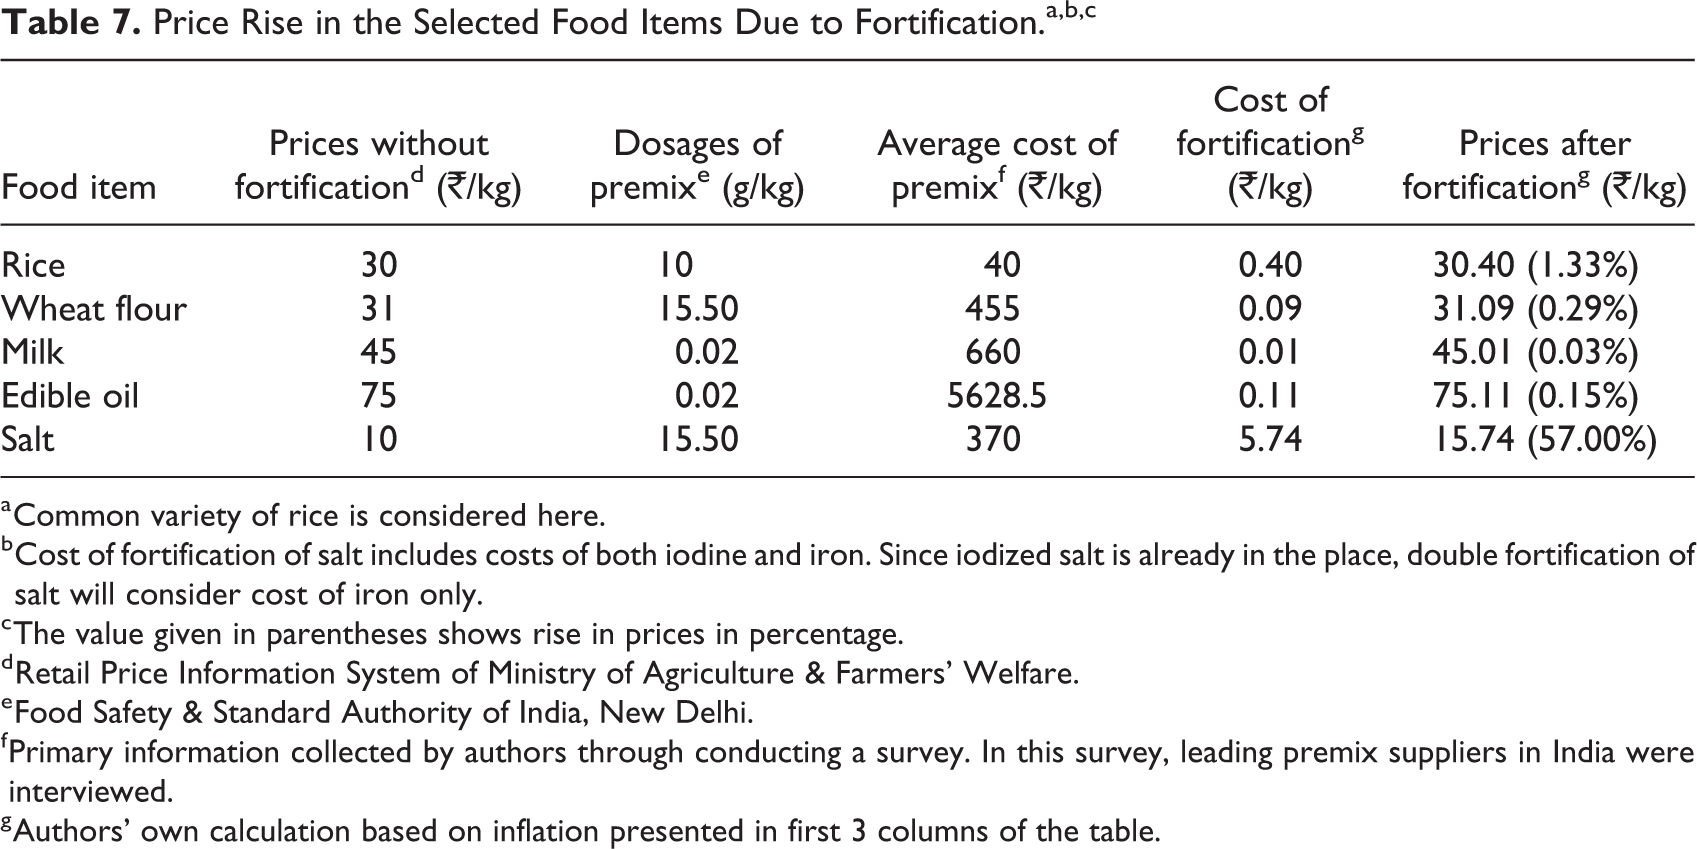
a Common variety of rice is considered here.
b Cost of fortification of salt includes costs of both iodine and iron. Since iodized salt is already in the place, double fortification of salt will consider cost of iron only.
c The value given in parentheses shows rise in prices in percentage.
d Retail Price Information System of Ministry of Agriculture & Farmers’ Welfare.
e Food Safety & Standard Authority of India, New Delhi.
f Primary information collected by authors through conducting a survey. In this survey, leading premix suppliers in India were interviewed.
g Authors’ own calculation based on inflation presented in first 3 columns of the table.
How would fortification change the retail prices of food items? To answer this question, we estimate the prices of fortified items by adding the cost of premix to the retail price of food items. In this calculation, we have taken recommended dosages into account. Comparing prices of selected food items with and without fortification, we noticed a rise in the retail price of about 57% for salt, about 1.33% for rice, about 0.29% for wheat flour, 0.15% for edible oil, and 0.03% for milk. There is significant price rise noticed in the case of salt. But, it should be noted that this price rise includes costs of fortification of both iodine and iron. Salt fortified with iodine is already mandatory in the country and hence available in the market. Its retail price is about ₹14.5/kg, suggesting that 79% of the above price rise in salt because of double fortification is accounted by iodine itself. It means retail price of salt will increase by 9% over the current level of the price if double fortification of salt is made mandatory.
Further, we attempted to capture the impact of the above price rises due to fortification on per capita household expenditure in both rural and urban sector of the country. It is estimated that there will be a very negligible increase in monthly per household expenditure on food items (Table 8). Increase in expenditures is found higher in the rural sector compared to the urban sector. This might be because of higher food intake per person in the rural sector than the urban sector. Similarly, lower income groups have a relatively higher burden than high-income groups.
Estimation of Monetary Burden of Fortification at Household Level.a,b
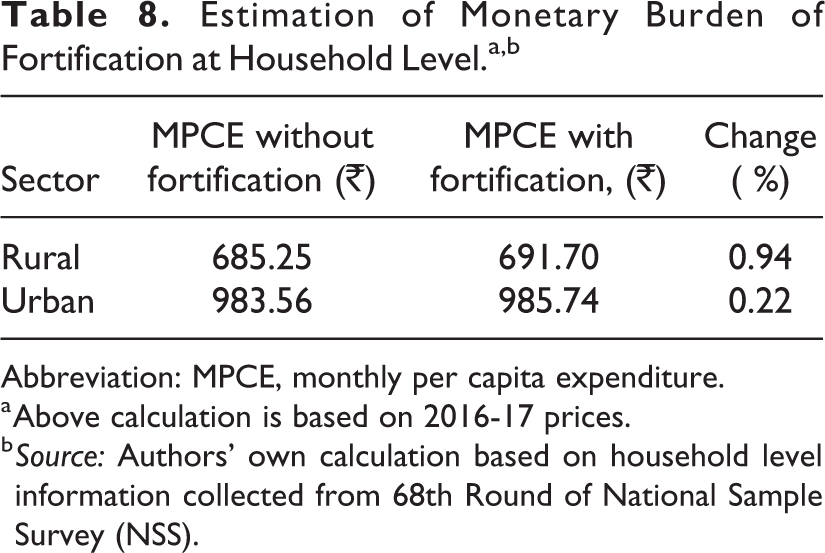
Abbreviation: MPCE, monthly per capita expenditure.
a Above calculation is based on 2016-17 prices.
b Source: Authors’ own calculation based on household level information collected from 68th Round of National Sample Survey (NSS).
Finally, the impact on inflation was examined by considering all 3 effects, namely base effect, weight effect, and inflation effect. Results are presented in Table 9. It shows that fortification of the 5 select commodities will lead to an increase in inflation by 2.2%. It means that if inflation is at 5% without fortification, it will increase to 5.11% only with mandatory fortification. Hence, one can conclude that there will be negligible effect on inflation in India if the Government of India goes for mandatory fortification of rice, wheat flour, edible oil, milk, and salt.
Item-Wise Impact of Food Fortification on Inflation.a
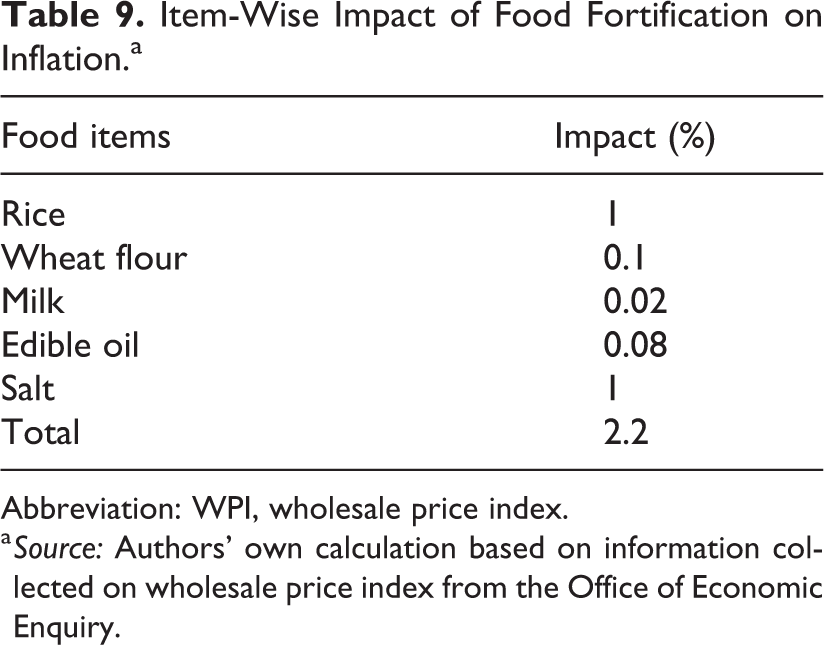
Abbreviation: WPI, wholesale price index.
a Source: Authors’ own calculation based on information collected on wholesale price index from the Office of Economic Enquiry.
Our estimates are in tune with other international studies conducted in different countries. A study conducted by World Bank in 2011 estimated the revised retail price of rice due to fortification to increase by 2% to 4% in China, 1.8% in the Philippines, and 1.7% in Costa Rica (Table 10). Another study conducted in Kazakhstan estimates the impact of wheat flour fortification on households (Table 11). This study by Ghauri 18 finds the increased cost due to fortification for different member group households and suggest the costs of wheat flour to increase by US$0.23 for 6-member household and this cost will vary to US$0.39 for 10 member households.
Estimated Revised Retail Price Due to Fortification: Evidences From Other Countries.a
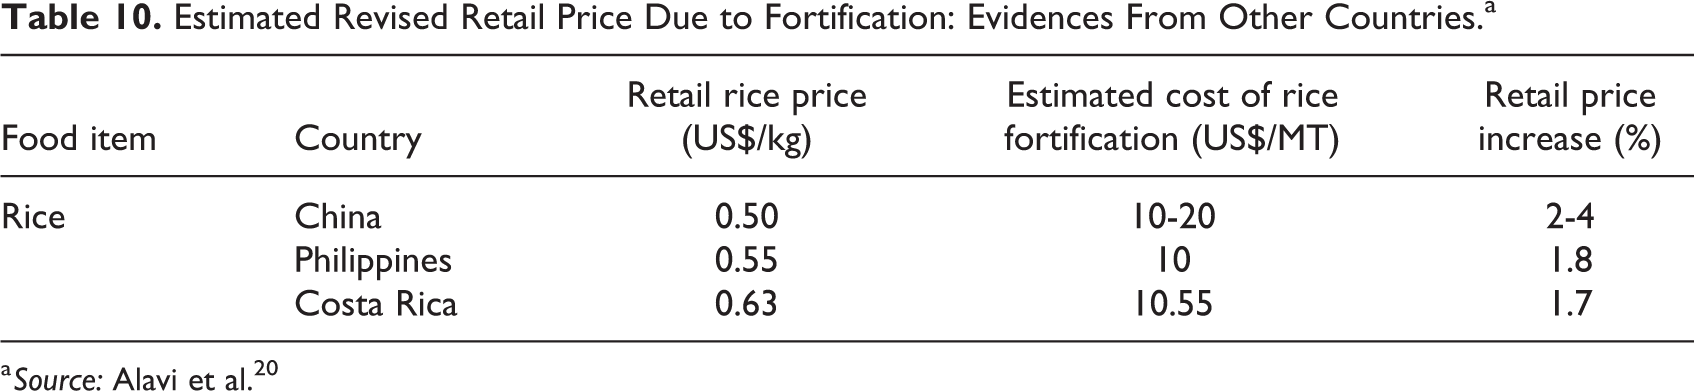
a Source: Alavi et al. 20
Potential Impact of Fortification on Households: Evidence From Kazakhstan.a
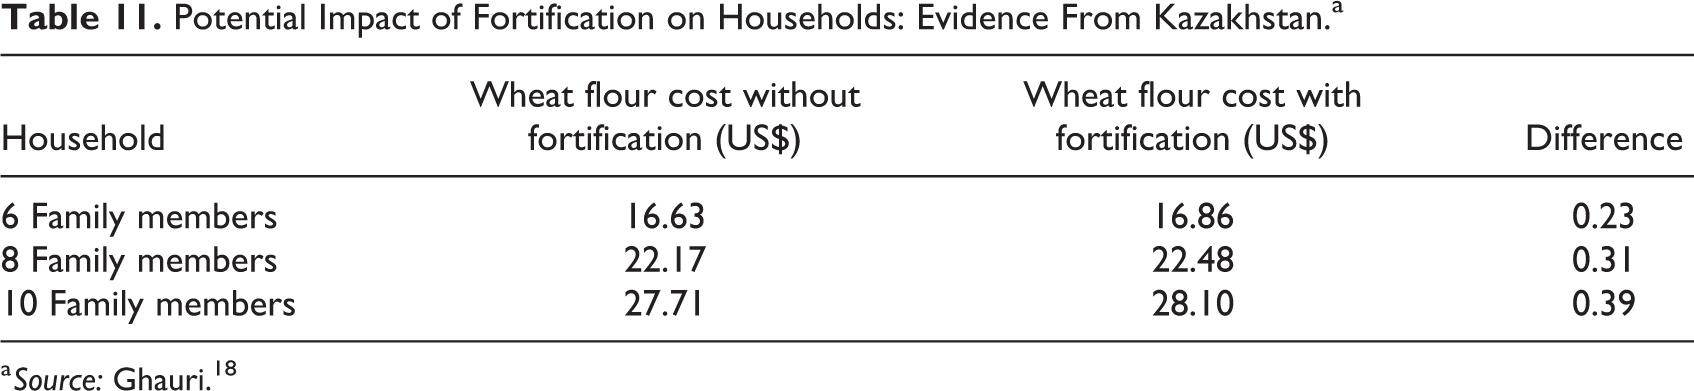
a Source: Ghauri. 18
There are studies which assess the cost–benefit analysis of fortification of different food items (Table 12). The study conducted in Indonesia (Bagriansky, 2010) 19 on wheat flour fortification with iron and folic acid concludes that every US$1 of estimated costs there is a return of US$8 in this program. Another study on fortification with folic acid finds a positive impact on NTD in newborns. Food Standard Australia and New Zealand conducted a study on wheat flour fortification with folic acid in 2006 and observed that at fortification doses of 200 µg folic acid per 100 g of bread-making flour, the benefits of mandatory fortification of all-bread making flour with folic acid outweigh the costs in both Australia and New Zealand. The study by Ghauri 18 in Kazakhstan on wheat flour fortification with iron and folic acid concludes that a large-scale wheat flour fortification intervention could generate 28.25 times more benefit than it costs.
Cost–Benefit Analysis of Fortification: Evidences From Other Countries.
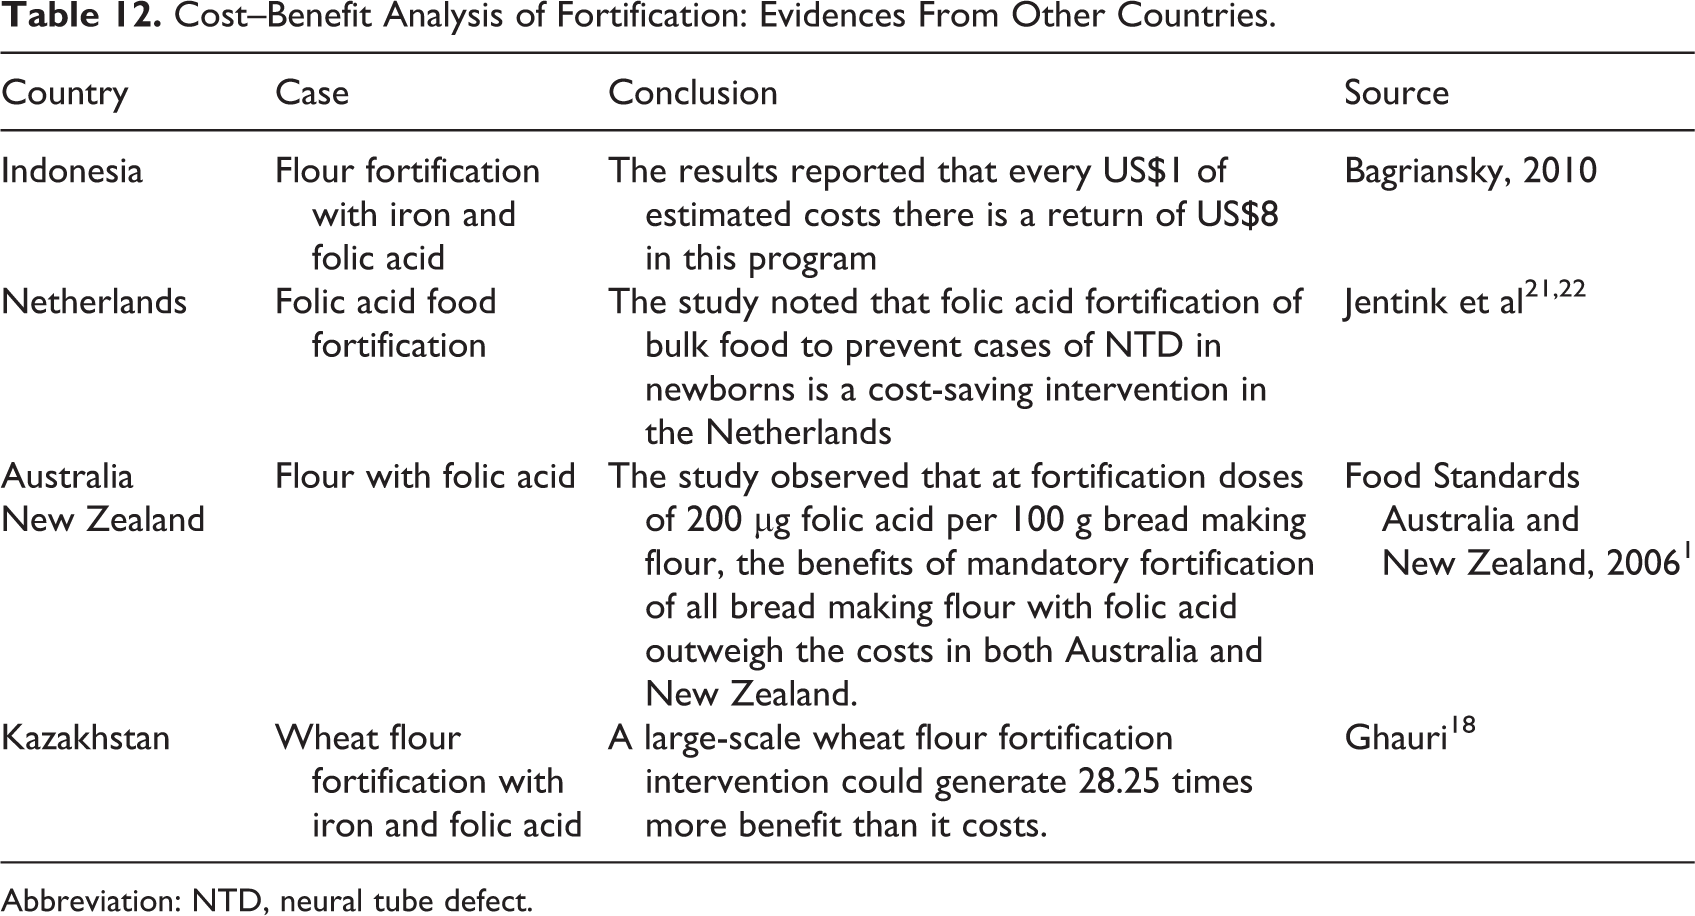
Abbreviation: NTD, neural tube defect.
Conclusions
Food fortification of staple food is an effective strategy to address malnutrition problems, particularly micronutrient deficiencies. In this article, an attempt has been made to see if mandatory food fortification will increase inflation in India by focusing on 5 major food items (rice, wheat flour, milk, edible oil, and salt). These food items constitute a significant space in diets in India. Decomposition approach has been followed in this study to measure the inflationary impact of food fortification. The contribution of each of the above select commodities to inflation was assessed by decomposing each commodity’s contribution into weight effect, base effect, and inflation effect.
Results suggest that mandatory food fortification has a very negligible effect on inflation, suggesting that mandatory food fortification in India will not increase inflation. Further, the study has also observed that there will be a minimal increase in monthly per capita expenditure in both rural and urban sectors of India.
Through adopting mandatory food fortification in India will not have an impact on inflation, there would be 2 major challenges. One, a large section of Indian population consumes food items grown in their fields, especially agricultural households. Apart from agricultural households, a major chunk of the population consumes food items processed locally. For example, wheat flour—the significant share of households in India consume wheat flour milled at the local level. Two, consumers in India are still unaware of about fortified food items and their benefits. Therefore, the government can first start food fortification of staple food with safety nets programs like National Food Security Act (NFSA), Mid Day Meal Scheme (MDM), Integrated Child Development Services (ICDS), and so on focusing on the most vulnerable groups of the society and then, scale-up at large scale.
Footnotes
Declaration of Conflicting Interests
The author(s) declared no potential conflicts of interest with respect to the research, authorship, and/or publication of this article.
Funding
The author(s) received no financial support for the research, authorship, and/or publication of this article.