
Abstract
Background:
Preschool child anthropometric status has been assessed nationally in Nepal since 1975, with semi-decadal surveys since 1996, plus several recent, short-interval surveys to track progress toward achieving a World Health Assembly (WHA) goal to reduce stunting to 24% by 2025.
Objective:
We report prevalence of preschool child stunting and wasting from a national survey in 2016 and place findings into the context of national trends and alignment for Nepal to attain its WHA 2025 goal.
Methods:
A representative, midyear Policy and Science for Health, Agriculture and Nutrition (PoSHAN) survey was conducted in 2016 on 5479 children <60 months in 4051 households in 21 village development committees. Child weight and height were measured, and sociodemographic factors were assessed. Data from previous surveys (Nepal Demographic Health Surveys, PoSHAN) were also acquired, and rates of stunting (<−2 height-for-age z score) and wasting (<−2 weight-for-height z score) were compared to current World Health Organization standards. Trends were expressed as average annual rates of reduction (AARR).
Results:
Nationally, in 2016, 34.1% of preschoolers were stunted and 13.7% wasted. Stunting was highest in the Mountains (40.6%) and wasting highest in the Tarai (18.9%). Trend analysis revealed a steady decline (3.8% AARR) in stunting from 2001 to 2013, with virtually no decline from 2013 to 2016. Wasting has been continually high and variable, at ≥8%, since 1975.
Conclusions:
Following a steady decline in prevalence, preschool child stunting has plateaued at ∼35% in Nepal, while wasting has changed little over time, offering the opportunity to inform, reassess, and adjust, as needed, efforts to reach WHA 2025 goals.
Introduction
Early childhood undernutrition increases risks of morbidity and mortality 1 and is associated with lowered earning potential later in life. 2,3 Globally, preschool (children <5 years) undernutrition has declined over the past 2 decades, yet the burden remains high in South Asia, where while making progress, several countries are off track for reaching their World Health Assembly (WHA) target of a 40% reduction of their 2012 prevalence rates of stunting (height-for-age below −2 z) by 2025. 4 Within this region, Nepal is a country long burdened by high rates of early childhood stunting, evident by a national prevalence of 52% in 1975 5 and 56.5% in 2001, 6 among a period racked by insurrection and severe economic stress. 7,8 During the ensuing decade from 2001 to 2011, however, the Nepal Demographic Health Surveys (NDHS) revealed an annual decline in stunting of 1.6 percentage points per year, with the prevalence falling from 56.5% to 40.5%. 6,9,10 This was one of the steepest declines documented by the Demographic Health Surveys (DHS) in any single country and has been attributed to economic recovery with asset accumulation, increased birth size, and maternal education that may have led to improved child care. 9 In the same decade, the prevalence of underweight (weight-for-age below −2 z) declined from 48.3% to 28.8%, apparently driven by improved linear growth, as the prevalence of wasting (weight-for-height below −2 z) remained virtually unchanged, from 11.4% in 2001 to 10.9% in 2011. 6,10
From 2013 to 2016, the US Agency for International Development-funded Feed the Future Innovation Lab for Nutrition, in collaboration with local research organizations, conducted 4 nationally representative, same season and site surveys. These Policy and Science for Health, Agriculture and Nutrition (PoSHAN) surveys were designed to assess and follow yearly agricultural productivity, household socioeconomic status, external program participation, food security, maternal and child diet and nutritional status, and child growth patterns, with a goal of identifying potentially intervenable practices across the country’s food system that could improve future food security. 11 The initial PoSHAN survey, conducted in mid-2013, suggested that preschool child stunting had continued to decline from 40.5% 10 in 2011 to 35.5%. 12 However, a subsequent PoSHAN survey in 2014 revealed a slight increase in the prevalence of stunting to 37.4%. 12 Wasting prevalences of 17.7% and 16.3% were reported in 2013 and 2014, respectively. 12 Thereafter, major national shocks were encountered in 2015 in the forms of a devastating earthquake and economic blockade on the border with India. 13 -16
Many countries rely on large, periodic, national surveys such as the semi-decadal DHS to assess prevalence and gauge progress toward reaching nutritional goals, especially among children and mothers. 4,17 These surveys, typically conducted every 5 years, have advantages of being representative at national and subnational levels and standardized in their procedures and questionnaires that allow comparability within and across countries over time. Limitations of this approach include a lack of granularity in the trends between surveys and estimates that may vary due to differences in the length of data collection periods that can span across multiple seasons. This leaves countries without sufficient data to gauge shorter term progress as 2025 looms nearer. Short interval national surveys could have an important role in filling information gaps in countries with natural disasters 18 and sociopolitical 19 or economic turbulence that may influence nutritional status, particularly when seeking to assess intermediate population responses to policies and programs that allow for timely adjustments and goal setting.
As one of the exemplar countries that underwent a remarkable decline in stunting, interest is high in not only documenting the trend but also examining factors that are driving it, 9,20 with the goal of replicating similar declines in other settings and continuing a sustained progress in Nepal. However, what is less clear is whether the decline in stunting may have started before 2001 or how it has continued over the past 5 years since 2011, particularly in light of the 2 powerful shocks experienced in 2015. Furthermore, little is known about the annual fluctuations in undernutrition rates, between benchmarks set by NDHS at 5-year intervals, that help us explore the nuances of the changing burden and its risk factors to inform the design of responsive policies and programs. Thus, in this report, we summarize the findings from the PoSHAN survey in 2016, reflecting preschool child nutritional status nationally and by region a year after the earthquake in Nepal. We further place the 2016 survey findings in the context of historical national trends in preschool child nutritional status since 1975 and juxtapose them with other recent PoSHAN and NDHS surveys to examine long- and short-term stability and changes as an approach to informing the pursuit of WHA 2025 goals.
Methods
Study Design
We report in this article the design, procedures, and findings of the 2016 PoSHAN survey, which was the last in a series of nationally representative, midyear, same-site, mixed-longitudinal surveys with proportionate-to-population samples in the Mountains and Hills, and Tarai of Nepal that started in mid-2013. Although planned for mid-2015, sites in the Hills and Mountains were not surveyed in the aftermath of an earthquake that struck these regions of Nepal in April and May 2015, leaving only the sites representing the southern plains of Tarai to be surveyed that year. The design and methods of this repeat survey 11 and findings from 2013 and 2014 are reported elsewhere. 12
In brief, the PoSHAN sample was generated using a 2-stage approach representing the agro-ecological zones of the Mountains, Hills, and Tarai. Districts with their subdistrict units, or village development committees (VDCs), were first stratified by zone and listed contiguously from west to east. 11,12 Within each zone, 7 VDCs from unique districts were selected by systematic sampling following a random start to provide a total of 21 VDCs in the national sample. Within each VDC, 3 of 9 administrative wards (secondary sampling unit) were systematically drawn from each VDC following a random start, yielding a total of 63 study wards (clusters). Each survey year, the same 63 wards were visited, and all households enumerated to enroll those with children <60 months of age or households of recently married (ie, within the past 2 years) but childless women following signed consent. Households remained eligible to be assessed in each subsequent survey provided they remained resident in study wards and previously assessed children remained ≤72 months of age. For each survey, the same standardized field protocols were followed to assess ward infrastructure, local market food availability and prices, household agricultural productivity, socioeconomic status, food security, and child–mother nutritional status. 11,12
Twenty-one field teams, 1 per VDC field site, each consisting of a supervisor and 3 enumerators, were trained, standardized, and supervised through local field research agencies (New ERA and Nepali Technical Assistance Group, Kathmandu, Nepal). Staff were trained on mapping, conducting informed consent, interviewing, anthropometry, paper forms checking, and collation and transmittal to a central data entry center in Kathmandu. Field teams were deployed from June to September, corresponding to the monsoon season. Supine length was measured to the nearest 0.1 cm in infants 0 to 23 months and standing height to the same precision in children 24 to 59 months using a Shorr extendable height–length board (Weight & Measure, LLC, Olney, Maryland). Median values of 3 readings for length or height were recorded and used in all analyses. Weight was measured to the nearest 100 g on digital scales (SECA Scales, Columbia, Maryland) tared to zero.
Written informed consent was obtained from heads of household and, for households with eligible children, from mothers or caregivers of children ≤72 months prior to assessment. Ethical approval for each PoSHAN survey was obtained from the Nepal Health Research Council (NHRC), an autonomous body under the Ministry of Health and Population of the Government of Nepal, and the Institutional Review Board at the Johns Hopkins Bloomberg School of Public Health, Baltimore, Maryland.
To explore time trends in the prevalence of stunting, we acquired and analyzed anthropometric and auxiliary data from ICF International (Rockville, Maryland) 21 for NDHS for the years 1996, 2001, 2006, 2011, and 2016. The NDHS has collected anthropometric measurements for children 0 to 59 months of age since 2001, while the 1996 survey, also known as the Nepal Family Health Survey, restricted measurements to 0 to 35 months of age. These cross-sectional surveys utilized a multistage, stratified, cluster sampling design to generate nationally and subnationally representative samples, each of which is documented to have been approved by the NHRC and an ICF International Institutional Review Board. 6,10,22 -24 In the time-trend analysis, we also included findings from the Nepal Nutrition Status Survey of 1975 conducted by His Majesty’s Government of Nepal with the US Center for Disease Control and Prevention, a proportionate-to-population survey conducted among 6516 children aged 6 to 71 months living in rural areas, described elsewhere. 5
Indicators and Statistical Analysis
As in previous PoSHAN surveys, 11,12 a wealth index for the year 2016 was generated by principal component analysis 25 of data collected on assets owned, quality of housing, and the home environment, which were then stratified into quintiles of socioeconomic status. A Household Food Insecurity Access Scale, 26 comprising standardized questions about a respondent’s perceptions and experiences related to the household’s food insecurity during the past 30 days, was used to categorize households as either food secure or into one of 3 strata of mild, moderate, or severe food insecurity.
Height/length and weight measures of children younger than 5 years were converted to z scores of height-for-age (HAZ), weight-for-height (WHZ), and weight-for-age (WAZ) using the World Health Organization (WHO) growth standards. 27 Cutoffs of <−2 z scores of HAZ, WHZ, and WAZ were applied to define stunting, wasting, and underweight, respectively, and estimate national prevalence for children <60 and <36 months for PoSHAN and NDHS surveys. Robust estimation of standard errors was used to generate the confidence intervals that accounted for clustering by VDC in the PoSHAN analyses, and weighted estimates were calculated for NDHS. Average national and zonal anthropometric scores and prevalence of undernutrition within levels of wealth quintiles, gender, household food insecurity, and age categories of children were further estimated using the 2016 PoSHAN sample. The WHZ scores below −3 were also calculated to assess severe acute malnutrition and WHZ >1 to assess children who were at the risk of becoming overweight. Scores beyond the exclusion ranges of −6 > HAZ > 6, −5 > WHZ > 5, and −6 > WAZ > 5, were excluded from all analyses. Logistic and linear regressions with robust estimation of standard errors to adjust for clustering were conducted to test for statistical significance.
The Nepal Nutrition Status Survey conducted in the mid-1970s defined preschool child wasting as a WHZ under 80% of the National Academy of Sciences reference median, stunting as a HAZ below 90% of the reference median, and underweight as a WAZ below 75% of the median, 5 thresholds that have been shown to approximate the normalized −2 z score cutoffs for the 3 indicators. 28 As the original data from this survey are no longer available, we have relied on this cutoff point to approximate −2 z scores. Estimates of prevalence of stunting and wasting were calculated for children aged 6 to 59 months and 6 to 35 months.
As an index of trend, the average annual rate of reduction (AARR) was calculated to estimate the rate of decline in the prevalence of stunting between survey years using the following formula, 29 where the Pt is the baseline prevalence and Pt+n is the prevalence after n years:

Stata version 15.1 (StataCorp, College Station, Texas) was used to conduct statistical analyses.
Results
Part 1: Preschool Child Nutritional Status in 2016
The PoSHAN national sample included 4051 households with 5568 children of eligible age for cross-sectional, preschooler assessment (<60 months), for whom between 5477 and 5530 had within-range anthropometric measurements for calculating z scores (Figure 1). Table 1 describes characteristics of the 2016 sample, nationally and in the Mountains, Hills, and Tarai, where 16%, 27.9%, and 56.1% of households were surveyed, respectively. Of note, the Hills had a higher proportion of female-headed households (44.4%) than the Mountains (24.6%), or Tarai (29.5%), where the highest proportion of heads of household (53.9%) and mothers/caretakers (52.1%) had no formal education. The Mountains had the lowest (3.2%) and Hills the highest (34.9%) proportion of households in the highest quintile of the wealth index calculated from the national sample. Fewer households in the Mountains reported being food secure (59.2%) than Hills (85.5%) or Tarai (83.7%). The male–female sex ratio among children was 1.14 and comparable in each zone.
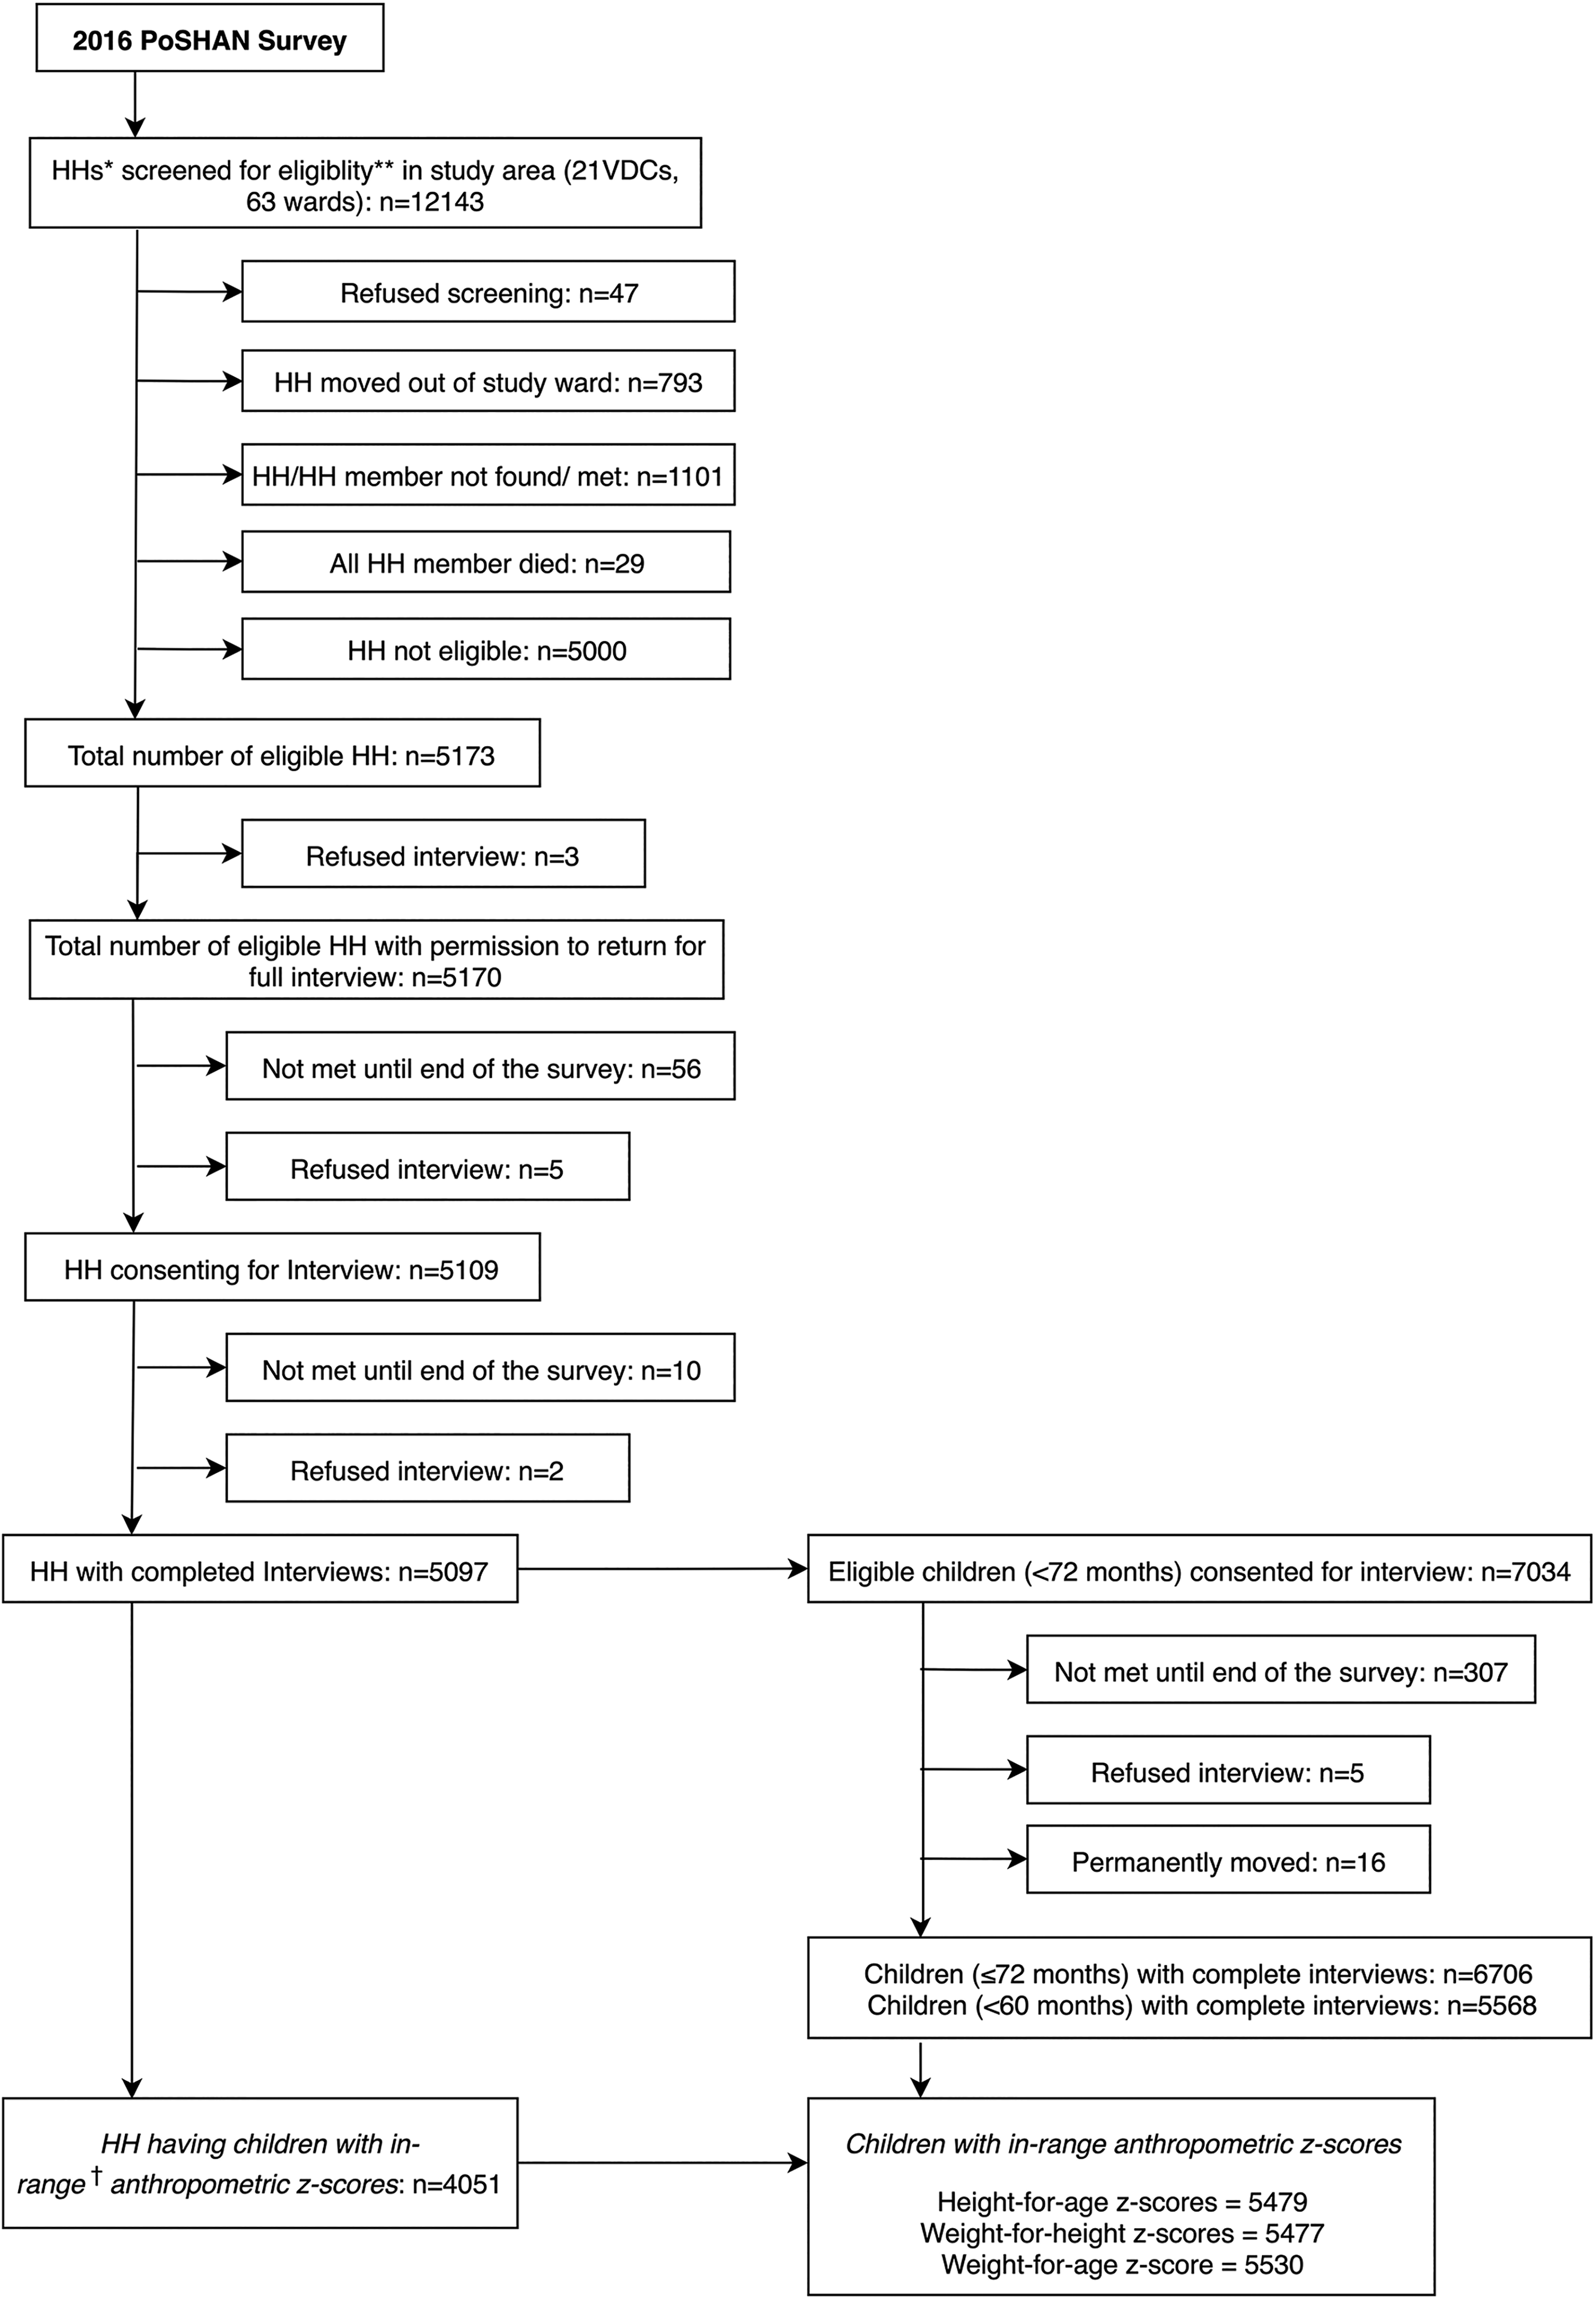
Flow diagram for Policy and Science for Health, Agriculture and Nutrition (PoSHAN) survey of 2016. *HHs: Households. **Eligibility: Children <60 months and previously enrolled children ≤72 months or newly married women (NMW) present in a household. †In-range anthropometric z scores: −6 > height-for-age > 6, −5 > weight-for-height > 5, and − 6 > weight-for-age > 5.
Characteristics of Surveyed Households With Children Under 60 Months of Age in the Mountains, Hills, and Tarai, PoSHAN Survey, 2016.a
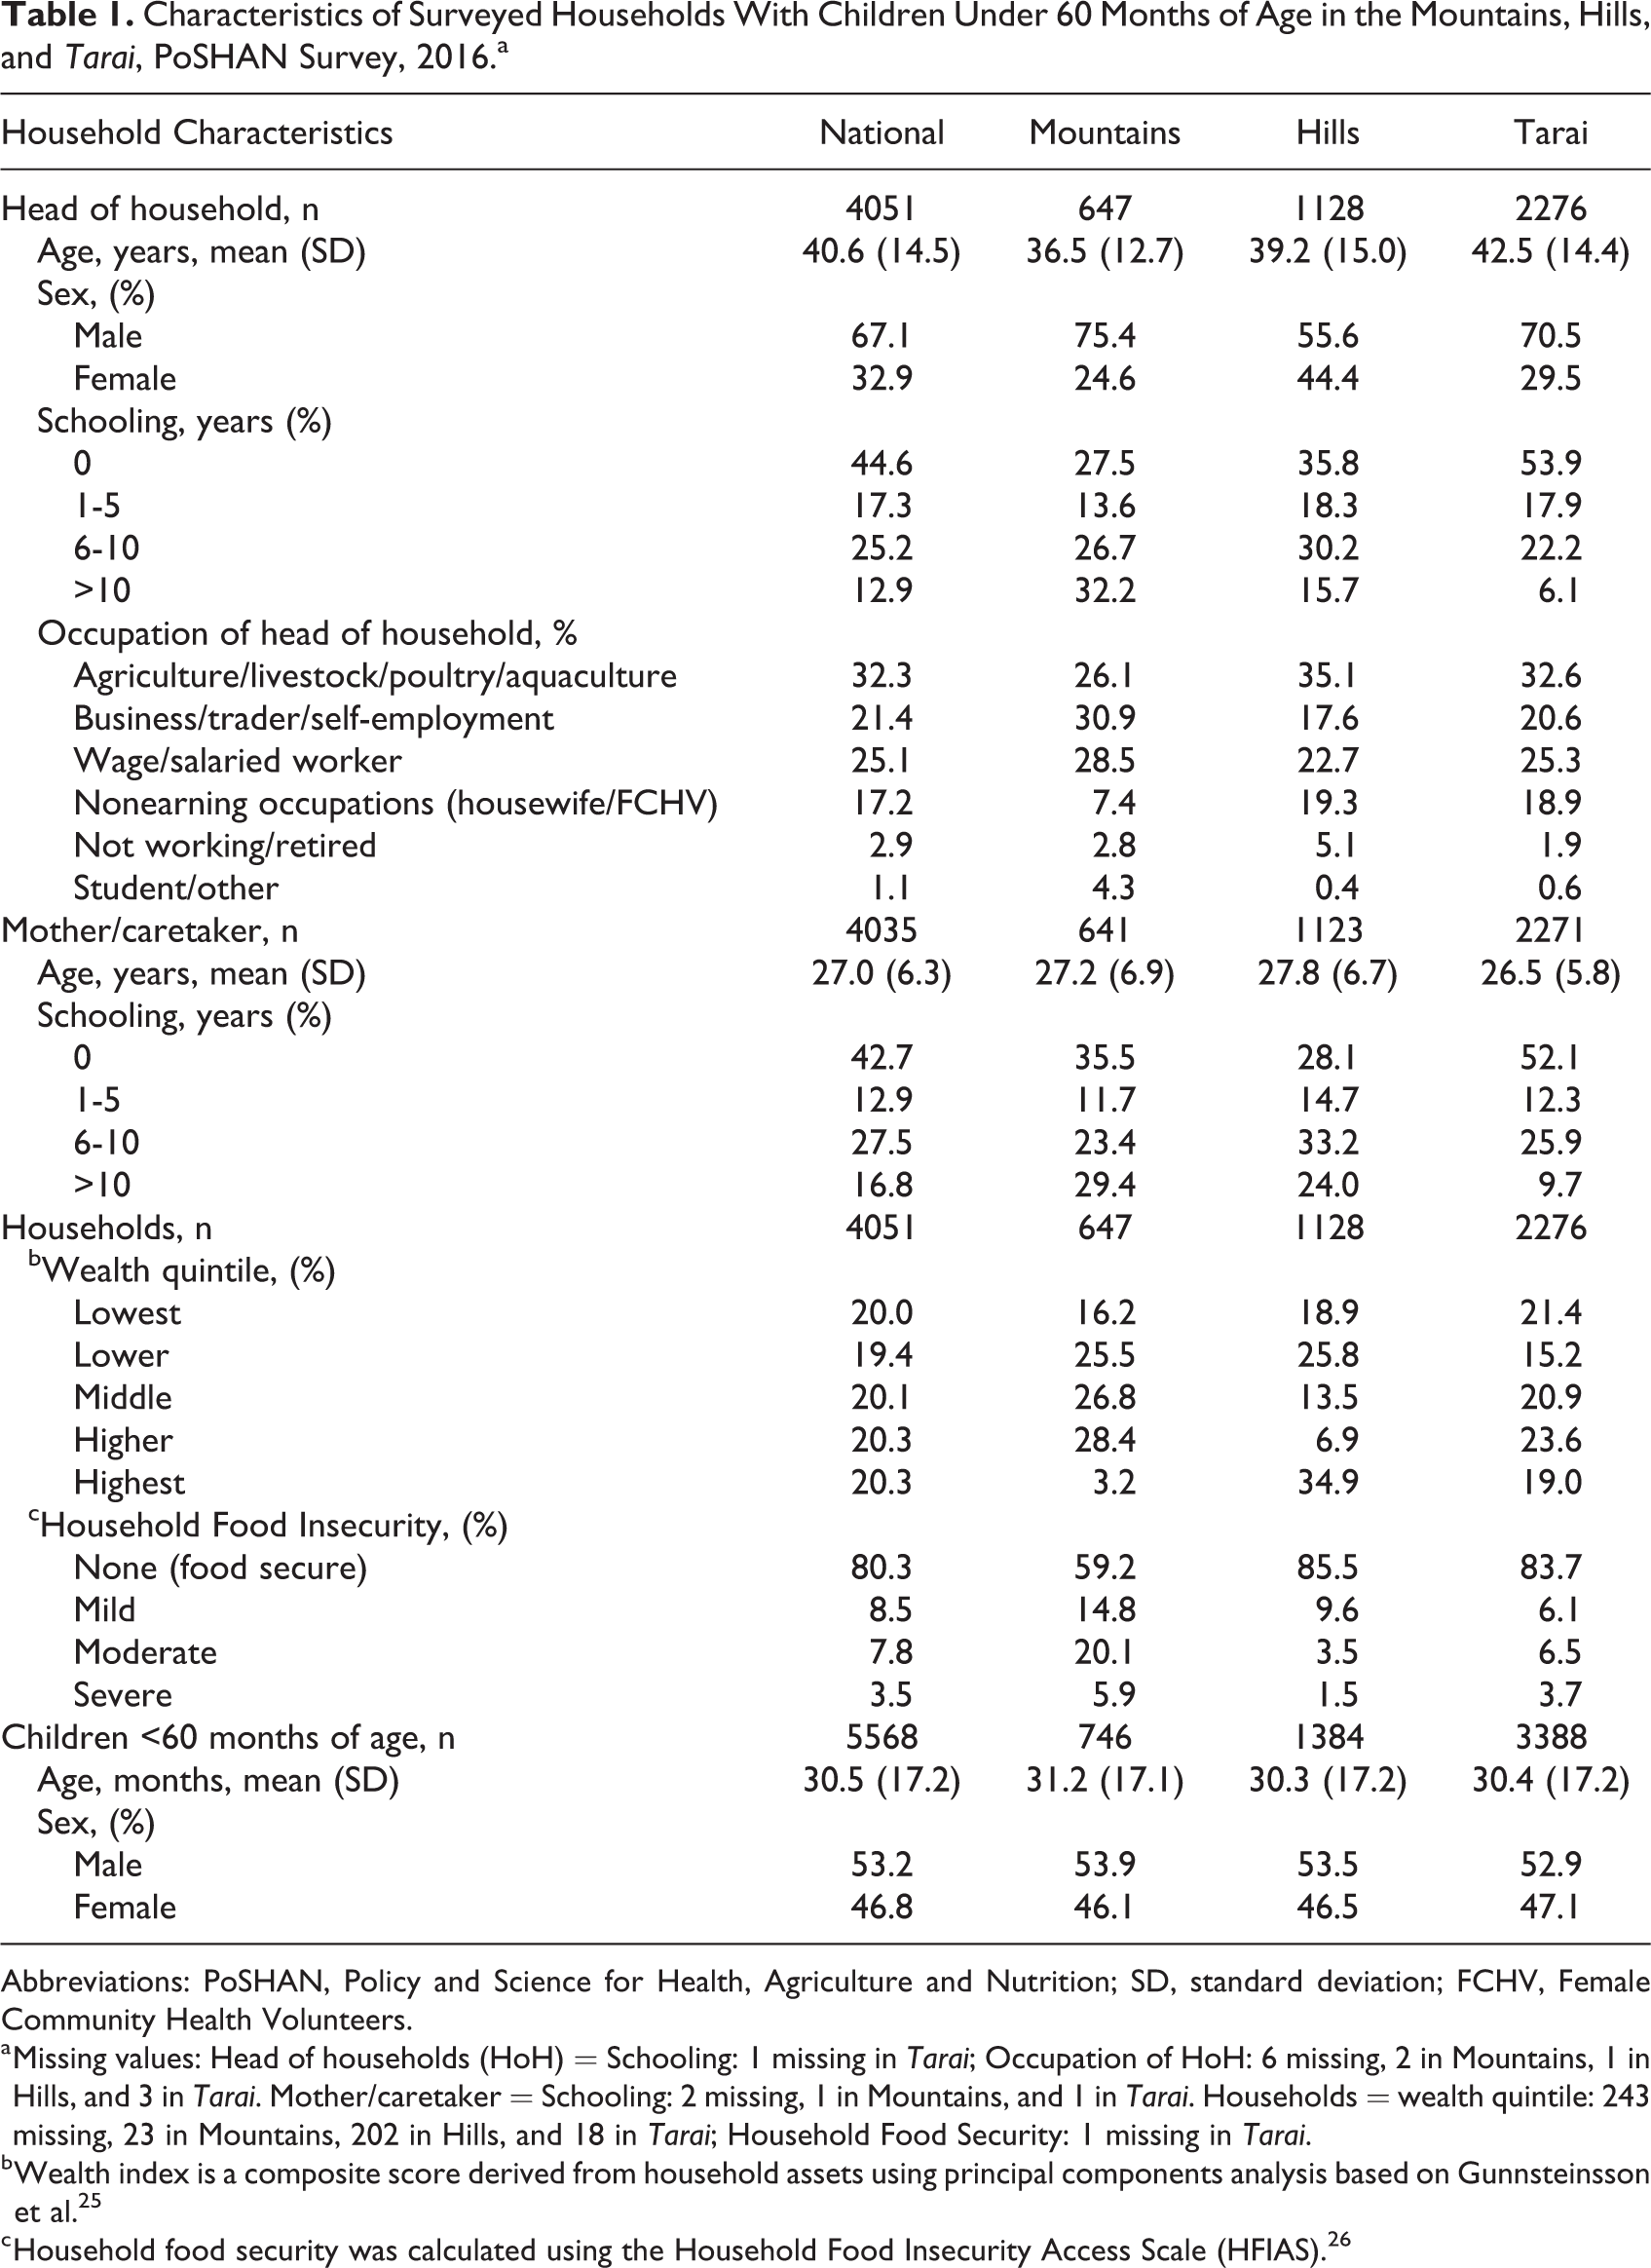
Abbreviations: PoSHAN, Policy and Science for Health, Agriculture and Nutrition; SD, standard deviation; FCHV, Female Community Health Volunteers.
a Missing values: Head of households (HoH) = Schooling: 1 missing in Tarai; Occupation of HoH: 6 missing, 2 in Mountains, 1 in Hills, and 3 in Tarai. Mother/caretaker = Schooling: 2 missing, 1 in Mountains, and 1 in Tarai. Households = wealth quintile: 243 missing, 23 in Mountains, 202 in Hills, and 18 in Tarai; Household Food Security: 1 missing in Tarai.
b Wealth index is a composite score derived from household assets using principal components analysis based on Gunnsteinsson et al. 25
c Household food security was calculated using the Household Food Insecurity Access Scale (HFIAS). 26
Nationally, the mean HAZ of preschoolers was −1.4 (95% confidence interval: −(2.0% to 3.4%), with 34.1% (29.5% to 38.9%) of children stunted, similarly by sex. Stunting was highest in the Mountains (40.6%) than in Tarai (34%), Hills (30.6%), or nationally and increased significantly with age from 5.5% below 6 months to 37.2% in the second year and 42.3% among older children. Mean WHZ nationally was −0.9 (−1.1 to −0.8) with 13.7% (11.0% to 16.9%) of children wasted (Table 2) and 2.6% (2.0% to 3.4%) severely so. (< −3 WHZ; Supplemental Table 1). The prevalence of wasting rose significantly from 16.5% in <6 months to 24.5% at 12 to 17 months and decreased to 10.5% above 24 months of age. Both sexes were similar in their WHZ distributions. Geographically, wasting was 3 to 4 times higher in the Tarai (18.9%) than other zones (6.7% in Mountains and 4.7% in Hills P value: <.001). Both childhood stunting and wasting decreased with increasing household wealth and food security across regions, although some associations were not significant regionally (Supplemental Tables 2-4).
Height-for-Age and Weight-for-Height z Scores of Nepali Children <60 Months of Age in 2016.
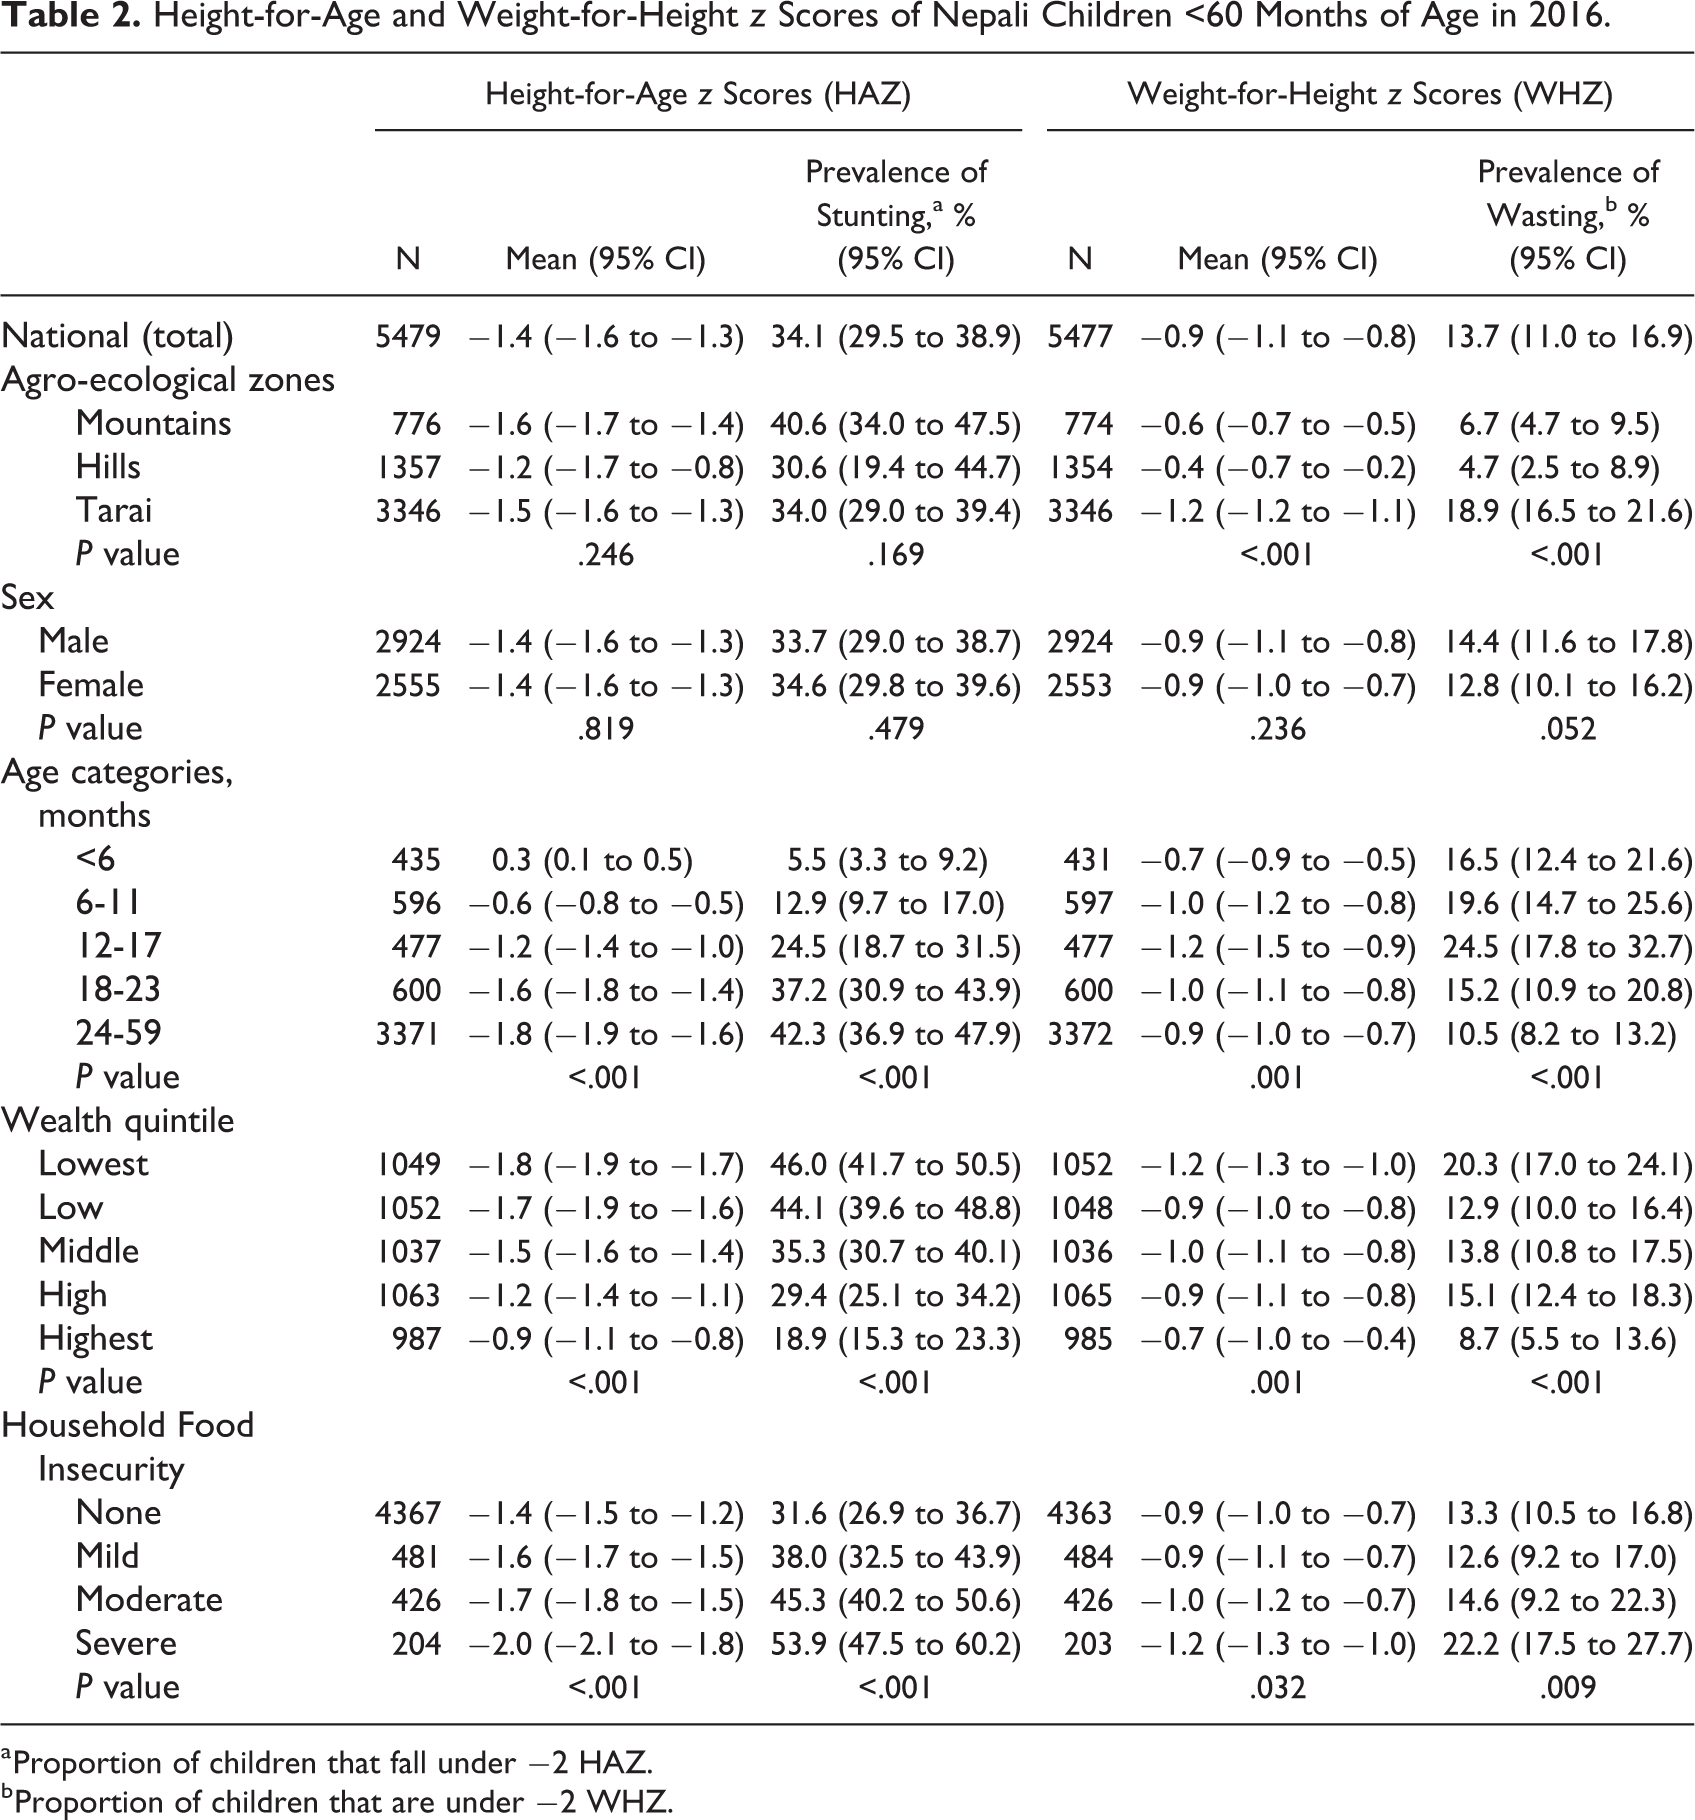
a Proportion of children that fall under −2 HAZ.
b Proportion of children that are under −2 WHZ.
Mild overweight (>1 in WHZ, in this context) affected ∼3.6% (2.3%, 5.7%) of children in both sexes. The largest percentages of children above 1 z score were <6 months of age (8.8%), and the prevalence rose slightly with increased wealth (P value: .184) and food security (P value: .016). Nationally, 30.5% (25.8%, 35.7%) of children were underweight (<−2 WAZ; Supplemental Table 1).
Part 2: Findings in 2016 in Historical and Contemporary Context
We have placed the current prevalence of 34.1% in 2016 into historical and contemporary context to help inform efforts to reach the WHA 2025 target. At least 8 national surveys have documented anthropometric status of children under 5 years in Nepal since 1975 (Figure 2), revealing 3 phases: first, a period of at least 25 years when half or more of preschoolers in Nepal were stunted, based on estimates of 51.3% 5 and 56.5% 6 in 1975 and 2001, respectively. That this high rate persisted throughout the 26 years is apparent by analysis restricted to children <36 months, allowing the NDHS 1996, which observed a rate of 56.6% in children of this age, to be included (Supplemental Figure 1). During a second phase, covering a 12-year period from 2001 to 2013, the prevalence of stunting <5 years steadily declined at an AARR of 3.8%, from 56.5% to 35.5% in 2013. 6,12 Finally, a third phase may be emerging, based on 4 surveys conducted in 2013 to 2016, during which the national prevalence of preschool child stunting appears to have leveled at around 35%. Still, subnational variation may be present, evident by a 6 percentage point decline in stunting in the Hills between PoSHAN surveys in 2014 (36.9%) 12 and 2016 (30.6%; Supplemental Table 3).
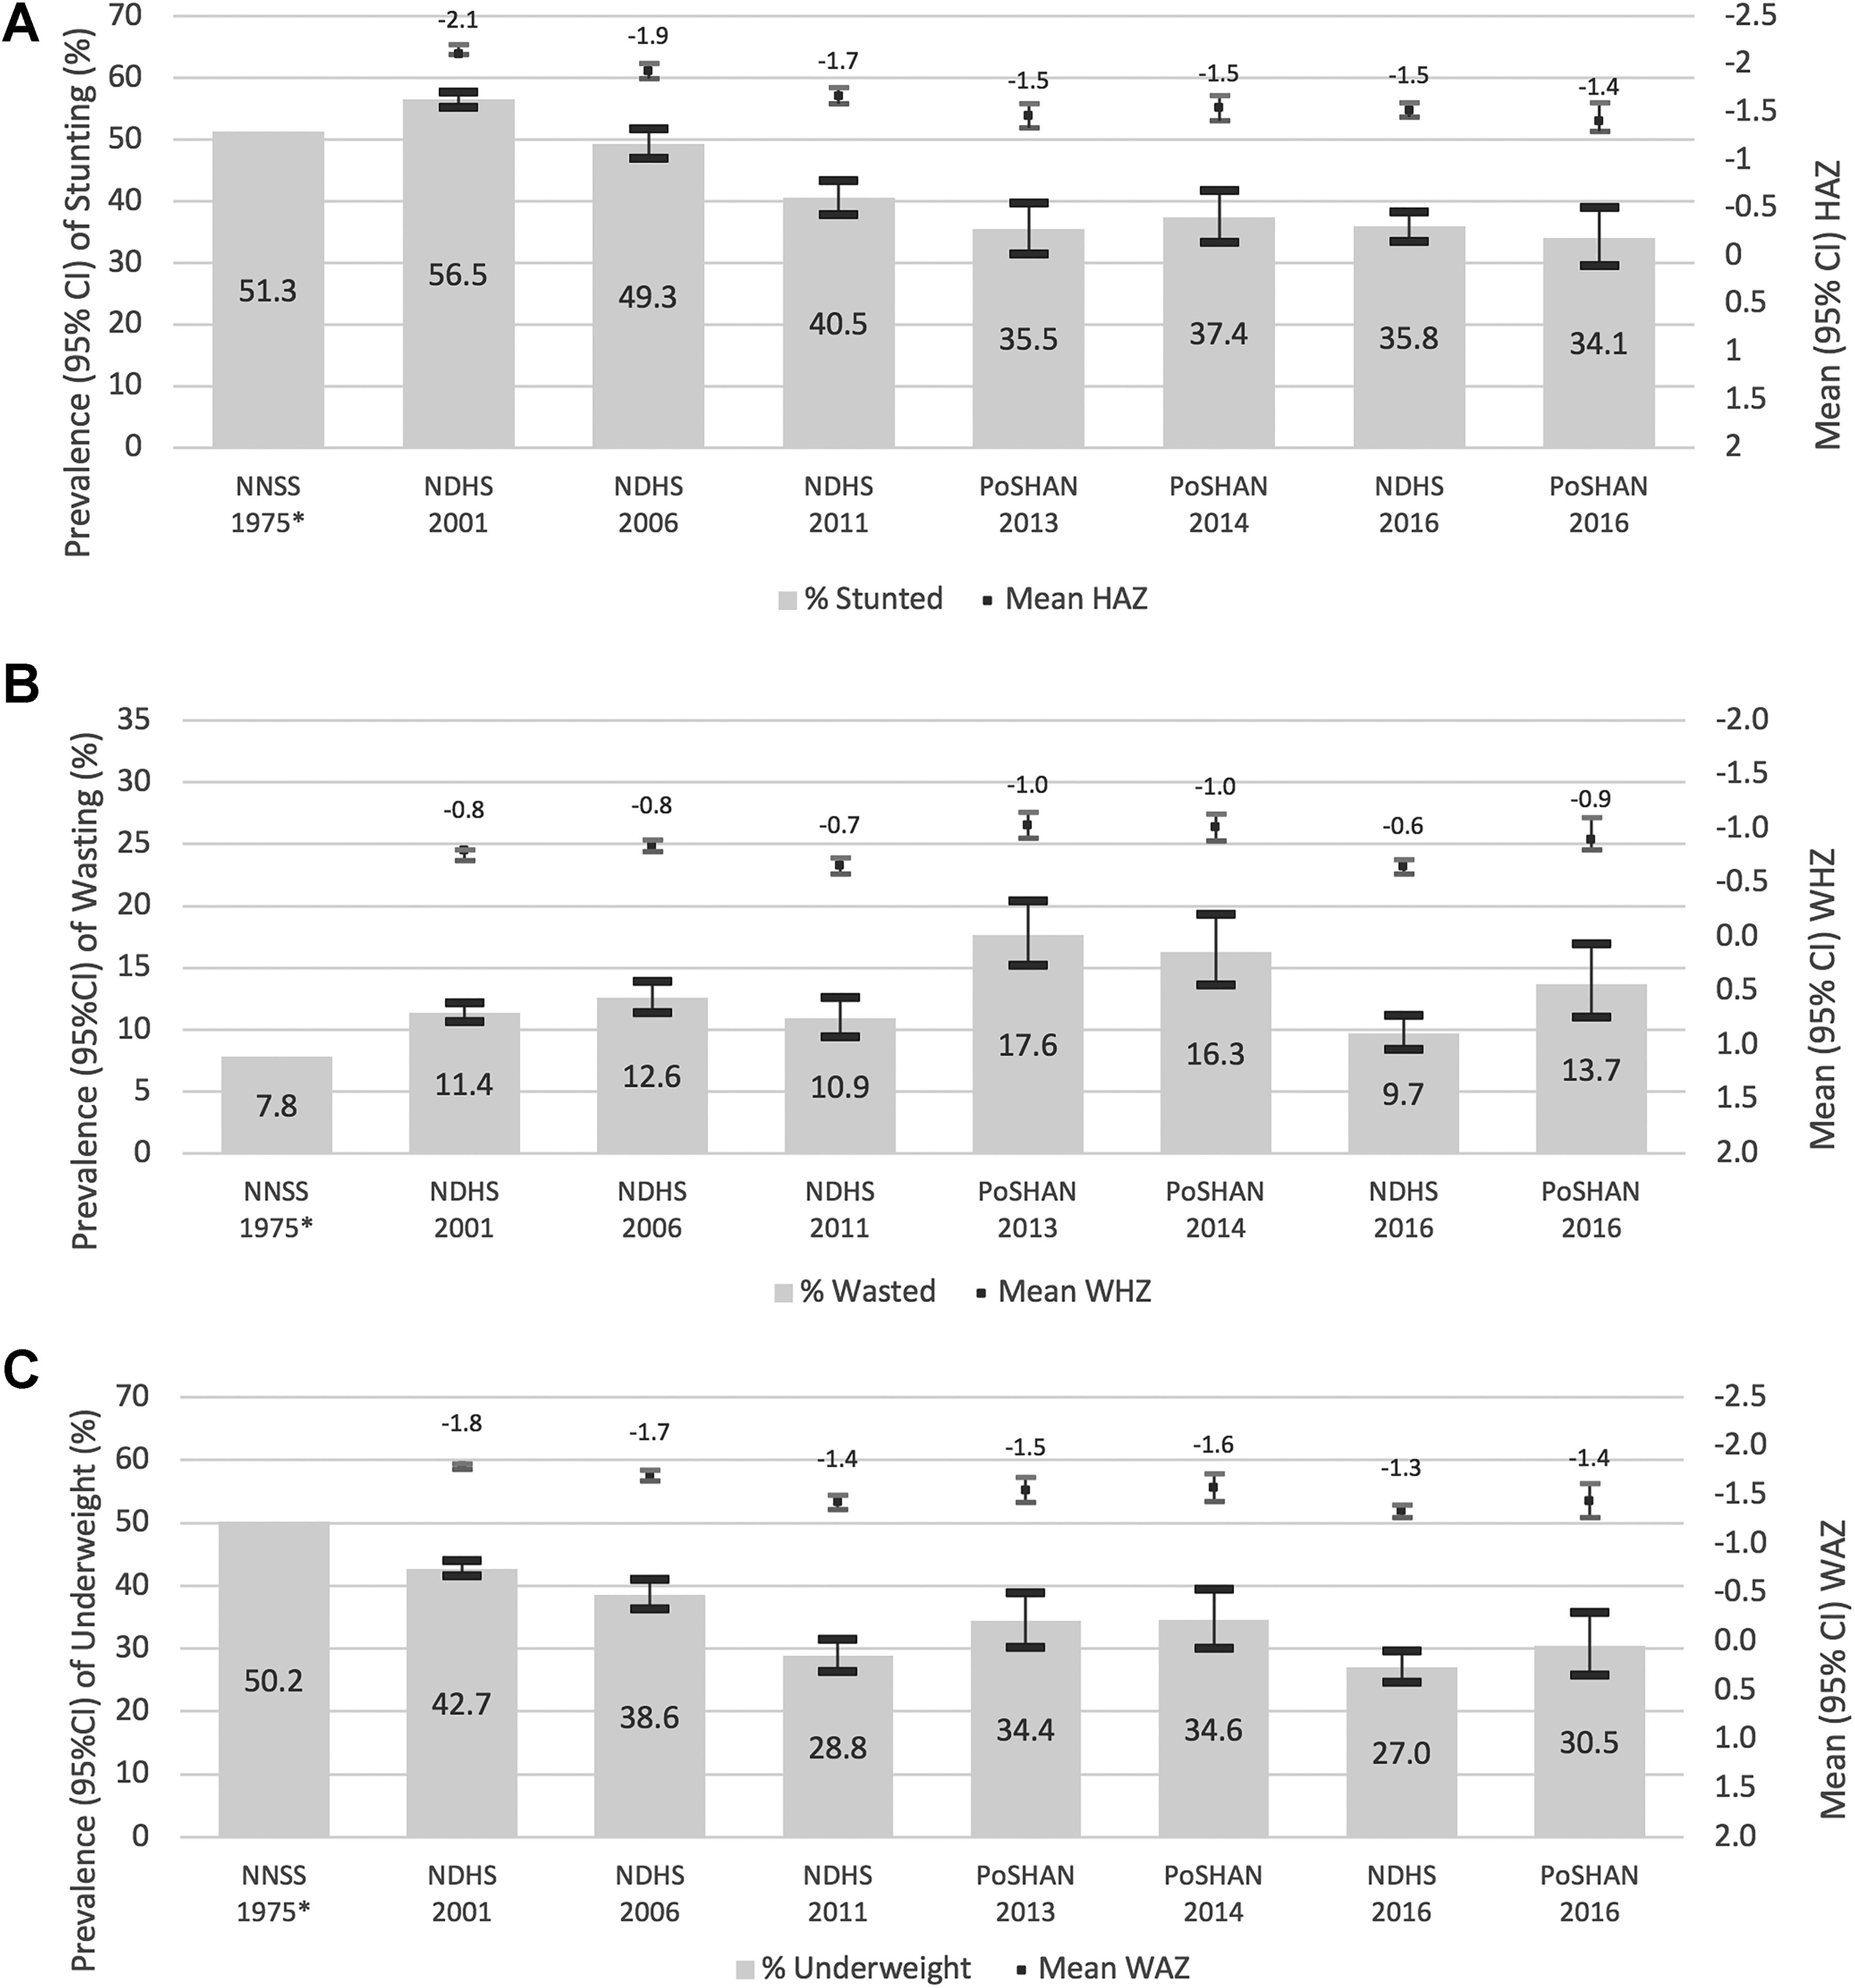
Forty-year trends in the prevalence (95% confidence interval [CI]) of (A) stunting, (B) wasting, and (C) underweight of children under 60 months of age in Nepal from the Nepal Nutrition Status Survey 1975 5 ; Nepal Demographic Health Surveys (NDHS) in 2001, 2006, 2011, and 2016; and Policy and Science for Health, Agriculture and Nutrition (PoSHAN) National Surveys of 2013, 2014, and 2016. 6,10,22,23 Stunting, wasting, and underweight are defined by z score values below cutoffs of −2 z scores of height-for-age (HAZ), weight-for-height (WHZ), and weight-for-age (WAZ) for the NDHS and PoSHAN surveys. Stunting is defined as being below 90% of the median HAZ, wasting is defined as being 80% below the median WHZ, and underweight as being 75% below the median WAZ for the Nepal Nutrition Status Survey. Mean (95% CI) for HAZ, WHZ, and WAZ distributions are displayed above each bar. *The Nepal Nutrition Status Survey (NNNS) includes children from 6 to 59 months, while the other surveys have children 0 to 59 months. Confidence intervals could not be calculated for the survey due to data limitations.
Preschool wasting (<−2 WHZ or <80% of median in 1975) reveals no clear pattern, which has appeared to oscillate from a low of 7.8% in 1975 to a high of 17.7% in 2013, 12 with intermediate rates of 9.7% and 13.7% reported in the 2016 NDHS and PoSHAN surveys, respectively (Figure 1). Rates were higher but similarly without trend when prevalence estimation was restricted to surveyed children <36 months (Supplementary Figure 1). No subnational trend is evident, except in the contemporary Tarai, where stunting has decreased from 23.3% in 2013 12 to 18.9% in 2016 (Supplemental Table 4).
Discussion
Key findings from the 2016 PoSHAN survey are that 34% of preschoolers across Nepal are stunted, more so in the Mountains (41%) and least so in the Hills (31%). Second, nearly 14% of young children are wasted, especially in the Tarai where 19% of children are affected, representing a rate that is 3 and 4 times higher than in the Mountains or the Hills. While there are indications of an early nutrition transition in Nepal, marked by increasing urbanization and income, and intakes of calorie-dense processed foods, oils, and sugar, 30 few children nationally (0.7%, data not shown) were observed to be overweight (ie, >2 z scores above the WHO median WHZ) and 3.6% were above 1 z score—which reached 8% in the Hills but less than 2% in the Tarai. Thus, our findings show that the dominant nutritional burden among young children in Nepal remains one of undernutrition in 2016, with a “very high” burden of stunting and “high” burden of wasting within which Tarai is in the “very high” range. 31
Interest in reducing stunting is high in South Asia, which bears 40% of the global burden. 32 The national prevalence of stunting in Nepal of 34% reported in the present survey is consistent with those obtained from other surveys conducted between 2013 and 2016, in which rates have varied from 34% to 37%, as shown in Figure 1, and affirmed in yet another recently reported survey of micronutrient status in 2016, where 35% of children aged 6 to 59 months were stunted. 33 The consistency of these estimates suggests a stable national prevalence in preschooler stunting over the most recently documented 4-year period, leading to questions of (1) how this plateau compares to the historical trend in preschool child stunting in the country, (2) what may explain a difference in trend, and (3) how these recent estimates can help inform and advance a national effort, and WHA commitment by Nepal, to lower the national prevalence of stunting to 24% or lower by 2025?
In examining the trend, we identified 3 distinct phases in the prevalence of preschool child stunting. The first period was bracketed by national surveys in 1975 and 2001, when 51% and 56%, respectively, of children were estimated to be stunted (presented in Figure 1). Our sensitivity analysis, in which we recalculated prevalence rates for children under 3 to accommodate an NDHS survey in 1996 that limited assessment to this age (Supplemental Figure 1), revealed prevalence rates of 57% in 1996, compared to 44% in 1975 and 50% in 2001, indicating about half of all Nepalese children were stunted throughout this period, marked by extreme poverty and food insecurity, superimposed by political instability, civil strife, and a decade-long (1996-2006) Maoist insurgency 7,34 before the resurgence of democratic governance in 2006. 8
The second phase, starting in 2001, covered a 12-year period during which the prevalence of childhood stunting steadily declined by an AARR of 3.8%, to ∼35% in 2013. 12 This steep reduction 9 coincided with a period of increased wealth from a steady inflow of remittance income, which likely helped drive the national poverty rate down from 31% in 2003-2004 to 25% in 2010 to 2011 35 and an overall improvement in food security. 36 During this transition period, steadfast improvements were also observed in maternal education, access and quality of health care, sanitation practices, 20 and birth size, all of which possibly contributed to the sizable reduction in stunting. 9
An emergent third phase, currently seen only from 2013 onward, is characterized by a plateau in the prevalence of preschool stunting, at ∼35%, as appears to be the situation throughout much of South Asia, reflected by DHS rates of 36% to 44% in Afghanistan, Bangladesh, India, and Pakistan, respectively, during the same period. 37 Within country, while the sample frames and sampling methods were different among the NDHS, 21 PoSHAN, 11 and the National Micronutrient Status surveys, 33 their narrow range of estimates, between 34% and 37%, provides strong corroborative evidence for this plateau phenomenon. Reasons for the plateau have not been formally identified, and the consequences of the 2 national shocks that occurred in 2015—a massive earthquake with its series of aftershocks devastated much of the central hills in April to May, 15 followed by an economic blockade along the Indian border in the last quarter of 2015 that severely affected trade 14 —may yet unfold. While there is some evidence that the national and international response in the year that followed the quake may have mitigated an expected deterioration in nutritional status of children, 15 nutritional consequence of the blockade that also precipitated protests throughout the Tarai has not been reported, although it remains a plausible stress.
In contrast to the steep decrease in stunting, little progress has been evident in alleviating wasting malnutrition as public health problem, which has varied from ∼8% to 18% over the past 4 decades, and comparable to wasting rates of 10% to 21% observed across South Asian countries between 2013 and 2016. 37 Discrepancies in the prevalence of wasting among surveys within Nepal may, in part, be due to differences in seasonality of field work and, thus, proximal determinants of thinness, including food security and diet, infections, and breastfeeding practices arising from shifts in the mother’s time engaged in agricultural activities. 38 While PoSHAN assessments were conducted within a uniform 4-month period of the monsoon season, DHS field work generally has taken 5 to 8 months to complete. For example, about half of the 2016 NDHS 22 was conducted in the postharvest, drier winter season rainy season, when the odds of wasting is lower relative to the rainy season, 38 which may partly explain a lower prevalence observed (9.7%) in the NDHS versus the PoSHAN survey (13.7%). Differences in age-group assessed may also contribute to variability in estimates. For example, the survey in 1975 5 excluded infants below 6 months, inclusion of which would likely have increased the prevalence of wasting above the reported 8%, as occurred in the sensitivity analysis when we restricted our secondary analysis to ages below 36 months (Supplementary Figure 1).
Progress in reducing stunting from 2001 to 2013, absent with a clear reduction in wasting, seems paradoxical, given the importance of antecedent wasting as a risk factor for deceleration in preschool linear growth velocity. 39 While wasting is a nutritional condition that should logically be mitigated to normalize linear growth, 40 interestingly, we find that recent DHS reports across South Asia report similar prevalence of wasting between stunted and nonstunted children, suggesting a need to better understand overlapping or specific risk factors for each condition. 37
Examination of determinants of undernutrition may offer insights into alleviating preschool child stunting for the region as it strives toward WHA 2025 stunting reduction targets. 4 In Nepal, several individual, household, and community characteristics have been associated with a 1.5- to 2.5-fold higher risk of early childhood stunting. 41 These include (1) child wasting and infectious illnesses, emphasizing roles of a nutritious diet, proper hygiene, and health care; (2) low maternal height (<145 cm), weight (<45 kg), and lack of education, suggesting a continuing urgent need to invest in maternal nutrition, schooling, and empowerment; (3) lowest versus highest quintiles of household expenditure, emphasizing benefits of especially rural economic development; and (4) a modernizing infrastructure, illustrated by presence of paved roads, a hospital, or permanent bazaar, revealing potential importance of access to markets, communications, health care, and other services in reducing disparities. 41 Interestingly, similar sets of risk factors for stunting and wasting have been identified from numerous population studies in South Asia, 9,37,42 -45 suggesting that common approaches to addressing multiple forms of malnutrition should be considered. Additionally, increased consumption of snack foods by children has been associated both with increasing childhood obesity and deterioration in nutrient adequacy and child growth in Nepal; therefore, reducing snack food consumption may have benefits in alleviating both over- and undernutrition and requires further exploration. 46
Geographic and associated economic disparities require attention to mitigate early childhood undernutrition in Nepal. An improved nutritional condition was apparent in the Hills, where the prevalence of stunting and wasting was lowest at 30.6% and 4.7%, respectively (Supplementary Tables 2-4). In recent years, the Hills has experienced some improvements in access to health care, food markets, and road networks 43,47 and enjoys a higher average remittance of income (by ∼1.4-2 times) from family members outside Nepal than in other zones. 47 To the country’s credit, the nutritional status of children in the Hills may have been protected following the earthquake of 2015, in part, due to the rapid and sustained emergency, food distribution, and development services in the months that followed. 16,48,49 In contrast to the Hills, the highest rate of stunting, 40% in the Mountains, was marginally up from 37% and 39% in this zone in 2013 and 2014, respectively, 12 a trend meriting further monitoring. In the Tarai, the observed 19% prevalence in wasting was the highest in the country, although it is consistent with a lowering trend in recent years, from 23.3% and 21.6% in 2013 and 2014, respectively, also meriting attention to discern reasons.
Finally, disparities in the prevalence of undernutrition in Nepal remain prominent by socioeconomic status, where the ratio in prevalence of stunting between children in the lowest and highest wealth quintiles was 2.4 in 2016 compared to 2.2 in 2013. 12 Over the past 20 years, wealthier households have undergone steeper reductions in stunting than poorer households, 50 attributed to increased access to health care, 51 faster asset (wealth) accumulation, 9 better home sanitation, and sustained improvements in maternal education, 20 likely widening inequalities in factors that can decelerate linear growth, serving to emphasize a continued need to alleviate poverty and tailor interventions to vulnerable populations. At the same time, the apparent slowing of trends suggests that there may be value in reevaluating the causes of malnutrition and interventions in place to address them.
Strengths and Limitations
Strengths of the PoSHAN surveys include a representative sampling frame within each of agro-ecological zone as well as the country as a whole, annual same-season and site assessments, and standardized data collection, entry, and management procedures, attributes that were likely to lower artefactual variation and improve the reliability of national estimates. 11 Notwithstanding, direct comparisons of the prevalence or trends in nutrition across the NDHS and PoSHAN surveys should be made recognizing varied sampling frames, weighted samples, geographic sites, training procedures, inclusion criteria, and seasons of field work. Also, unavailability of the original data set from the 1975 nutritional status survey, use of a different reference population, comparable but nonidentical indicators and cutoffs, and omission of infants under 6 months of age also provide a basis for caution in comparing older with more recent prevalence estimates of malnutrition.
Conclusions
Four decades of national surveys in Nepal reveal 3 phases: a period of ∼25 years (1975-2001) when half of all preschoolers were stunted, followed by a 12-year period (2001-2013) of steady decline in prevalence to ∼35% and a more recent period through 2016 during which stunting has remained unchanged. Throughout, preschool child wasting has varied between ∼8% and 18% with no evident trend. An apparent leveling off of reduction rates in stunting and variability in wasting suggests the need to closely monitor progress—possibly with more frequent data collection—to better understand factors that may be exerting influence on the remaining burden of undernutrition, which may differ from the previous period, as well as potential shifts in patterns of vulnerability. Epidemiological associations in Nepal and South Asia can offer insights into guiding the country’s pursuit of WHA 2025 goals with the goal of formulating policies and interventions that target the reduction in disparities.
Supplemental Material
Supplemental Material, KC_et_al_Early_childhood_Nutritional_Status_Supplemental_Tables_13_Feb_2020 - Preschool Child Nutritional Status in Nepal in 2016: A National Profile and 40-Year Comparative Trend
Supplemental Material, KC_et_al_Early_childhood_Nutritional_Status_Supplemental_Tables_13_Feb_2020 for Preschool Child Nutritional Status in Nepal in 2016: A National Profile and 40-Year Comparative Trend by Angela K. C., Andrew L. Thorne-Lyman, Swetha Manohar, Binod Shrestha, Rolf Klemm, Ramesh Kant Adhikari, Patrick Webb and Keith P. West in Food and Nutrition Bulletin
Footnotes
Acknowledgments
The PoSHAN surveys and other field studies were supported by the US Agency for International Development (USAID), through the Feed the Future Nutrition Innovation Lab under the terms of Cooperative Agreement No. AID-OAA-L-10-00006 managed by the Tufts Friedman School of Nutrition Science and Policy. The opinions expressed herein are those of the authors and do not necessarily reflect the views of USAID. Additional assistance of the Sight and Life Global Nutrition Research Institute, Baltimore, Maryland, and the Bill and Melinda Gates Foundation (OPP1141435) is acknowledged. The authors gratefully acknowledge UNICEF for support with acquiring MUAC tapes, The Government of Nepal for their overall support during the conduct of this 4-year study, New ERA Pvt Ltd and Nepali Technical Assistance Group in Kathmandu for conducting field work and data management, and the PoSHAN-Nepal team for its roles in implementing and managing the surveys.
Declaration of Conflicting Interests
The author(s) declared no potential conflicts of interest with respect to the research, authorship, and/or publication of this article.
Funding
The author(s) received no financial support for the research, authorship, and/or publication of this article.
Supplemental Material
Supplemental material for this article is available online.
References
Supplementary Material
Please find the following supplemental material available below.
For Open Access articles published under a Creative Commons License, all supplemental material carries the same license as the article it is associated with.
For non-Open Access articles published, all supplemental material carries a non-exclusive license, and permission requests for re-use of supplemental material or any part of supplemental material shall be sent directly to the copyright owner as specified in the copyright notice associated with the article.