
Abstract
Background:
In developing countries, where energy-dense foods with low nutrient content are highly accessible, the fear of feeling hungry and the desire of prolonging satiation have been documented.
Objective:
To evaluate the role of valuation of eating and satiation in the relationship of food insecurity with diet, obesity, and cardiometabolic risk with structural equation modeling.
Methods:
A validated questionnaire that measures the value of eating and satiation (VES) as the basis of wealth was administered to 321 adult women from Queretaro, Mexico. Instruments for measurement of socioeconomic status, food insecurity, physical activity, and a semiquantitative food frequency questionnaire were also applied. Women were measured and weighed, and they provided a fasting blood sample to determine lipid profile, glucose, and insulin concentrations. Structural equation models were used for prediction of the homeostasis model assessment–insulin resistance (HOMA-IR) index and triglyceride/high-density lipoprotein (HDL) cholesterol index.
Results:
The models confirmed, with acceptable goodness-of-fit parameters, the mediation position of VES between past experiences of food insecurity and a greater intake of carbohydrates and its impact on obesity, and on the HOMA-IR and the triglyceride/HDL-cholesterol index.
Conclusion:
Experiences of food insecurity may increase VES in women and influence eating behavior, increasing intake of sugars and starches in their diet, thus increasing the risk of obesity and cardiometabolic diseases such as diabetes. The understanding of essential values that induce unfavorable eating behavior in a population that has experienced past food insecurity may help to develop public health strategies for prevention of cardiometabolic diseases.
Introduction
At the present time, most cardiovascular deaths occur in developing and underdeveloped countries. 1 Obesity and chronic diseases, such as diabetes and hypertension, have been linked to food insecurity, primarily in women. 2 -5 This association has been explained by biological factors such as an unfavorable activation of a stress response 6 and also by a greater intake of low-cost and poor-nutritional-quality foods such as sugars and fat. 7 -9 In addition to potential economic strategies such as public policies aimed at decreasing food insecurity, increasing accessibility to nutritious products, or taxing less nutritious foods, additional efforts to understand the core reasons for food choice have been made in order to reduce obesity and chronic disease.
Compared to current food insecurity, which is a result of limited purchasing power, experiences of food deprivation may also have a significant influence on eating behavior. 10,11 Moreover, several studies have identified in low socioeconomic status (SES) Latino populations a tendency to prolong satiation and to overeat, which may have an impact on food choice and eating habits. 12 -16 Measuring scales that estimate valuation of eating as an important component of wealth and valuation of satiation were developed and validated in Mexican women. It was confirmed that women who recall experiences of food insecurity in the past overvaluate eating and satiation. 17
In developing countries, where energy-dense low-nutritious foods are highly accessible, the fear of feeling hungry and the desire to prolong satiation may lead food insecure population to overeat when food is available. 18,19 In food insecure population, the role that valuation of eating and satiation can play in an unhealthy diet, obesity, and chronic disease needs to be well established in order to design more effective strategies to prevent cardiometabolic diseases in populations.
The relationship of both, chronic disease and obesity, with food insecurity could be due to an overvaluation of eating and satiation that encourages overeating and an unhealthy diet and that could result in obesity and/or cardiometabolic risk. This conceptual model consisting of the inter-relation of multiple variables was explored in the present study in order to build a model that helps explain the presence of chronic disease in food insecure populations using structural equation modeling (SEM).
Methods
Study Population
A total of 321 women from 18 to 55 years of age participated in this cross-sectional study. Women were recruited in 10 public and 13 private elementary schools from Queretaro, a city in central Mexico. Schools were randomly selected, by assigning uniform random numbers to all the registered schools from the municipality of Queretaro, in order to shuffle the list and select the first schools from the list. The sample size was sufficient to build a model with up to 32 parameters in an SEM. 20 From the women who voluntarily decided to participate in the study, women were excluded if they were pregnant or lactating, or if they had limbs amputations or a similar condition that could impede valid anthropometric measurements. The study was approved by the Bioethics Committee of the Universidad Autónoma de Querétaro (UAQ) approval number: 30FCN2015. All women received oral and written information about the study. Those who voluntarily decided to participate signed a consent form and were enrolled in a cross-sectional study.
Protocol
Once the women were enrolled in the study, 2 appointments on different days were established with them. On day 1, a series of questionnaires, including dietary intake and physical activity assessment, were administered in person and individually by trained interviewers. Women were asked to come to their second appointment with light clothes and after a 12-hour fast to their children’s school where they were recruited or to a health clinic at the UAQ. Participants were weighed and measured and then a nurse or lab technician took a blood sample for biochemical assessments. The blood samples were taken to a commercial clinical laboratory whose personnel had worked in clinical research projects for the UAQ before and were blinded to the information of participants.
Measurement Instruments
A series of questionnaires were administered in the following order: (1) clinical history that included age, previous diagnosis of chronic diseases, marital status, and family history of chronic diseases; (2) an SES questionnaire that was previously validated for the population in Mexico. 21 (3) Scales measuring the value of eating and the value of satiation; these scales were previously developed and validated in the same population as that of the present study. 17 The instrument evaluates, with a 5-point Likert scale, 7 statements related to high value of eating as the basis of wealth and to high value of satiation; (4) household food insecurity was determined with the Mexican Food Security Scale questionnaire, 22 and (5) an adapted version of the past food insecurity questionnaire 10 comprising 6 questions about food insecurity during childhood.
Dietary Intake and Physical Activity Assessments
Dietary intake was assessed by a semiquantitative food frequency questionnaire (FFQ). It consisted of 134 foods chosen from an original version 23 and adapted for local foods. Women reported the regular portion size for each food and were assisted with sample measures, such as spoons and cups. The FFQ answers were transformed into daily amounts of food in order to calculate food group intake per participant. In addition, macronutrient content was calculated using food composition tables from the National Institute of Medical Sciences and Nutrition, Mexico, 24 and from the US Department of Agriculture. 25 Food intake was analyzed as macronutrient or food group percentage of total kilocalories because of the expected bias of energy overestimation in the FFQ. In addition, several food groups were formed considering their content of dietary fiber, sugars, protein, and fat; then, they were analyzed as the percentage of total intake in grams and the percentage of total energy intake.
Physical activity was measured with the Spanish version of the Global Physical Activity Questionnaire proposed by the World Health Organization (WHO). 26 It evaluates duration and intensity of occupational physical activity, transport-related physical activity, and physical activity during leisure time.
Cardiometabolic Risk Markers Evaluation
Weight and height were measured by trained personnel following the procedures of the WHO. 27 Women were weighed twice with an electronic scale (Beurer BF100, Ulm, Germany) to the nearest 100 g. Height was determined in duplicate using a portable stadiometer (SECA, Bodymeter 206, Seca Corp, Hanover MD) with a precision of 0.1 cm; if both measurements differed by 0.5 mm or more, a third measurement was obtained. Body mass index (BMI) was calculated with the means of weight and height.
Blood samples were centrifuged within 2 hours after being obtained, for 15 minutes at 1538g. Blood serum was separated and stored in 4 aliquots. High-density lipoprotein (HDL) cholesterol, triglycerides (TGs), and glucose were determined by a dry chemistry method (Fujifilm, Drychem, Japan). Insulin concentration was determined with a chemiluminescence immunoassay analyzer (Immulite 1000, Siemens, Los Angeles, CA, USA). The homeostasis model assessment–insulin resistance (HOMA-IR) index was calculated to estimate insulin resistance marker or diabetes risk with the following formula: HOMA IR = fasting glucose, mmol/L × fasting insulin, mU/mL/22.5. 28 In addition, the TG/HDL-C index was calculated as a simple and effective biomarker of cardiometabolic disease. 29
Statistical Analyses
Descriptive statistics of SES levels, marital status, education level, BMI groups, and altered cardiometabolic biochemical markers were calculated in order to describe the sample. The association between BMI and social environment variables was explored by comparing BMI means across SES, food insecurity, and education-level groups by analysis of variance. The household food insecurity scale was categorized as suggested by Villagómez-Ornelas et al 22 : No affirmative answers indicated food security; 1 to 3, 4 to 7, and 8 to 12 affirmative answers indicated mild, moderate, or severe food insecurity, respectively. The past food insecurity scale had 6 questions: No affirmative answers indicated food secure, 1 or 2, 3 or 4, and 5 or 6 affirmative answers indicated mild, moderate, or severe food insecurity, respectively. 10
Linear regression models adjusted for age and physical activity during leisure time were used in order to confirm the association between BMI and cardiometabolic markers. The dietary variables that were associated with BMI, HOMA-IR, and TG/HDL-C were explored with Pearson correlations and with linear regression models adjusted for age and physical activity during leisure time.
The construct validity of the subscale value of eating and value of satiation was evaluated with factorial and confirmatory analyses that are methods to validate measuring scales, 30 to confirm the model fit among the indicators with a single latent variable: value of eating and satiation (VES). Those dietary variables that had a significant association with BMI and cardiometabolic markers were included in linear regression models as independent variables to test their association with VES. Finally, we evaluated the association between the VES scale and current household food insecurity and past food insecurity. Linear regressions were verified for heterogeneity of residuals and the dependent variables were log-normalized as needed.
To confirm the mediation position of VES with food intake and risk of cardiometabolic disease, food insecurity scores, the dietary variables that were associated with an increased risk of cardiometabolic diseases, as well as with VES score were selected to fit 2 SEM that included the latent variable VES with its indicators, one to predict HOMA-IR and the other one to predict TG/HDL-C. Previously, 3 missing values were imputated with the regression method, 31 and the variables that were positively biased (HOMA-IR, TG/HDL-C, and meat intake percent of total kcal) were log-normalized; the variable ethanol intake percent of total kcal could not be normalized and was transformed into a binary variable (consumes any amount of alcohol). The SEM estimation method was maximum likelihood. After building an initial model with variables that showed significant regression estimates, modification indices were calculated, and the covariances that made theoretical sense were included in modified models to improve goodness-of-fit measures in order to get the final models to confirm the hypothesis. The criteria to evaluate goodness of fit were: χ2/degrees of freedom (df) < 3, non-normed fit index (TLI) and comparative fitness index (CFI) > 0.9, and the root mean square error of approximation (RMSEA) < 0.08. All analyses were performed in SPSS v.18 and AMOS IBM v.23. Significant effects were considered when P < .05.
Results
General characteristics of the women who participated in the study are presented in Table 1. There was an association between a lower BMI and the social environment variable categories related to a wealthier status. Past food insecurity showed the straightest linear association with BMI (Table 2). Both BMI and TG/HDL-C were associated with higher intake of carbohydrates and lower intake of ethanol; HOMA-IR was related to higher intake of energy and meats, except fish, as well as to a lower intake of ethanol (Table 3).
General Characteristics of the Women Who Participated in the Study.
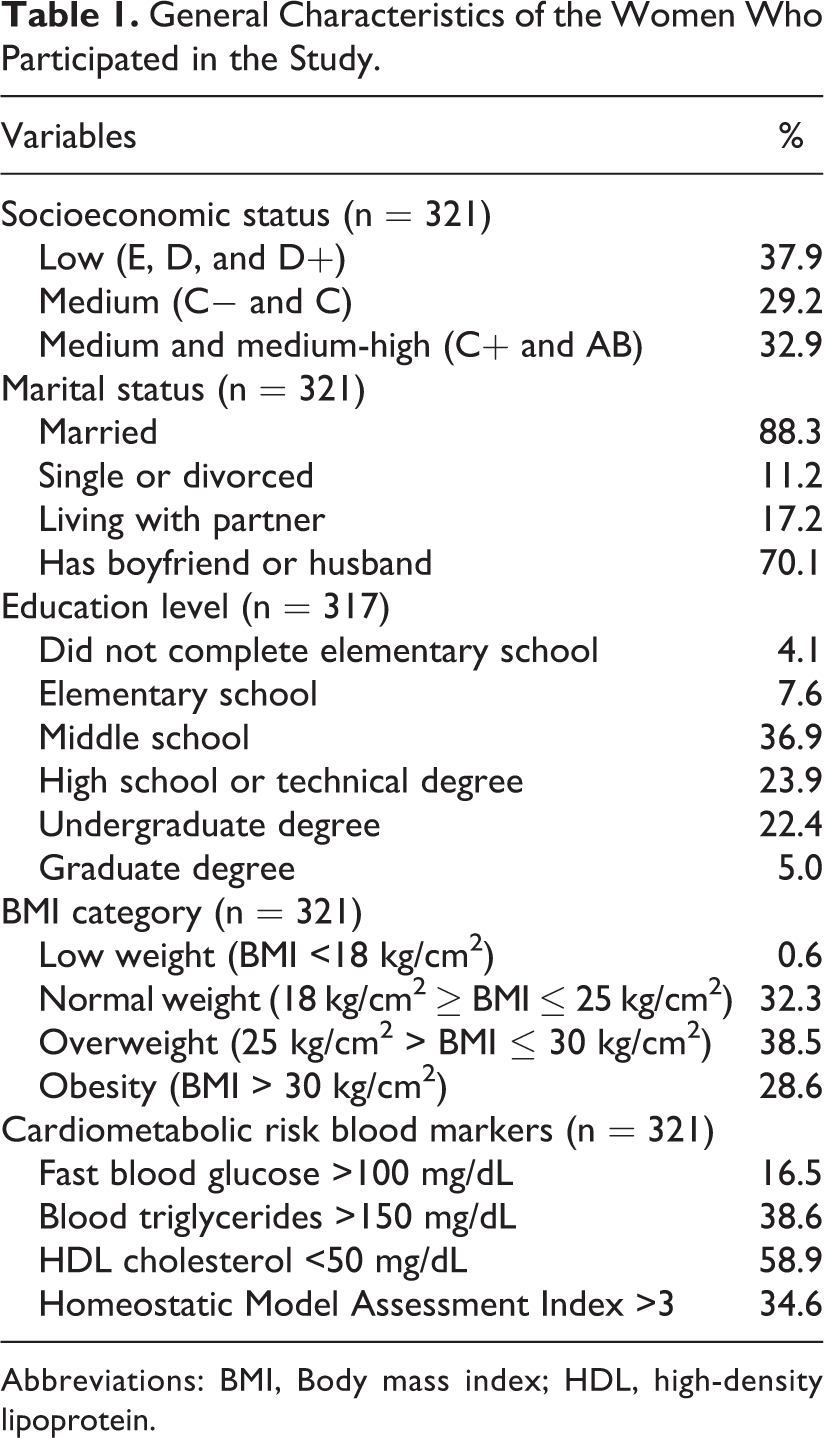
Abbreviations: BMI, Body mass index; HDL, high-density lipoprotein.
Association of Body Mass Index With Socioeconomic and Environmental Variables.a
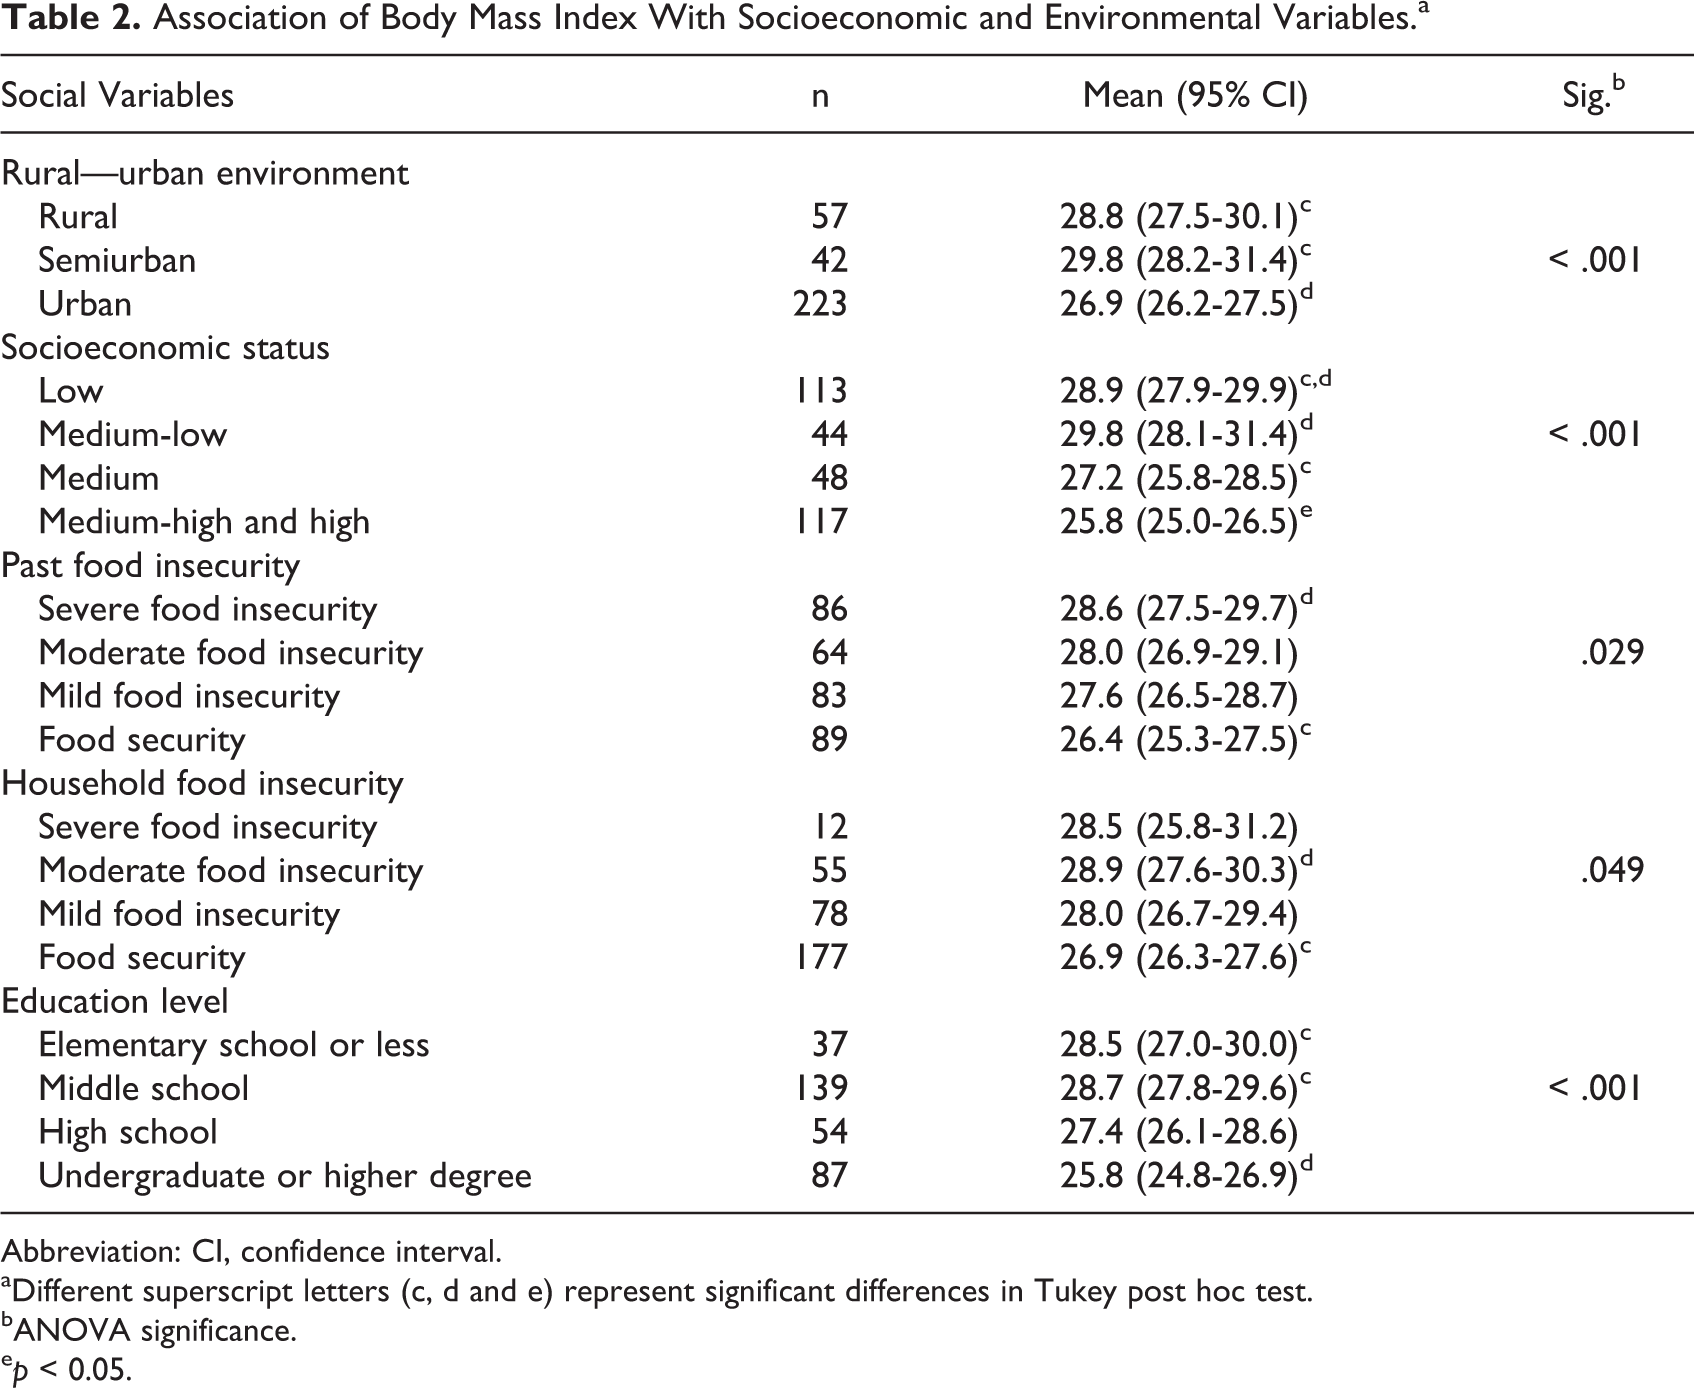
Abbreviation: CI, confidence interval.
aDifferent superscript letters (c, d and e) represent significant differences in Tukey post hoc test.
bANOVA significance.
ep < 0.05.
Association of Reported Dietary Nutrients and Food Groups With Cardiometabolic Markers.a
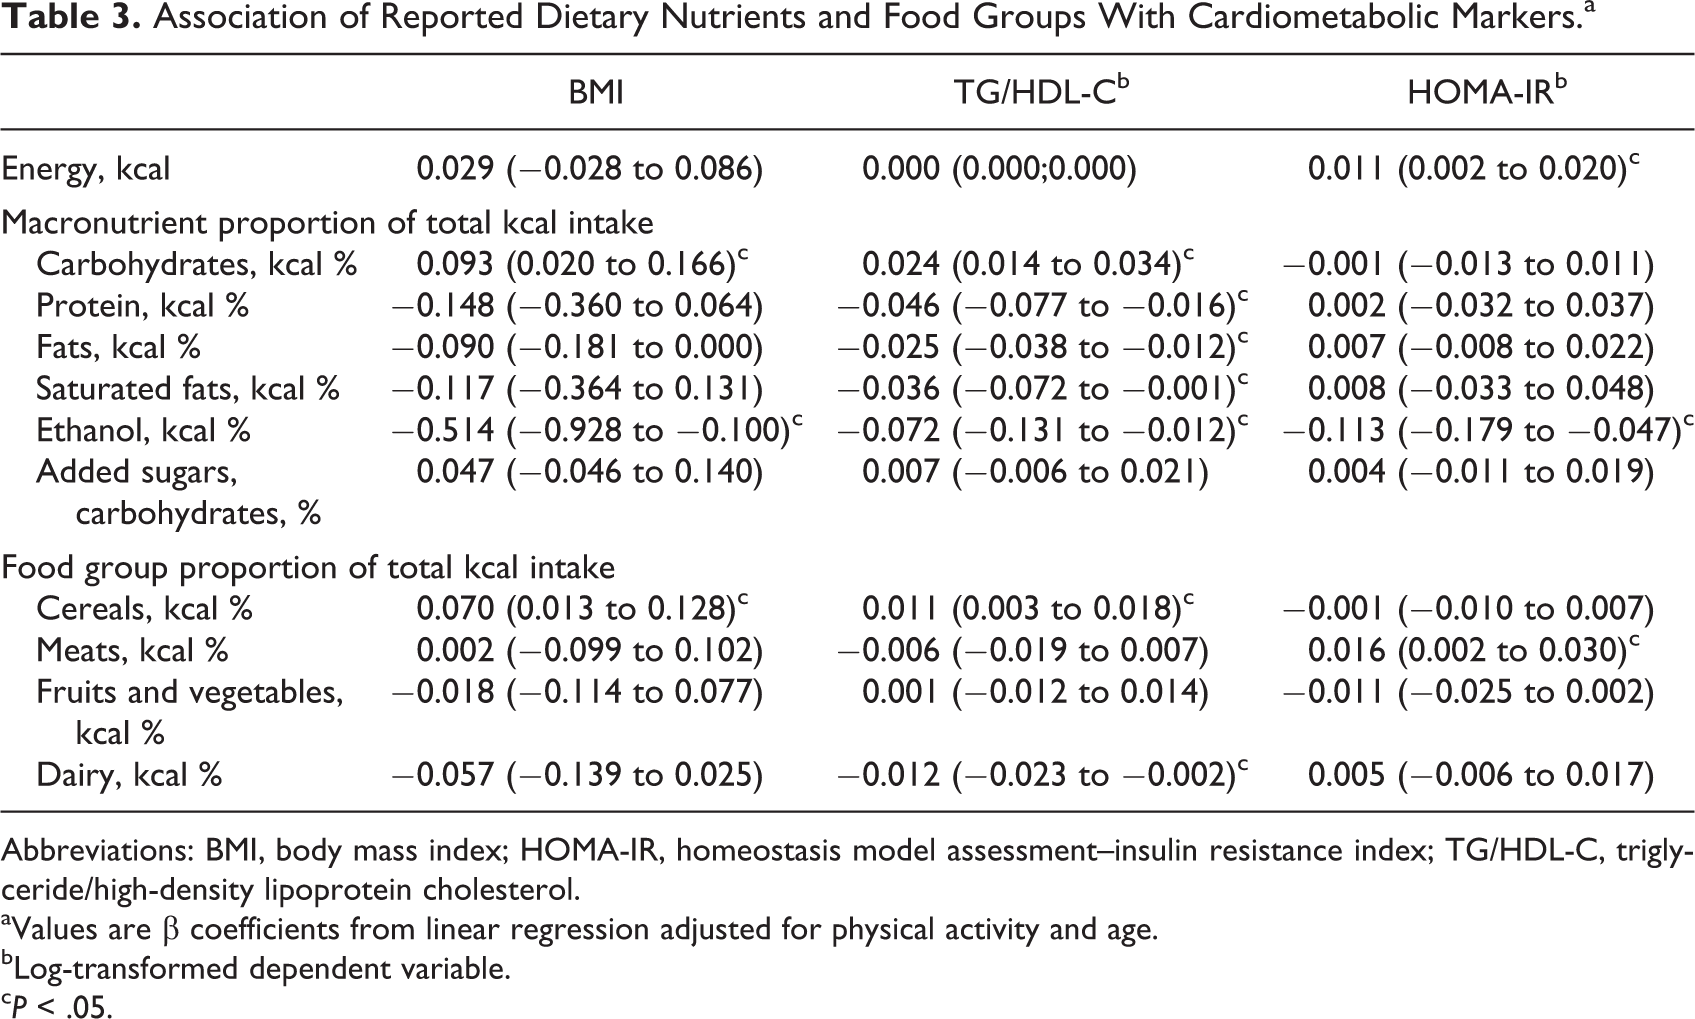
Abbreviations: BMI, body mass index; HOMA-IR, homeostasis model assessment–insulin resistance index; TG/HDL-C, triglyceride/high-density lipoprotein cholesterol.
aValues are β coefficients from linear regression adjusted for physical activity and age.
bLog-transformed dependent variable.
cP < .05.
Factorial analysis revealed no discriminant validity between the value of eating and the value of satiation subscales since all items conformed to a single factor. Confirmatory factor analysis corroborated a high correlation (0.95) between both subscales. Therefore, the scales were considered as measuring a higher order single latent variable: VES. This single scale was confirmed with acceptable goodness-of-fit parameters (CMIN/df = 2.570, CFI = 0.958, RMSEA = 0.07).
The score on the VES scale was directly associated with carbohydrate intake and percent of added sugars in carbohydrate and total energy intake and was inversely associated with protein, fat, and meat consumption (Table 4). In addition, VES showed a highly significant association with past food insecurity and was not significantly associated with current household food insecurity (β coefficient [95% confidence interval], sig.: 0.031 [0.013-0.049], P = .001; 0.13 [−0.004 to 0.029], P = .126, respectively).
Association of Value of Eating and Satiation With Reported Dietary Nutrients and Food Groups.a
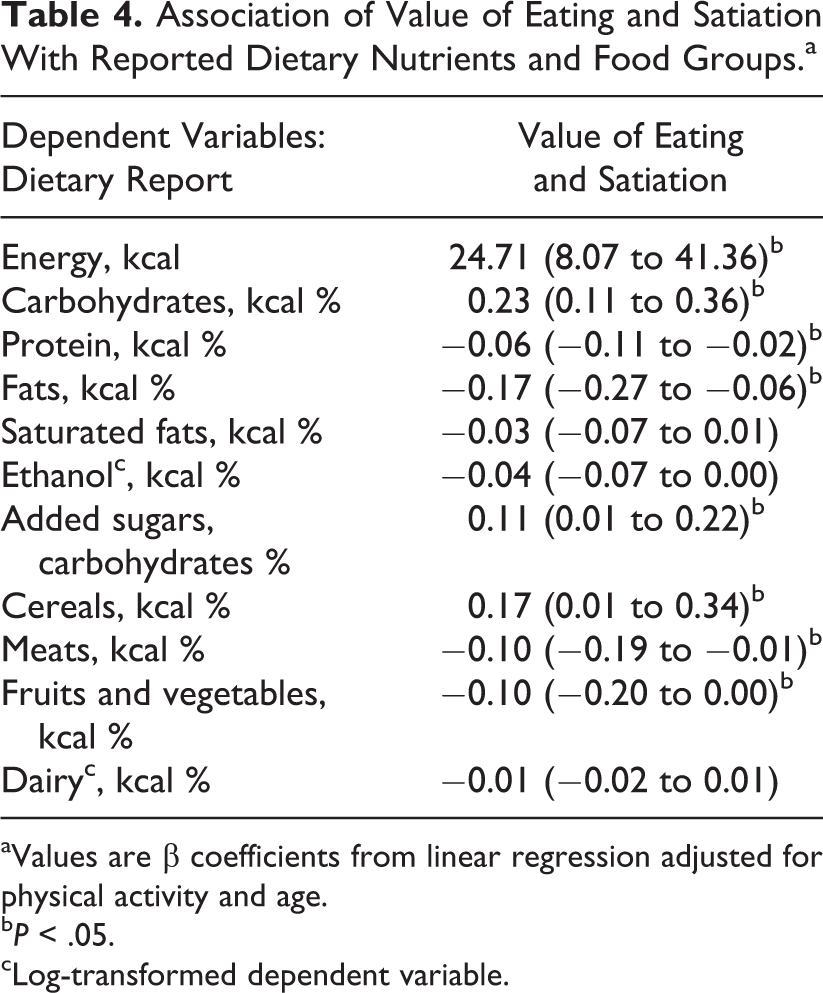
aValues are β coefficients from linear regression adjusted for physical activity and age.
bP < .05.
cLog-transformed dependent variable.
The variables that were significant and fit the conceptual model were entered in the 2 SEMs. The variables that did not show significant regression estimates were excluded from the model (ie, ethanol consumption and total energy intake). Three error covariances were included in the modified models, 1 that accounted for the indirect association between dietary variables, and 2 that corresponded to VES items that were placed next to each other in the questionnaire. Figures 1 and 2 show the final path diagrams with standardized coefficients, one to explain HOMA-IR and the other to predict TG/HDL-C. All standardized coefficients were significant at P < .05. Table 5 shows the model fit indexes of the initial models and the final models that include error covariances from modification index calculations. Both models demonstrated the interrelationship among past food insecurity, VES, carbohydrate intake, and BMI to explain HOMA-IR and TG/HDL-C.
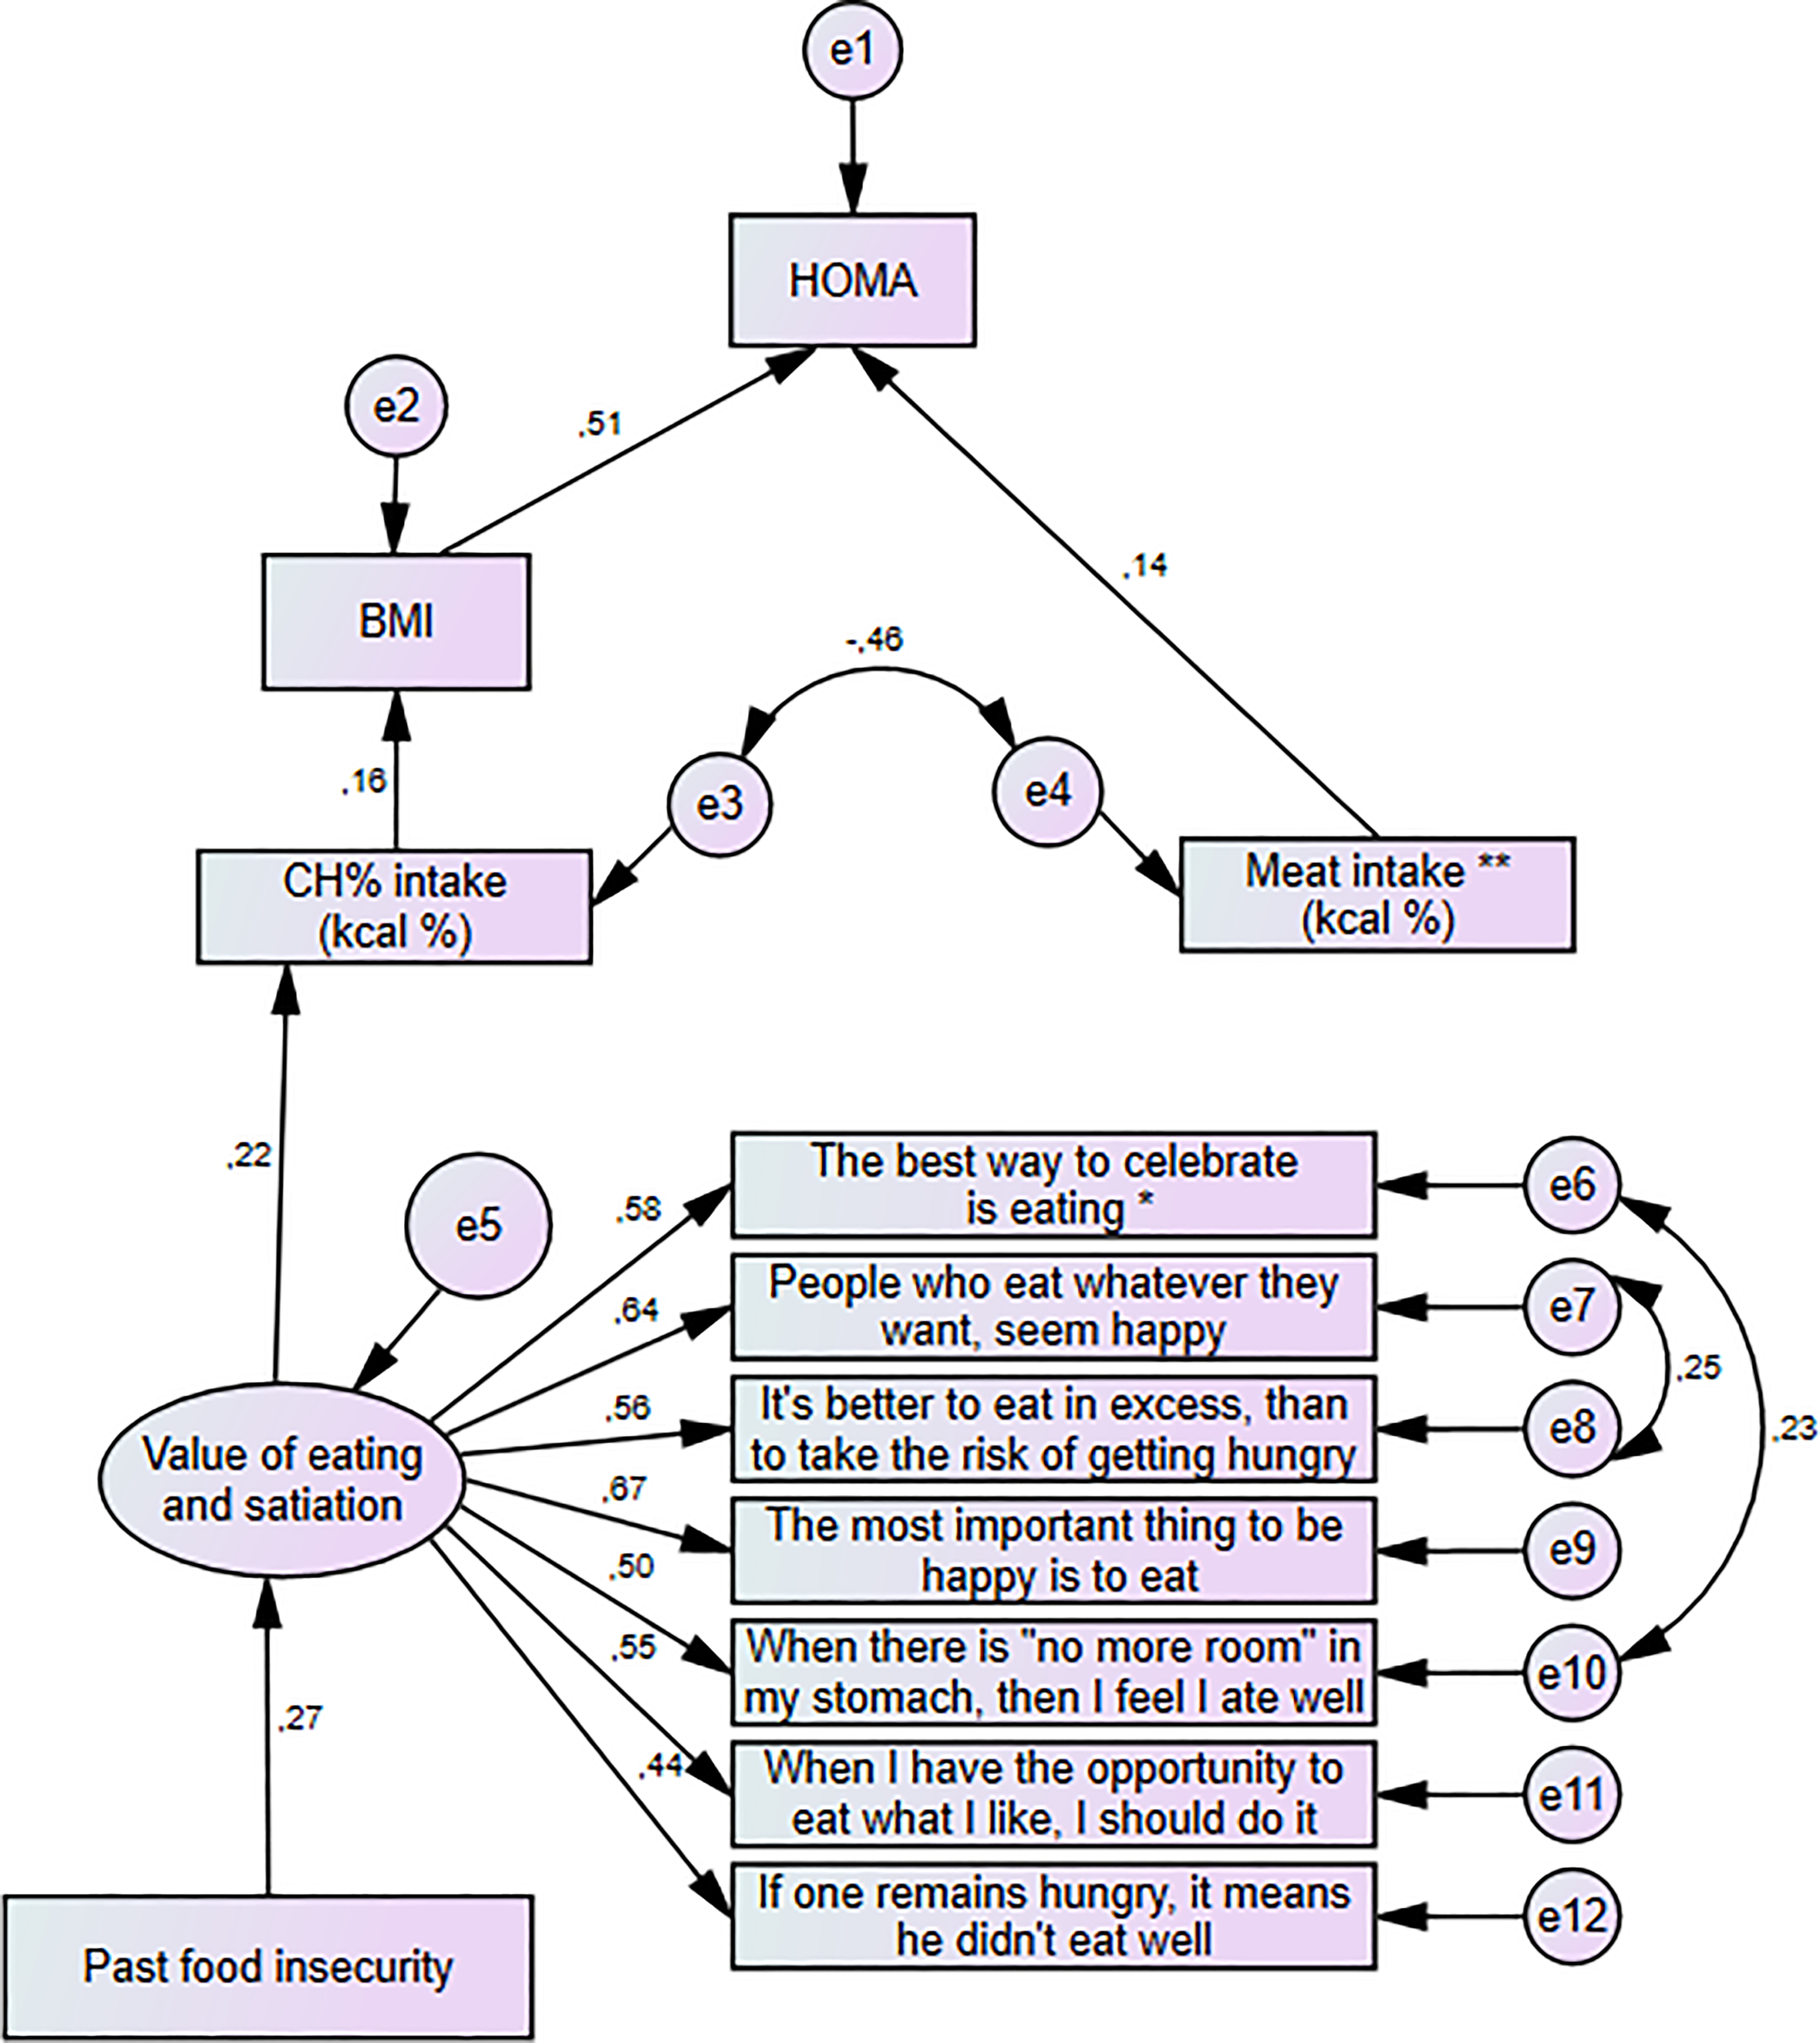
Structural equation model to predict HOMA in Mexican women. Values are standardized coefficients. *Translation of items to English has not been validated. HOMA indicates homeostasis model assessment.
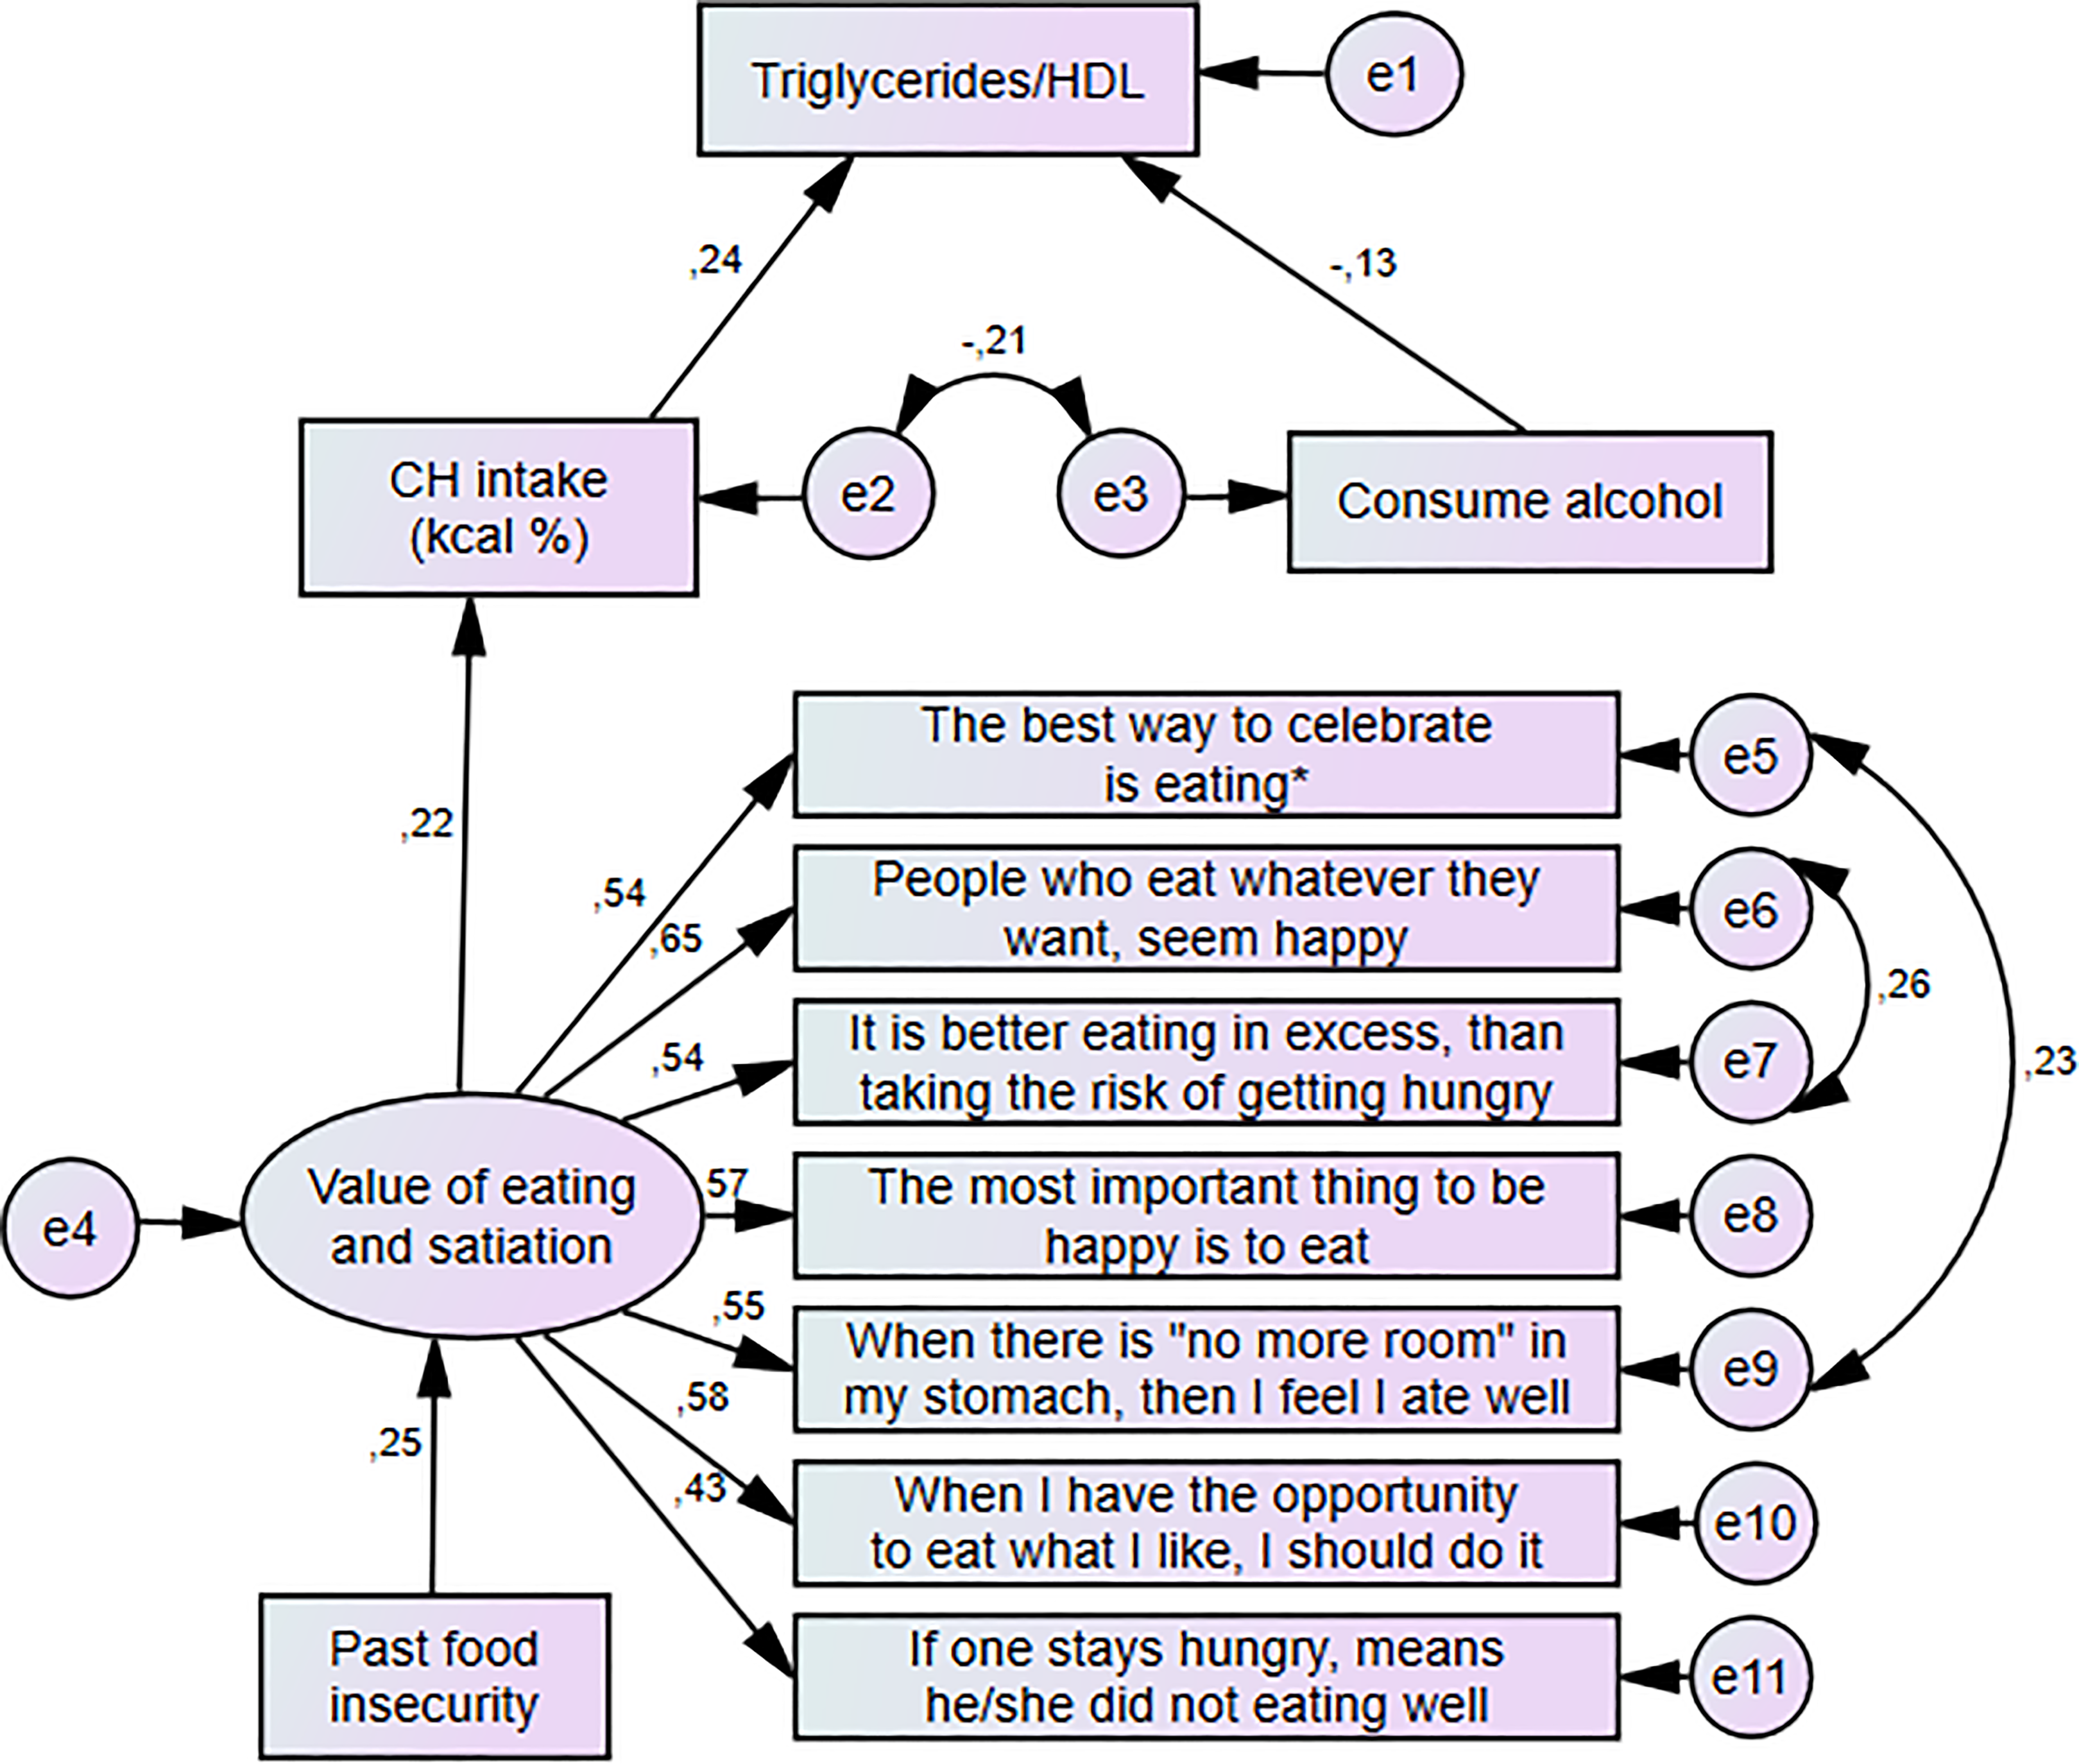
Structural equation model to predict triglyceride/HDL index in Mexican women. Values are standardized coefficients. *Translation of items to English has not been validated. HDL indicates high-density lipoprotein.
Goodness-of-Fit Measures of Models to Predict HOMA-IR and Triglyceride/HDL Index.a
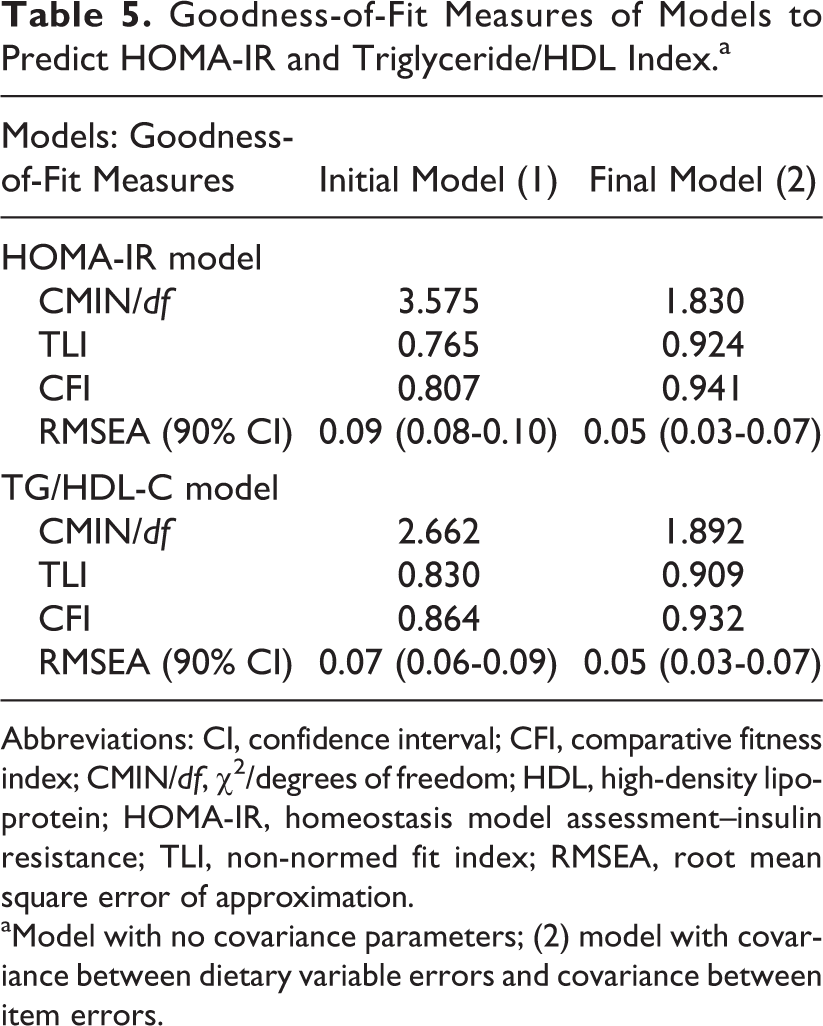
Abbreviations: CI, confidence interval; CFI, comparative fitness index; CMIN/df, χ2/degrees of freedom; HDL, high-density lipoprotein; HOMA-IR, homeostasis model assessment–insulin resistance; TLI, non-normed fit index; RMSEA, root mean square error of approximation.
aModel with no covariance parameters; (2) model with covariance between dietary variable errors and covariance between item errors.
Discussion
The purpose of this investigation was to assess the role of VES in order to explain the relationship between food insecurity, eating behavior, obesity, and cardiometabolic risk in women. After corroborating significant associations among the measured variables, 2 models confirmed the possible impact of past food insecurity on food intake, obesity, and cardiometabolic risk, through the overvaluation of eating and satiation.
We confirmed a strong association of socioeconomic environment with BMI. As has been documented, SES and household food insecurity seem to have a curvilinear relationship with BMI, 32,33 in which the middle SES population has the highest prevalence of obesity. Similarly, in this study, women in the lowest SES category did not show a higher average BMI than women in the medium and medium-low categories. This nonlinear relationship pattern was similar for BMI associated with the other socioeconomic variables, except for past food insecurity, whose relationship with BMI was straight linear. This means that the greater food insecurity a woman reported experiencing in her childhood, the greater BMI she had. In a previous publication, the VES scale was validated and associated with past food insecurity. 17 This study confirmed, in a different sample, the existence of an overvaluation of eating and satiation and its association with past food insecurity. This finding supports the theory stated by several authors regarding the association of certain cultural values formed early in a social environment, characterized by food deprivation, with obesity. 11,34
Although the relationship to VES of current household food insecurity was not as strong as that of past food insecurity, it certainly is another determinant of adverse eating behavior. Its association with obesity has been explained by the income administration strategies used by women with a limited purchasing power to choose low-cost food, disregarding nutrition quality. 7,8,35 However, VES, enhanced by previous experiences of food deprivation, may also be regulating current food choices by an emotional motivation. These results are consistent with Olson et al, 36 who affirmed that growing up poor may establish emotional attachments to food, such as an enhanced motivation to have an adequate food supply or excitement about having their preferred food available.
The characteristics of the diet that were associated with VES were similar to those documented as being associated with low SES groups in Mexico 7,9 : higher total energy intake, higher proportion of carbohydrates and added sugars, as well as lower intake of fish, fruits, and vegetables. Higher intake of carbohydrates and lower intake of alcohol were associated with high BMI and high TG/HDL-C, and a high intake of total energy and meat (except fish) were associated with HOMA-IR. These results were expected associations according to most documented research. 37 -39 Alcohol consumption among the studied women was not very high; the mean intake among the 55% of women who reported drinking alcohol was 4 drinks/wk. The inverse association of alcohol intake with TG/HDL-C and BMI may also result from the substitution of soft drinks with alcoholic beverages, resulting in a lower intake of sugar. 40 We would have expected an association between added sugars with cardiovascular risk or BMI; however, it is plausible that women underreported intake of high sugar products due to social approval bias.
The SEM had adequate goodness of fit, meaning that the models achieved a consistent reproduction of the data and clearly revealed the role of overvaluation of eating and satiation on carbohydrate intake and its impact on obesity and cardiometabolic risk. Several covariances were included in the model to improve goodness of fit; the covariance between carbohydrate and meat intake errors could be anticipated by the indirect association between consumption of both food groups due to their different economic accessibility. Furthermore, the covariance between items in the instrument occurred between those items that were placed together in the questionnaire; it is expected that those responses are correlated. All the standardized coefficients were statistically significant, and most of them were above 0.20, except for the coefficients related to the dietary variables, which were smaller, meaning that they slightly contributed to fit the model. This might be due to the natural bias of the reported dietary data, which is expected when utilizing an FFQ. 41
The strength of this study is the random sampling method that allowed us to recruit women from diverse socioeconomic environments. Thus, it enabled enough variability in the measured variables to detect significant associations in order to build the models that could represent underlying causes of cardiometabolic diseases. However, the results of this study should be generalized with caution since the population in Mexico and other countries may represent sociocultural environments different from those of the population in central Mexico.
Low SES suggests food insecurity, low education level, and even certain dietary qualities. However, SES was not included in the models because of the multicollinearity produced by its strong association with most studied variables. Moreover, this study establishes an explanation of the association of middle and middle-low SES with obesity-associated diseases. In addition, evidence from studies relating food stamps with the association between obesity and food insecurity, 11,42 as well as the high susceptibility of immigrants and refugees to become obese 43 might be explained by overvaluation of food together with increased access to food.
Nevertheless, other explanations of the relation between food insecurity, eating behavior, and altered metabolism should not be ignored. Since the study is cross-sectional, there is the possibility of the current eating behavior or VES being the result of the altered metabolism. The effects of metabolic hormones on satiation perception in the brain reward centers such as insulin and leptin are alternative reasons of the associations found in this study. Longitudinal studies that evaluate the effect of VES on eating behavior could contribute to validate the direction of causality in the theory presented in the present work.
Conclusion
Both models presented in this study support the theory that past experiences of food insecurity may set deep-rooted VES. Overvaluation of eating and satiation was associated with a high intake of sugars and starches that resulted in obesity and insulin resistance and a high TG/HDL-C index. The understanding of essential values that induce unfavorable eating behavior in a population that has experienced past food insecurity can help to explain the role of sociocultural values in the relationship between food insecurity and obesity. In countries where food deprivation has prevailed along with an increasing availability of palatable energy-dense foods, the core desires that influence food choice should be considered when developing public health strategies aimed at prevention of obesity and cardiometabolic complications.
Footnotes
Acknowledgments
The authors would like to thank Melissa H. Vallejo and Raul Montes for conducting the data collection and to the head teachers that kindly allowed us to receive the participants at their schools’ facilities. The authors also wish to recognize Patrick Weill for his assistance with the English language.
Declaration of Conflicting Interests
The author(s) declared no potential conflicts of interest with respect to the research, authorship, and/or publication of this article.
Funding
The author(s) disclosed receipt of the following financial support for the research, authorship, and/or publication of this article: The project was partially supported by the research network for Obesity Treatment and Prevention, financed by CONACYT, Mexico.