
Abstract
Background:
To characterize the scenario of food insecurity in Portugal at a time of economic crisis recovery is of the utmost relevance.
Objective:
This study aimed to estimate the prevalence and to identify the determinants of food insecurity during economic crisis recovery in a population-based urban sample of middle- and older-aged Portuguese adults.
Methods:
A cross-sectional study including 604 participants of the EPIPorto cohort was conducted. Data on sociodemographic characteristics and on food security status were collected. Food security status was assessed using the US Household Food Security Survey Module: Six-Item Short Form. Logistic regression models, crude and adjusted for sex, age, education, and household income perception, were performed.
Results:
The prevalence of food insecurity was 16.6%. Women (odds ratio [OR] = 1.96; 95% confidence interval [CI]: 1.09-3.54), those less educated (OR = 5.46; 95% CI: 2.84-10.46), and those who had the perception of an insufficient household income (OR = 10.39; 95% CI: 5.00-21.56) were more likely to belong to a food insecure household. Unmarried individuals (OR = 1.79; 95% CI: 1.05-3.06) and lower white-collar workers (OR = 2.22; 95% CI: 1.03-4.77) were also more prone to live within a food insecure household, regardless of sex, age, education, and household income perception.
Conclusions:
The obtained information is valuable for the development of intervention strategies to reduce food insecurity in middle- and older-aged adults, suggesting that women, unmarried, less educated individuals, less skilled workers, and lower income families should be targeted.
Introduction
Food insecurity (FI) is a worldwide public health problem. Highly prevalent among low- and middle-income countries, FI is also a relevant issue in high-income countries, 1 -5 due to the increasing trend in unemployment, poverty, and social inequalities derived from the global financial crisis. 6
Unemployment rates markedly increased during the economic crisis in Portugal. 7 Despite being transversal among different age groups, it has been shown to be a more relevant issue in middle-aged adults, due to the psychological consequences, their family responsibilities 8 and the greater difficulty in becoming reemployed, when facing unemployment. As middle-aged adults see their income reduced, they are more prone to experiencing FI. 9 Moreover, older-aged adults are vulnerable to FI, which was linked to physical limitations, health-related conditions, and social isolation. 10,11 As older-aged adults are more likely to have chronic disease, they could be faced to choose between food or medication, 12 a situation that probably worsened during the economic crisis.
In Portugal, according to the results from the Fourth National Health Survey (IV-NHS) (2005/2006), 13 about 1 in 6 citizens faced FI. 14 However, this survey was performed before the 2008 economic crisis. More recently, data from a national survey conducted during the period of full-blown economic crisis described a much higher prevalence of FI in 2013 (50.7%), 15 suggesting the influence of macroeconomic indicators on FI burden. Therefore, to monitor the prevalence of FI and its determinants in population-based studies is still required to inform national public health policies directed toward promoting food security for all, particularly among the mentioned age strata.
FI has been associated with a range of negative nutritional and health outcomes. 16,17 As a consequence of inaccessible or inadequate food supply, members of food insecure households tend to change their food habits and adopt inadequate and nutritionally poorer dietary patterns. 18 -20 This situation may increase the risk of overweight and obesity, which is known as the FI-obesity paradox. 18,20,21
One major and strong established determinant of FI is household income. 22,23 Also, neighborhood deprivation, 22 belonging to larger households, 24 being unmarried, 22 and less educated 14 are described to be associated with FI. Sex differences in FI have also been reported, being the prevalence higher in women. 14,22
Research on FI has been increasing, namely in population-based samples, however studies on FI are still greatly focused on disadvantaged populations, 25 -28 which reinforces the need for a deeper insight into the determinants of FI in urban populations from high-income countries, across a wide socioeconomic spectrum.
Therefore, and considering the aforementioned vulnerability of middle- and older-aged adults, this study aimed to estimate the prevalence and to identify the determinants of FI during the economic crisis recovery in a population-based sample of urban middle- and older-aged Portuguese adults.
Methods
Study Design and Participants
A cross-sectional study based on data from EPIPorto cohort was conducted. As previously described, 29 EPIPorto is a cohort of noninstitutionalized Portuguese Caucasian inhabitants of Porto, Portugal, assembled between 1999 and 2003 and aged 18 or more years at recruitment. Households were selected by random digit dialing of landline telephones. Within each household, a permanent resident was selected by simple random sampling. The participation rate at cohort assembling was 70% corresponding to 2485 participants. 29
The second evaluation took place between 2005 and 2008, including 1682 participants. A third evaluation occurred between 2013 and 2015, and 995 individuals were re-evaluated. As part of this third cohort evaluation, in addition to the face-to-face interviews on which sociodemographic data were collected, computer-assisted telephone interviews were conducted, between April 2014 and January 2016, with the purpose of food security status assessment. Of the 995 evaluated, 604 participants were included in the present study, as they fulfilled the inclusion criteria of to have 50 years of age or more and to be responsible or co-responsible for cooking and/or buying food for the household. 30
Regarding baseline characteristics, participants, in comparison with nonparticipants, had lower mean (standard deviation, SD) age (66.9 [8.4] vs 71.2 [12.5] years; P < .001) and were more educated (26.9% vs 19.6% with more than 12 years of schooling; P < .001). No significant differences for sex and working status (reported at third evaluation) were found.
The ethics committee of São João University Hospital, Porto approved the study. EPIPorto was approved by the Portuguese Data Protection Authority. All participants gave their written informed consent.
Data Collection
Data of the third EPIPorto evaluation were collected by trained interviewers using structured questionnaires.
Sociodemographic characteristics
Sex, age, and education, as completed years of schooling, were recorded. Education was categorized into “≤4 years,” “5 to 9 years,” “10 to 12 years,” and “>12 years.” Information regarding occupation was classified according to the 2010 Portuguese Classification of Occupations (PCO) 31 and further recategorized into 3 categories: upper white-collar, lower white-collar, and blue-collar. The upper white-collar category included Armed Forces Occupations, Managers, Professionals, and Technicians and associate professionals, corresponding to the upper 4 major groups of the PCO. The lower white-collar category consisted of Clerical support workers and Service and sales workers, classified in the fourth and fifth major groups of the PCO. Lastly, the blue-collar category encompassed participants from the sixth to ninth groups, namely skilled agricultural, forestry and fishery workers, craft and related trades workers, plant and machine operators and assemblers, and elementary occupations.
Regarding working status, individuals were classified as employed, unemployed, retired, and housewives.
Marital status was collected and classified into single, married or civil partnership, divorced, and widowed. Participants were also asked about the household size as the number of persons living in the household, which was categorized into 1 person, 2 persons, and ≥3 persons. Average household monthly income was recorded into the following categories: lower than €500, €500 to €1000, €1001 to €1500, €1501 to €2000, and higher than €2000. Information regarding the household income perception as “insufficient,” “need to be careful about expenses,” “enough to meet needs,” or “comfortable” was also collected.
Food security status assessment
Food security status was evaluated using the US Household Food Security Survey Module: Six-Item Short Form 32 derived from the original 18-Item US Household Food Security Survey Module, 33 which was translated to the Portuguese language by the research team (Cronbach α = .748).
With regard to the previous 12 months, individuals were asked about the food eaten in their households and whether they were able to afford the food they need. The participants’ households were classified into “food security” if the number of affirmative responses was equal to or less than one, “low food security” if there were between 2 and 4 affirmative responses or “very low food security” if the number of affirmative responses was 5 or 6. 32
Statistical Analysis
Continuous variables were summarized as mean and SD. Categorical variables were described as absolute and relative frequencies. Continuous variables were compared using Student’s t-test or analysis of variance, while, for proportions, the χ2 test, Fisher’s exact test, or the Monte Carlo simulation were used, as appropriate.
Unconditional logistic regression models were computed to assess the associations between food security status and sociodemographic variables. Odds ratios (ORs) and respective 95% confidence intervals (95% CIs) were estimated. For the purpose of regression analyses, food security status was classified into “food security” and “FI” (including both participants from low and very low food security categories). Covariates such as sex, age, marital status, education, occupation, working status, household monthly income, household income perception, and household size were tested, and the final model of adjustment included sex, age, education, and household income perception.
Statistical analysis was carried out using SPSS Statistics 25.0 (IBM Corp, Armonk, New York). A significance level of 5% was adopted.
Results
A larger proportion of individuals were women (67.9%) and, at the time of food security status evaluation, individuals had between 50 and 90 years of age (mean [SD] of 66.9 [8.4] years). Regarding food security status, 83.4% of individuals’ households were food secure, while 13.9% and 2.6% were classified as low and very low food secure, respectively.
Individuals from both low and very low food secure households had slightly higher mean age (P = .220) and were more frequently less educated (≤ 4 years of schooling; P < .001) and unmarried (P = .058) than participants from food secure households. Individuals belonging to low food secure households were more frequently lower white-collar workers (P < .001), had an average household monthly income between €500 and €1000 (P < .001) and were also more likely to refer need to be careful about expenses (P < .001) than individuals from food secure households. In contrast, participants from very low food secure households were more frequently blue-collar workers (P < .001), with an average household monthly income lower than €500 (P < .001), and were more prone to consider their household income as insufficient (P < .001) than individuals from food secure households (Table 1).
Sociodemographic Characterization According to Food Security Status Categories.
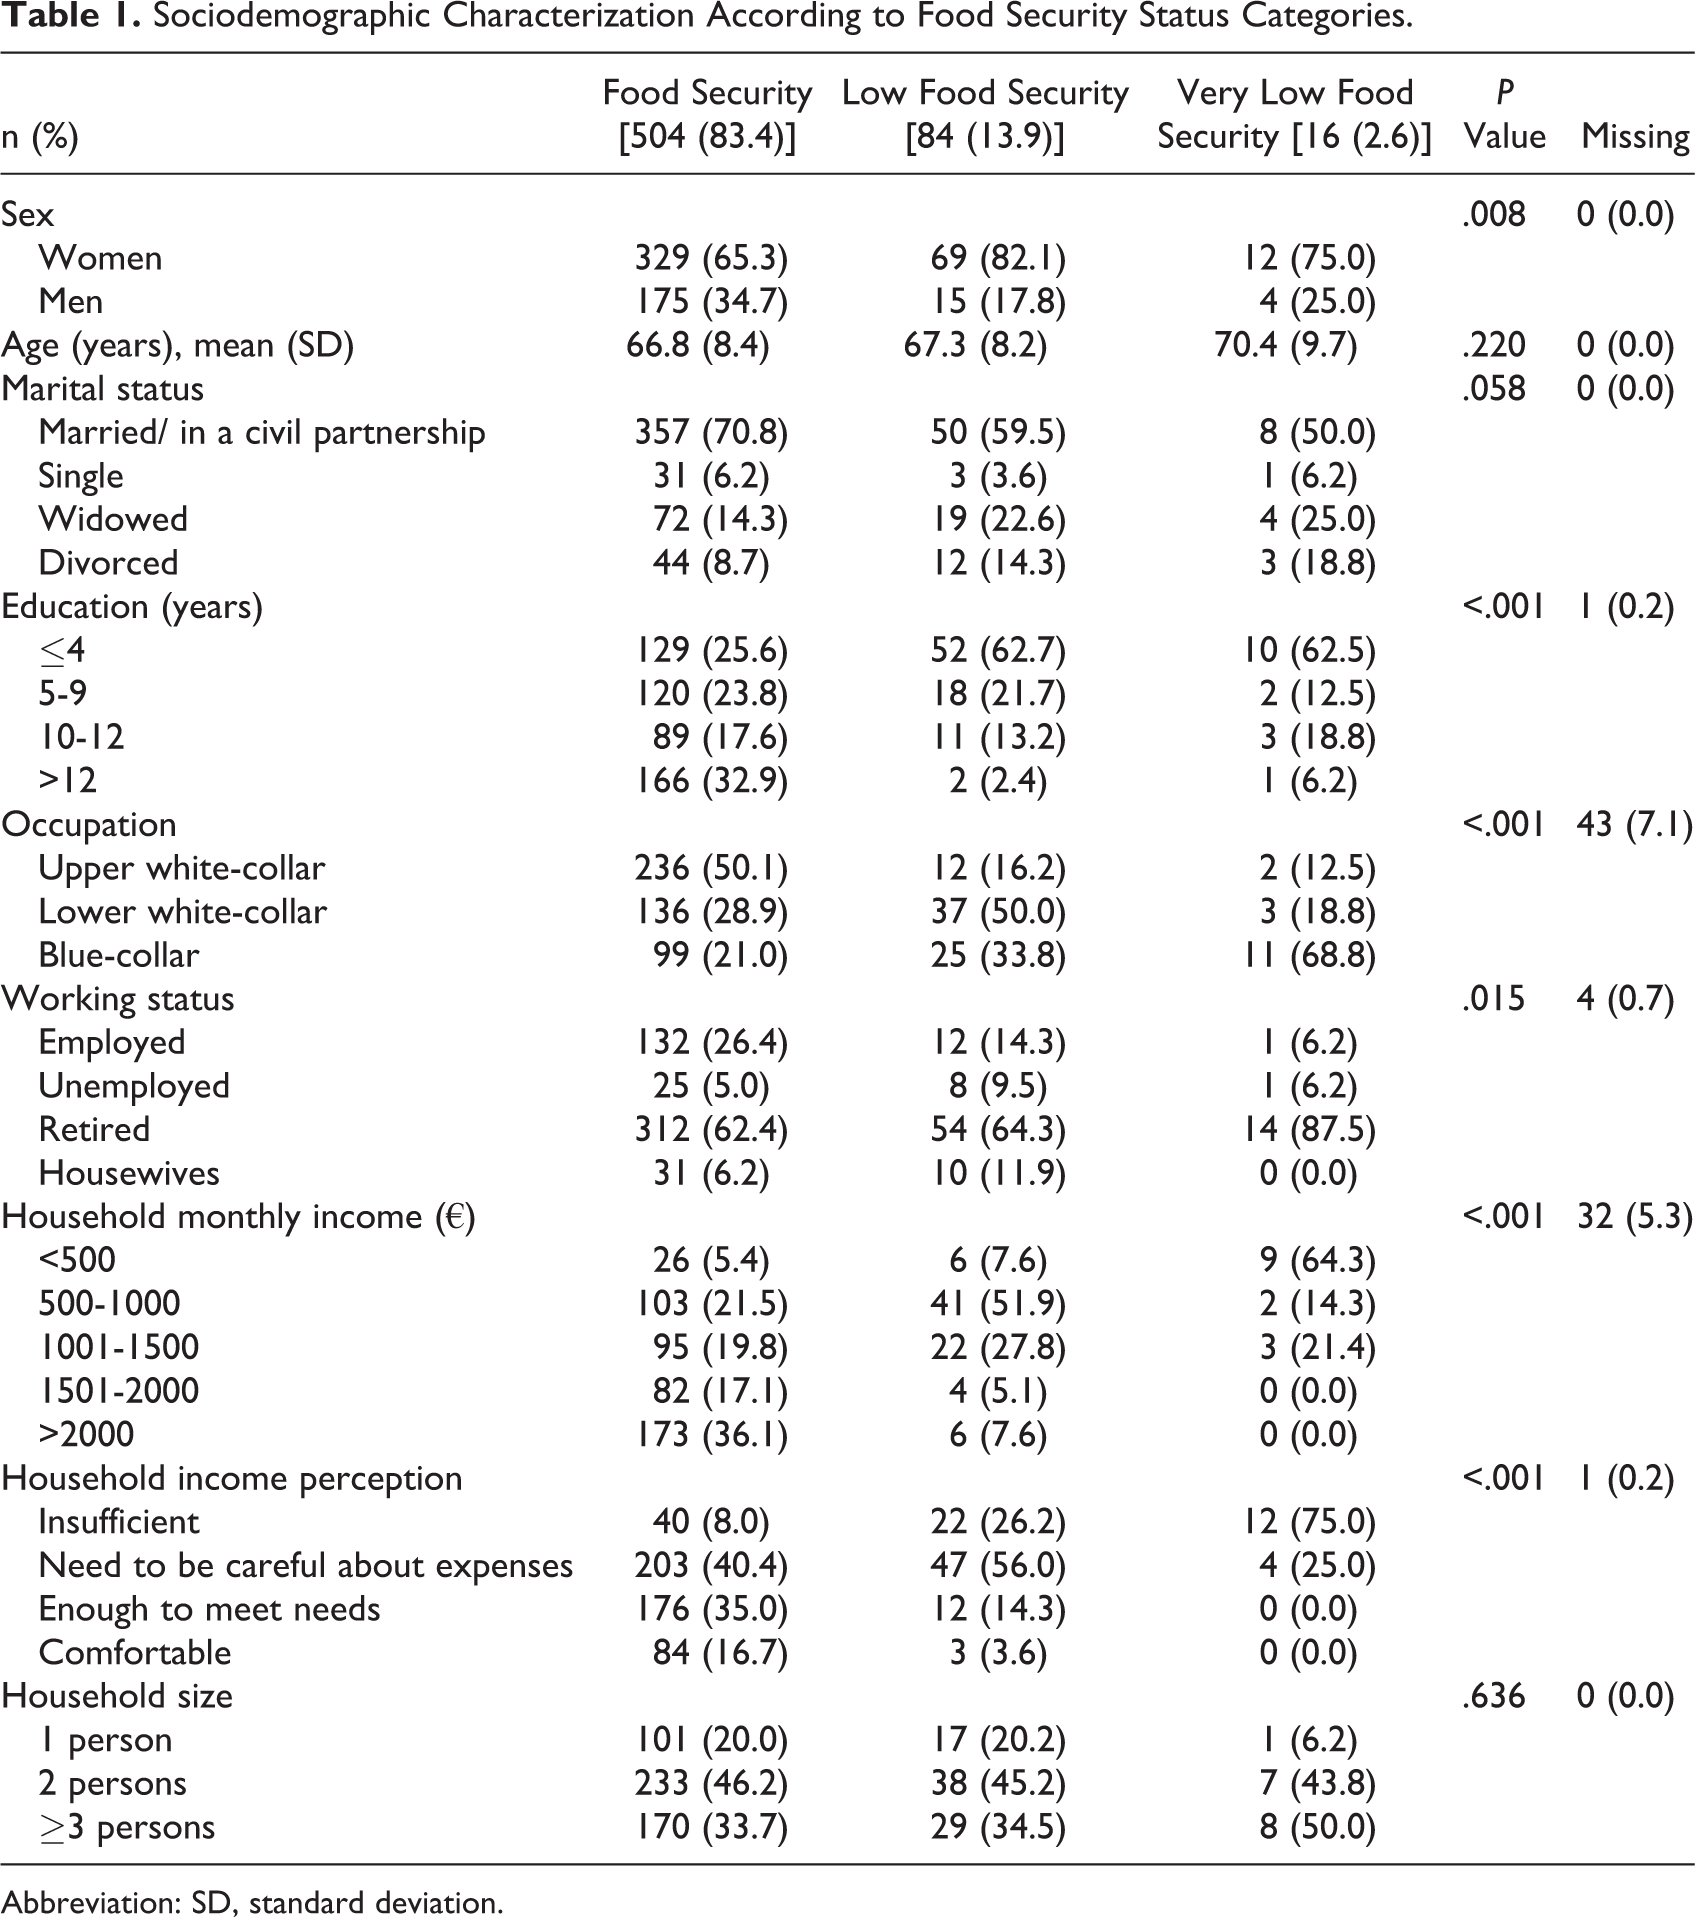
Abbreviation: SD, standard deviation.
Regarding the characteristics associated with FI, we observed that women (OR = 2.27; 95% CI: 1.33-3.86), less educated (OR = 7.21; 95% CI: 4.05-12.84), unmarried participants (OR = 1.76; 95% CI: 1.13-2.73), and lower white-collar (OR = 4.96; 95% CI: 2.60-9.44) or blue-collar workers (OR = 6.13; 95% CI: 3.17-11.86) had a higher odds of belonging to a food insecure household (Table 2). Also, to be unemployed (OR = 3.66; 95% CI: 1.41-9.46), retired (OR = 2.21; 95% CI: 1.18-4.14), or to be a housewife (OR = 3.28; 95% CI: 1.32-8.16), and reporting a low (OR = 11.46; 95% CI: 5.67-23.17) or an insufficient household income (OR = 14.73; 95% CI: 7.37-29.46) were significantly associated with FI (Table 2).
Sociodemographic Determinants of Food Insecurity.
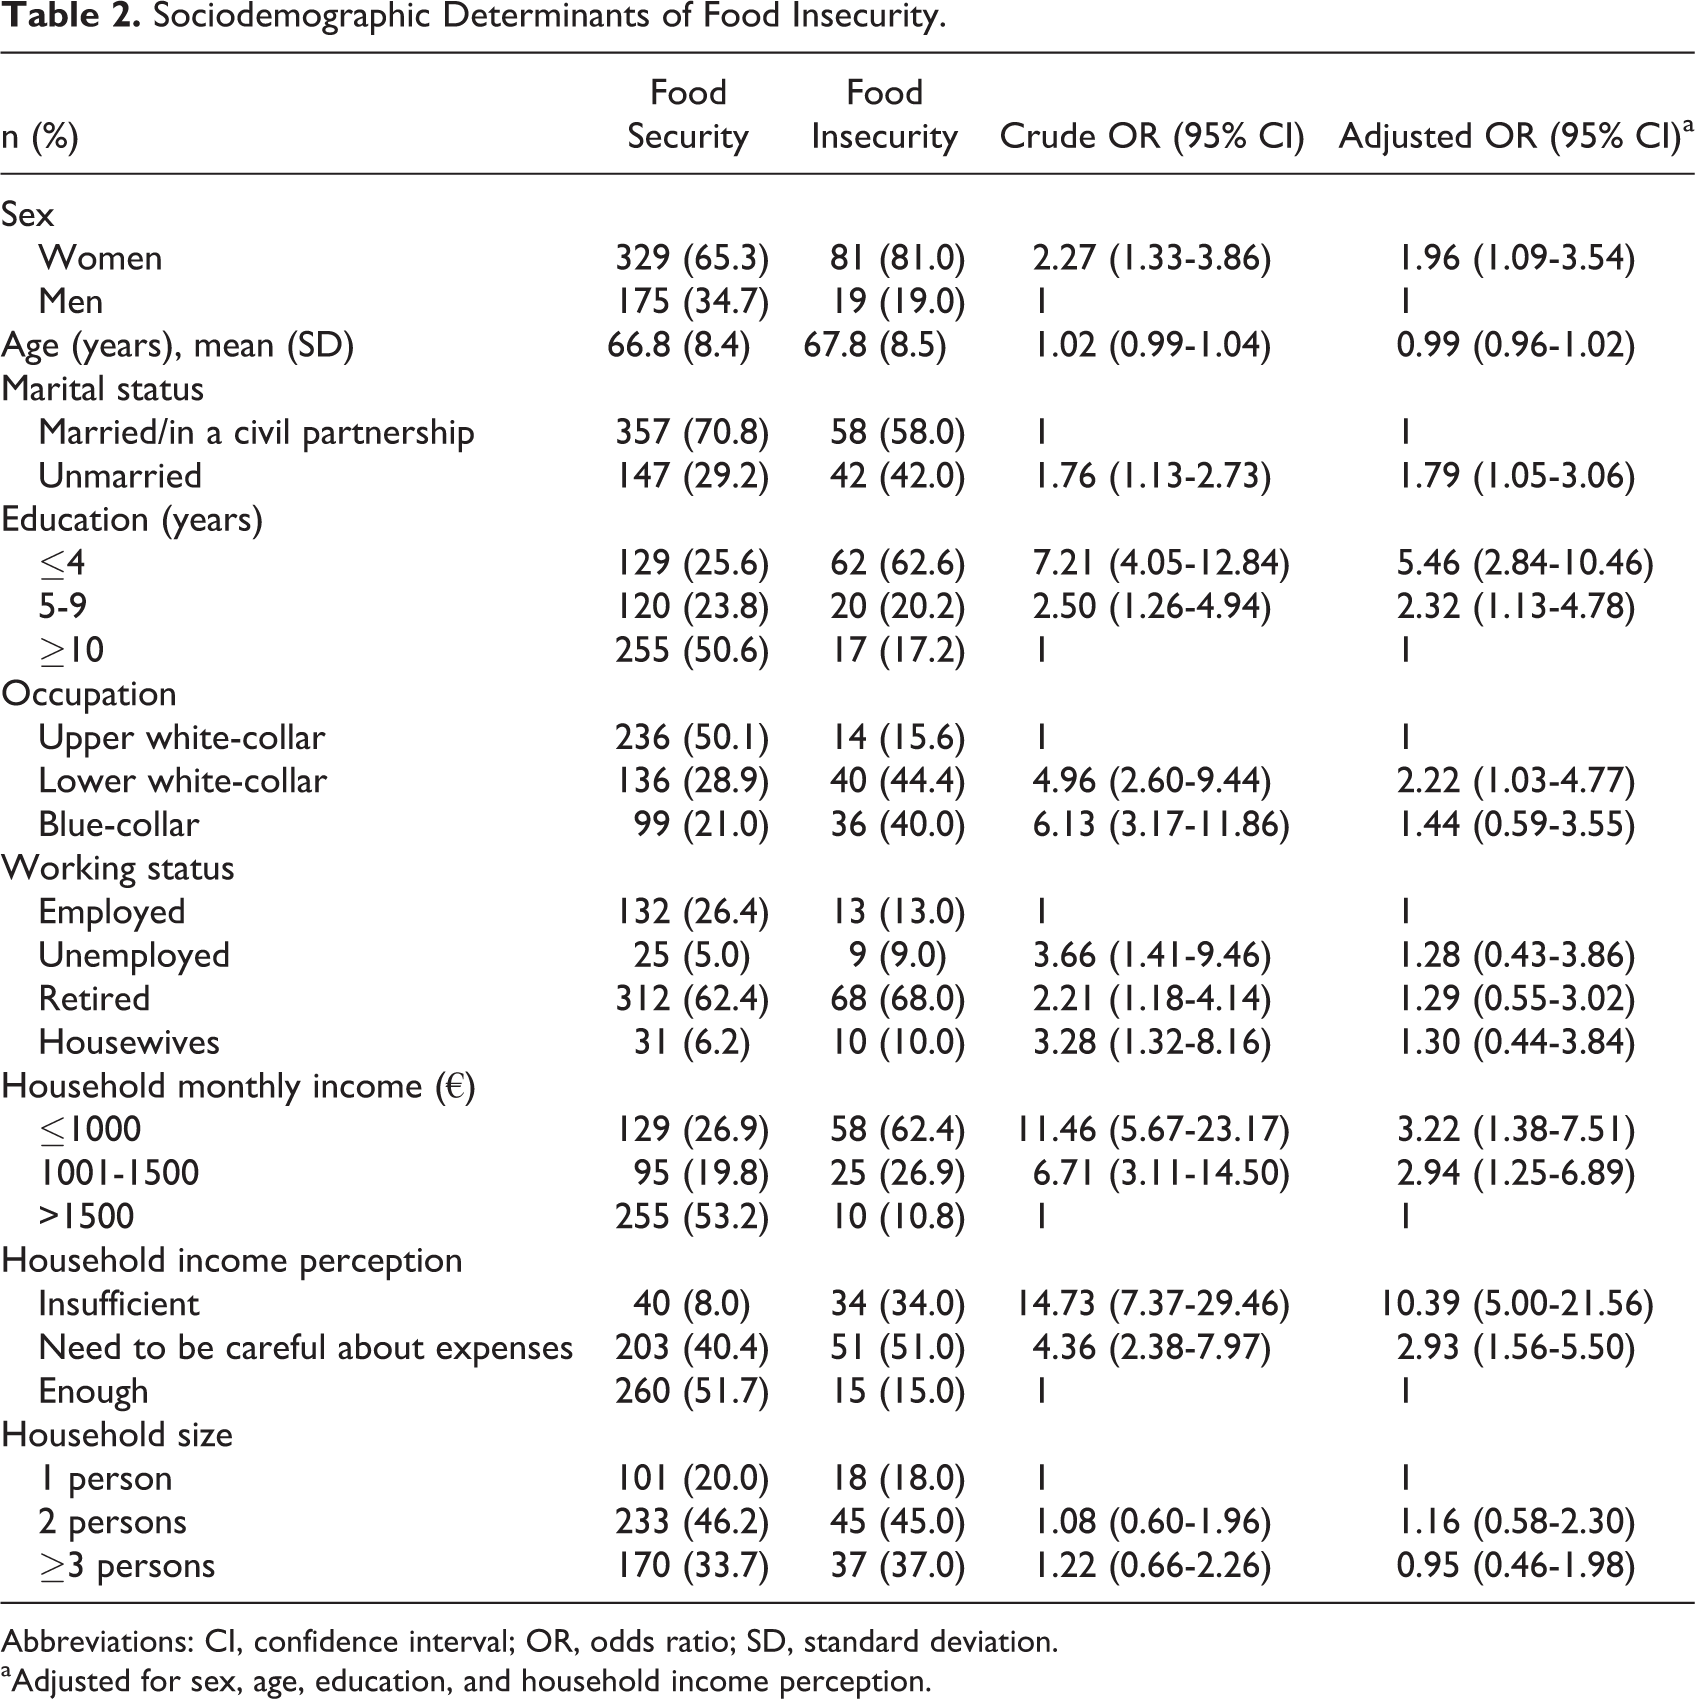
Abbreviations: CI, confidence interval; OR, odds ratio; SD, standard deviation.
aAdjusted for sex, age, education, and household income perception.
In multiple regression analyses, we observed that independently of sex, age, education and household income perception, unmarried individuals (OR = 1.79; 95% CI: 1.05-3.06), and lower white-collar workers (OR = 2.22; 95% CI: 1.03-4.77) were more prone to live within a food insecure household. To be woman (OR = 1.96; 95% CI: 1.09-3.54), as well as to be less educated (OR = 5.46; 95% CI: 2.84-10.46), remained significantly associated with FI, independently of age and household income perception. The perception of an insufficient household income was strongly and positively associated with FI (OR = 10.39; 95% CI: 5.00-21.56), regardless of sex, age, and education (Table 2).
Discussion
A relevant prevalence of FI (16.6%) was observed among middle- and older-aged adults of EPIPorto cohort.
Considering the importance of a periodical monitoring of FI, our study provides a relevant contribution regarding the scenario of FI and the identification of its determinants in Portugal during a particular period—the economic crisis recovery (namely characterized by a decrease in unemployment 7 )—using a population-based sample of middle- and older-aged urban adults from different socioeconomic positions.
Our estimate was identical to the prevalence of FI previously described in the Portuguese households, assessed through the same scale, in the IV-NHS (2005-2006). 14 This could suggest a similar burden of FI as in previous years of the economic crisis. The observed discrepancies in the prevalence of FI cannot be solely attributed to the study year. In 2003, a Portuguese survey only using a single question reported 8.1% of FI. 34 More recently, INFOFAMÍLIA survey—a monitoring system conducted annually in Portugal—has shown a prevalence of FI of 48.6%, 49.1%, 50.7%, and 45.8% in 2011, 2012, 2013, 15 and 2014, 35 respectively. These estimates are much higher than our FI prevalence, even for the Northern region (46.0%, 49.1%, and 50.7% in 2011, 2012, and 2013, respectively). 15 However, the INFOFAMILIA sample, when compared to ours, is comprised of a lower proportion of higher educated and retired people and of a higher proportion of unemployed individuals. 36 Even that, a recent study reported an FI prevalence of 27.9% for Portuguese individuals aged 50 years and older, using an adapted version of the Brazilian Food Insecurity Scale. 37
As this comparison shows differences in prevalence estimates could be also considered as a consequence of diversified methodology in evaluating FI. Actually, the IV-NHS used the US Household Food Security Survey Module: Six-Item Short-Form as we did, while the INFOFAMÍLIA survey applied an adapted version of the Brazilian Food Insecurity Scale. Thus, caution is needed when comparing the results from different studies, mainly when different scales to evaluate FI are used. Likewise, it is worth noting that the methods concerning the selection of participants were different in IV-NHS and INFOFAMÍLIA.
Nonetheless, among more recent studies, even using the same scale, differences in the prevalence of FI are observable. Using the US Household Food Security Survey Module, a prevalence of FI of 12.7% in the United States, 38 8.3% in Canada, 39 and 6.3% in the metropolitan area of Paris 4 were estimated, although a modified version of the US Household Food Security Survey Module was used in this last study. All these estimates were lower than the prevalence of FI that we estimated. Even when comparing to France that has a similar Gini coefficient—as a general measure of income inequality at country level—to Portugal, 40 there are differences in the prevalence of FI, which suggests the role of other socioeconomic determinants beyond income.
In our sample, FI seemed to be determined by different sociodemographic characteristics. At a time of economic crisis recovery, we observed that to be woman, unmarried, less educated, and having a lower white-collar occupation, as well as to have a perception of insufficient household income, showed to be associated with FI. These results are in accordance with findings from studies from Portugal 14,37 and from other countries. 4,22,28
Women were more likely to be food insecure, as they have an increased awareness of their household’s food supply and concern with the protection of all household members, which may lead to a stronger willingness to abdicate their food intake in favor of other family members. 22
As expected, the perception of an insufficient household income revealed to be strongly and positively associated with FI, even more than household monthly income. In our analysis, although household monthly income and household income perception were closely related, household income perception may represent a more accurate measure of the economic situation of the household since it probably reflects the adequacy of the household income to the needs. 41
Regarding occupation, in the final adjusted model, only lower white-collar workers remained significantly associated with FI, which is in agreement with a previous study conducted in France. 4 Lower educational level also remained a strong determinant of FI independent of sex, age, and household income perception.
Contrarily to previous evidence, 24 household size was not significantly associated with FI. In our sample, the majority of participants belong to a single or a two-person household (65.7%). Thus, it is possible that low variability concerning household size may have contributed to the absence of differences in food security status.
As opposed to previous results, 4,24,42 in our study, we did not observe significant findings concerning age. Differences in these results can be partly explained by the age range of our sample (50-90 years old), which is less heterogeneous than in other studies. Additionally, even though Markwick et al 24 had pointed out that younger individuals are more prone to be food insecure, when comparisons were established with those aged 55 to 64 years to those aged 65 years and older, no significant differences were observed, which corroborates our results.
This study confirms findings from previous studies that individuals from less favorable socioeconomic contexts seemed to be more prone to FI. These results portray the need for the development of public health policies to support these populations in order to diminish its FI burden, particularly in countries facing periods of economic vulnerability.
This study had some limitations that ought to be mentioned. One of the limitations is its cross-sectional design, which does not allow for inference about causality. In addition, the possibility of bias cannot be discarded. Although food security data were collected by computer-assisted telephone interview, one cannot preclude the occurrence of social desirability bias, but we believed that its impact was small. As FI is a delicate issue, misclassification of participants may have occurred, as individuals may have omitted the real condition of their household, which could have led to an underestimation of the FI. Also, information was self-reported, as FI is usually evaluated, but we cannot discard that individuals could describe their households as more or less food insecure than it was in reality. 43 Subsequent losses throughout follow-up or unavailability/refusal to respond are more frequent in individuals from lower socioeconomic position, which may have led to an underestimation of the FI burden. When we compared participants and nonparticipants, statistically significant differences were observed for age and education, being the participants younger and more educated than nonparticipants. The differences could be justified since more educated individuals are more likely to accept to participate. Finally, we have to acknowledge that the US Household Food Security Survey Module: Six-Item Short-Form is not fully validated for this sample. Nevertheless, the Cronbach α was calculated (α = .748) and indicated a good internal consistency. 44
This study is strengthened by the fact that data were obtained from a large population–based urban cohort, located in a high-income country, while previous studies were more focused in more deprived, disadvantaged, or vulnerable settings. It is also noteworthy that we have used a widely accepted tool, 32,33 translated to Portuguese, for the assessment of FI, which allows comparisons with results from other settings. Despite the US Household Food Security Survey Module: Six-Item Short-Form does not include questions regarding food security in children, we believe this fact may have not impacted in our estimates, as the selected EPIPorto participants were older (≥50 years of age) and mainly belonging to single or two-person households (65.7%), thus the household is unlikely to be composed of children. Additionally, the methodological option of restricting the food security survey to participants who were responsible or co-responsible for cooking and/or buying food for the household may have increased the accuracy of our estimate of household FI prevalence.
At a time of economic crisis recovery, a considerable prevalence of FI was observed among middle- and older-aged adults in a large Portuguese urban center. The obtained information is valuable for the development of intervention strategies to reduce FI in adults, suggesting that women, unmarried, lower educated individuals, less skilled workers, and lower income families should be targeted.
Footnotes
Acknowledgments
The authors gratefully acknowledge the participants enrolled in EPIPorto for their kindness, and all members of the research team for their enthusiasm and perseverance.
Declaration of Conflicting Interests
The author(s) declared no potential conflicts of interest with respect to the research, authorship, and/or publication of this article.
Funding
The author(s) disclosed receipt of the following financial support for the research, authorship, and/or publication of this article: This work was supported by contributions from Iceland, Liechtenstein, and Norway through the European Economic Area Grants, under the Public Health Initiatives Programme (PT 06, grant number 118SI2). This study was also funded by the Unidade de Investigação em Epidemiologia - Instituto de Saúde Pública da Universidade do Porto (EPIUnit) (POCI-01-0145-FEDER-006862; Ref.UID/DTP/04750/2013), the PhD Grant SFRH/BD/117371/2016 (IM), PhD Grant SFRH/BD/92370/2013 (TM), and the Postdoc Grant SFRH/BPD/88729/2012 (RL)), co-funded by the FCT and the POCH/FSE Program; and the FCT Investigator contract IF/01060/2015 (ACS). This study is also a result of the project DOCnet (NORTE-01- 0145-FEDER- 000003) supported by Norte Portugal Regional Operational Programme (NORTE 2020), under the PORTUGAL 2020 Partnership Agreement, through the European Regional Development Fund (ERDF).