
Abstract
Background:
Adolescence presents an opportunity to influence diet, which impacts present and future health outcomes, yet adolescent diets globally are poorly understood.
Objective:
We generate evidence on adolescent diets globally and explore patterns and trends by subpopulation.
Methods:
We estimated mean frequency of consumption and prevalence of less-than-daily fruit and vegetable consumption, at-least-daily carbonated beverage consumption, and at-least-weekly fast-food consumption among school-going adolescents aged primarily 12 to 17 years from the Global School-based Student Health Surveys in Africa, Asia, Oceania, and Latin America between 2008 and 2015. Random-effects meta-analysis was used to pool estimates globally and by subgroup.
Results:
On average, adolescents consumed fruit 1.43 (95% confidence interval [CI] 1.26–1.60) times per day, vegetables 1.75 (1.58–1.92) times per day, carbonated soft drinks 0.99 (0.77–1.22) times per day, and fast food 1.05 (0.78–1.32) times per week. Overall, 34.5% (95% CI 29.4–39.7) consumed fruit less than once per day, 20.6% (15.8–25.9) consumed vegetables less than once per day, 42.8% (35.2–50.7) drank carbonated soft drinks at least once per day, and 46.1% (38.6–53.7) consumed fast food at least once per week. Mean daily frequency of fruit consumption was particularly low in South and East Asia (1.30 [1.02–1.58]); carbonated soft drink consumption high in Latin America (1.54 [1.31–1.78]), high-income countries (1.66 [1.29–2.03]), and modern food system typologies (1.44 [0.75–2.12]); and mean weekly fast food consumption high in mixed food system typologies (1.29 [0.88–1.71]).
Conclusions:
School-going adolescents infrequently consume fruits and vegetables and frequently consume carbonated soft drinks, but there is wide variability by subpopulation.
Keywords
Introduction
Adolescence is a window of opportunity to influence eating patterns and nutritional status, which can have a lasting impact on future health outcomes. 1 -3 Yet we are failing to support optimal nutrition among a great proportion of the largest generation of adolescents in history (1.8 billion). 4,5 Adolescent diets are typically characterized by low intakes of fruits and vegetables and high intakes of energy-dense, nutrient-poor foods, including sweet and salty items, sugar-sweetened beverages, and fast foods. 5,6 Anemia and micronutrient deficiencies are widespread among adolescent boys and girls, having profound impacts on their quality of life and risk of premature death as well as the health of future generations. 7,8 At the same time, overweight and obesity are increasing among adolescents in most regions of the world. 9 -11 Obesity during childhood and adolescence is associated with increased risk of noncommunicable diseases including hypertension, atherosclerosis, nonalcoholic fatty liver disease, and metabolic syndrome. 12 -14
Dietary quality plays a key role in these forms of malnutrition among adolescents. Fruits and vegetables are rich in micronutrients, fiber, and beneficial bioactive compounds. 15 High intakes of fruits and vegetables are associated with increased blood vitamin concentrations among European adolescents, 16 and low intakes are a major contributor to the global burden of disease, particularly noncommunicable diseases. 17 Sugar-sweetened carbonated soft drinks generally contain trivial amounts of nutrients and high amounts of sugar. Consumption of sugar-sweetened beverages, including carbonated soft drinks, is strongly associated with obesity and type 2 diabetes in adolescents. 18 Most fast foods are energy-dense and nutrient-poor, high in refined grains, sodium, and sugar and low in fruits and vegetables. 19 -21 Fast-food consumption among adolescents is associated with obesity and metabolic markers of diabetes and cardiovascular disease. 22,23
While there is growing global evidence for adult dietary patterns, 24 there is limited evidence on adolescent diets. A recent systematic review provided an overview of the scientific literature on dietary patterns of adolescent girls in low- and middle-income countries, but this study contained mostly non-nationally representative studies and excluded boys. 6 A meta-analysis of the prevalence of risk factors for cardiovascular disease included pooled estimates of combined low fruit and vegetable intake, defined as consuming fruits or vegetables less than 5 times per day, among school-going adolescents aged 12 to 15 years between 2003 and 2011. 25 But this analysis did not include estimates of carbonated soft drinks or fast food; excluded adolescents aged 10 to 11 years and 16 to 19 years; did not analyze fruit and vegetable consumption separately; and used only a dichotomous outcome that disposes useful information. An analysis of the 2010 Health Behavior in School-aged Children (HBSC) study provided insight into the frequency of fruit and vegetable consumption in 33 mostly high-income countries in North America and Europe, but these findings are not generalizable to low- and middle-income countries. 26 To our knowledge, there have been no other global dietary assessments or reviews of adolescent diets.
There has been a recent surge in interest in adolescent nutrition, which has generated evidence reviews, 27 -29 new global guidelines, 30 international meetings, 31 -33 donor commitments, and political will to institute new policies and programs specifically for adolescents. 34 But the evidence base on adolescent diets does not currently support informed decision-making. To strengthen efforts to generate global evidence on adolescent diets and nutrition, we estimated mean frequency of consumption as well as prevalence of less-than-daily fruit and vegetable consumption, at least daily carbonated beverage consumption, and at least weekly fast-food consumption among adolescents from 72 countries. We use random-effects meta-analysis to pool estimates globally and by region, income group, and food system typology (FST) 35 and test for differences between the subgroups.
Methods
Overview
Global School-based Student Health Surveys (GSHSs) are nationally representative self-administered questionnaires of school-going adolescent boys and girls of all ages (primarily 12-17 years). Respondents were asked “during the past 30 days, how many times per day do you usually eat” fruit, vegetables, and carbonated soft drinks (excluding diet soft drinks). Adolescents were also asked “during the past 7 days, on how many days did you eat food from a fast food restaurant?” Country-specific examples for all foods were provided for clarity. The GSHSs have been conducted largely in middle-income countries in Asia, Africa, and South and Central America but include countries of all income groups. At the time of writing, the most recent surveys with data available were from 2015. We excluded studies before 2008. If more than 1 survey was conducted in the same country, only the most recent survey was included. This allowed us to analyze 72 studies for frequency of fruit and vegetable consumption and 64 for frequency of carbonated soft drink and fast-food consumption.
All World Health Organization (WHO) regions except Africa had 50% or more countries sampled out of the total for each region: 10 of 47 in Africa, 22 of 35 in the Americas, 15 of 21 in the Eastern Mediterranean, 6 (5 for carbonated soft drinks and fast food) of 11 in South and East Asia, and 19 (16 for carbonated soft drinks and fast food) of 27 in the Western Pacific. Middle-income countries were oversampled, but there were at least 6 in each income group: 8 (6 for carbonated soft drinks and fast food) in low-income, 29 (26 for carbonated soft drinks and fast food) in lower middle-income, 18 (17 for carbonated soft drinks and fast food) in upper middle-income, and 10 in high-income countries. Data were also analyzed by broad FST, where countries were classified into traditional, mixed, or modern by the High-Level Panel of Experts on nutrition and food systems. 35 In making these classifications, the panel considered characteristics from the food supply chain, which included production (availability); storage and distribution; processing and packaging; and retail and markets, as well as from the food environment, which included availability and physical access (proximity); economic access (affordability); promotion, advertising, and information; and food quality and safety. 35 Mixed FSTs were oversampled, but there were at least 5 in each group: 8 (7 for carbonated soft drinks and fast food) in traditional, 29 (24 for carbonated soft drinks and fast food) in mixed, and 5 in modern FSTs.
Data Analysis
We calculated mean frequency and prevalence estimates with corresponding 95% CIs for each country, using sample weights to account for stratification and clustering in the survey design. All prevalence variables were coded to represent a less healthy behavior: consuming fruit less than once per day, vegetables less than once per day, carbonated soft drinks at least once per day, and fast food at least once per week. We dichotomized outcomes as such to allow for contrasting comparisons between countries and groups and to present general consumption patterns. There are no clear cutoffs for frequency of consumption of these foods and health outcomes among adolescents, since studies finding associations between health outcomes and foods consumed are primarily based on quantities consumed.
Random-effects meta-analysis was conducted to pool estimates overall, since the true frequency of consumption was expected to vary between studies. 36 Individual studies were weighted according to their national population totals of adolescents aged 13 to 17 years in 2015 37 rather than their sample sizes, which are not reflective of the relative size of different national adolescent populations. Variance in the raw prevalences was stabilized using a double arcsine transformation and back-transformed by the inverse of the double arcsine transformation using the harmonic mean of the sample sizes. 38,39 I 2 was calculated to present the percentage of variability due to study heterogeneity. F tests (allowing a variable τ 2 ), which are similar to the Knapp and Hartung method 40 and generally result in more conservative P values than χ2 tests, were used to test for overall differences between groups (region, income, and FST) and subgroups (sex). 36,41 Any outcome variables with an F test P value below 0.05 were subsequently tested for pairwise comparisons between specific groups using the Holm adjustment 42 to account for type I errors when testing multiple hypotheses simultaneously. Univariate meta-regression 43 was conducted to detect trends for World Bank income group and FST: We fit bivariate linear and cubic spline models to the data and performed a Wald-type test for linear trend. 41 All analyses were performed using R (version 3.5.1).
Results
Of the 94 countries screened, 72 studies contained data on frequency of fruit (N = 254 331) and vegetable (N = 254 135) consumption and 64 on frequency of carbonated soft drink (N = 241 784) and fast-food consumption (N = 241 991). Twenty-two were excluded since they were conducted before 2008. Table 1 shows the summary characteristics for each study. On average, adolescents consumed fruit 1.43 (95% confidence interval [CI] 1.26-1.60) times per day, vegetables 1.75 (1.58-1.92) times per day, carbonated soft drinks 0.99 (0.77-1.22) times per day, and fast food 1.05 (0.78-1.32) times per week (Figure 1). Overall, 34.5% (95% CI 29.4-39.7) consumed fruit less than once per day, 20.6% (15.8-25.9) consumed vegetables less than once per day, 42.8% (35.2-50.7) consumed carbonated soft drinks at least once per day, and 46.1% (38.6-53.7) consumed fast food at least once per week (Figure 2). Heterogeneity of consumption between studies was very high—I2 was at least 98.5% for mean and 99.3% for prevalence for all foods (Figures 1 and 2). Prevalence of less-than-daily fruit and vegetable consumption ranged from 17.7% (15.2-20.3) and 8.2% (6.7-9.8), respectively, in Algeria in 2011 to 61.7% (59.2-64.2) and 62.9% (60.5-65.2) in Maldives in 2014 (Supplemental Figures 1 and 2). At least daily carbonated soft drink consumption ranged from 22.2% (19.2-25.3) in Kiribati in 2011 to 80.4% (77.3-83.3) in Suriname in 2009 (Supplemental Figure 3). At least weekly fast-food consumption ranged from 20.9% (17.6-24.4) in Pakistan in 2009 to 85.8% (83.3-88.0) in Qatar in 2011, both countries in the same region (Supplemental Figure 4). F tests revealed no significant differences in consumption between boys and girls overall or by region, income, or FST (data not shown). However, there were notable differences by sex in individual countries. For example, in Pakistan, a higher proportion of boys consumed fruit less than once per day (40.3% [33.3-47.4]) than girls (20.4% [16.5-24.6]), while a lower proportion of boys than girls drank carbonated soft drinks at least once per day (28.1% [22.9-33.7] versus 49.2% [44.1-54.4], respectively; Supplemental Figures 1 and 3).
Summary Characteristics of Country Data Sets Included in the Meta-Analysis.a
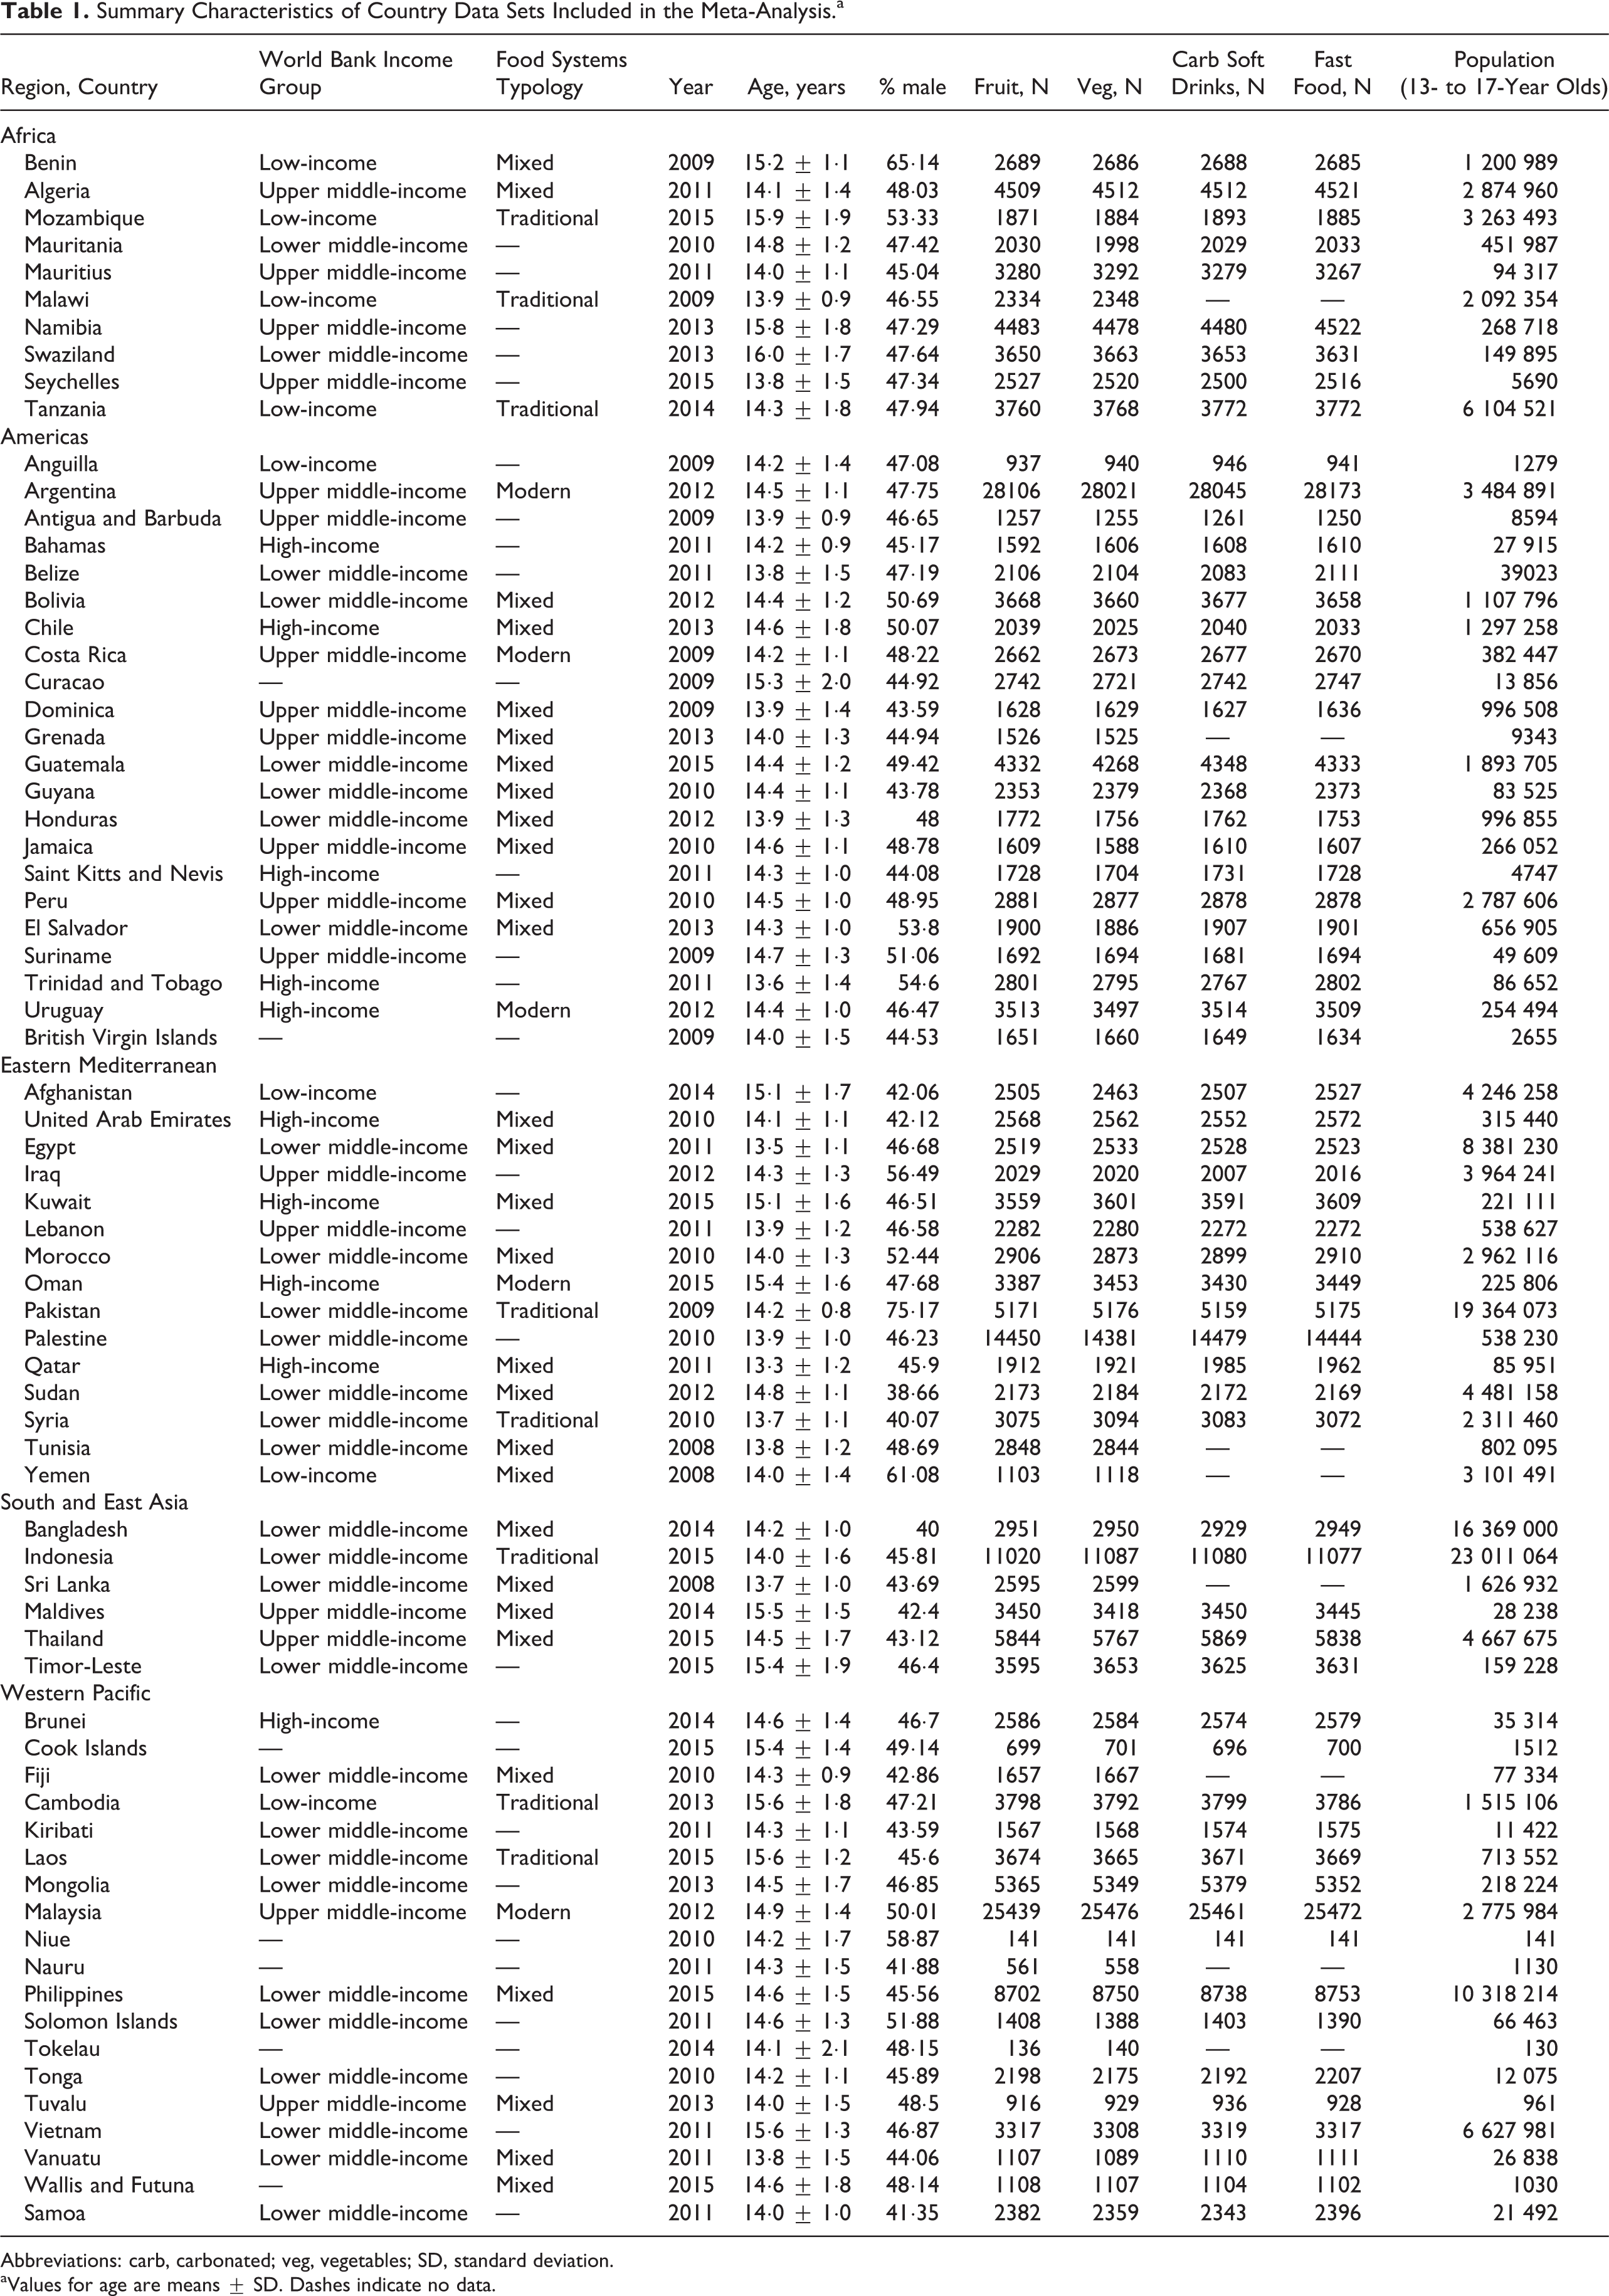
Abbreviations: carb, carbonated; veg, vegetables; SD, standard deviation.
aValues for age are means ± SD. Dashes indicate no data.
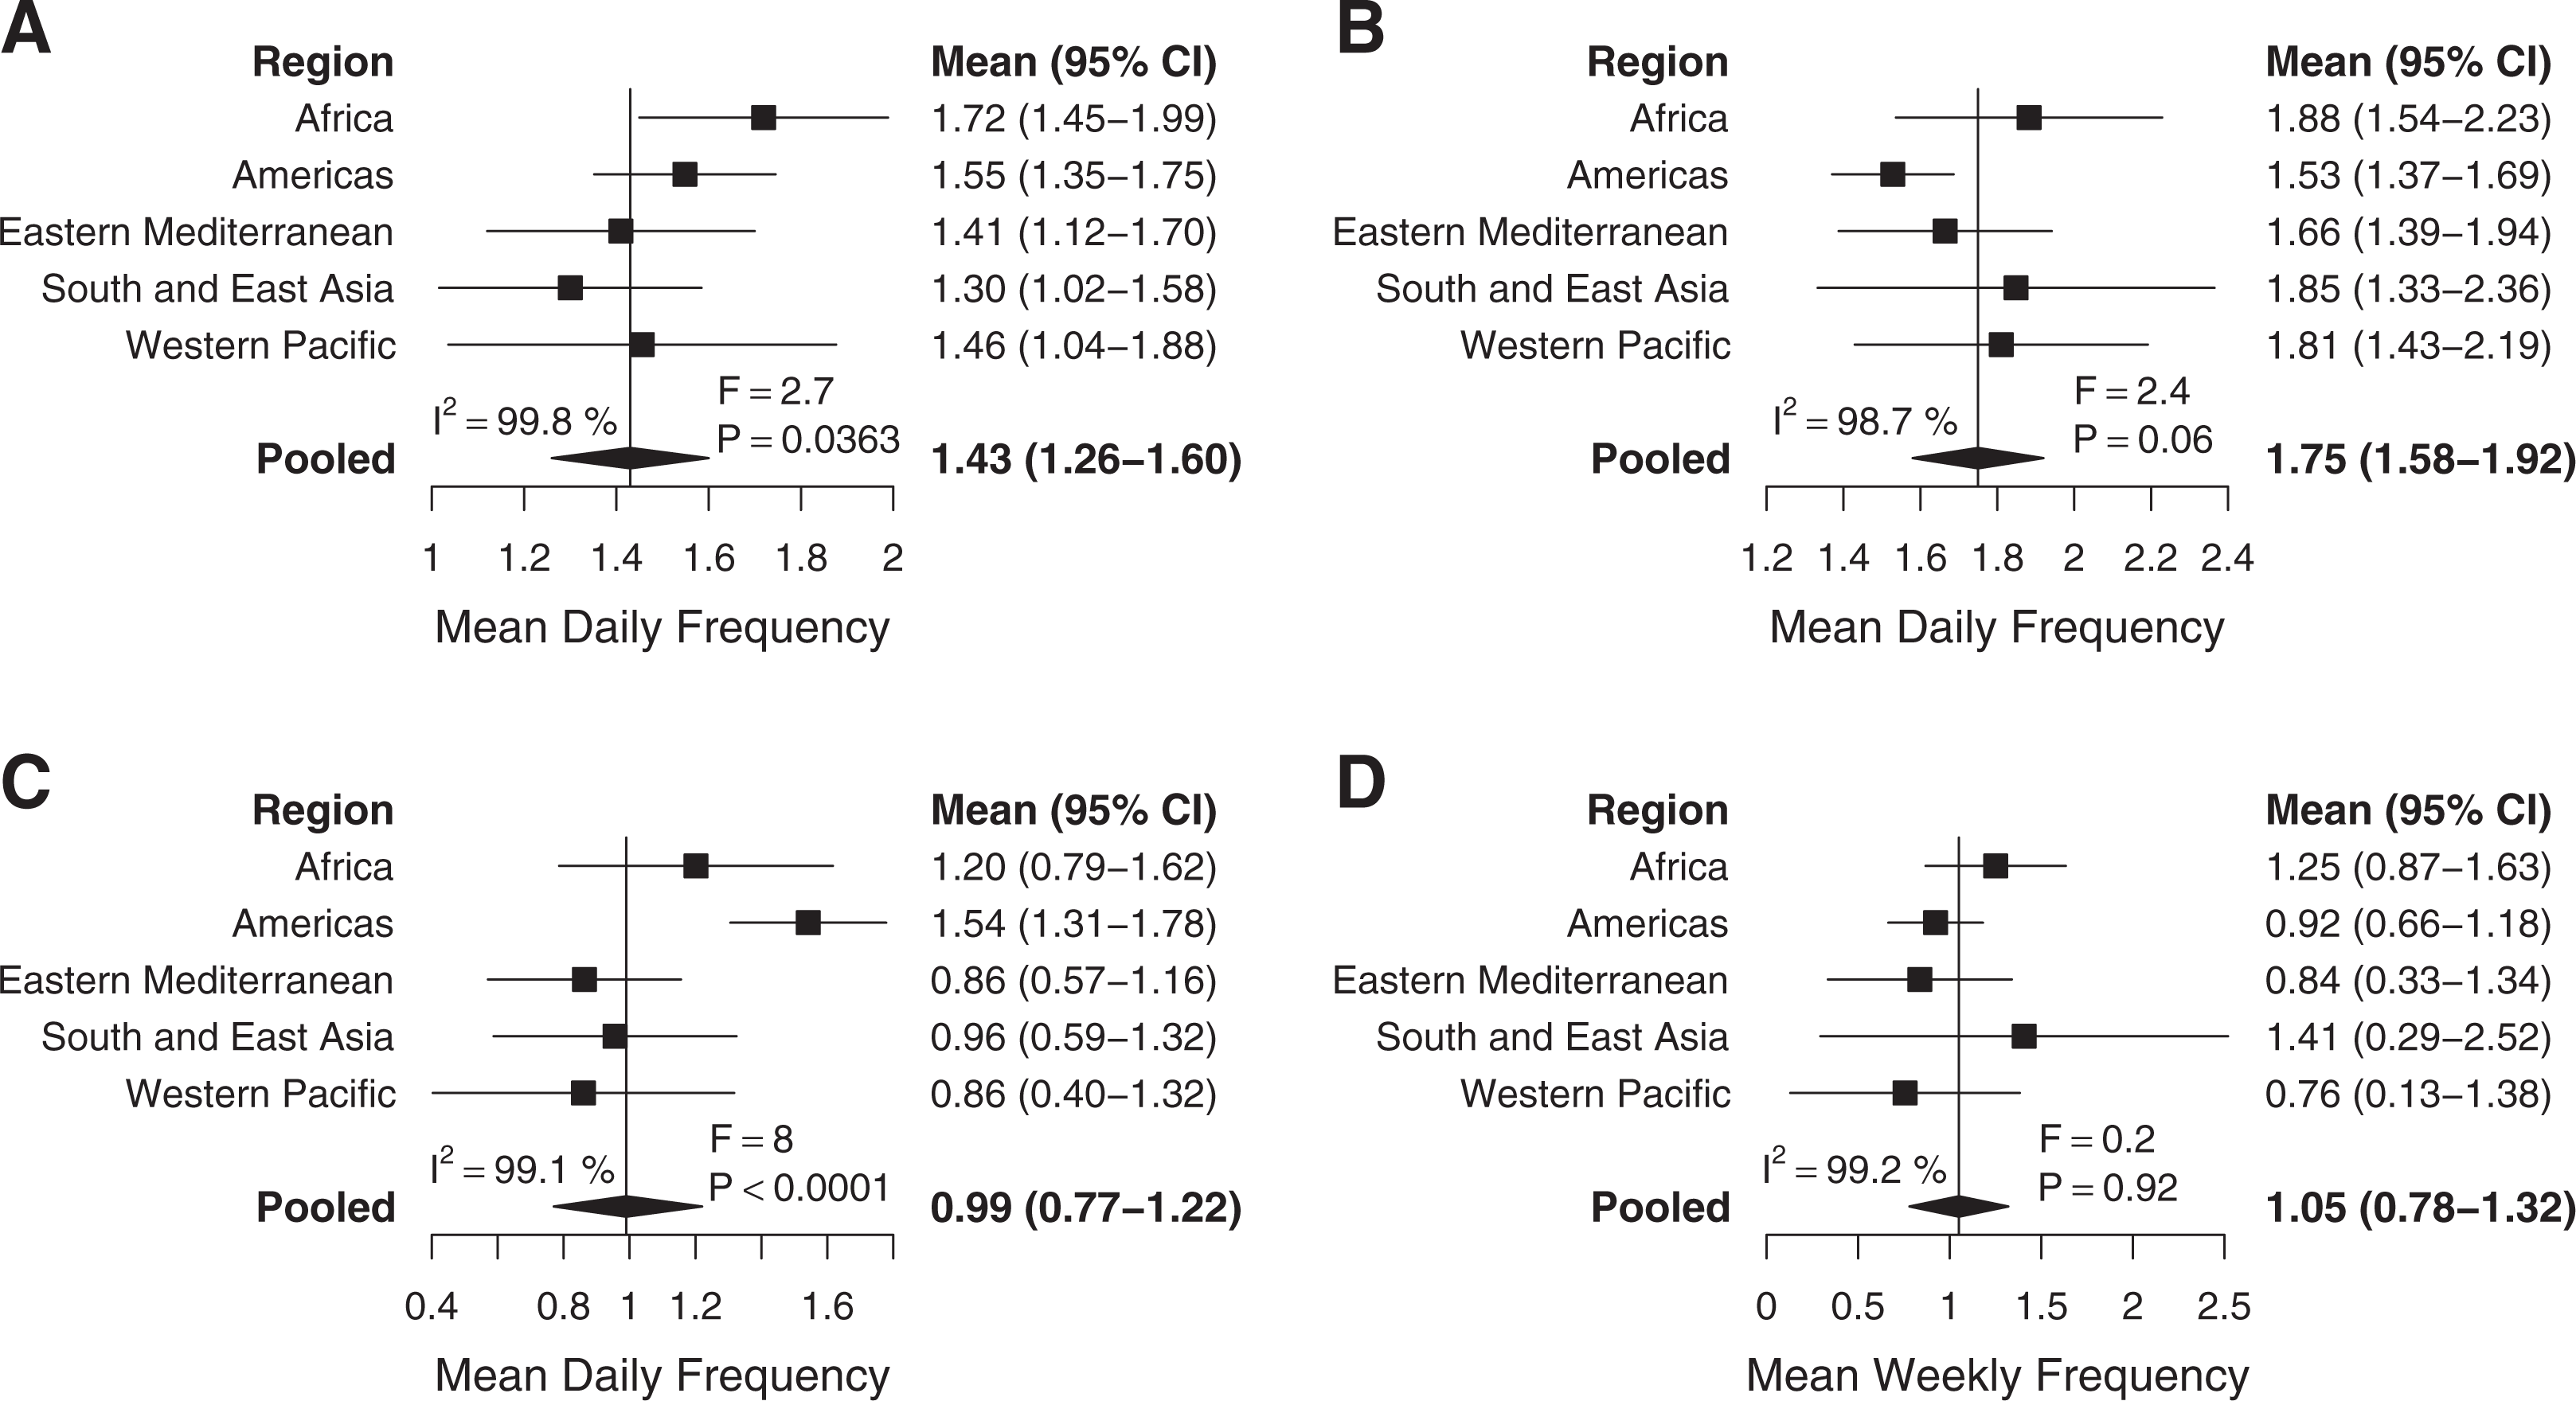
Mean frequencies of consumption by World Health Organization (WHO) region. (A) Mean fruit consumption (n = 254 331), (B) mean vegetable consumption (n = 254 135), (C) mean carbonated soft drink consumption (n = 241 784), and (D) mean fast-food consumption (n = 241 991). Error bars show 95% confidence intervals (CIs). I2 represents the percentage of variability due to individual study heterogeneity. The F statistic tests for overall differences between regions.
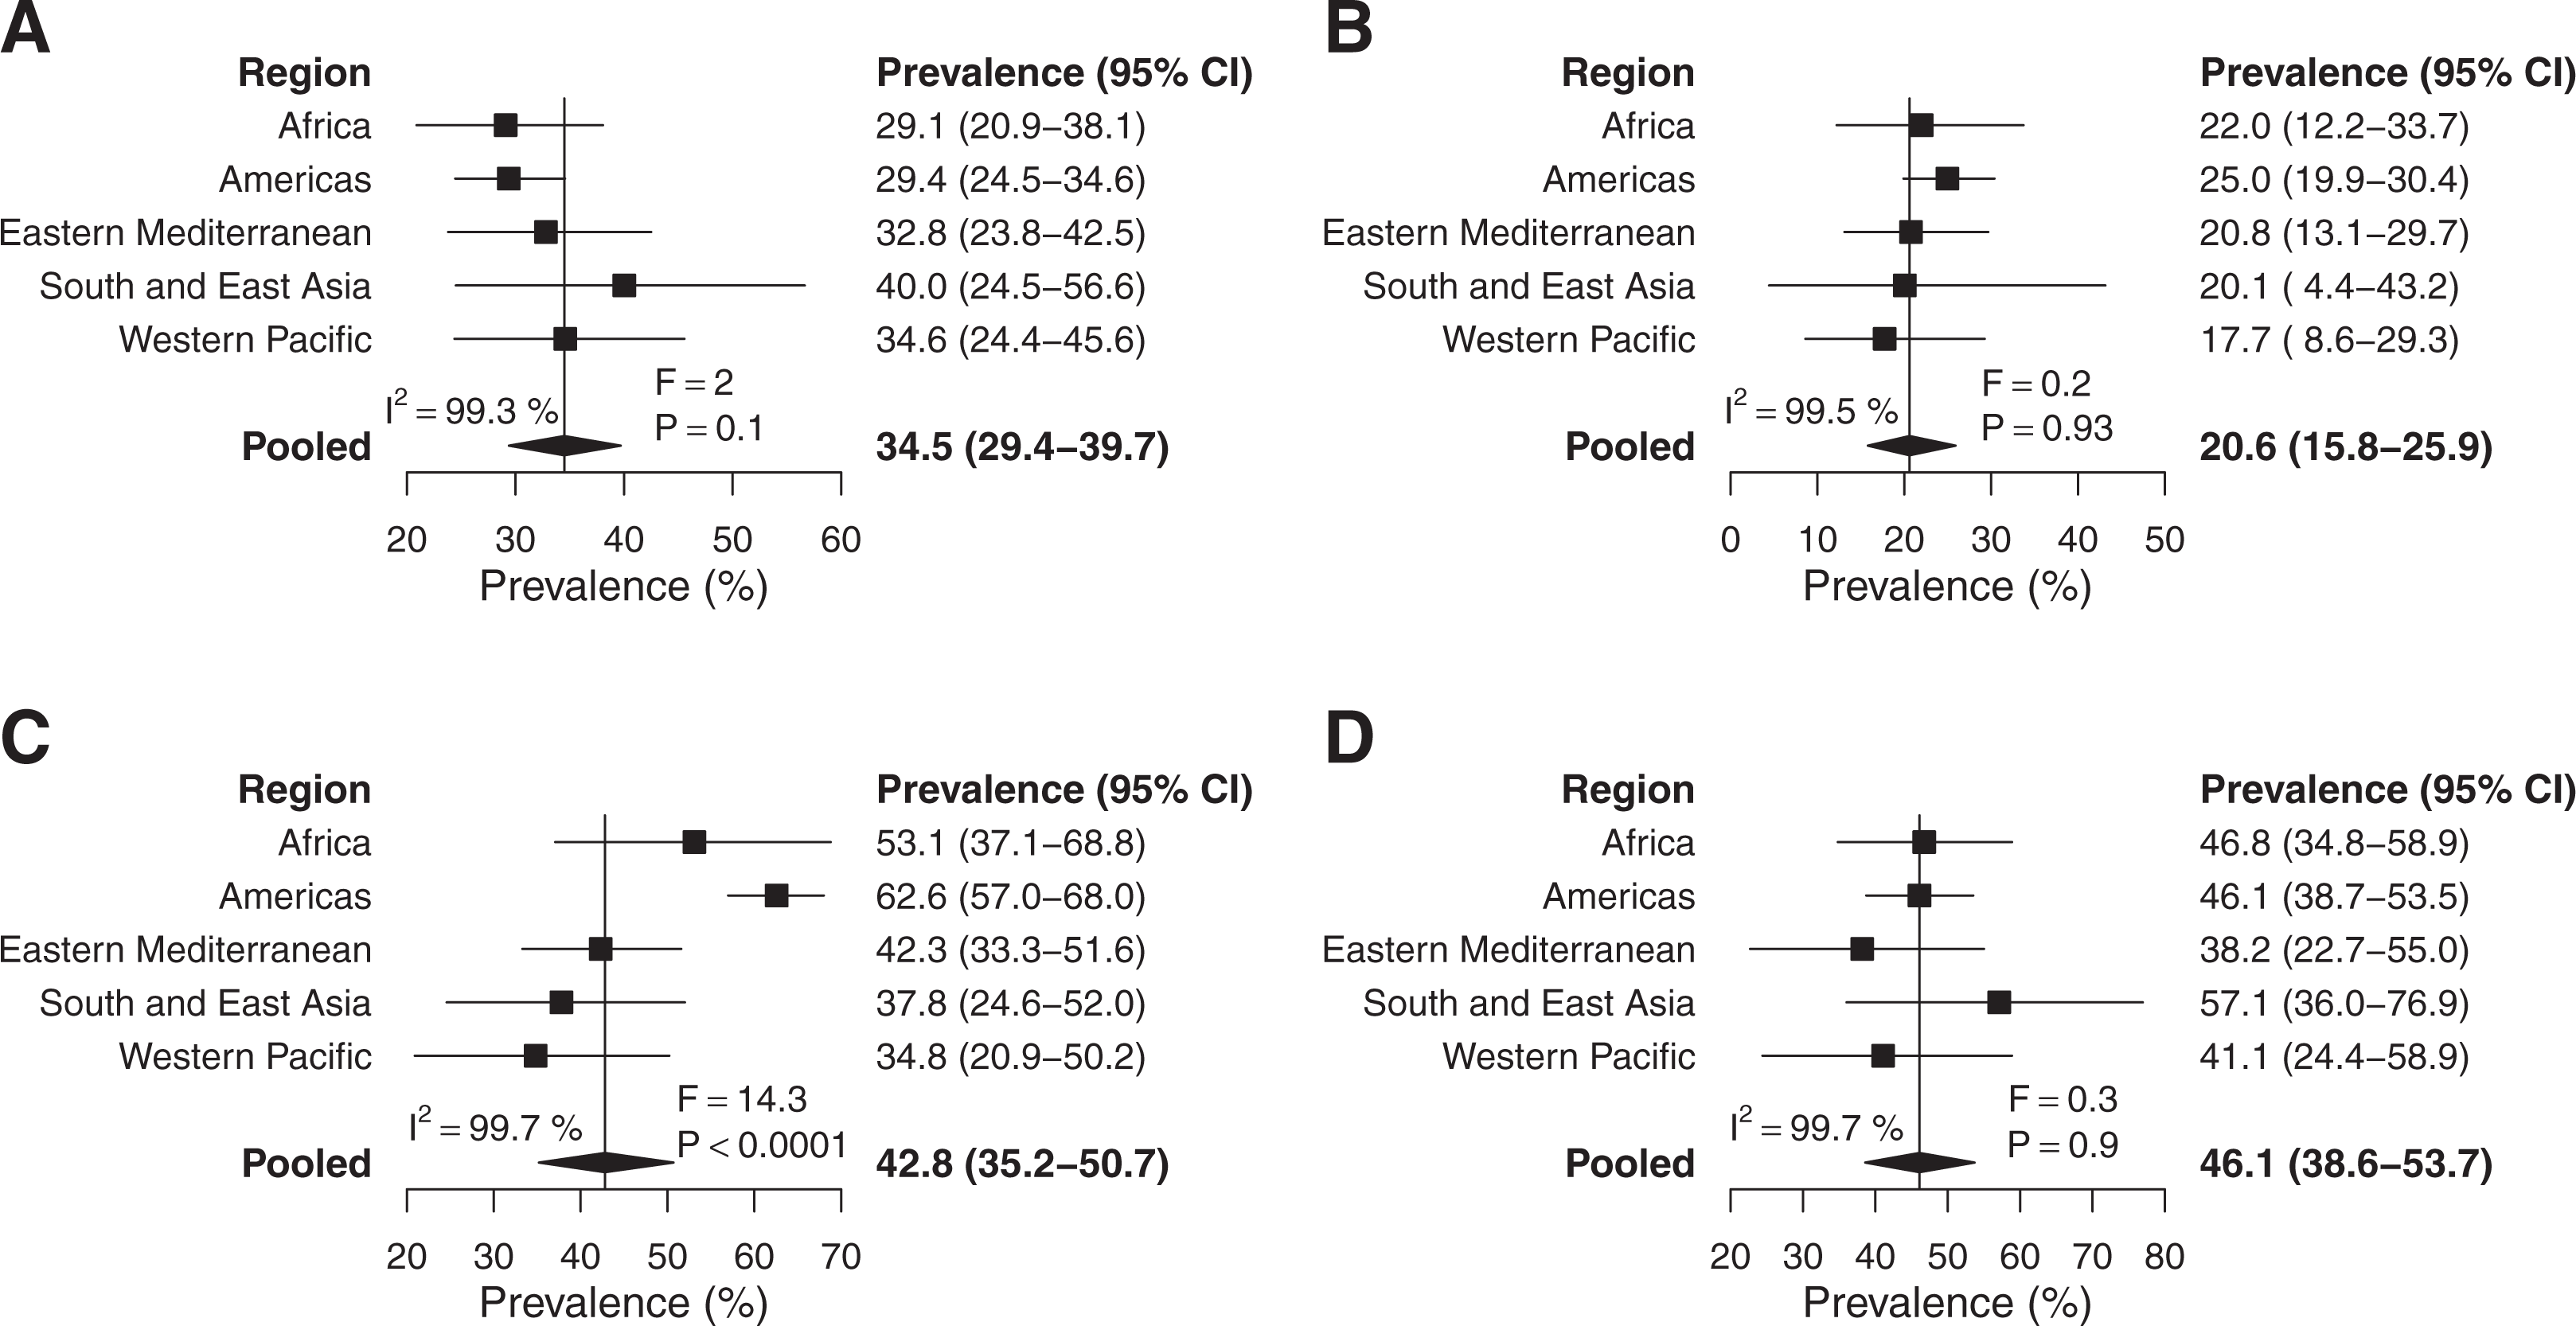
Prevalence of less-than-daily, at-least-daily, or less-than-weekly consumption by World Health Organization (WHO) region. (A) Less-than-daily fruit consumption (n = 254 331), (B) less-than-daily vegetable consumption (n = 254 135), (C) at-least-daily carbonated soft drink consumption (n = 241 784), and (D) at-least-weekly fast food consumption (n = 24 1991). Error bars show 95% confidence intervals (CIs). I2 represents the percentage of variability due to individual study heterogeneity. The F statistic tests for overall differences between regions.
Regional Heterogeneity
There was significant heterogeneity between regions for mean frequency of consumption of fruit (F = 2.7, P = .0363) and carbonated soft drinks (F = 8, P < .0001; Figure 1). At least daily carbonated soft drink consumption also varied significantly by region (F = 14.3, P < .0001; Figure 2). There were no significant differences between regions for frequency of vegetable or fast-food consumption (Figures 1 and 2). Mean daily frequency of fruit consumption was highest in Africa (1.72 [1.45-1.99]) and lowest in South and East Asia (1.30 [1.02-1.58]), where frequency of consumption was significantly lower than in Africa (P = .0316) and the Americas (1.55 [1.35-1.75], P = .0364; Figure 1 and Supplemental Table 1). Mean daily frequency of carbonated soft drink consumption was lowest in the Western Pacific (0.86 [0.40-1.32]) and Eastern Mediterranean (0.86 [0.57-1.16]) and by far the highest in the Americas (1.54 [1.31-1.78]), where frequency of consumption was significantly higher than in the Western Pacific (P = .0009), Eastern Mediterranean (P = .0001), South and East Asia (0.96 [0.59−1.32], P = .0007), and Africa (1.20 [0.79−1.62], P = .027; Figure 1 and Supplemental Table 1). A much higher proportion from the Americas (62.6% [57.0-68.0]) drank carbonated soft drinks at least once per day than in the Western Pacific (34.8% [20.9-50.2], P < .0001), South and East Asia (37.8% [24.6-52], P < .0001), Eastern Mediterranean (42.3% [33.3-51.6], P < .0001), and Africa (53.1% [37.1-68.8], P = .0437; Figure 2 and Supplemental Table 1).
Heterogeneity Between Income Groups
There was significant heterogeneity between income groups for mean frequency of consumption of vegetables (F = 3.7, P = .0165) and carbonated soft drinks (F = 6.8, P = .0006; Figure 3). At least daily carbonated soft drink consumption (F = 4.2, P = .0098) also varied significantly by region (Figure 4). There were no significant differences between income groups for frequency of fruit or fast-food consumption (Figures 3 and 4). Mean daily frequency of carbonated soft drink consumption was highest in high-income countries (1.66 [1.29-2.03]), where it was significantly higher than in low-income (0.98 [0.71-1.25], P = .0006) and lower middle-income (0.90 [0.63-1.17], P = .0021) countries (Figure 3 and Supplemental Table 1). Mean daily frequency of carbonated soft drink consumption was also higher in upper middle-income countries (1.34 [1.03-1.64]) than low-income (P = .023) countries (Figure 3 and Supplemental Table 1). At least daily carbonated soft drink consumption was higher in high-income (61.4% [49.4-72.7]) than low-income (43.9% [32.3-55.9], P = .038) and lower middle-income (39.1% [29.2−49.4], P = .0189) countries (Figure 4 and Supplemental Table 1).
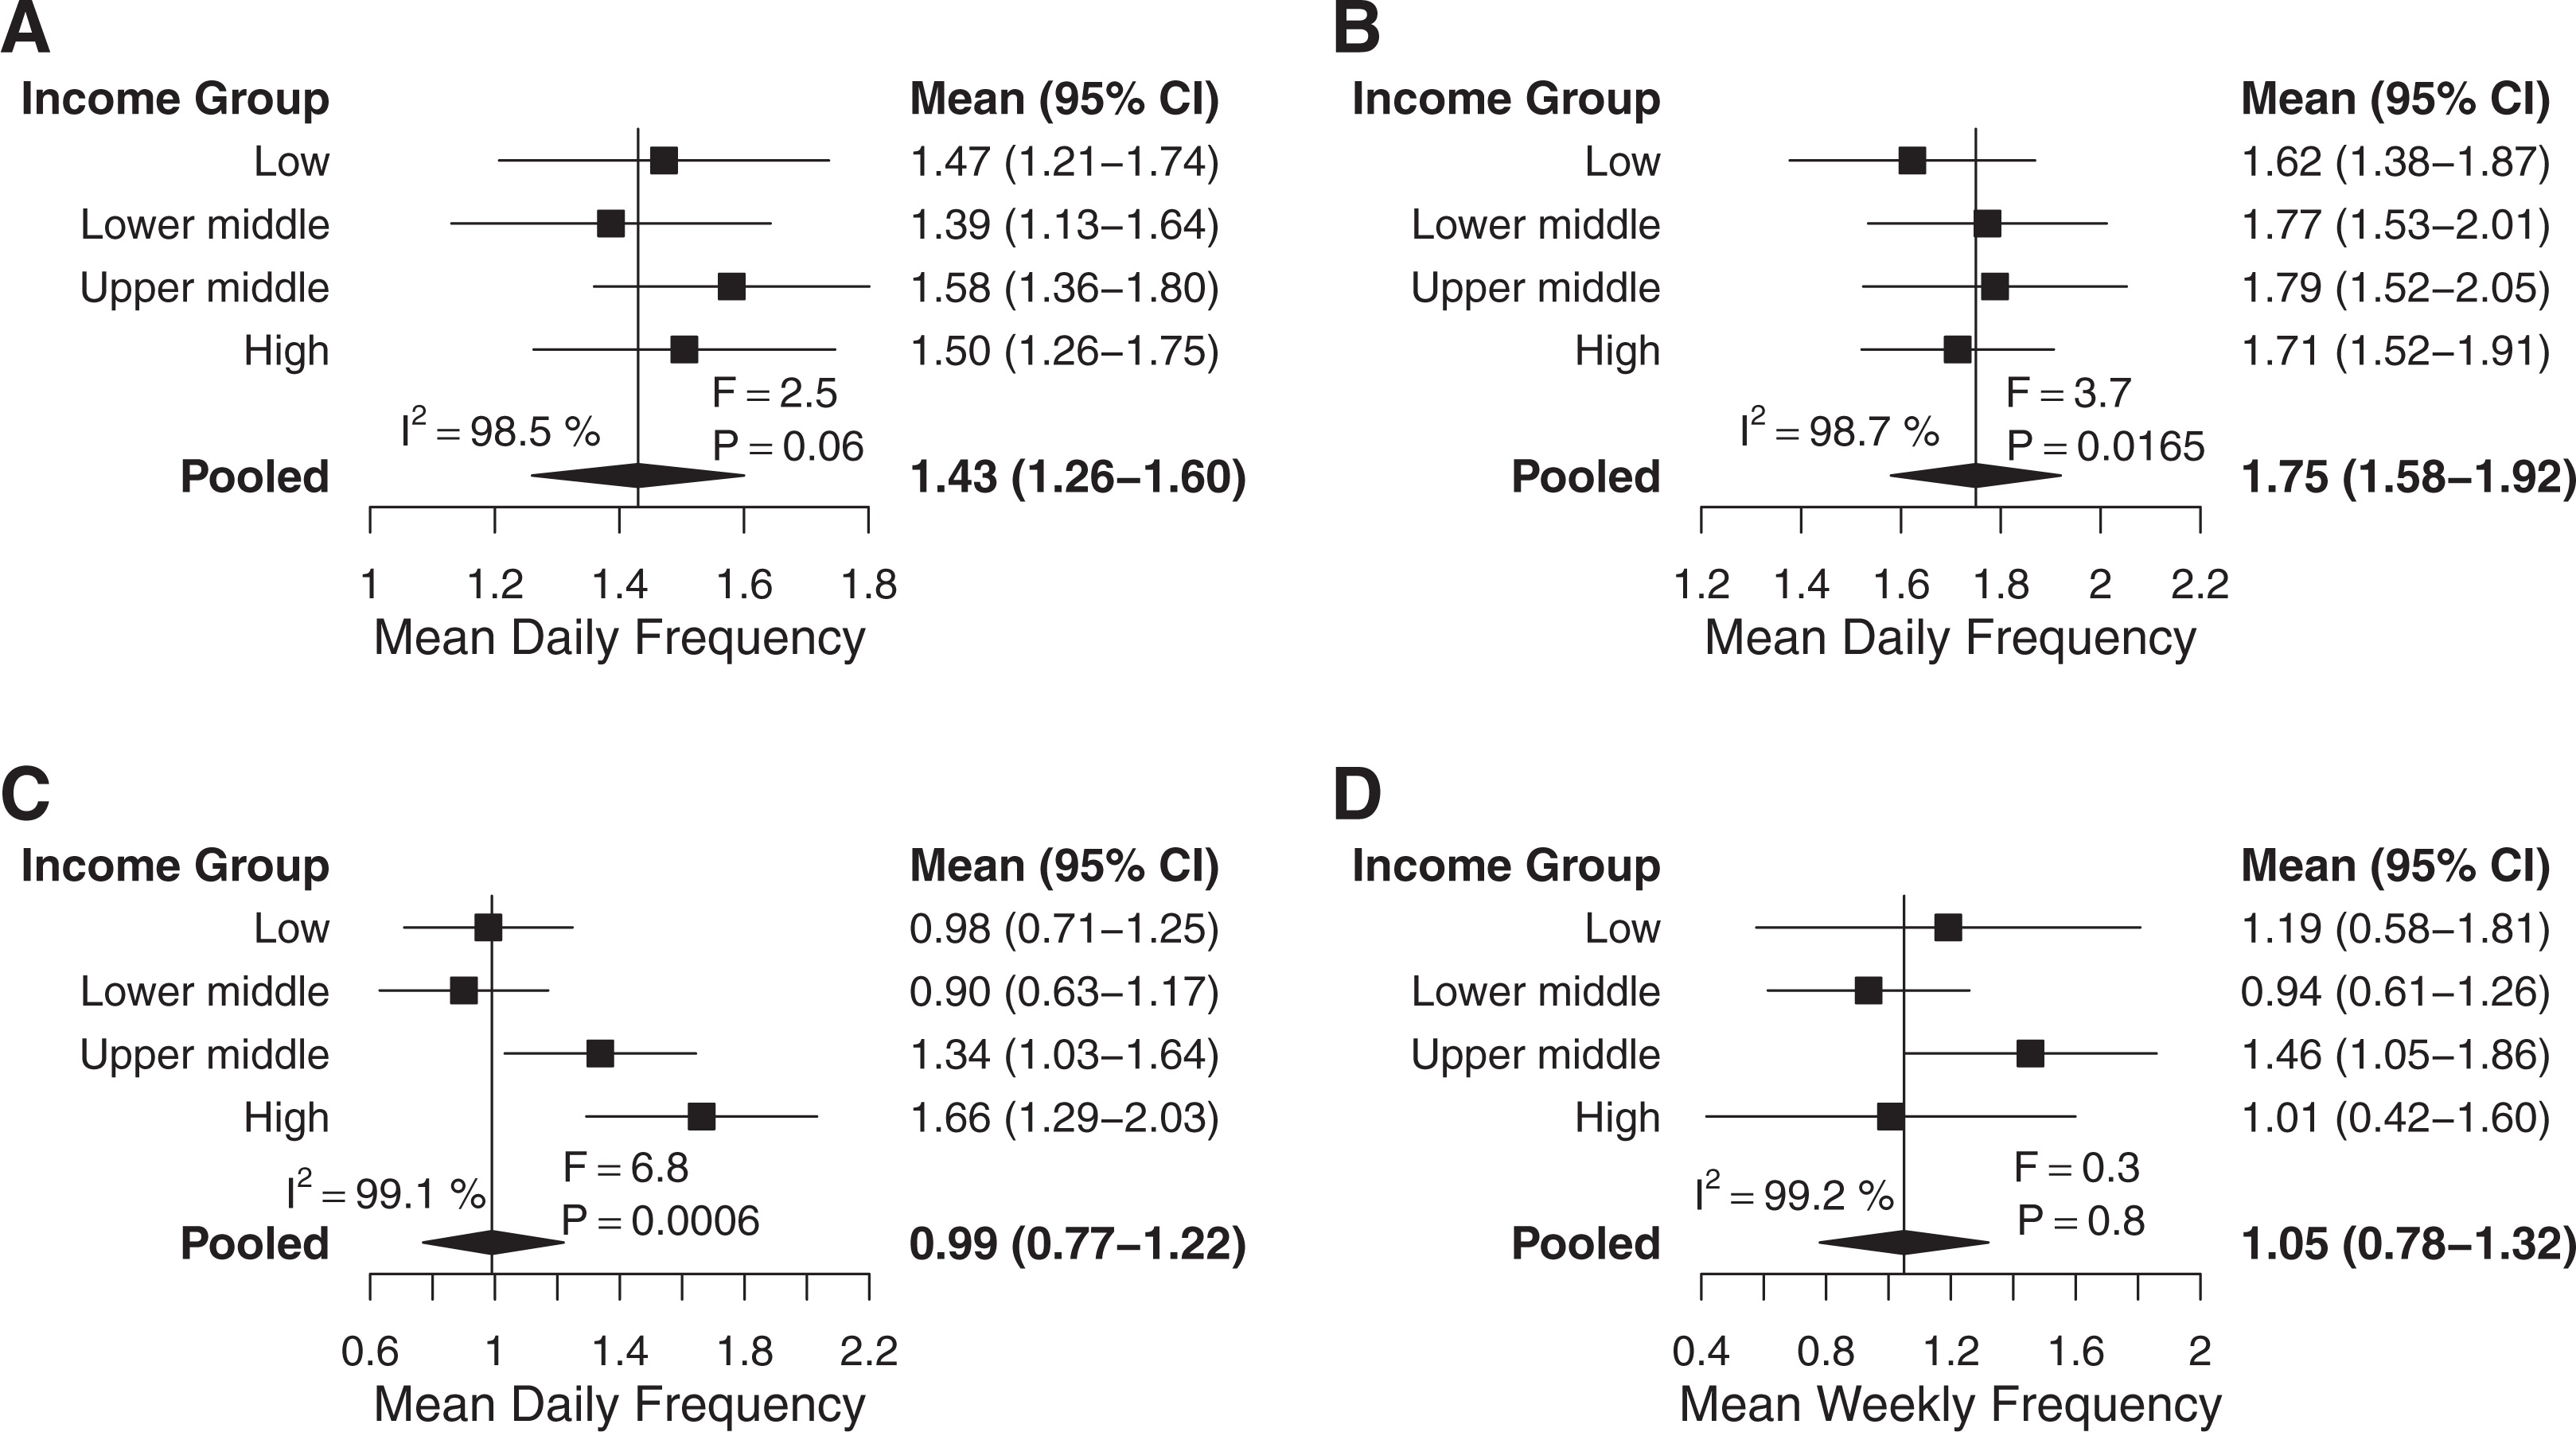
Mean frequencies of consumption by World Bank income group. (A) Mean fruit consumption (n = 247 293), (B) mean vegetable consumption (n = 247 107), (C) mean carbonated soft drink consumption (n = 235 452), and (D) mean fast-food consumption (n = 235 667). Error bars show 95% confidence intervals (CIs). I2 represents the percentage of variability due to individual study heterogeneity. The F statistic tests for overall differences between regions.
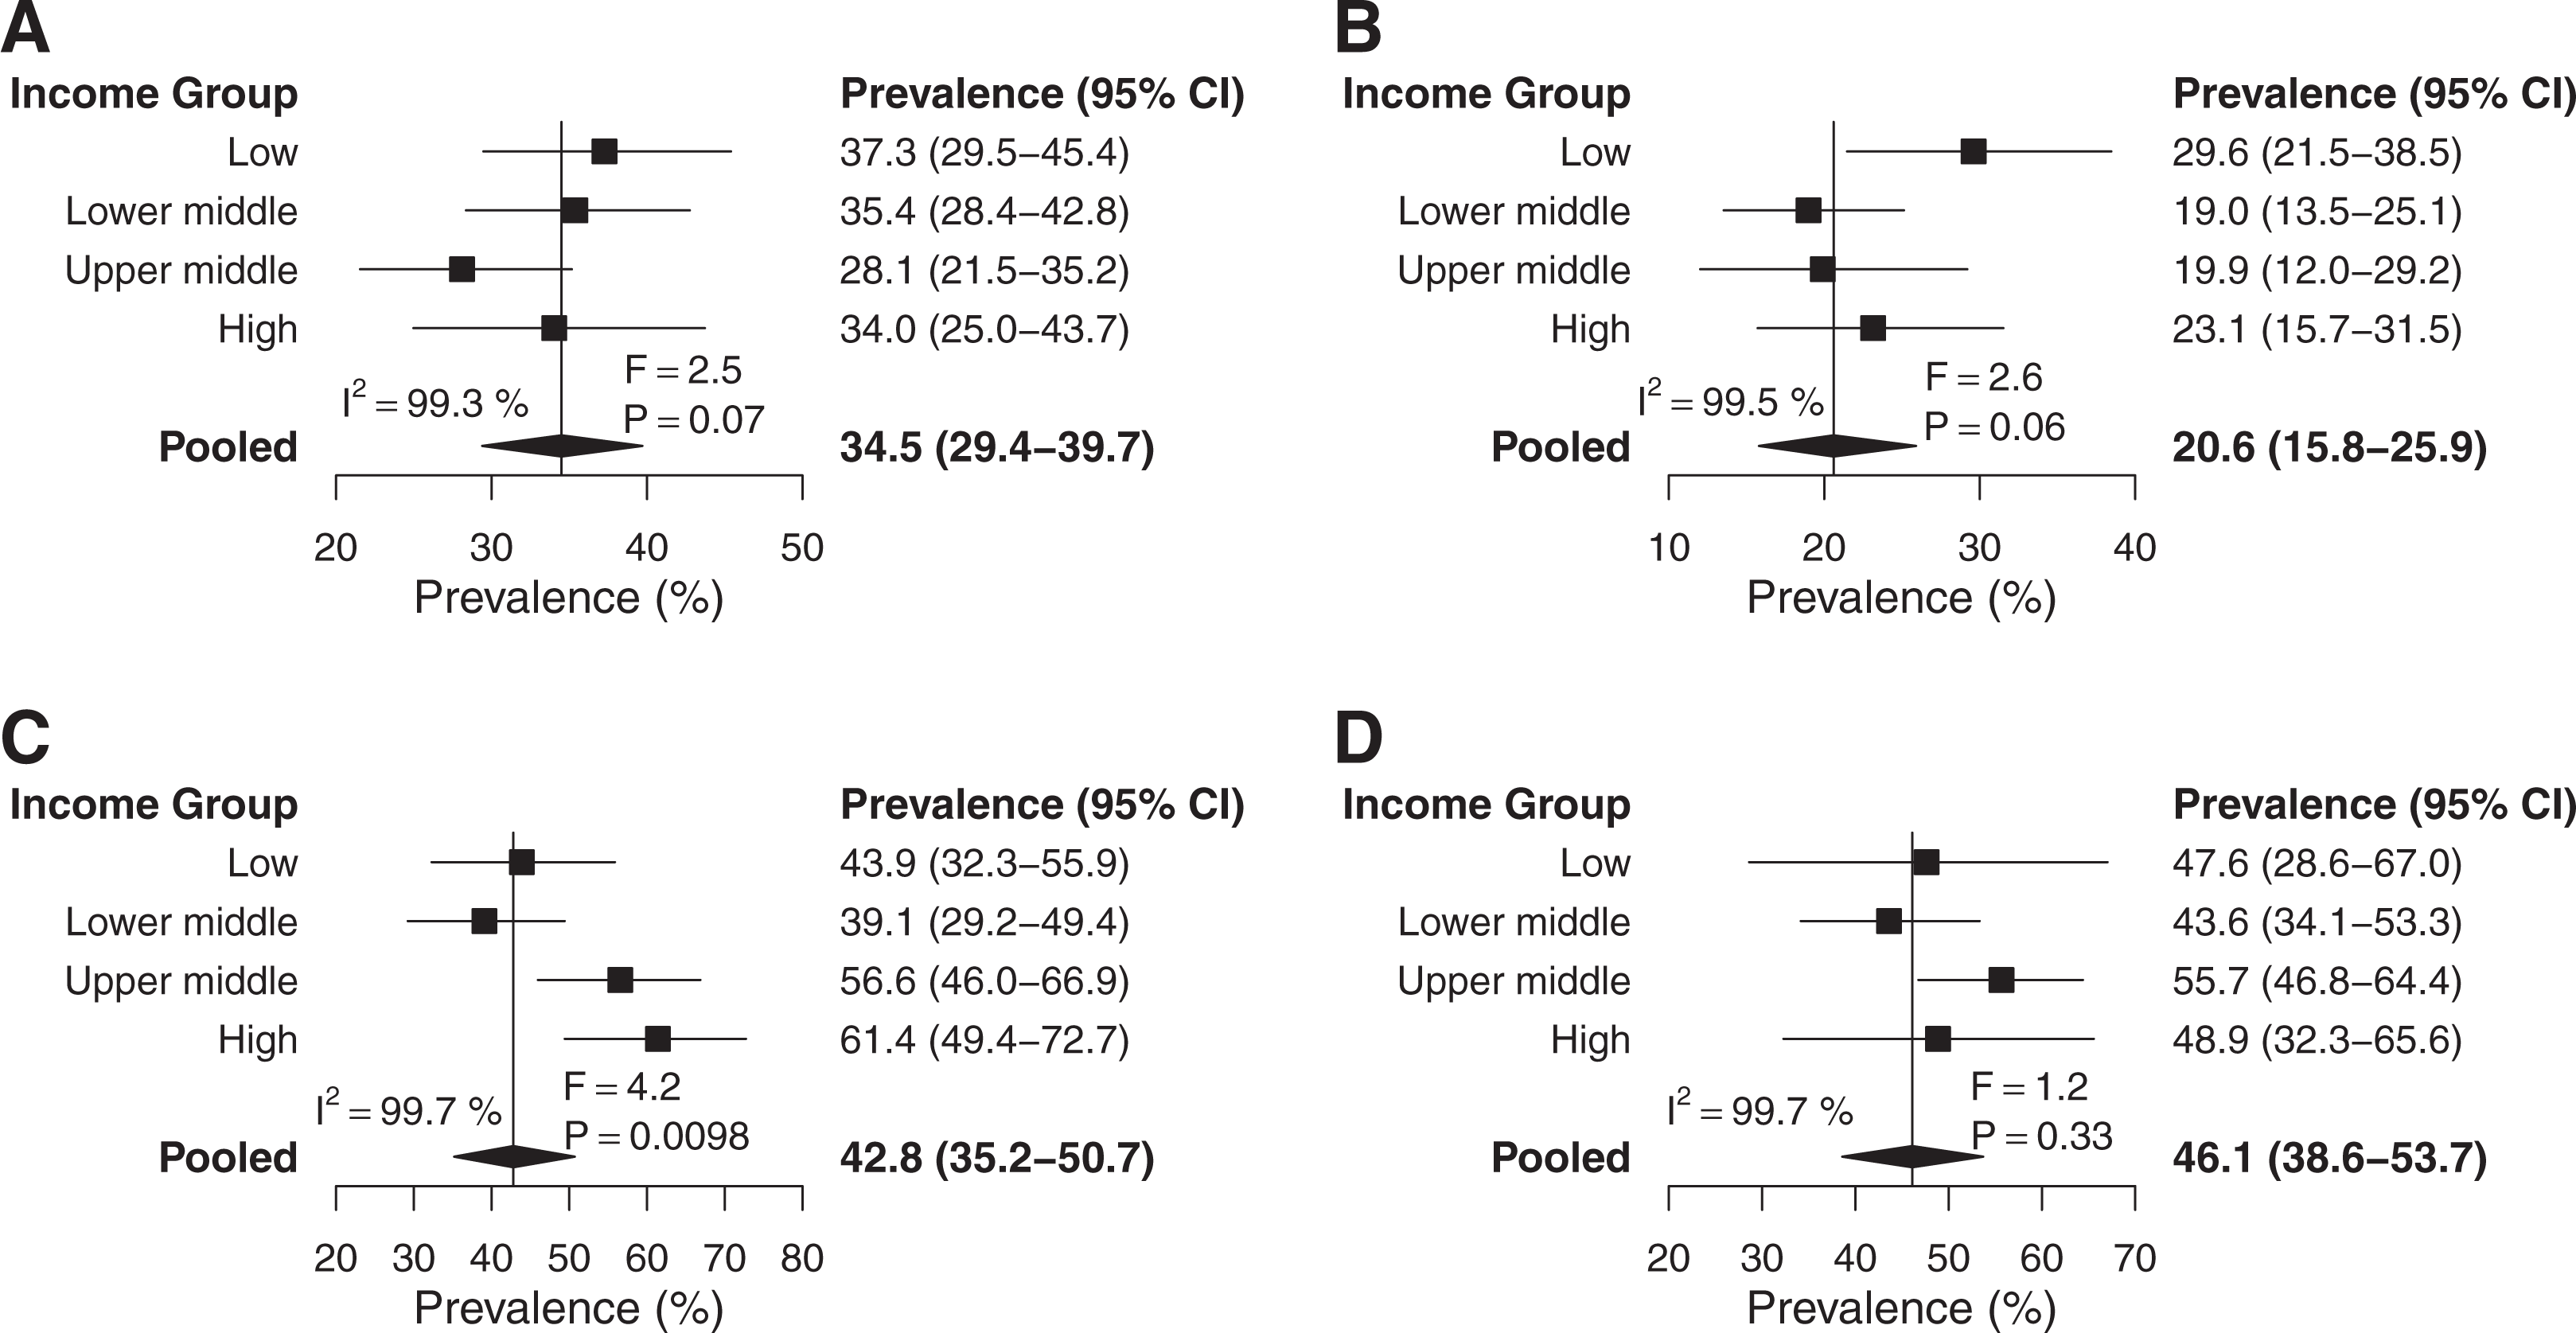
Prevalence of less-than-daily, at-least-daily, or less-than-weekly consumption by World Bank income group. (A) Less-than-daily fruit consumption (n = 247 293), (B) less-than-daily vegetable consumption (n = 247 107), (C) at-least-daily carbonated soft drink consumption (n = 235 452), and (D) at-least-weekly fast-food consumption (n = 235 667). Error bars show 95% confidence intervals (CIs). I2 represents the percentage of variability due to individual study heterogeneity. The F statistic tests for overall differences between regions.
Mean weekly frequency of fast-food consumption was lowest in lower middle-income (0.94 [0.61-1.26]) and highest in upper middle-income (1.46 [1.05-1.86]) countries (Figure 3). At least weekly fast-food consumption was higher in high-income (48.9% [32.3-65.6]) than lower middle-income (43.6% [34.1-53.3], P = .0700) countries but with limited certainty (Figure 4). There were no significant pairwise differences between income groups for frequency of vegetable consumption (Supplemental Table 1). Meta-regression of income groups revealed that prevalence of at least daily carbonated soft drink consumption was positively and linearly associated with income group (P = .0205; Supplemental Figures 9 and 11). No significant linear correlations were found for frequency of fruit, vegetable, or fast-food consumption by income group (Supplemental Figures 9 and 11).
Heterogeneity Between Food System Typologies
There was significant heterogeneity between FSTs for mean frequency of consumption of carbonated soft drinks (F = 7.5, P = .002) and fast food (F = 6, P = .0058; Figure 5). At least daily carbonated soft drink (F = 3.9, P = .03) and at least weekly fast-food (F = 4.2, P = .0241) consumption also varied significantly by FST (Figure 6). There were no significant differences between FSTs for frequency of fruit or vegetable consumption (Figures 5 and 6). Mean daily frequency of carbonated soft drink consumption in traditional FSTs (0.72 [0.45-0.99]) was considerably lower than in mixed FSTs (1.21 [0.95-1.46], P = .0007) as well as modern FSTs (1.44 [0.75-2.12], P = .06) although with much less statistical significance (Figure 5 and Supplemental Table 1). At least daily consumption of carbonated soft drinks was also considerably lower in traditional (35.0% [24.5-46.3]) than mixed (49.9% [40.2-59.6], P = .0185) FSTs (Figure 6 and Supplemental Table 1). Interestingly, mean weekly frequency of fast-food consumption was much higher in mixed (1.29 [0.88-1.71]) than both traditional (0.80 [0.37-1.24], P = .0107) and modern (0.71 [0.43-0.99], P = .0055) FSTs (Figure 5 and Supplemental Table 1). Correspondingly, at least weekly fast-food consumption was higher in mixed (52.6% [42.8-62.4]) than traditional (39.0% [23.3-56.0], P = .0421) as well as modern (39.8% [29.7-50.2], P = .07) FSTs (Figure 6 and Supplemental Table 1). Meta-regression revealed a positive linear relationship between FST and mean daily consumption of carbonated soft drinks (P = .0187) as well as prevalence of at least daily carbonated soft drink consumption (P = .08) although with less statistical significance (Supplemental Figures 10 and 12). No significant linear correlations were found for frequency of fruit, vegetable, or fast-food consumption by FST (Supplemental Figures 10 and 12).
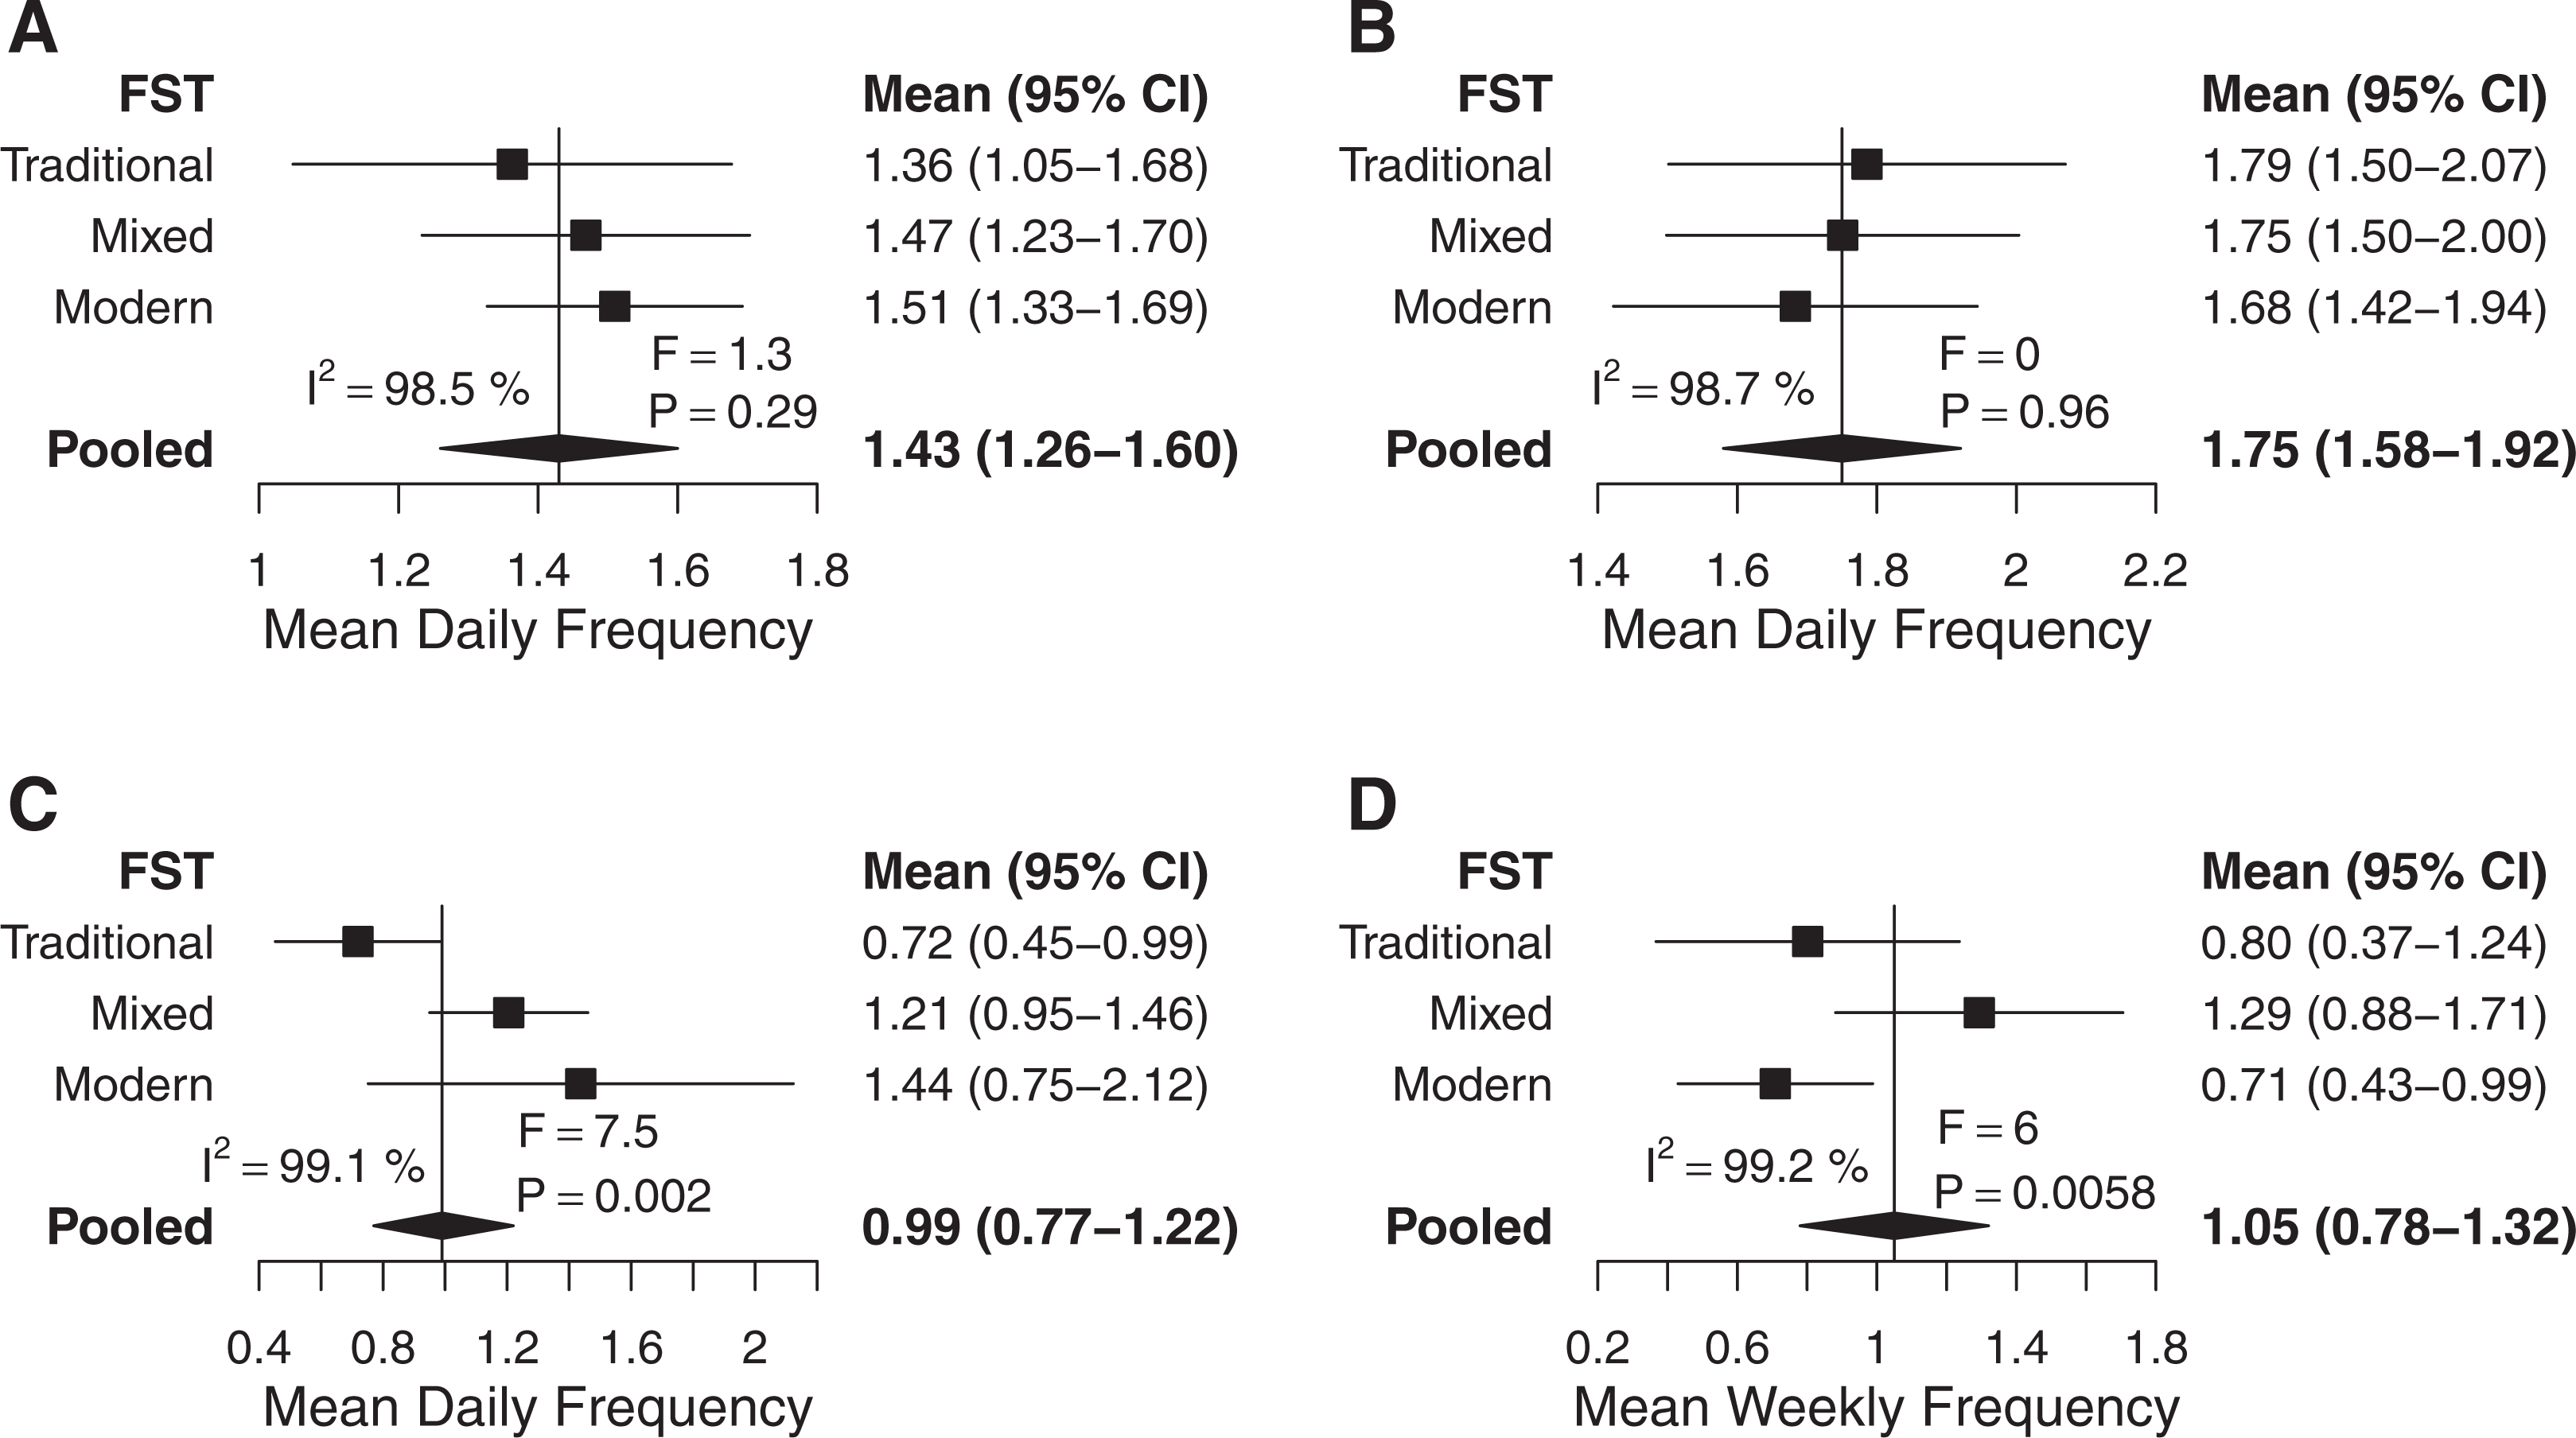
Mean frequencies of consumption by food system typology. (A) Mean fruit consumption (n = 176 634), (B) mean vegetable consumption (n = 176 637), (C) mean carbonated soft drink consumption (n = 164 864), and (D) mean fast food consumption (n = 164 958). Error bars show 95% confidence intervals (CIs). I2 represents the percentage of variability due to individual study heterogeneity. The F statistic tests for overall differences between regions.
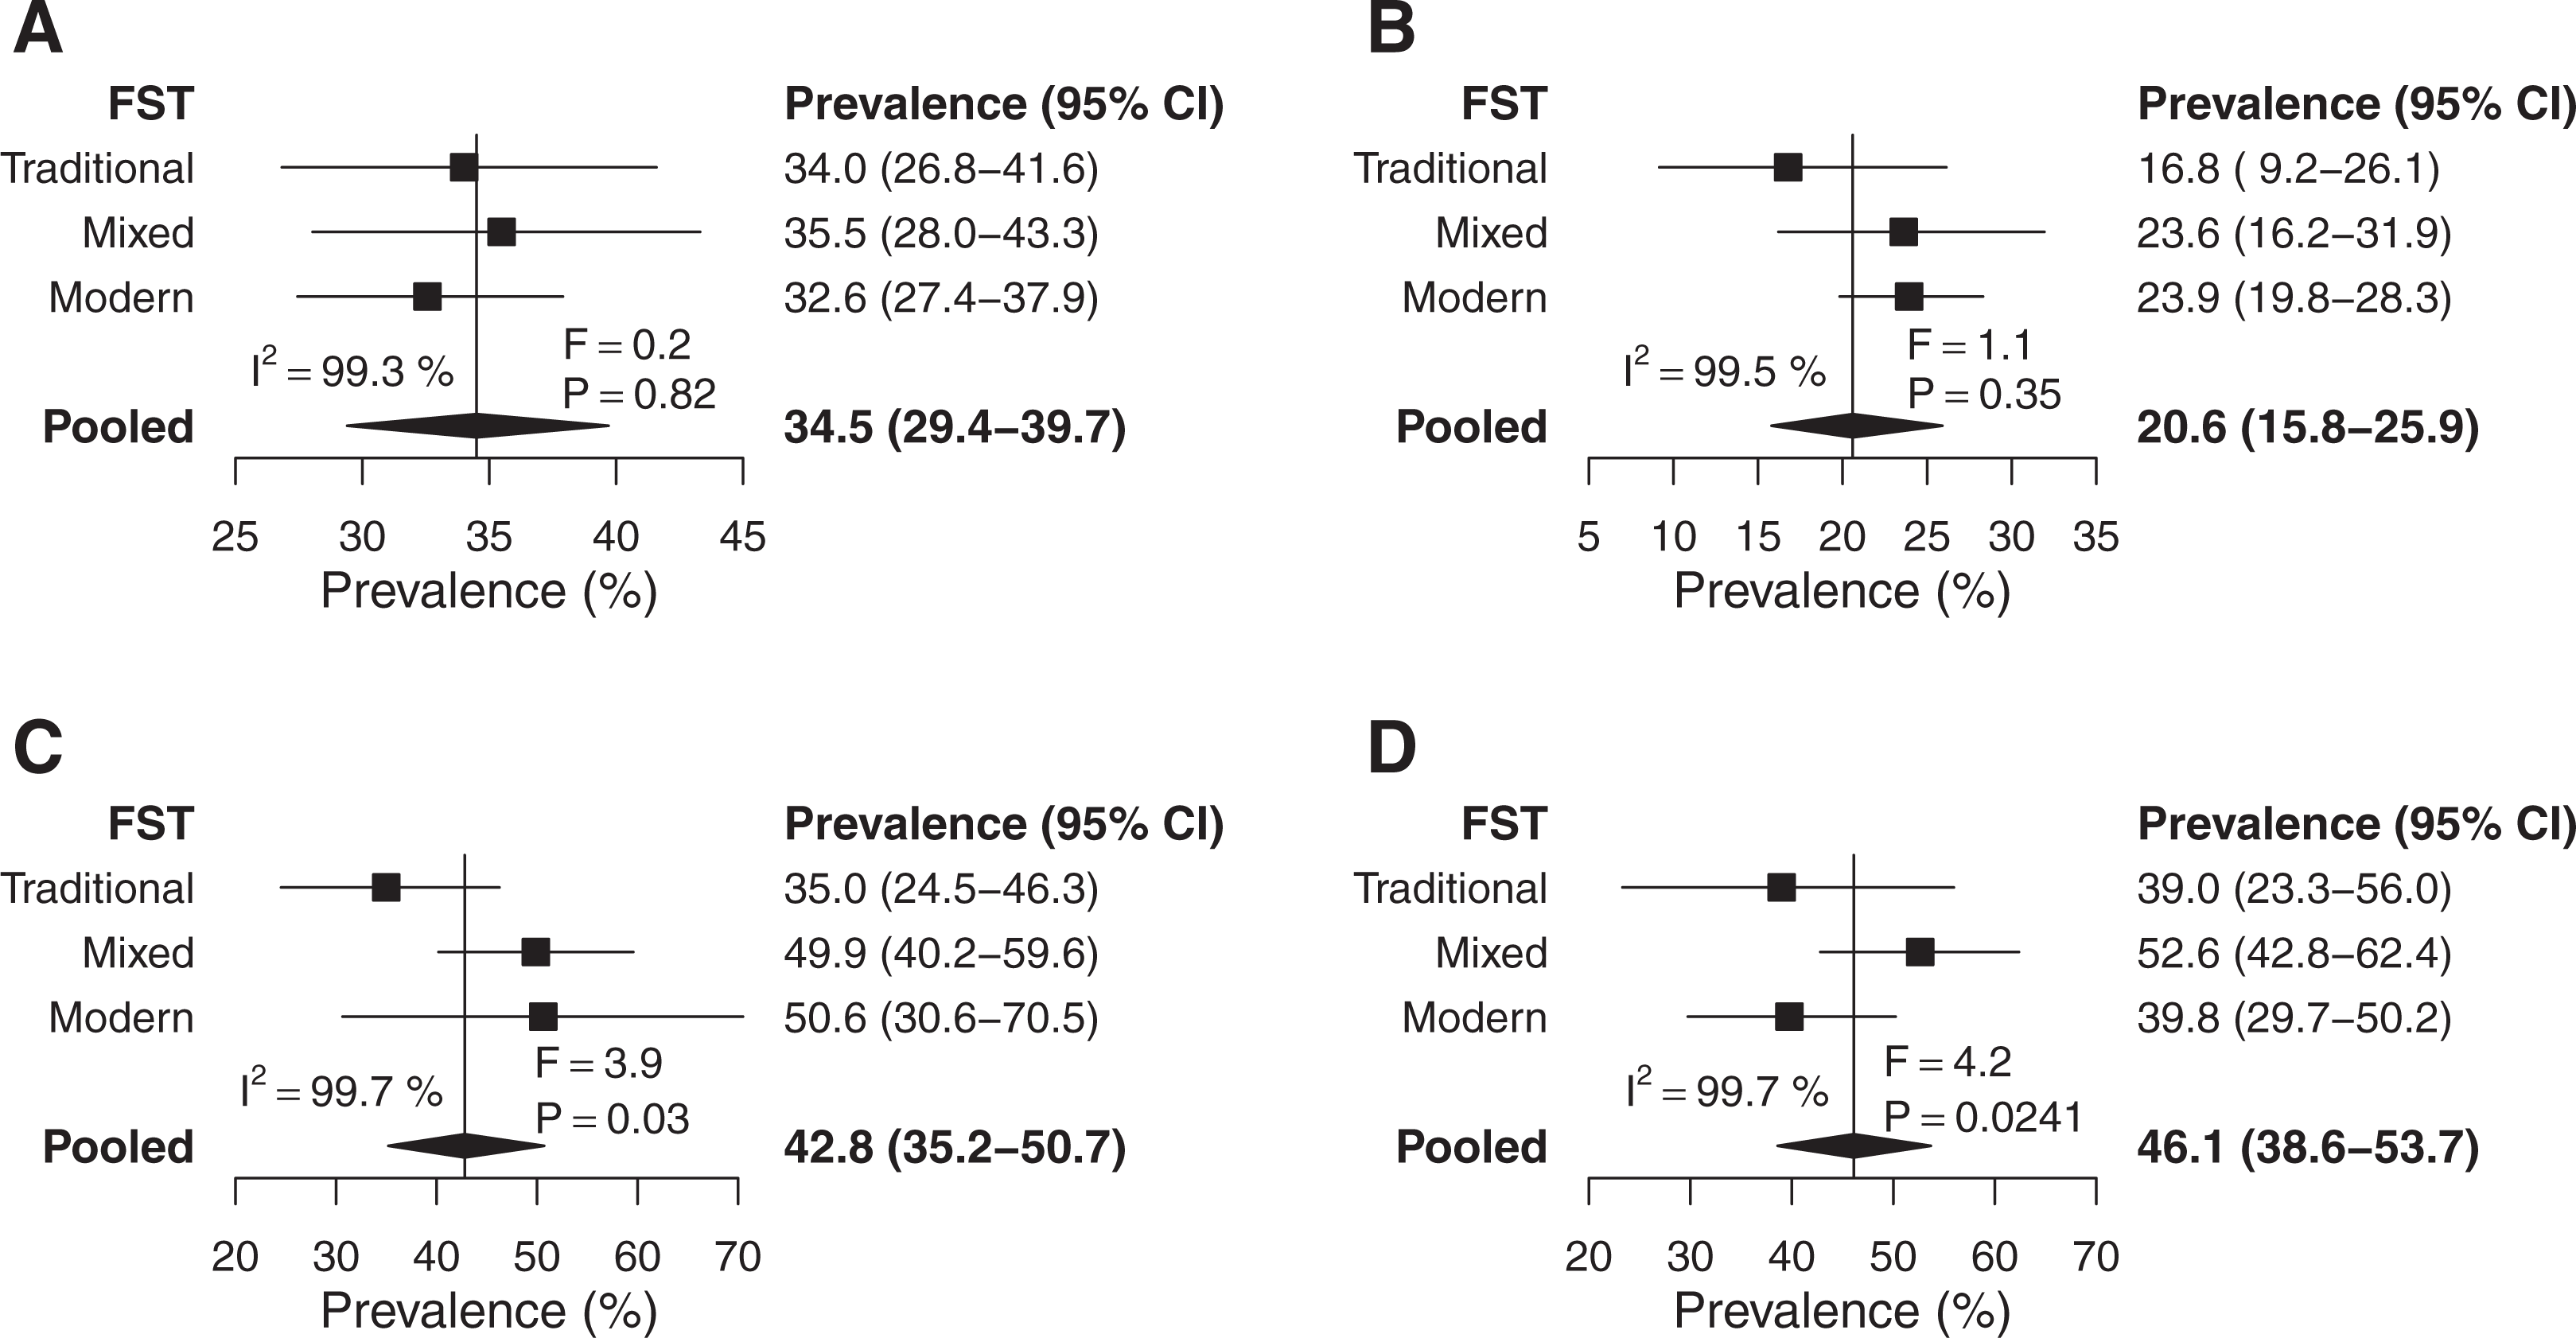
Prevalence of less-than-daily, at-least-daily, or less-than-weekly consumption by food system typology. (A) Less-than-daily fruit consumption (n = 176 634), (B) less-than-daily vegetable consumption (n = 176 637), (C) at-least-daily carbonated soft drink consumption (n = 164 864), and (D) at-least-weekly fast food consumption (n = 164 958). Error bars show 95% confidence intervals (CIs). I2 represents the percentage of variability due to individual study heterogeneity. The F statistic tests for overall differences between regions.
Discussion
Among school-going adolescents surveyed in the GSHS, frequency of fruit, vegetable, carbonated soft drink, and fast-food consumption varied substantially by country. Fruit consumption was particularly infrequent in South and East Asia, but we found no clear patterns or trends by income or FST. There were no significant trends or patterns in vegetable consumption by region, income, or FST. Carbonated soft drinks were most frequently consumed in the Americas (followed by Africa), high-income countries (followed by upper middle-income countries), and modern FSTs (followed closely by mixed FSTs). Carbonated soft drinks were the only food with a clear trend of increasing frequency of consumption by increasing income and FST. Fast food was far more frequently consumed in countries with mixed than both traditional and modern FSTs, but there were no clear patterns by region or income.
Given the low overall frequencies of fruit and vegetable consumption, intake in all countries was likely far below the minimum amount recommended by the WHO (at least 400 g). Regardless of large variations in consumption of carbonated soft drinks, they are commonplace among most adolescents, consumed once per day on average globally. A recent review of sugar consumption in Europe and North America found that adolescents consumed more added sugars than any other age-group. 44 Frequency of fast-food consumption appeared to be less common, but the GSHS only asked about fast-food consumption from restaurants, and there was likely substantial consumption from informal sources, such as street foods, which were not represented. 45 Street foods are increasingly common in Latin America, Asia, and Africa and makeup a significant portion of the urban food supply. 45,46 When fast foods were considered as meals purchased outside the home, 93% of adolescent girls from low- and middle-income countries globally were found to consume them at least weekly. 6
A meta-analysis of GSHS conducted between 2003 and 2011 found that 74% of adolescents aged 12 to 15 years consumed fruits and vegetables less than 5 times per day. 25 They found no clear patterns by region, but this may have been because the outcome was dichotomized or because fruit and vegetable consumption was combined. While adolescents in South and East Asia appeared to have less frequent combined intakes of fruits and vegetables than other regions, our findings of mean daily consumption in South and East Asia suggest vegetable consumption is high and fruit consumption low relative to other regions. An analysis of HBSC surveys, which includes mostly high-income countries from North America and Europe, did not report pooled estimates, but less-than-daily fruit consumption ranged from 51% in Denmark and French Belgium to 85% in Greenland, while less-than-daily vegetable consumption ranged from 45% in Flemish Belgium to 80% in Estonia. Fruit and vegetable consumption were much more frequent in the high-income countries from our analysis of GSHS than in the HBSC. However, the questions were asked differently between surveys, and the HBSC included younger children in general (11, 13, and 15 years) than the GSHS. Additionally, as the focus of the GSHS is on middle-income countries, our analysis of high-income countries only included 5 countries from the Americas, 4 from the Eastern Mediterranean, and 1 from the Western Pacific.
A recent systematic review of diets and eating practices of adolescent girls aged 10 to 19 years in low- and middle-income countries also found higher prevalences of less-than-daily fruit (56%) and vegetable (64%) consumption than in our analysis of the GSHS, but it did not include boys. 6 Additionally, while the review was global, certain countries and regions were highly over- or underrepresented due to limited available studies. Moreover, the analysis was based on data from unstandardized food frequency questionnaires, and most studies were not nationally representative and often only conducted in urban or rural areas.
Our study has important limitations. Subgroups within region, income, and FST are not equally represented: Africa, low-income countries, and modern FSTs are underrepresented. Moreover, no studies were available for Europe or North America. While a majority of the countries included had a median net secondary school enrollment rate greater than 50%, 47 we caution generalizing findings to adolescents out of school who may have difference dietary patterns. Additionally, surveys conducted in 2008 may not be representative of current dietary habits, especially among adolescents from low- and middle-income countries that are rapidly developing. Further, the GSHS surveys collected self-estimated frequency of foods consumed in the previous 30 days, so we were unable to estimate quantities consumed. Recall of usual frequency among adolescents is less accurate and valid than 24-hour recall, particularly for foods uncommonly consumed and among younger adolescents. 48,49 Finally, FSTs were not based on the year the survey was conducted, thus some countries may have been classified differently during the survey year.
To our knowledge, our study is the first to provide global estimates of frequency of fruit, vegetable, carbonated soft drink, and fast-food consumption among adolescent boys and girls. We analyzed 72 standardized and nationally representative surveys, accounting for weighting in the sampling design. Our random-effects meta-analysis accounted for the large heterogeneity between countries, and we statistically tested for trends and/or differences between regions, income groups, FSTs, and sex, adjusting for multiplicity of testing. We also weighted estimates according to the national populations of adolescents, which vary substantially between countries, improving the generalizability of our findings.
The GSHSs provide valuable insight into the frequency of fruit, vegetable, carbonated soft drink, and fast-food consumption among school-going adolescents. Ideally, dietary questions in the GSHS and HBSC surveys would be unified to allow for better global estimates and representation of regions, since their geographic scopes are complementary. Of course, modifying these surveys substantially may limit the ability to analyze trends over time, so this trade-off should be considered. If possible, future surveys should collect information on other foods that likely promote health (eg, fish, eggs, legumes, and dairy) or are associated with disease (eg, unhealthily processed foods such as candy, chips, and cookies) in adolescents. Research is needed that analyzes the relationships between adolescent diets and health to provide a better understanding of the consequences of specific diets in different contexts. Population surveys where information on the determinants of health, including diets, is collected along with health outcomes should be analyzed, adjusting for non-dietary health determinants. Knowing the quantities of specific foods consumed would enhance this process. There is also an urgent need for research that identifies the determinants of adolescent diets, particularly in low- and middle-income countries, so that effective policies and interventions can be designed.
In conclusion, school-going adolescents generally consume unhealthy diets, low in fruits and vegetables and high in carbonated soft drinks. The specific dietary inadequacies—be they low frequencies of fruit and vegetable consumption or high frequencies of carbonated soft drinks and fast food consumption—depend on country, region, income group, and FST, but there are few generalizable trends. Global, regional, and national policies and programs addressing adolescent diets should be tailored to the particular dietary needs of the corresponding populations. For example, taxing sugar-sweetened beverages or other unhealthy foods in Latin America and high-income countries has potential to reduce intake among adolescents. 50 Low-quality diets among adolescents, in addition to low physical activity, are likely contributing to the coexistence of undernutrition, overweight/obesity, and noncommunicable diseases, which can have harmful immediate, long-term, and intergenerational consequences. Adolescents are unlikely to be motivated by a desire for health in the distant future, and creative interventions that harness widely shared adolescent values are needed to successfully improve diets. 51
Supplemental Material
Supplemental Material, Appendix_(6) - Global Patterns of Adolescent Fruit, Vegetable, Carbonated Soft Drink, and Fast-Food Consumption: A Meta-Analysis of Global School-Based Student Health Surveys
Supplemental Material, Appendix_(6) for Global Patterns of Adolescent Fruit, Vegetable, Carbonated Soft Drink, and Fast-Food Consumption: A Meta-Analysis of Global School-Based Student Health Surveys by Ty Beal, Saul S. Morris and Alison Tumilowicz in Food and Nutrition Bulletin
Footnotes
Authors’ Note
TB and SSM designed the study. TB did the statistical analysis and wrote the first draft. All authors interpreted the data and reviewed and contributed to the manuscript.
Declaration of Conflicting Interests
The author(s) declared no potential conflicts of interest with respect to the research, authorship, and/or publication of this article.
Funding
The author(s) disclosed receipt of the following financial support for the research and/or authorship of this article: Funding for the study came from the Ministry of Foreign Affairs of the Netherlands.
Supplemental Material
Supplemental material for this article is available online.
References
Supplementary Material
Please find the following supplemental material available below.
For Open Access articles published under a Creative Commons License, all supplemental material carries the same license as the article it is associated with.
For non-Open Access articles published, all supplemental material carries a non-exclusive license, and permission requests for re-use of supplemental material or any part of supplemental material shall be sent directly to the copyright owner as specified in the copyright notice associated with the article.