
Abstract
Background:
Sorghum-Soy Blend (SSB) and Sorghum-Cowpea Blend (SCB) fortified blended food aid porridge products were developed as alternatives to Corn-Soy Blend Plus (CSB+) and Super Cereal Plus (SC+), the most widely used fortified blended food aid products. However, the cost and nutrient cost-effectiveness of these products procured from different geographical areas have not been determined.
Objective:
The objective of this study is to determine the nutrient cost-effectiveness of SSB and SCB compared to existing fortified blended foods.
Methods:
Nutritional data as well as ingredient, processing, and transportation cost for SSB, SCB, and existing fortified blended foods were compiled. Using the omega value, the ratio of the fortified blended food’s Nutrient Value Score to the total cost of the fortified blended food divided by an identical ratio of a different fortified blended food or the same fortified blended food produced in a different country and the nutrient cost-effectiveness of each of the fortified blended foods procured in the United States and several African countries were determined.
Results:
Both CSB+ and SC+ are less expensive than SSB and SCB, but they also have lower Nutrient Value Scores of 7.7 and 8.6, respectively. However, the omega values of CSB+ and SC+ are all above 1 when compared to SSB and SCB, suggesting that the existing fortified blended foods are more nutrient cost-effective.
Conclusions:
Comparing the nutrient cost-effectiveness of various food aid products could provide valuable information to food aid agencies prior to making procurement decisions.
Introduction
Fortified blended foods (FBFs), primarily Corn-Soy Blend Plus (CSB+) and Super Cereal Plus (SC+), are used around the world for food aid by development and humanitarian agencies such as the United States Agency for International Development (USAID) and their implementing partners, including the United Nations Children’s Fund and the World Food Programme (WFP). FBFs are a flour or meal that is typically prepared as porridge by adding water and cooking for 5 to 15 minutes. FBFs are similar to traditional blended foods made from sorghum, corn, millet, and other grains and consumed extensively throughout Africa, but FBFs also contain micronutrients and sometimes contain vegetable oil, sugar, and milk powder. Corn-soy FBFs are the most widely used processed food aid product, which make up 26% of the share of all food aid products by volume from the United States. 1,2 Similarly, FBFs make up 25% of food aid volume at the WFP, which aims to increase the use of FBFs to 80%. 3
Food aid agencies such as USAID and WFP continue to develop new products and refine existing ones to better meet both the needs of recipients and the objectives of projects and programs. 4 WFP has begun to develop new FBFs in multiple countries using locally produced raw materials other than conventionally used maize, wheat, and soybeans. 3 Similarly, the 2011 Food Aid Quality Review (FAQR) report, conducted by Tufts University for USAID, provided guidance to food aid product development by emphasizing the need to develop innovative and high-quality food aid products. 5 In response, the Micronutrient Fortified Food Aid Product Pilot Project, funded by the United States Department of Agriculture (USDA), commissioned Kansas State University to develop and test 2 new food aid products, Sorghum-Soy Blend (SSB) and Sorghum-Cowpea Blend (SCB), as described in Table 1. 6
Description of Fortified Blended Food Aid Products.a
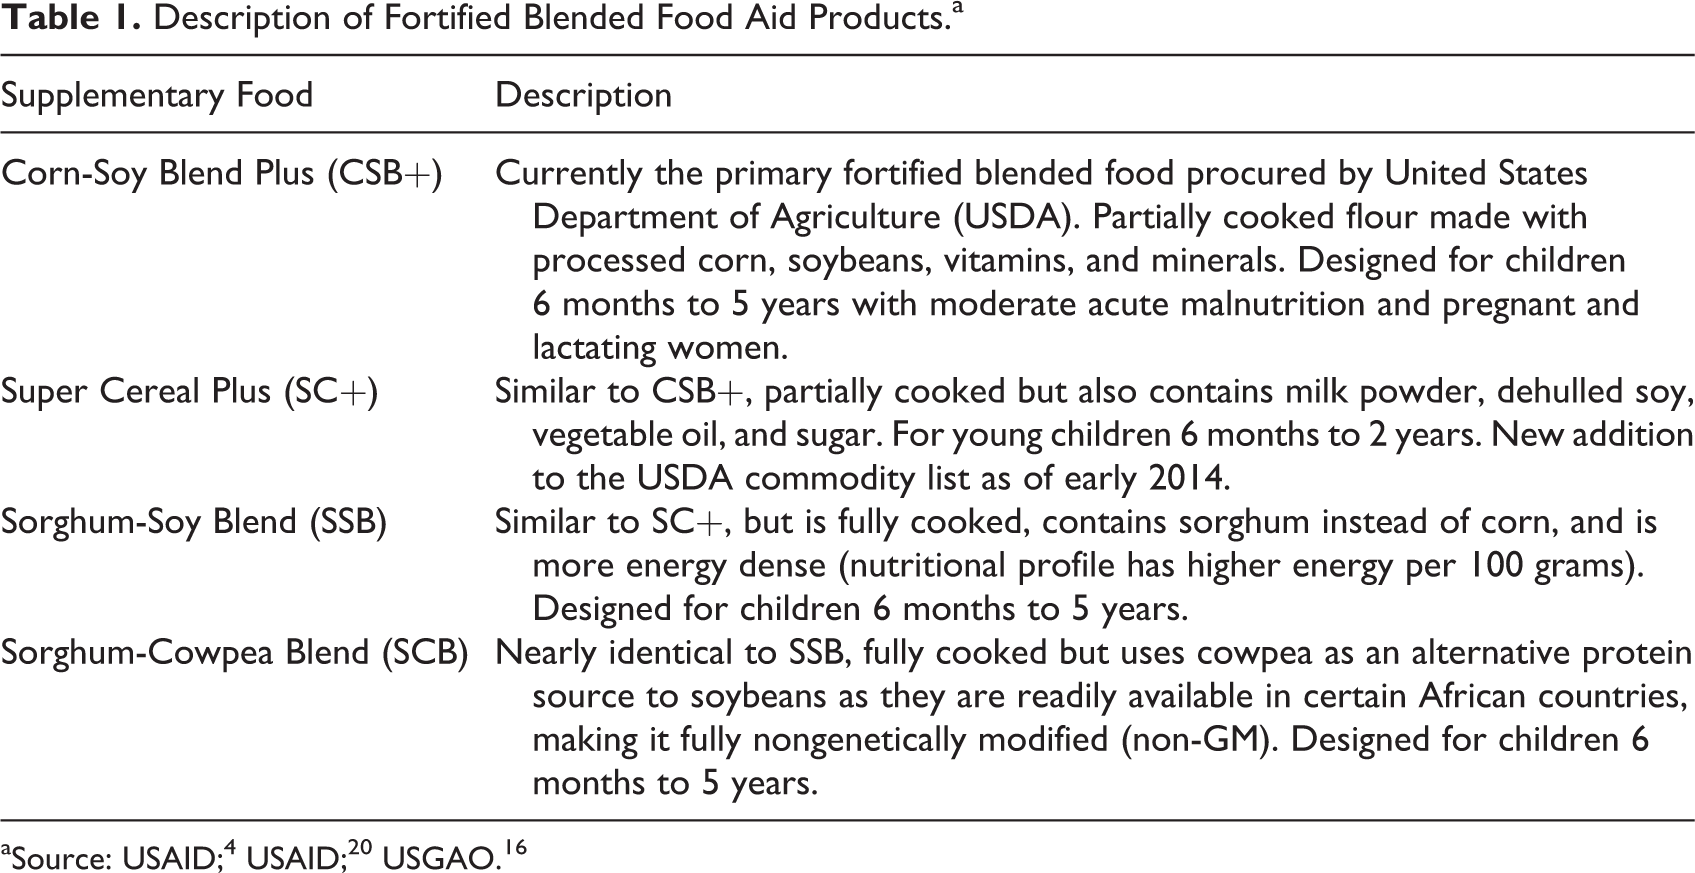
Extruded SSB and SCB FBFs, designed for children 6 months to 5 years, are more energy dense 3 and are more digestible compared to nonextruded FBFs since extrusion reduces antinutrient levels, such as tannins in sorghum, trypsin inhibitors in soybeans, and aflatoxin in maize. 7 -10 The FBFs also contain whey protein concentrate 80% (WPC80), an animal source protein that could benefit immune systems and promote the growth of muscle tissue in malnourished children. 11 As a fully cooked product, SSB and SCB rely less on heat sources such as firewood during preparation and have a longer shelf life than current CSB+ and SC+ FBFs. 12 -15 Sorghum, soybeans, and cowpeas are available locally in the project country of Tanzania, and sorghum and cowpeas are both nongenetically modified which could reduce costly import requirements imposed on products by certain African countries. 16,17 Kansas State University conducted shelf-life studies on SSBs and SCBs, an economic assessment, physical, nutritional, and sensory quality analyses, and field testing for nutritional efficacy and consumer acceptance in the Mara Region of Tanzania among young children ages 6 months to 2 years and 2 to 5 years. 6
Because SSBs and SCBs are higher quality products than existing FBFs, they are also more costly. Food aid agencies regularly consider production and transportation costs as well as nutritional content to compare the cost-effectiveness of various food aid products when making procurement decisions. Since food aid agencies face budget constraints, they must choose between providing more nutritious and thus more expensive food aid to fewer people or providing lower cost and less nutritious food aid to a greater number of people. 18 As a way to more systematically consider the production costs, transport costs, and nutritional value of various food aid products, Ryckembusch et al 19 developed a new metric called the “omega value” which measures the nutrient cost-effectiveness of various food aid products.
In this study, we compare the nutrient cost-effectiveness of existing FBFs, CSB+, and SC+ with SSB and SCB procured from the United States, South Africa, Kenya, and Tanzania, for distribution in the Mara Region of Tanzania. We argue that by comparing the nutrient cost-effectiveness of different food aid products, food aid policy makers and procurement agencies will be able to more effectively meet the objectives of projects and programs as well as the nutritional needs of food aid recipients.
Methods
Fortified Blended Foods
Both SSB and SCB contain whey protein concentrate (WPC80), sugar, and vegetable oil in order to meet the FAQR report recommended nutritional profile for CSB14 of 387 kcal, 18 g protein and 9 g fat, 15.5 g iron, and 0.532 mg vitamin A per 100 g serving. 5 The vitamin A content was derived from the proposed contributions from the FAQR CSB14 (0.154 mg) and fortified oil (0.378 mg), which was formulated into SSB and SCB rather than provided through fortified oil. United States Department of Agriculture’s SC+ has a similar nutritional profile to the newly formulated extruded FBFs. 20 Corn-Soy Blend Plus does not contain milk powder or sugar and has lower fat levels (6 g per 100 g serving), making it less energy dense. 4
Production and Transportation Costs
Production costs include both the cost of ingredients and processing estimated for the 4 FBFs in the United States, South Africa, Kenya, and Tanzania. The cost of ingredients was based on the composition of the FBFs. The data used to estimate production and transportation costs were compiled from multiple sources, while maintaining consistency as much as possible. Production costs were estimated with data from FAOSTAT, USDA, Milling & Baking News, and the Regional Agricultural Trade Intelligence Network (RATIN). Prices for each ingredient were collected from 2009 to 2011, and the 3-year annual average was used.
Ingredient costs
Ingredient costs in the United States and several countries in Africa were estimated based on published prices from USDA, FAOSTAT, Milling & Baking News, and RATIN. Vitamin and mineral costs were based on quotes from private companies in the United States because attempts to collect price information from African companies proved unsuccessful. Thus, the same price was used across the different countries. Prices of corn, sorghum, soybeans, cowpea, dried skim milk powder, soybean oil, and sugar are published annually by the USDA and FAOSTAT. For the African countries, wholesale prices of corn, sorghum, soybeans, and cowpea were used since food processors typically purchase these commodities locally. Import prices were used in African countries for SMP, soybean oil, and sugar. The prices of defatted soy flour and WPC80, which are not published, were estimated at 1.46 times the price of soybeans and 2.44 times the price of dried skim milk powder, respectively, based on previous literature and industry quotes. 21
Processing costs
Processing costs include the costs of all the processing steps including storage of ingredients, cleaning and dehulling of grains, weighing ingredients to create the correct composition, and pre-extrusion milling and mixing of grains. Depending on the FBF, they include either roasting or extruding, cooling and drying of the extrudate, and postextrusion hammer milling that resulted in 95% of the ground material being smaller than 315 µm. The FBF is mixed with WPC80, sugar, oil, and vitamins and minerals, and the final product is bagged in either 1.5- or 20-kg bags. Processing costs are estimated from the previous research of Onwulata & McAllon. 13 The additional extrusion step used in fully cooked FBFs (SC+, SSB, and SCB) increases processing cost by approximately US$0.02 per kilogram to US$0.25 per kilogram from US$0.23 for nonextruded FBFs. 13 We use the same processing costs for both the United States and Africa. We based this on the fact that electricity costs are higher in most African countries than the United States, but labor costs are significantly lower. Aside from direct processing costs, it is estimated that Africa has the highest indirect costs (security, corruption, transport, electricity, capital, and regulatory environment) in the world. 22
Transportation costs
Transportation cost data were obtained from private industry quotes as well as historical data from USAID. Data were analyzed using Microsoft Excel 2007 and SPSS 19. Transportation costs of transoceanic, regional, and local procurement of food aid were estimated from points of production in the United States, South Africa, Kenya, and Tanzania to the point of distribution at Project Concern International’s (PCI) warehouse in Bunda, Tanzania. PCI’s warehouse is chosen as the final destination; they partnered with Kansas State University to coordinate field trials of the different FBFs.
Total transportation costs were estimated from quoted commercial market prices, provided by various private transportation companies in March 2014. In order to obtain the most accurate cost estimations, all quotes were based on a 20-foot standard container with 17 metric tons of CSB in 20-kg bags and a total shipment of 200 metric tons total shipment quantity because this was the amount that Kansas State University shipped to Tanzania. Weight is important because it can change the cost estimates. 23 We obtained quotes for shipping CSB in order to reduce bias that may result in cost differences between various food aid products as much as possible. 24 For example, some FBFs are packaged in 1.5- to 2-kg bags, which would increase the volume and potentially lower the weight of the container and raise overall shipping costs slightly. Insurance costs, as provided by a private company in March 2014, were generally 1% of the value of the product and freight or approximately US$100 to US$400 per container (US$6 to US$24 per metric ton) and are not included in the quotes.
Transportation costs are estimated in 3 stages: interior domestic, ocean, and internal transport shipping and handling. Interior domestic transportation is from the point of production at the food processing facility to the domestic port, using shipping containers loaded onto rail or trucks. Ocean transportation is from the domestic port to Dar es Salaam, Tanzania, on ships. Currently, shipping containers are unloaded near the port and loaded onto trucks to be shipped inland to the PCI distribution center in Bunda, Tanzania, so we use these cost estimates for the internal transport shipping and handling costs. For products produced in Tanzania, transportation costs are estimated between the food manufacturing site in Dar es Salaam to Bunda by truck. It is important to note that these costs are at a point in time and can change rapidly due to changes in policy and fuel prices.
Cost Metrics
We used alpha values 25,26 as well as newly defined measures such as Nutrient Value Scores (NVS) and omega values 19 to compare the FBFs.
Nutrient value scores
The NVS is a metric designed for the direct comparison of different food baskets, taking a broad set of nutritional criteria into account, including protein, fat, calcium, iron, iodine, vitamin A, thiamin, riboflavin, niacin, and vitamin C. 19 Ryckembusch et al 19 developed the NVS because it determines cost-effectiveness using a broad range of nutritional criteria.
Our SSB and SCB are designed for undernourished children ages 6 to 59 months, therefore, certain nutritional criteria hold greater importance than others for our specific study. Rather than weighting each of the 10 nutrients based on importance as suggested by Ryckembusch et al, 19 we calculate the NVS based on 5 nutrients—energy, protein, fat, iron, and vitamin A—which we consider to be the most important for combating moderate malnutrition and promoting growth. Energy, protein, and fat are included as they are key to combating stunting and wasting, and vitamin A and iron are generally lacking among the target population of our study, the Mara Region, Tanzania. 27
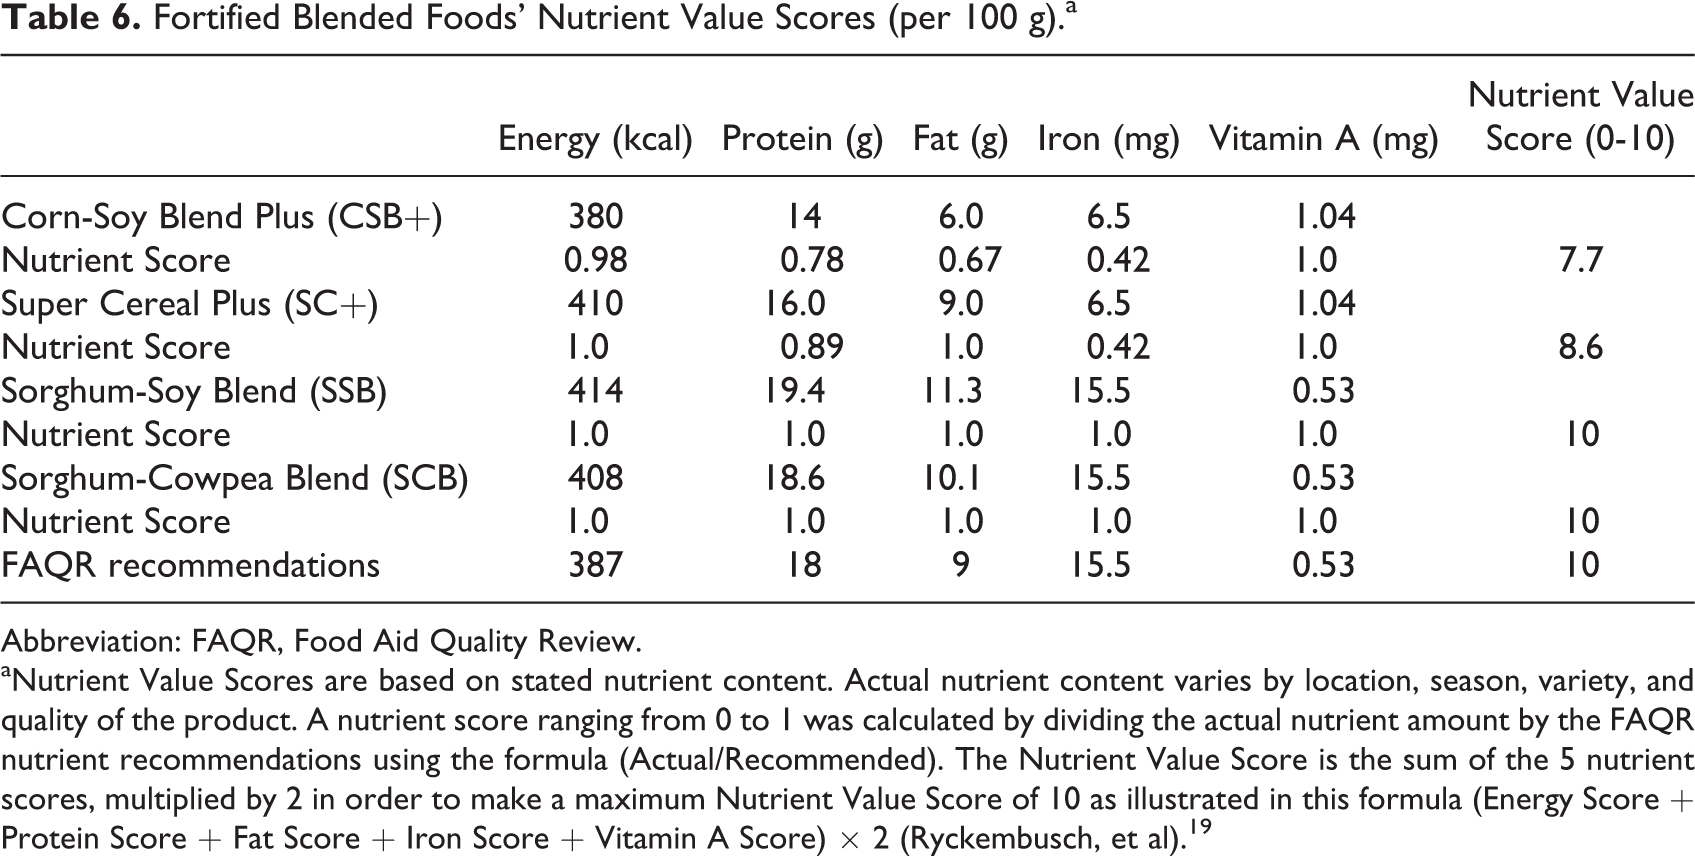
The FAQR report recommendations for energy, protein, fat, iron, and vitamin A per 100 g per person per day were used as the ideal reference in the NVS calculation. A nutrient score ranging from 0 to 1 was calculated by dividing the actual nutrient amount by the recommended nutrient amount using the following formula.

The NVS is the sum of the 5 nutrient scores, multiplied by 2 in order to make a maximum NVS of 10 as illustrated in this formula:
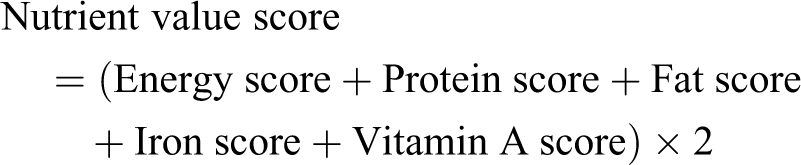
Each factor was given a discrete score ranging from 0 to 1, which represent meeting from 0% to 100% of the recommendation, respectively. An FBF will receive the maximum score of 10 if it meets or exceeds the FAQR recommendations for all 5 nutrients.
Alpha value
Alpha values were calculated to determine the cost-effectiveness of different food aid products produced in multiple countries. 25,26 The alpha value is a ratio of the United States food aid procurement cost divided by local and regional food aid procurement cost as illustrated in the following formula:
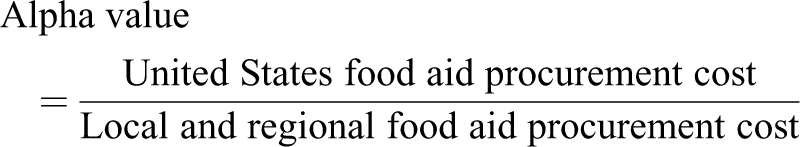
If the alpha value is greater than 1, this indicates that local and regional food aid procurement is more cost-effective than food aid procurement from the United States.
Omega values
The omega value combines the NVS with the alpha value in order to compare 2 different FBFs procured in 2 different countries at the same time. Developed by Ryckembusch et al 19 it is a response analysis tool that provides a comparison of the nutrients delivered per dollar spent or the nutrient cost-effectiveness. The omega value is intended to assist with decision-making in programs trying to reach nutritional objectives at the lowest cost. 19 In our study, the omega values are estimated using the total cost of the different FBFs, including production and transportation costs and the NVSs. In each scenario, we compare 2 FBFs procured in 2 different countries (United States, South Africa, Kenya, or Tanzania). The omega value is estimated as:
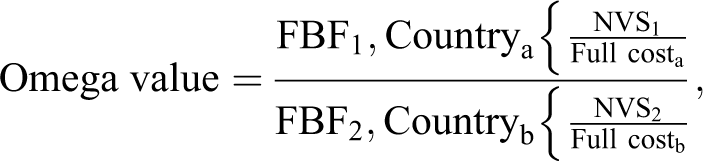
defined as the ratio of the NVS of a particular FBF (1) divided by the total cost of that same FBF in a particular country (a), over an identical ratio of an FBF (2) in a particular country (b).
Results
Ingredient Costs
Sorghum, as an alternative to corn, has a slightly lower price in the United States where sorghum and corn are close substitutes (Table 3). In most African countries, however, sorghum prices are considerably higher than corn; for example, food processors interviewed in Tanzania in March 2014 expected to pay close to 50% more for sorghum than corn. This is partially because corn is grown as a cash crop in most countries, while sorghum is grown for household consumption. Another reason may be that sorghum is in high demand from the beer manufacturers, raising the price above that of corn. 28 Corn is least expensive in South Africa at US$0.17 per kilogram as the country produces 20% of total corn production in Africa, while Tanzania is a large producer of sorghum. 29 Cowpeas, more commonly known as “black-eyed peas,” are significantly more expensive than soybeans in the United States. This is likely because cowpeas are consumed on a small scale, and the United States is a large exporter of soybeans. In most African countries, cowpeas are less expensive than soybeans as they are grown locally, while soybeans are often imported into African countries from the United States. 29 Both WPC80 and soybean oil typically must be imported into most African countries leading them to be more expensive compared to the cost if they were purchased in the United States. For example, WPC80 costs US$6.28 per kilogram in the United States and US$8.45 per kilogram in Tanzania, while soybean oil is only US$0.90 in the United States and US$1.04 to US$1.47 per kilogram in the African countries.
Processing Costs
Processing costs accounted for between 11% and 42% of the total production costs. These estimates are close to those of other studies, which estimate that using simple low-cost extruders, products can be made for 30% more than the cost of raw ingredients. Processing costs also increase when using degermed corn, decorticated sorghum, and partially or fully defatted soybeans as these add an additional processing step. 3
Transportation Costs
Total transportation costs from the United States, South Africa, and Kenya are 185%, 137%, and 108%, respectively, more expensive than transportation costs in Tanzania (Table 4). Transportation costs make up close to one-third of the total costs of the FBFs in these countries. In comparison to South Africa and Kenya, transportation costs are 20% and 37%, respectively, more expensive from the United States. Not surprisingly, internal transport shipping and handling costs are more expensive than oceanic costs, as Africa’s inland transport costs are some of the most expensive in the world. 22
Production Costs
In the United States, SSB and SCB are significantly more expensive than the existing FBFs (Table 5), similar to the results found by Hoppe et al 21 and Fleige et al. 1 Sorghum-Cowpea Blend is especially expensive in the United States, mainly because of the high price of cowpeas. In all countries except South Africa, SCB was the most expensive (Table 5). In South Africa, SSB was slightly more expensive than SCB. Even though cowpeas are less expensive than soybeans in all 3 African countries, SCB is more expensive than SSB in Tanzania and Kenya because SCB contains a much higher percentage of cowpeas than the content of soybeans in SSB (Table 2). Both CSB+ and SSB are produced most cheaply in the United States, among the countries examined in Africa; all 4 FBFs were produced at the lowest cost in South Africa. WPC80 is the biggest driver of costs among the 2 Kansas State University FBFs. Substituting soy protein isolate (SPI), which is made from defatted soy flour and is 80% to 90% protein, significantly reduces the cost of SSB and SCB. However, it should be noted that this would remove an animal source food; there is lack of consensus on whether including them in FBFs improves their effectiveness. 31
Composition of Fortified Blended Food Aid Products (% By Weight).a
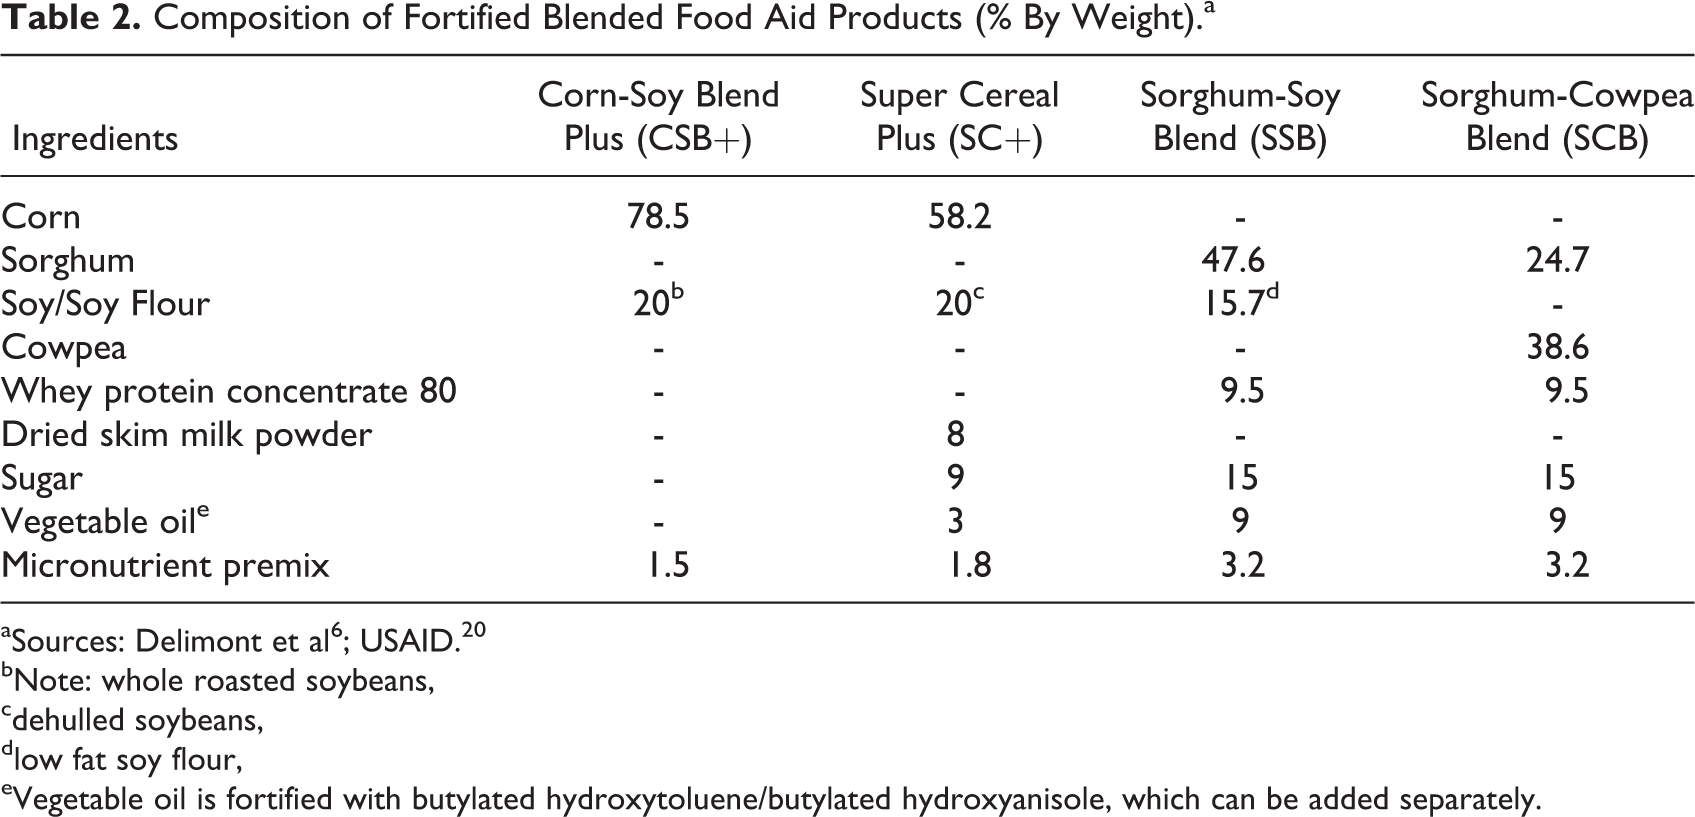
bNote: whole roasted soybeans, cdehulled soybeans, dlow fat soy flour, eVegetable oil is fortified with butylated hydroxytoluene/butylated hydroxyanisole, which can be added separately.
Ingredient Costs in the United States, South Africa, Kenya, and Tanzania 2009 to 2011 (US$/kg).a,b
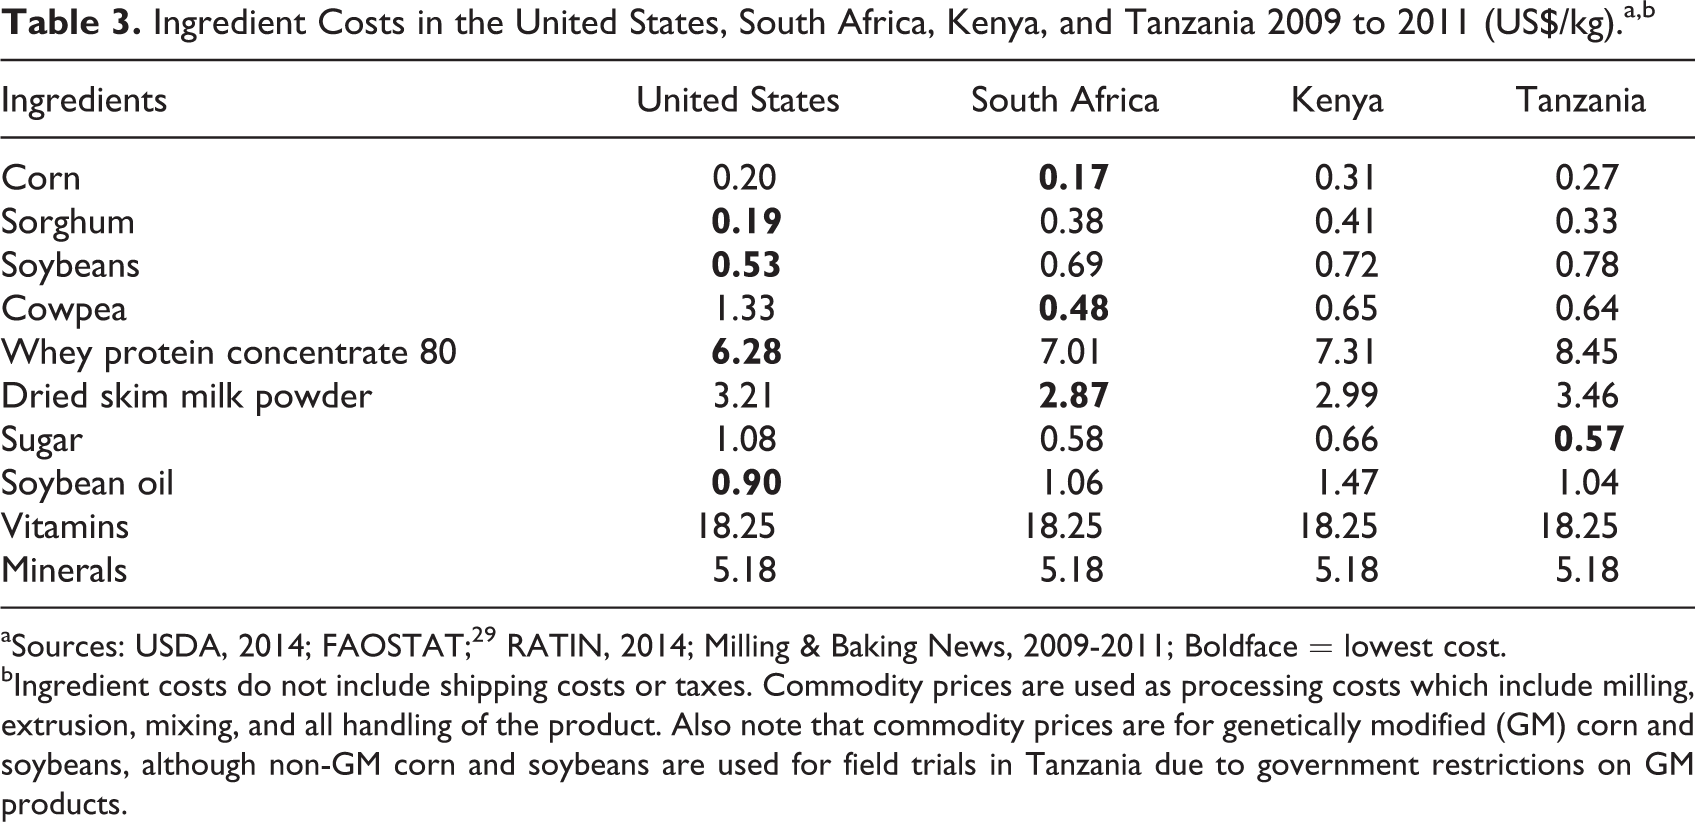
aSources: USDA, 2014; FAOSTAT; 29 RATIN, 2014; Milling & Baking News, 2009-2011; Boldface = lowest cost.
bIngredient costs do not include shipping costs or taxes. Commodity prices are used as processing costs which include milling, extrusion, mixing, and all handling of the product. Also note that commodity prices are for genetically modified (GM) corn and soybeans, although non-GM corn and soybeans are used for field trials in Tanzania due to government restrictions on GM products.
Estimated Transportation Costs of 200 Metric Tons of CSB From Various Countries to Bunda, Tanzania, March 2014 (USD/MT).a
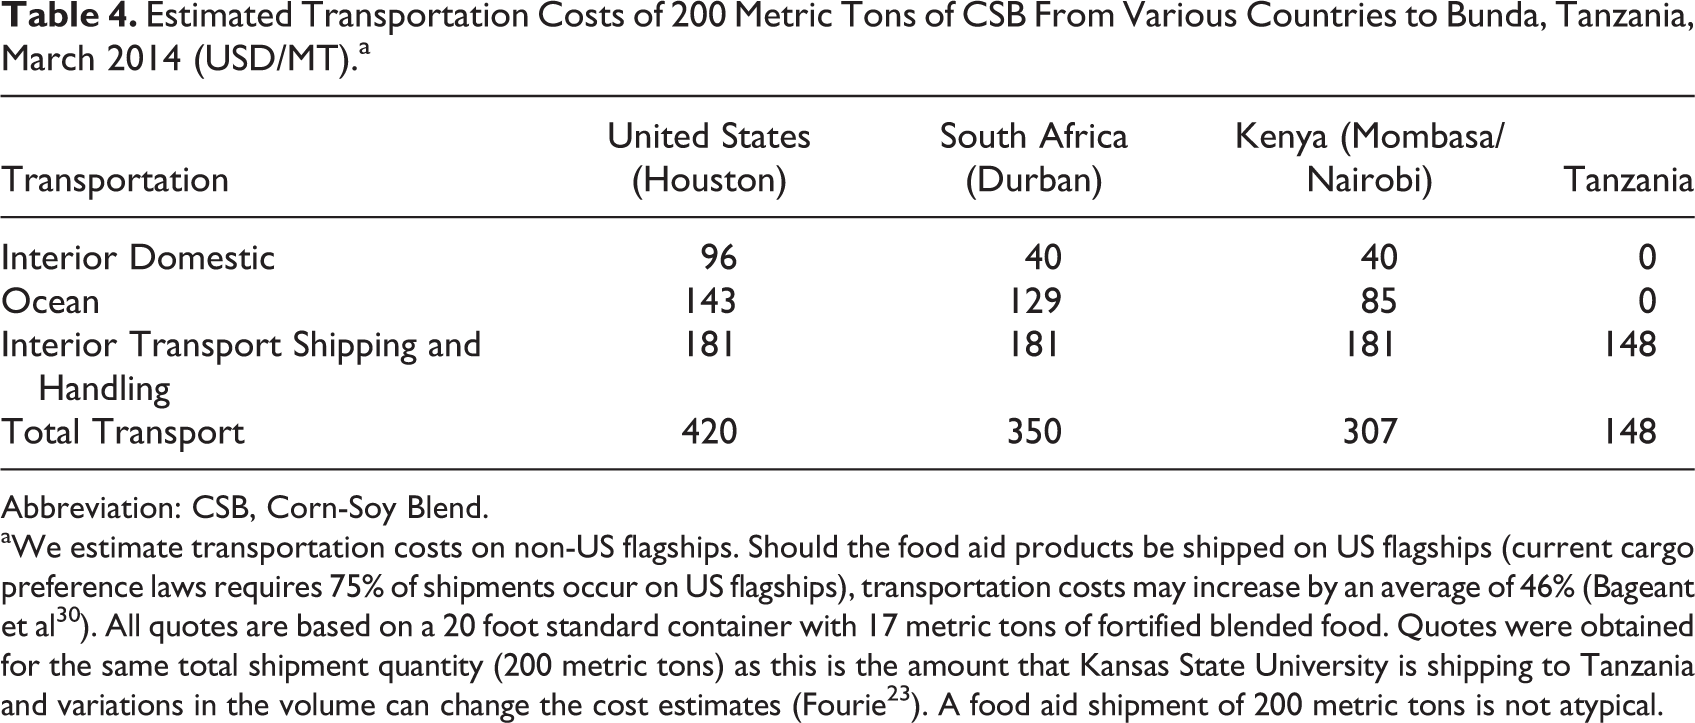
Abbreviation: CSB, Corn-Soy Blend.
aWe estimate transportation costs on non-US flagships. Should the food aid products be shipped on US flagships (current cargo preference laws requires 75% of shipments occur on US flagships), transportation costs may increase by an average of 46% (Bageant et al 30 ). All quotes are based on a 20 foot standard container with 17 metric tons of fortified blended food. Quotes were obtained for the same total shipment quantity (200 metric tons) as this is the amount that Kansas State University is shipping to Tanzania and variations in the volume can change the cost estimates (Fourie 23 ). A food aid shipment of 200 metric tons is not atypical.
Fortified Blended Foods’ Components, Production, Transportation, and Total Estimated Costs (US$/kg).
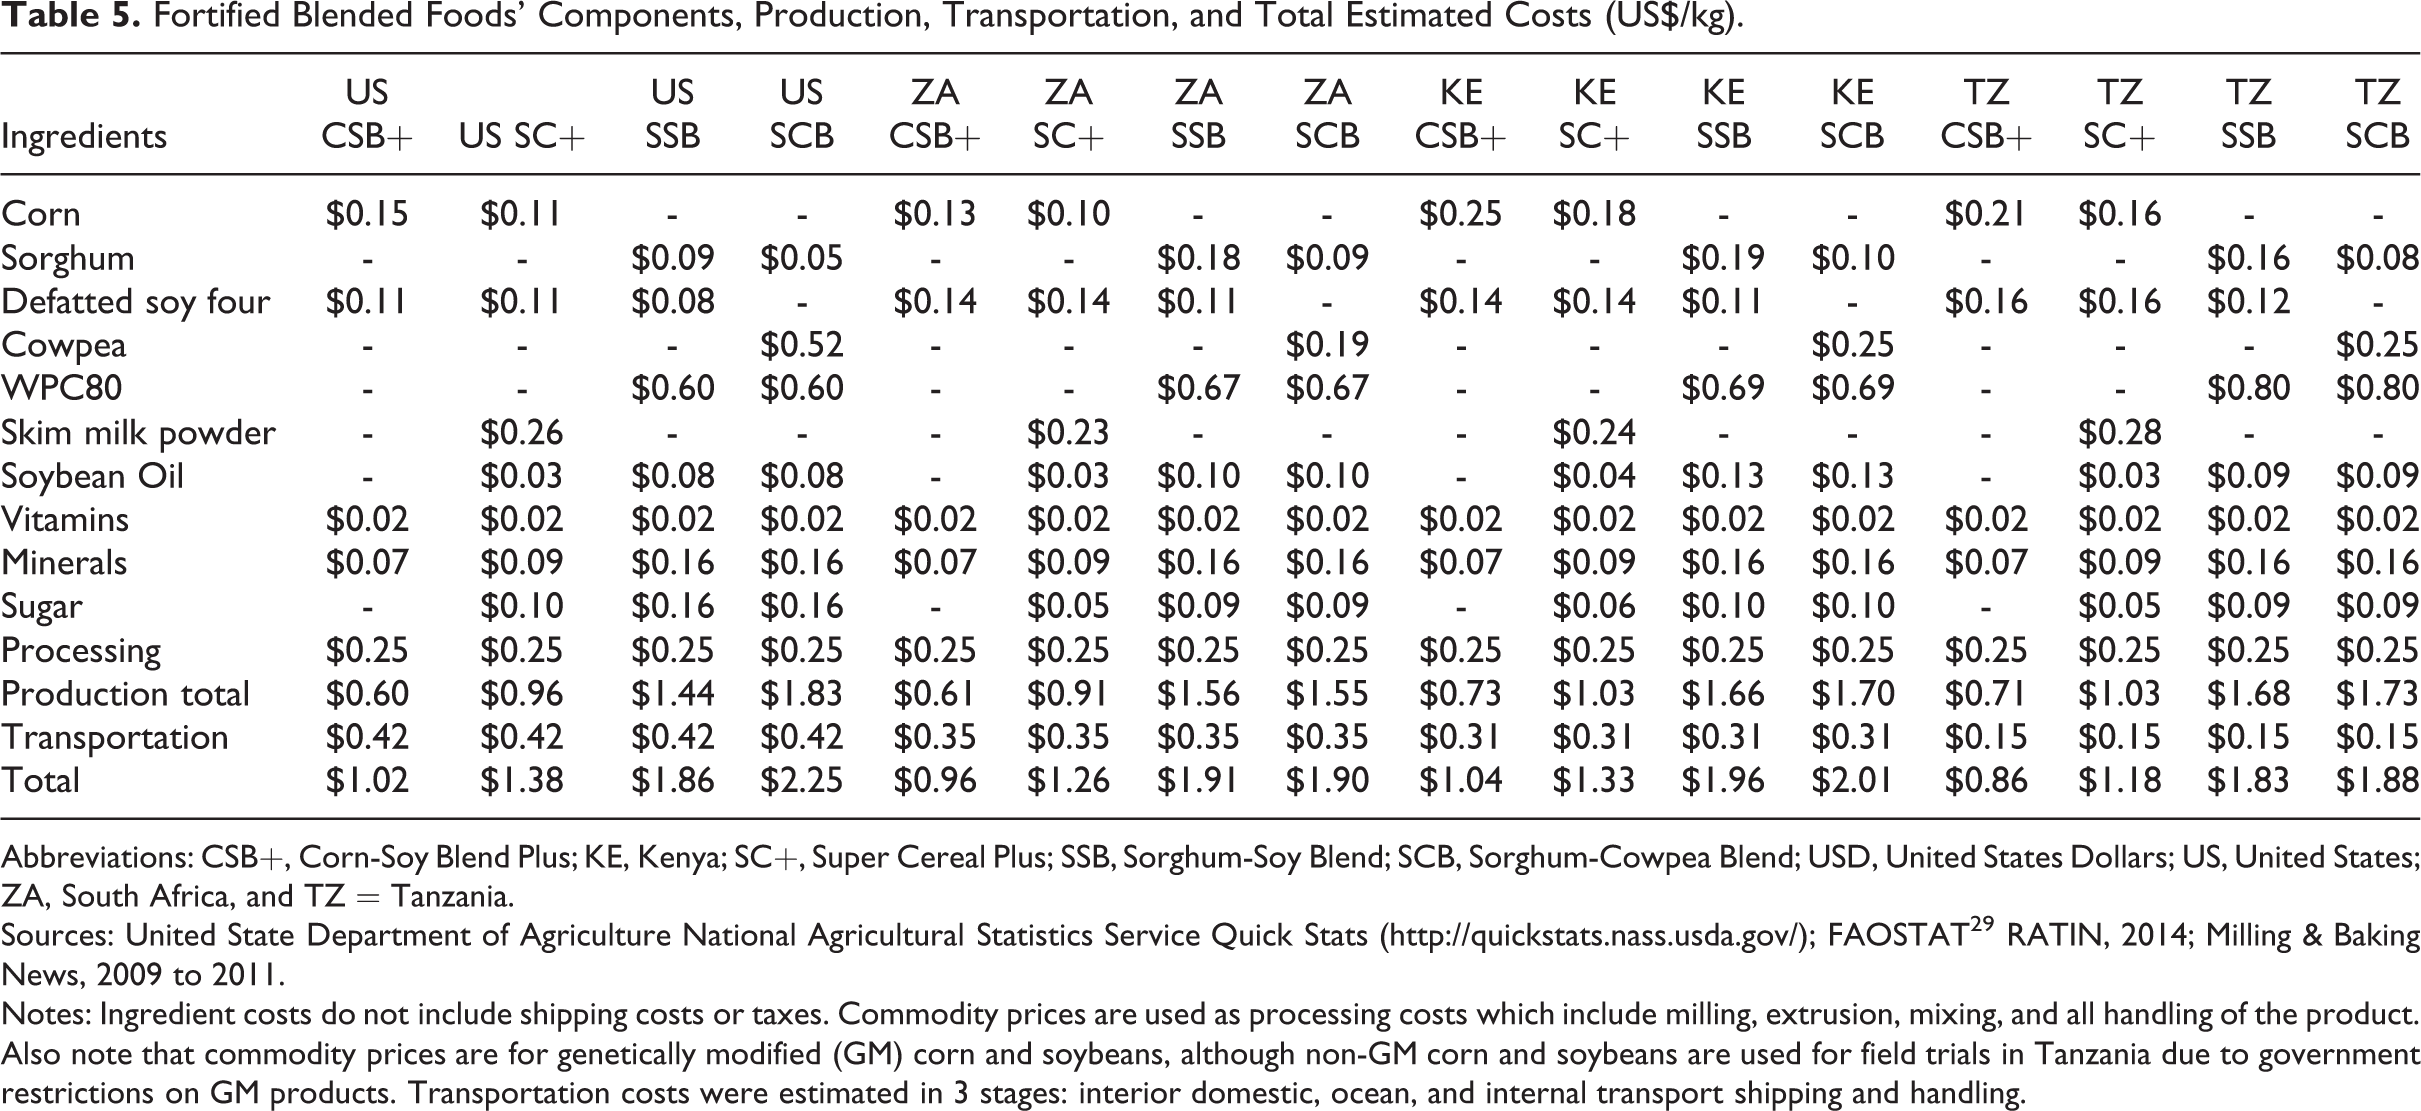
Abbreviations: CSB+, Corn-Soy Blend Plus; KE, Kenya; SC+, Super Cereal Plus; SSB, Sorghum-Soy Blend; SCB, Sorghum-Cowpea Blend; USD, United States Dollars; US, United States; ZA, South Africa, and TZ = Tanzania.
Sources: United State Department of Agriculture National Agricultural Statistics Service Quick Stats (http://quickstats.nass.usda.gov/); FAOSTAT 29 RATIN, 2014; Milling & Baking News, 2009 to 2011.
Notes: Ingredient costs do not include shipping costs or taxes. Commodity prices are used as processing costs which include milling, extrusion, mixing, and all handling of the product. Also note that commodity prices are for genetically modified (GM) corn and soybeans, although non-GM corn and soybeans are used for field trials in Tanzania due to government restrictions on GM products. Transportation costs were estimated in 3 stages: interior domestic, ocean, and internal transport shipping and handling.
Cost per Kilogram
The cost-effectiveness of the different FBFs in terms of cost per kilogram was calculated by combining the total costs of both production and transportation to PCI distribution center in Bunda, Tanzania (Table 5). All 4 FBFs can be produced in Tanzania and delivered to PCI at a lower cost relative to every other country, mainly due to low transportation costs in Tanzania and without the need for costly ocean freight. CSB+ is the least costly FBF in all 4 countries, mainly because it does not contain WPC80 or dried skim milk powder.
Both SSB and SCB are significantly more expensive than CSB+ and SC+ in each of the countries examined. When examining the cost breakdown between SC+ and SSB produced in the United States, the use of WPC80 instead of dried skim milk powder is a driving factor in cost, increasing the cost of SSB by US$0.34.
Nutrient Value Scores
Since the sorghum-based FBFs were formulated to meet the FAQR report, it is not surprising that they earned a perfect NVS of 10 (Table 6). Corn-Soy Blend Plus has the lowest NVS of 7.69 since it does not have vegetable oil and is low in iron relative to other FBFs.
Fortified Blended Foods’ Nutrient Value Scores (per 100 g).a
Abbreviation: FAQR, Food Aid Quality Review.
aNutrient Value Scores are based on stated nutrient content. Actual nutrient content varies by location, season, variety, and quality of the product. A nutrient score ranging from 0 to 1 was calculated by dividing the actual nutrient amount by the FAQR nutrient recommendations using the formula (Actual/Recommended). The Nutrient Value Score is the sum of the 5 nutrient scores, multiplied by 2 in order to make a maximum Nutrient Value Score of 10 as illustrated in this formula (Energy Score + Protein Score + Fat Score + Iron Score + Vitamin A Score) × 2 (Ryckembusch, et al). 19
Alpha Values
Alpha values (Table 7) are interpreted as follows: if the alpha value for SC+ is greater than one in South Africa (alpha value = 1.10 > 1), this indicates that it is more cost-effective to procure SC+ from South Africa than from the United States and that producing SC+ in South Africa will result in a cost savings of 10%. Multiple products in Tanzania can be produced at 17% to 20% lower cost than in the United States, largely due to lower transportation costs. As is evident in the results, the most cost-effective location to procure different FBFs depends greatly on the country and type of FBF. Also, these results are continually subject to market fluctuations.
South Africa, Kenya, and Tanzania Alpha Values Compared to US Fortified Blended Food Procurement Cost.a
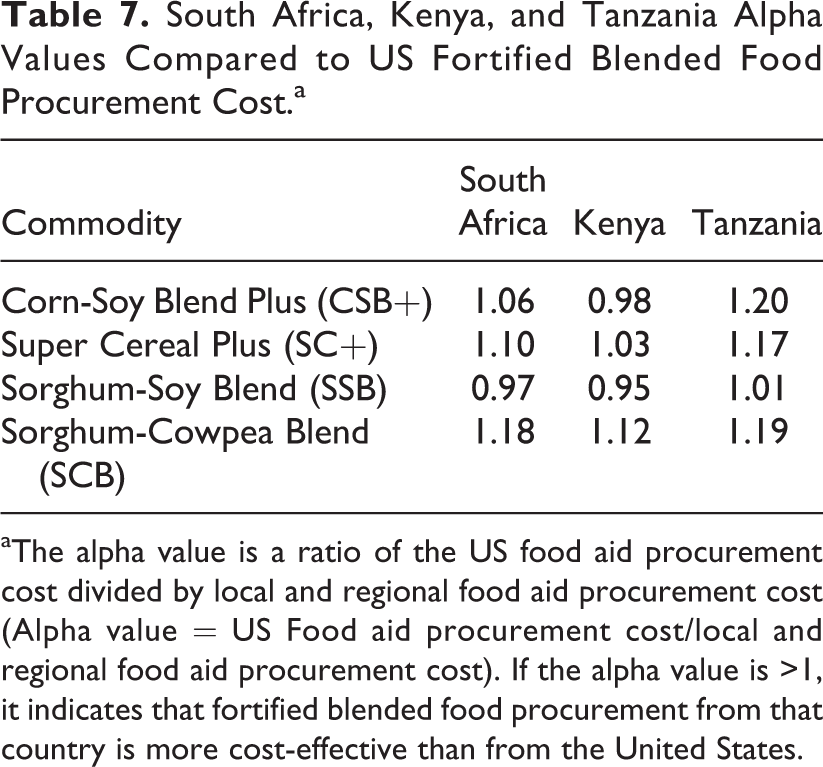
aThe alpha value is a ratio of the US food aid procurement cost divided by local and regional food aid procurement cost (Alpha value = US Food aid procurement cost/local and regional food aid procurement cost). If the alpha value is >1, it indicates that fortified blended food procurement from that country is more cost-effective than from the United States.
Even after considering transportation costs, the cost to procure SSB is very similar in the United States (US$1.86/kilogram) and Tanzania (US$1.83/kilogram). When the total costs are broken down by transportation, processing, and ingredient costs, SSB procured from the United States is competitive with SSB from Tanzania because of the low cost of sorghum, soy flour, and WPC80, which counteract the high cost of transportation (Table 5). Alternatively, SCB is more expensive to procure from the United States due to the high cost of cowpeas (Table 3).
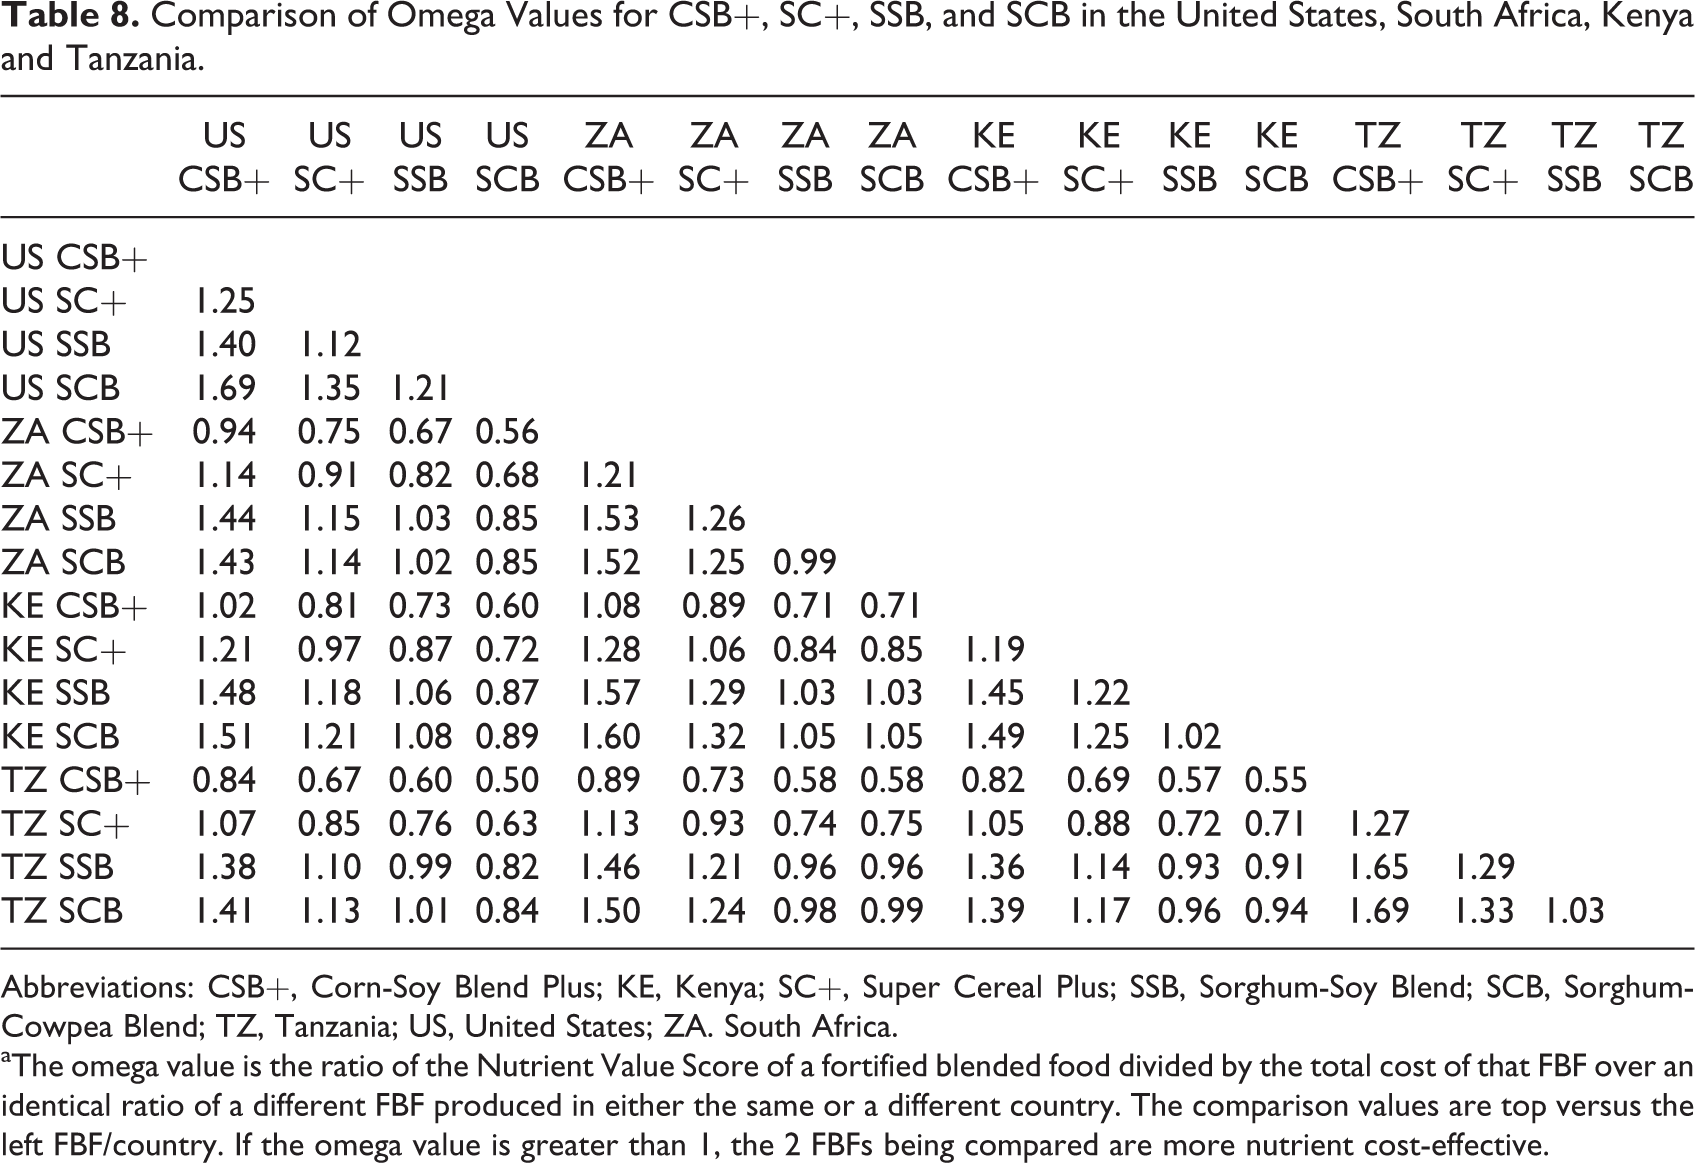
While alpha values allow us to compare the total cost of a particular FBF in multiple countries, and the NVS allows us to compare the nutrient content of different FBFs, omega values allow us to answer more complex questions. In Table 8, we compared all 4 FBFs from all 4 countries. Each combination of FBF and country at the top of the table can be compared to each combination on the left side of the table. The interpretation is that whenever the omega value is higher than 1, it is more nutrient cost-effective to produce the FBF at the top of the table. For example, SSB produced in the United States is more nutrient cost-effective than producing SCB in the United States (omega value = 1.21), SSB in South Africa (1.03), and so on.
Comparison of Omega Values for CSB+, SC+, SSB, and SCB in the United States, South Africa, Kenya and Tanzania.
Abbreviations: CSB+, Corn-Soy Blend Plus; KE, Kenya; SC+, Super Cereal Plus; SSB, Sorghum-Soy Blend; SCB, Sorghum-Cowpea Blend; TZ, Tanzania; US, United States; ZA. South Africa.
aThe omega value is the ratio of the Nutrient Value Score of a fortified blended food divided by the total cost of that FBF over an identical ratio of a different FBF produced in either the same or a different country. The comparison values are top versus the left FBF/country. If the omega value is greater than 1, the 2 FBFs being compared are more nutrient cost-effective.
We can use these data to compare nutrient cost-effectiveness of the procurement of different FBFs from different sources. For example, using CSB+ from the United States, CSB+ and SC+ from South Africa, and SSB and SCB, both with WPC80, from Tanzania, the omega value can be used to calculate the most nutrient cost-effective FBF. Using CSB+ procured in the United States as the baseline, the results indicate that CSB+ procured in the United States is less nutrient cost-effective than CSB+ procured in South Africa and Tanzania (omega value < 1), but more nutrient cost-effective than all the other FBFs (omega value > 1).
Comparing SSB from the United States, CSB+ and SC+ are more nutrient cost-effective options in all 4 countries since the omega values are all less than 1. However, SSB is more nutrient cost-effective than SCB in all 4 countries. Although SSB does have a superior nutritional profile to CSB+ and SC+, the newly developed SSB produced in the United States are less nutrient cost-effective than the FBFs that are currently available.
Discussion
Both CSB+ and SSB were produced most economically in the United States because of the lower cost of soybeans and oil in the United States, as well as the low cost of WPC80, corn, and sorghum. It is the least expensive to produce SC+ and SCB in South Africa, where corn, cowpeas, and dried skim milk powder are cheaper than other countries. This is not surprising because South Africa is a large producer and exporter of corn, and large quantities of soybeans are imported into Durban, South Africa, and then exported to neighboring countries, according to visits with exporters in February 2014.
Several studies have estimated the impact of milk powder on cost of FBFs, such as Hoppe et al 21 who found that the addition of 10% to 15% milk powder doubles the price of the FBF. Similarly, Fleige et al 1 indicated that the addition of 10% WPC80 to CSB increases the production costs by 91%. Another study found that removing milk powder from ready-to-use therapeutic food can reduce cost by 33%. 32 Previous literature and quotes from private companies suggest that WPC80 is approximately 2 times more expensive than SPI 33 ; therefore, when SPI substituted for WPC80, it significantly reduces costs of SSB and SCB.
The cost-effectiveness of food aid products is crucial for food aid agencies to make informed decisions in order to reach the greatest number of recipients. Multiple studies have compared the cost-effectiveness of local, regional, and transoceanic procurement of food aid, with a majority concluding that local and regional procurement is the most cost-effective. 34 For example, the United States Government Accountability Office 16 found that the average cost of locally procured food in sub-Saharan Africa was 34% lower than transoceanic food aid from the United States. The Organization for Economic Co-operation and Development (OECD) 26 found that locally and regionally procured food aid is 33% and 50% less expensive than transoceanic food aid, respectively. Lastly, Lentz and Barrett et al 25 found cost savings of 21% from local purchase of the same commodity as was being provided by food aid.
In regard to FBFs, the OECD 26 estimated cost savings of 70% and 46% for locally and regionally procured CSB, respectively, compared to transoceanic shipments, and a second study found that FBFs are 16% less expensive when procured locally. 35 Lentz et al 36 found that the cost-effectiveness of local and regional procurement depends greatly on the country and commodity. For local procurement of pulses and cereals, the average cost savings were 25% and 53%, respectively. The exception was processed products, vegetable oil, and CSB, which were significantly more expensive when purchased locally and regionally. Only in Kenya, where local processing is well developed and markets are competitive, CSB was 19% less expensive than CSB procured from the United States. 24
Multiple cost metrics have been used to compare food aid products, including cost per metric ton, cost per kilogram, cost per beneficiary, cost per ration, or cost per desired outcome. 2,17,26 Other cost metrics have been determined in terms of cost per impact, cost per case treated, or more specifically as cost per kilocalorie, cost per gram of protein, or cost per gram of fat. 18 Cost has been especially important in recent years, as sharp increases in the price of food and fuel have led to an increased need for food aid and resulted in a decline in US food aid volumes from 5.0 million metric tons in 2002 to less than 1.8 million metric tons in 2012. 37
The omega value provides nutrient cost-effectiveness measures of various food aid products; however, it does not take into consideration several important factors that also influence cost-effectiveness of food aid products. First, locally and regionally sourced food aid can be delivered on average 10 weeks faster than transoceanic shipments, a time savings of 57% according to one study, 35 and 13.8 weeks faster or a savings of 62% according to another study. 24 Second comparisons were made based on kilograms of FBF and not per ration or serving. This is worth noting because SSB and SCB also are designed to be prepared with 20% solids compared to CSB+ and SC+ which are prepared with less than 12% solids and nearly one-half the nutrient and caloric density per serving. Integrating these factors, and others, into a metric similar to the omega value could provide a more complete comparison of different food aid products and allow more informed decision-making.
This study has some limitations that are important to note. First, ingredient nutrient and prices/cost vary over time, location, season, variety, and quality, which are not fully reflected in our analysis here. The lack of more specific food and transportation cost at different time points prevented us from looking at these variations which are significant. In addition, the nutrient content is also stated and not measured values. It should also be noted that nutrients in the calculation of omega values have not been weighted. Future applications may weight the nutrients in the calculation in a more intentional manner. Our analysis compared new FBFs USDA’s CSB+, not a product like CSB14 + oil, proposed in the FAQR5, that has fortified oil added in preparation. Comparisons of the newer products to CSB14+ oil would be different than USDA’s CSB+.
Conclusion
The results of this research, based on commodity prices at the time, found that CSB+ and SC+ were more nutrient cost-effective than the newly developed SSB and SCB. However, SSB and SCB may be viable options in certain contexts and applications. In addition, some changes in their formulation may further improve their cost-effectiveness. Production and transportation costs are important considerations for food aid agencies when comparing the cost-effectiveness of different food aid products. However, the results of this study suggest that it is equally important to consider the nutrient content of alternative food aid products when determining how these products will most effectively meet project and program objectives and recipient needs. The omega value provides a systematic way to compare products’ nutrient cost-effectiveness and could therefore enhance food aid agencies procurement decision-making.
Footnotes
Authors’ Note
The views and opinions expressed in this report are those of the authors and do not necessarily reflect the official policy or position of Kansas State University or US Department of Agriculture. Brian L. Lindshield is also affiliated with Department of Food, Nutrition, Dietetics and Health, Kansas State University, Manhattan, KS, USA.
Acknowledgments
Assistance from Lijia Zhu, Sandra Proctor and Sajid Alavi in reviewing this article prior to submission was greatly appreciated.
Declaration of Conflicting Interests
The author(s) declared no potential conflicts of interest with respect to the research, authorship, and/or publication of this article.
Funding
The author(s) disclosed receipt of the following financial support for the research, authorship, and/or publication of this article: Funding for this research was provided by a grant from the Foreign Agricultural Service (Micronutrient Fortified Food Aid Pilot Project-MFFAPP) program, contract number #FFE-621-2012/033-00.