
Abstract
Background:
Undernutrition among schoolchildren is a prevalent public health problem which may be due to inadequate energy and nutrient intakes associated with low dietary diversity.
Objective:
This study assessed dietary diversity scores (DDS), energy and nutrient intakes of schoolchildren (6-15 years), and risks factors of DDS and determined if energy and nutrient intakes were dependent on dietary diversity.
Methods:
The study involved a 2-stage random sampling of 90 schoolchildren. Dietary diversity and nutrient intake data were obtained through a 3-day weighed food intake. Analysis of variance, t test, and χ2 with Cochran-Mantel-Haenszel test were used to determine relationships among and between variables; P < .05 was reported as significant.
Results:
Few (22.2%) had high DDS with no significant difference (P > .05) between age groups and sex. Children from male headed households were more likely to have medium DDS (odds ratio [OR] = 3.231; 95% confidence interval [CI] = 1.037-10.070) than those from female headed households (P < .05). Low nutrient intakes were observed among 85.6% for niacin, 76.7% for calcium, 72.2% for riboflavin, 54.4% for protein, 32.2% for thiamine, and 15.6% for vitamin C. Among boys, prevalence of inadequate riboflavin intake was significantly (P < .05) higher among 6- to 9-year-olds. Among girls, prevalence of inadequate vitamin A intake was significantly (P < .01) higher among 10 to 15-year-olds. Children with adequate intakes of iron (OR = 0.744, 95% CI = 0.653-0.847) and thiamine (OR = 5.651, 95% CI = 1.214-26.310) were more likely to have high DDS.
Conclusion:
The schoolchildren had low energy and nutrient intakes. Iron and thiamine, intakes were dependent on DDS.
Introduction
Nutrition problems among schoolchildren have become a concern as evidence shows high prevalence of underweight, stunting, and thinness relative to under-5 children. According to 2013 Nigerian National Demographic and Health Survey, 1 37.0%, 18.0%, and 29.0% of under-5 children were stunted, wasted, and underweight, respectively. Unfortunately, there is no national data on nutritional status of schoolchildren but some studies show that they may have higher prevalence rates. A study on schoolchildren aged 7 to 12 years in Abia State, Nigeria reported underweight, stunting, and wasting prevalence of 77%, 77%, and 56%, respectively. 2 Severe underweight (35%), moderate underweight (45%), moderate (49.2%), and severe stunting (26.4%) were reported among schoolchildren in Kawo district of Kaduna metropolis, Nigeria. 3
Undernutrition, a condition in which the body receives calories and nutrients in quantities below its daily requirements to meet its physiologic needs comprised underweight, stunting, wasting, and micronutrient deficiencies. Unlike underweight, stunting and wasting, the effects of micronutrient deficiencies are not always easy to detect. They transcend physical manifestations to include numerous physiologic disturbances.
More than 2 billion people in the world are estimated to be deficient in key vitamins and minerals particularly vitamin A, iodine, iron, and zinc. 4 Children are particularly vulnerable to undernutrition due to their high nutrient requirements for growth and susceptibility to infectious diseases such as diarrhea and respiratory infections, which may inhibit nutrient absorption and decrease appetite 5 with huge consequences on energy and nutrient intakes. Deficiencies occur when they do not consume or have access to nutrient dense foods. Protein energy deficiency is worsened with low consumption of micronutrient rich foods such as fruits, vegetables, animal products, and fortified foods because micronutrients such as niacin and riboflavin play significant roles in the metabolism of energy-yielding nutrients.
Schoolchildren may be more vulnerable. Often, they go to school without meals 6 or consume their meals in a hurry. Besides, there is usually no time for elaborate meals and often fruits and vegetables are not components of such meals. It was observed that some consume only steamed bambara groundnut pudding (bought from hawkers) as breakfast and this practice may span throughout the 5 school days of a week (personal observation). This low dietary diversity in breakfast meals may adversely affect their energy and nutrient intakes, growth, and development.
Increasing food variety and dietary diversity may increase nutrient intakes from varied sources and impact positively on nutritional status. Rah et al 7 confirmed that improved dietary diversity was associated with higher height-for-age Z-scores among children in rural Bangladesh. Quality of meals especially breakfast influences cognitive development and functioning as well as academic performance of children. 8,9 Nutrient density of children’s diet is often insufficient to meet their nutrient requirements and increasing the diversity of foods through inclusion of meat, poultry, fish, eggs, fruits, and vegetables is recommended to improve micronutrient intakes of children. 10
Diversification of diets ensures that no one food group is depended upon as individual food groups are limiting in one or more nutrients. Consumption of foods from varied food groups not only guarantees better nutrient intakes, it also enhances nutrient absorption and utilization through nutrient interrelationships such as the role played by vitamin C in iron absorption.
Data on dietary diversity and nutrient intakes of schoolchildren in Nigeria are limited and lacking in the area of study. This study would provide vital data on mean nutrient intakes of schoolchildren as well as prevalence of inadequate nutrient intakes to guide planning of school and household meals.
Materials and Methods
Study Participants
The study involved primary and secondary schoolchildren in 7 primary and 3 secondary schools in Ede-Oballa, a rural community in South-East Nigeria.
Study Design
The study employed a cross-sectional survey design.
Sample Size and Sampling Technique
A subsample comprising 20% of 450 schoolchildren who were involved in the larger study was used to assess the dietary diversity and nutrient intakes of the schoolchildren. The sample size of 450 was determined through a single population proportion formula, and the selection of the 90 schoolchildren for this study was achieved through a 2-stage sampling technique that involved (1) stratified proportionate random sampling technique used to determine the sample size for each school, and (2) simple random sampling employed in selecting the children from all 10 schools in the community. The classes and ages formed the strata.
Ethical Approval/Informed Consent
Ethical approval for this study was obtained from Ethical Committee of Enugu State Ministry of Health (MH/MSD/38). Nature of the study was explained to both the parents/guardians and their children, and written consent was obtained.
Data Collection Methods
Determination of dietary diversity scores
A method adapted from Steyn et al 11 was used to assess the dietary diversity scores (DDS) of the schoolchildren. Dietary diversity score was defined as the number of food groups consumed over a 24-hour period. For this study, two 24-hour periods were used and the mean calculated. The data obtained from day 1 and day 3 of the 3-day weighed food intake were used to assess DDS. All consumed foods (reported and observed) including snacks and drinks consumed within and outside the home during this period were included in DDS calculation. Ingredients in mixed dishes were probed into and included in the calculation. Sixteen food groups recommended by FAO 12 were collapsed into 9 food groups in line with the study of Steyn et al 11 : (1) starchy staples (cereals and starchy fruits, roots, and tubers); (2) legumes, nuts, and seeds; (3) meats (organ and flesh), fish, and sea foods; (4) eggs; (5) milk and milk products; (6) vitamin A-rich fruits and vegetables such as mango, pawpaw, carrots, pepper, and sweet/orange flesh sweet potatoes; (7) Other fruits including fruit juices; (8) other vegetables; and (9) fats and oil. Scores (1) were assigned to any food group consumed within the period of study only once irrespective of the number of times they were consumed during the period and none (0) to any food group not consumed. The scores for each schoolchild were summed up (for day 1 and day 3, respectively) and mean of the scores obtained from the 2 assessments (on day 1 and day 3) was taken as the DDS for the child. In line with Steyn et al 11 , Ray et al, 7 and Darapheak et al, 13 a scoring scale of 0 to 9 was used. The least score was 0 and highest score was 9. These were classified as low (≤3 food groups), medium (4 and 5 food groups), and high (≥6 food groups) according to the FAO 14 guidelines. The percentage consumption of the food groups was also calculated by summing the number of children who consumed each food group.
Weighed food intake
A 3-day weighed food intake (2 week days and 1 weekend day) was carried out to determine energy and nutrient intakes of the schoolchildren according to the method described by Ayogu et al. 15 All raw ingredients including the cook pot were weighed prior to cooking and weight of the cooked food calculated. Quantity consumed by each child was obtained by subtracting plate wastes and leftovers from the portion given the child. Food composition tables were used to calculate energy and nutrient values of the foods. Mean nutrient intakes of the 3 days were calculated and compared to recommended nutrient intake (RNI) standards 16 -19 to obtain percentage contributions. Intakes that provided 100% of the RNI were taken as adequate.
Statistical Analysis
Statistical Package for Social Sciences (SPSS, version 16) was used in statistical analysis. Results of descriptive statistical analysis were presented in frequencies, percentages, means, and standard deviations. Analysis of variance was used to compare intakes among the age groups. Means of DDS was compared between sex and dichotomous age using t test. Bivariate analysis using cross tabulation and χ2 (Cochran-Mantel-Haenszel test) was also carried out to determine risk factors of low DDS as well as association of energy and nutrient intakes with DDS. Odds ratios were generated and reported. P values less than .05 were taken to indicate statistical significance.
Results
Study Participants
The study involved 45.6% of children aged 6 to 9 years and 54.4% of those within 10 to 15 years; 36.7% were males while 63.3% were females.
Consumption of Food Groups
Figure 1 presents the percentage consumption of food groups among the schoolchildren. Starchy staples (cereals and starchy roots/tubers/fruits; 96.7%); fats and oil (95.6%); and legumes, nuts, and seeds (60.0%) were consumed by majority of the children. Less than half consumed milk and milk products (47.8%), meat, poultry, fish, and seafood (46.7%). Few consumed eggs (13.3%), fruits (35.6%), and vegetables (32.1%). All (100.0%) consumed vitamin A rich-food group.
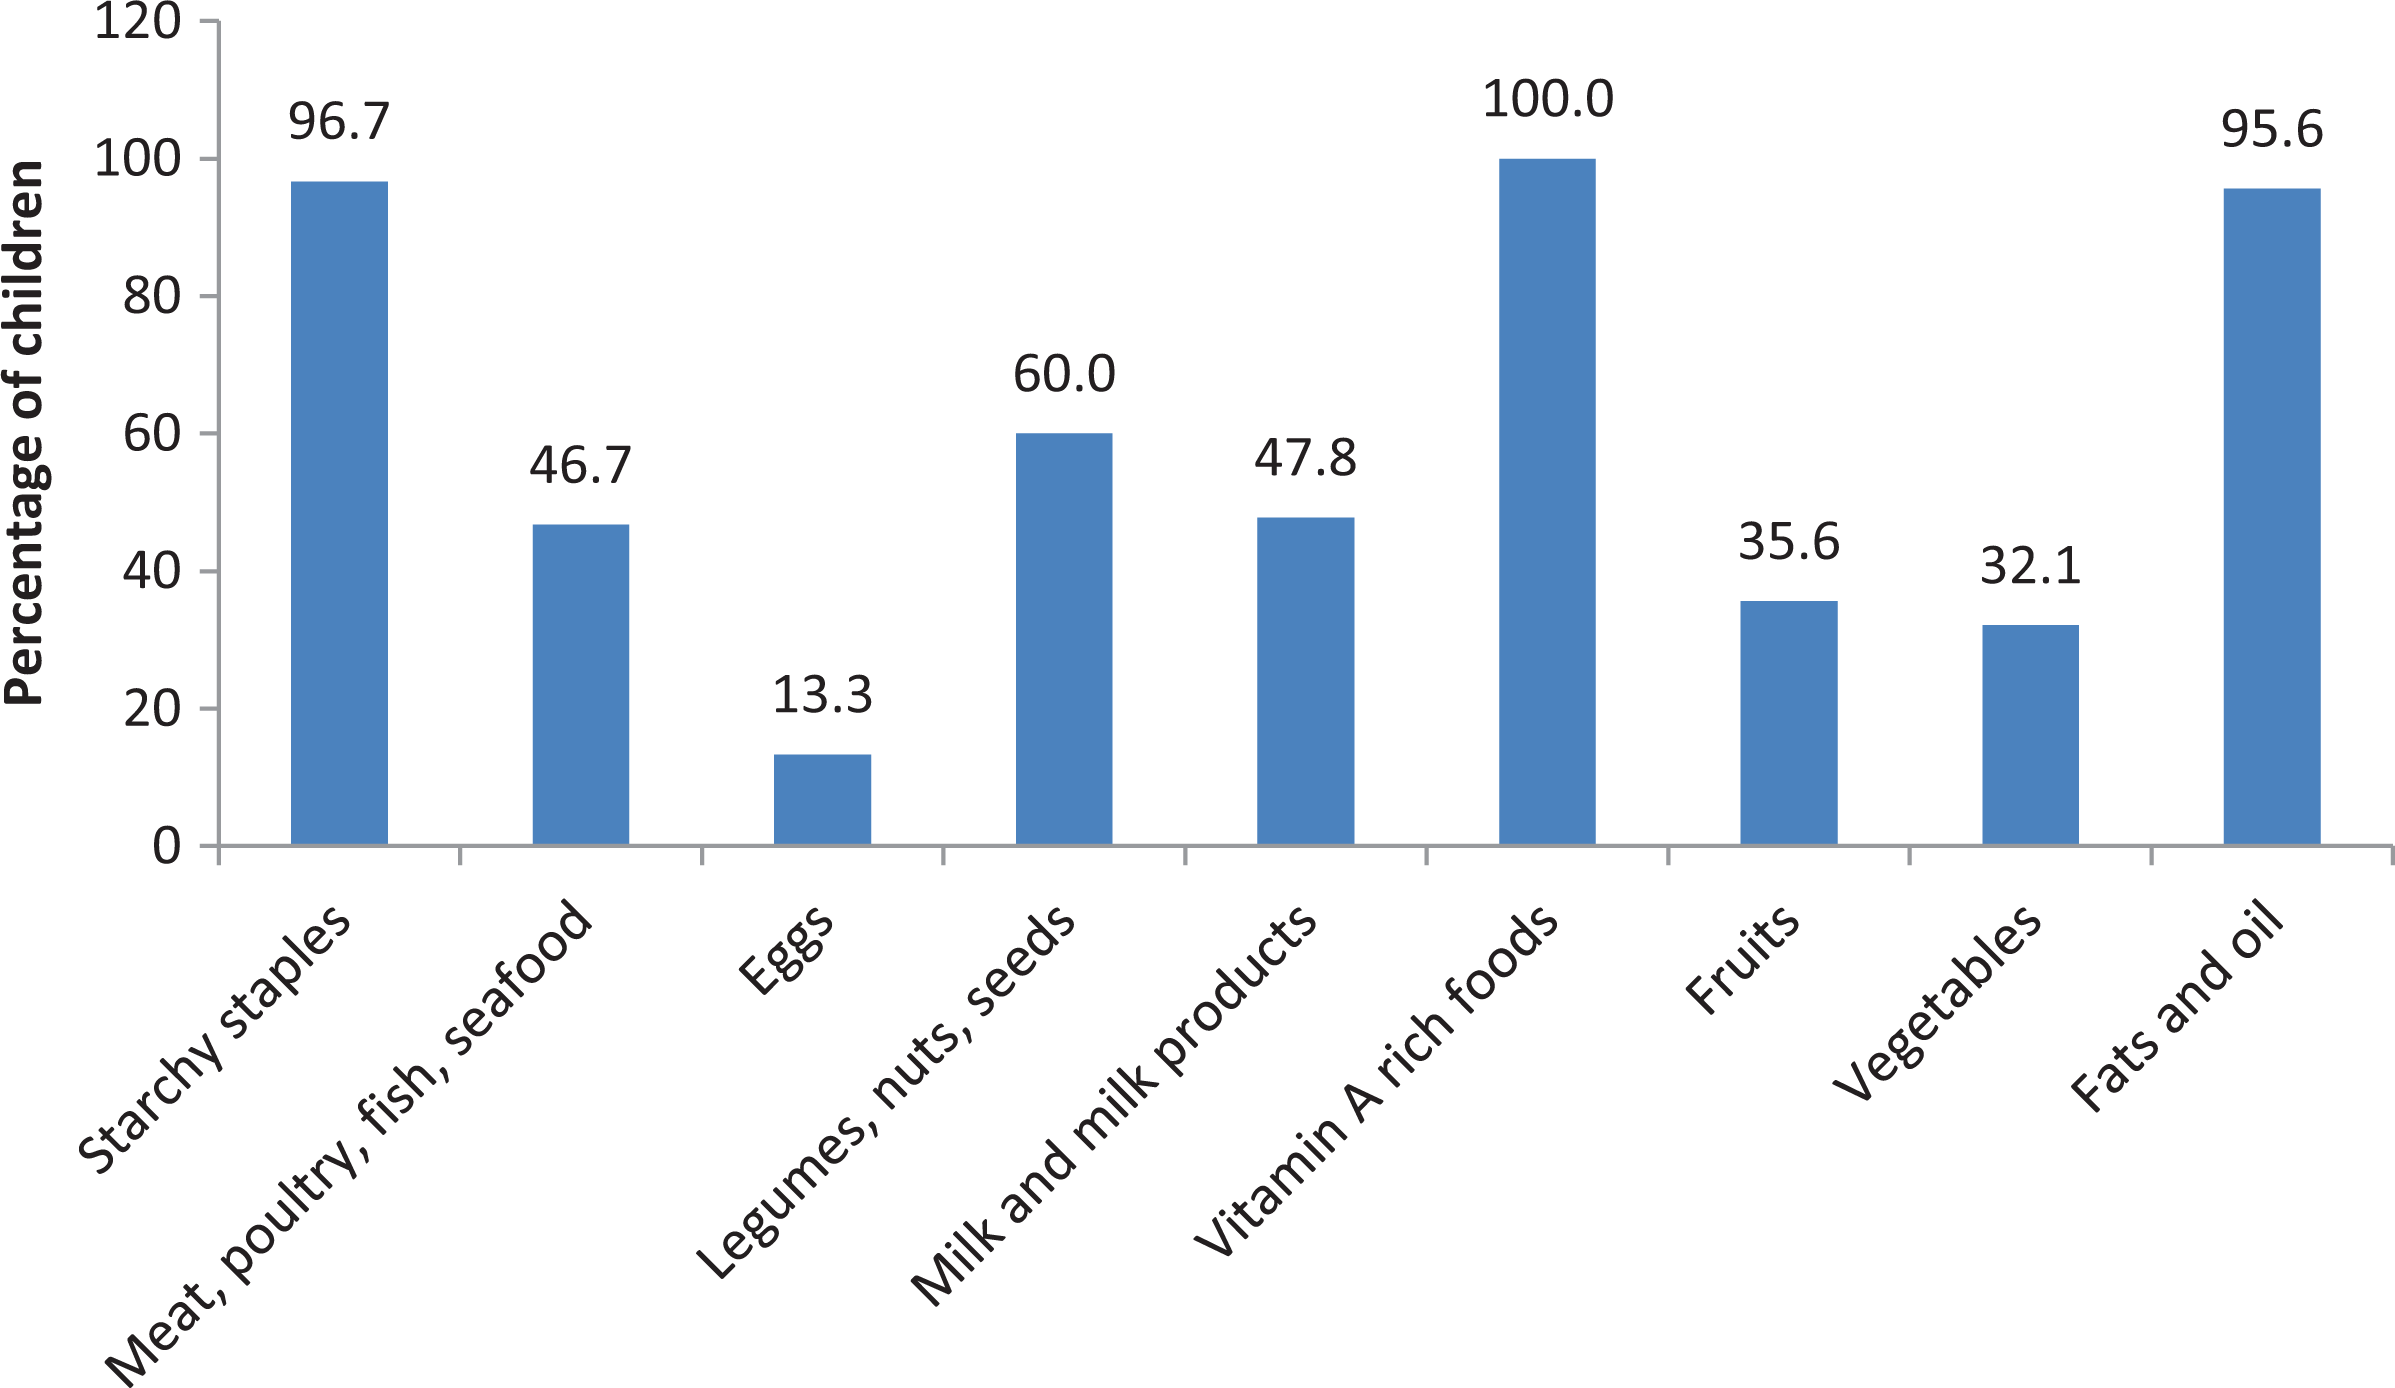
Percentage consumption of food groups among the schoolchildren.
Dietary Diversity
Dietary diversity of the children is shown in Table 1. Mean DDS was 4.94 (0.85) of 9 with majority (77.8%) having medium DDS. There were no significant (P > .05) differences between age groups and gender.
Dietary Diversity of the Schoolchildren.
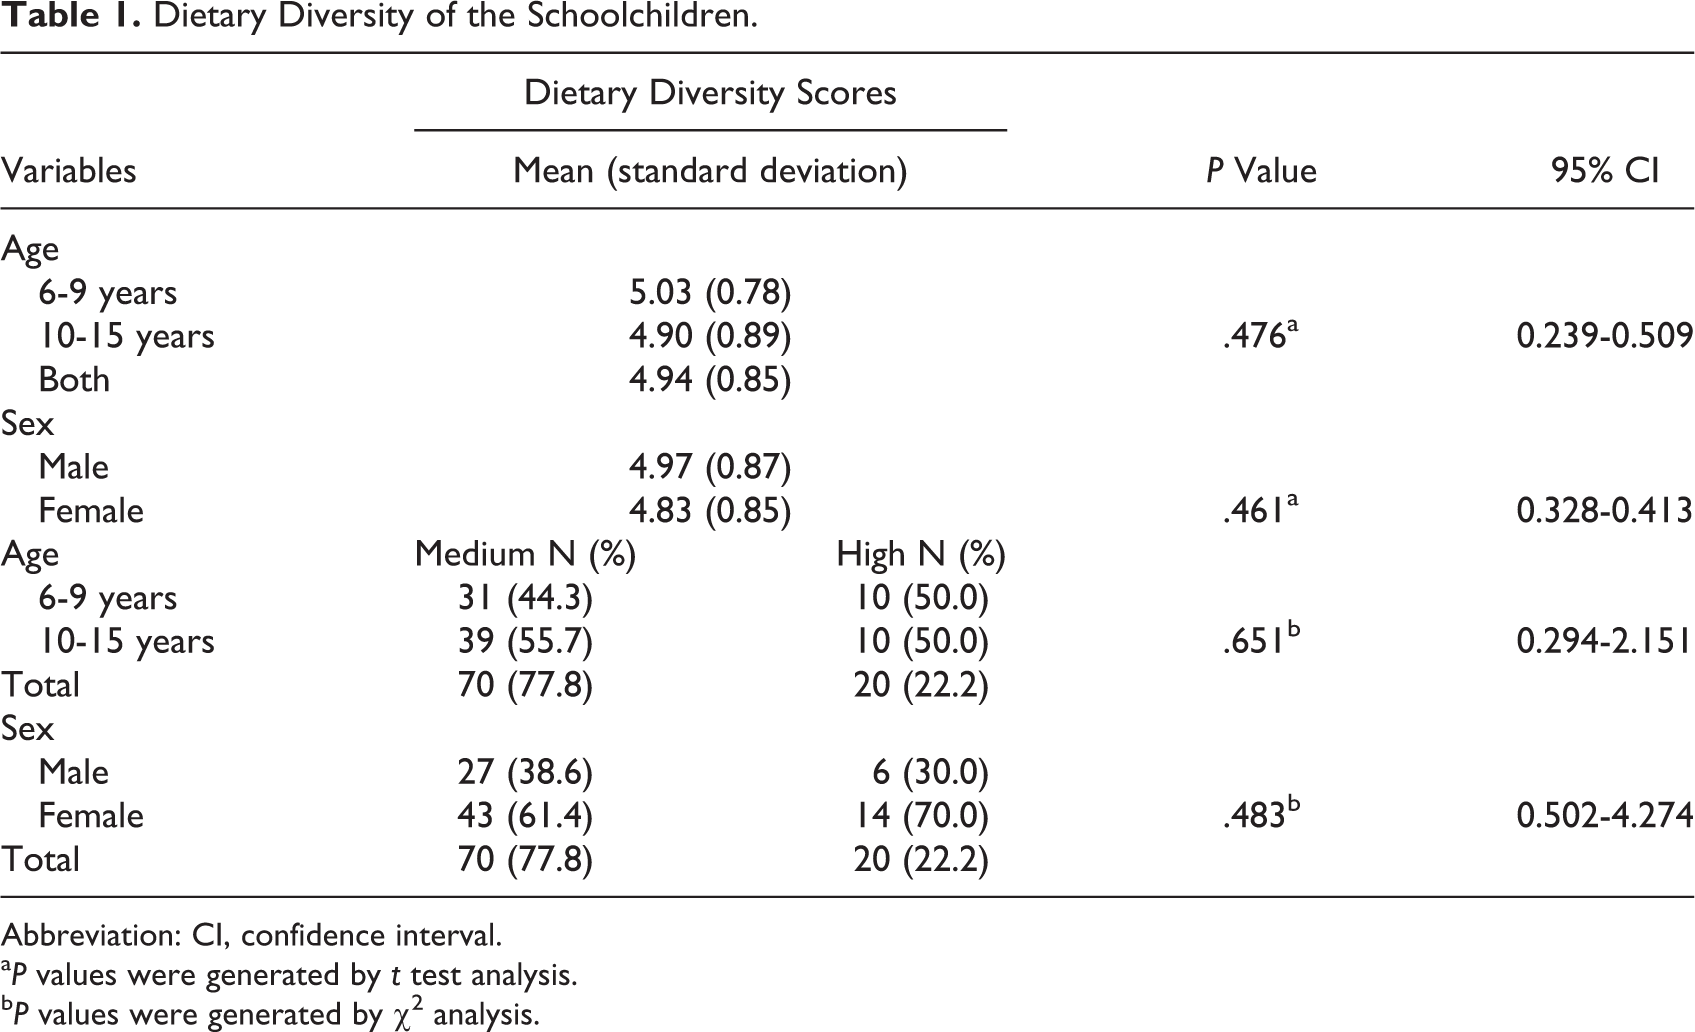
Abbreviation: CI, confidence interval.
aP values were generated by t test analysis.
bP values were generated by χ2 analysis.
Table 2 shows the risk factors of low dietary diversity among the children. Children from male headed households were more likely to have lower DDS (odds ratio [OR] = 3.231; 95% confidence interval [CI] = 1.037-10.070) than those from female headed households (P < .05). The odds of children whose mothers had less than secondary education having lower DDS was low (OR = 0.306; 95% CI = 0.109-0.853), but this relationship was not significant.
Risk Factors of Low Dietary Diversity Scores Among the Schoolchildren.
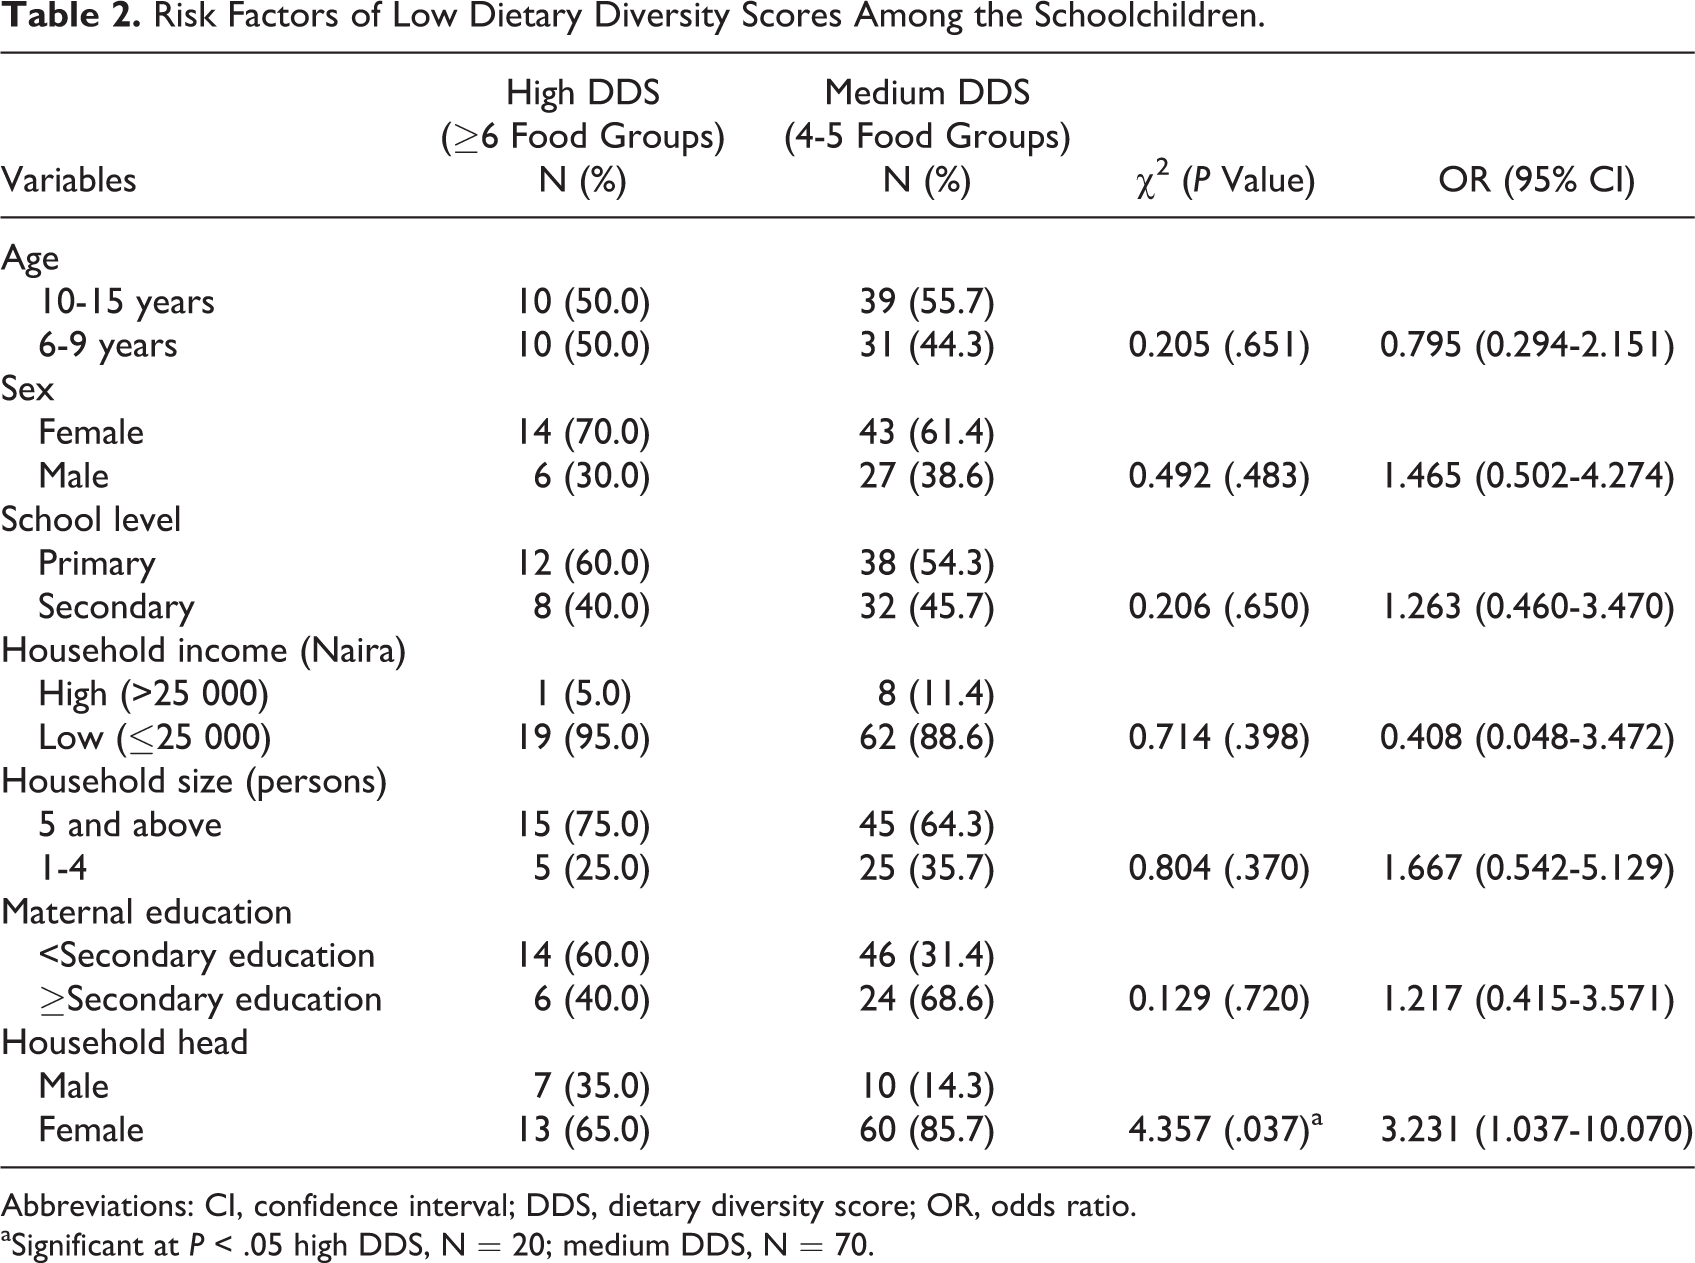
Abbreviations: CI, confidence interval; DDS, dietary diversity score; OR, odds ratio.
aSignificant at P < .05 high DDS, N = 20; medium DDS, N = 70.
Energy and Nutrient Intakes
Table 3 shows the mean daily energy and macronutrient intakes of the schoolchildren and their percentage contributions to RNI of the schoolchildren. For the 6- to 9-year-olds, mean intake of protein contributed 100% and above of male and female RNI. For those aged 10 to 12 and 13 to 15 years, neither the male nor the female intakes of energy, protein, and carbohydrate met the RNI. Mean carbohydrate intake was significantly (P < .05) higher among the girls than the boys.
Energy and Macronutrient Intakes and Percentage Contributions to RNI of Schoolchildren 6 to 15 Years.a
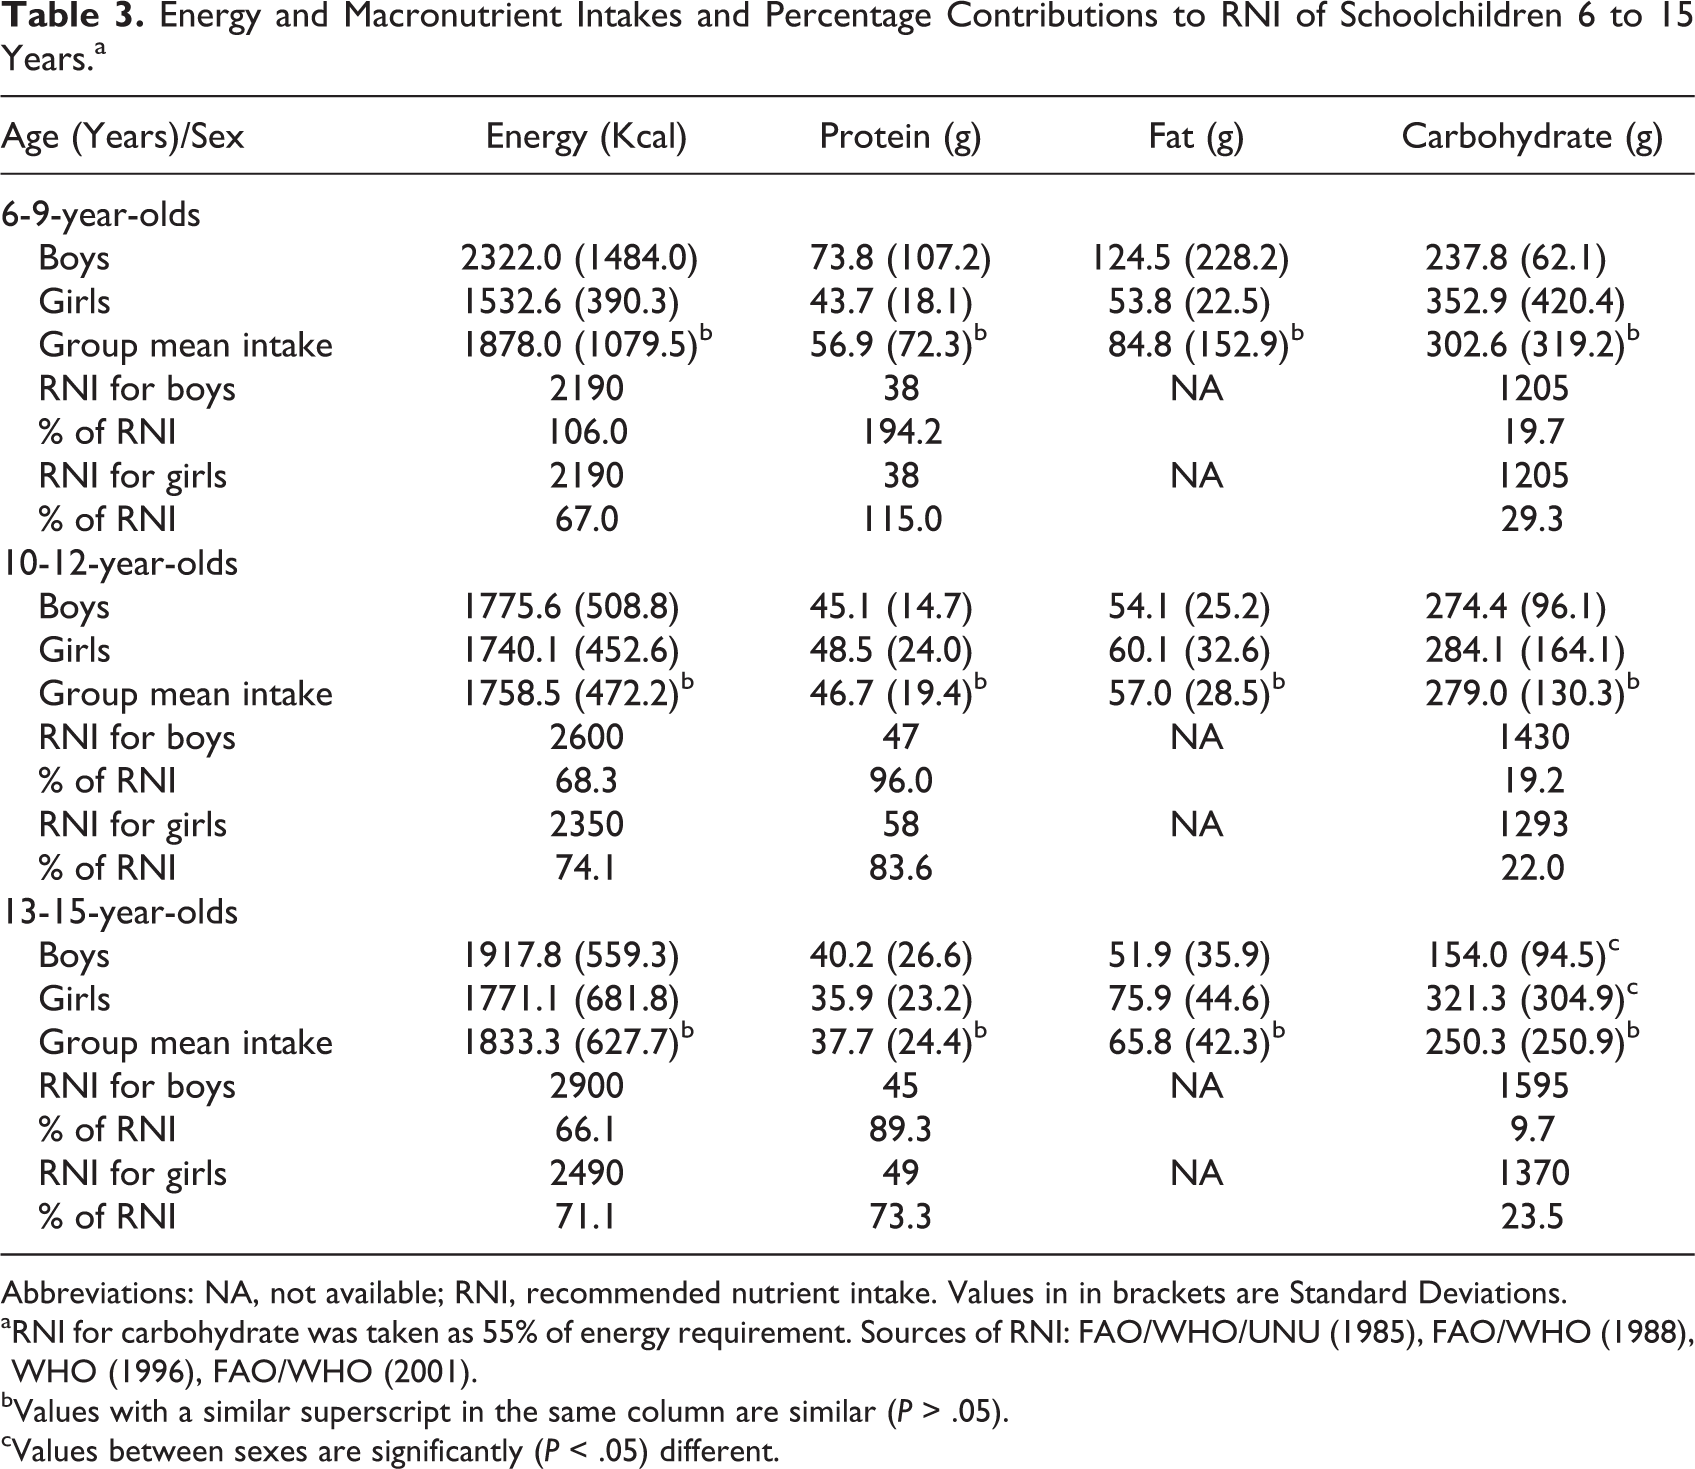
Abbreviations: NA, not available; RNI, recommended nutrient intake. Values in in brackets are Standard Deviations.
aRNI for carbohydrate was taken as 55% of energy requirement. Sources of RNI: FAO/WHO/UNU (1985), FAO/WHO (1988), WHO (1996), FAO/WHO (2001).
bValues with a similar superscript in the same column are similar (P > .05).
cValues between sexes are significantly (P < .05) different.
The mean micronutrient intakes of the schoolchildren and percentage contributions to their daily RNI are presented in Table 4. Mean intakes of vitamins A, B1, B2, and C contributed up to 100% of the RNI for boys and girls of 6- to 9-year-olds. Mean intakes of vitamins B1 and C met the RNI of the 10- to 12-year-olds. Vitamins A, B1, and C intakes were adequate for both boys and girls of 13- to 15-year-olds; Vitamin B3 (niacin) intake was significantly higher (P < .05) among the 6- to 9-year-olds than among the other age groups.
Micronutrient Intakes and Percentage Contributions to RNI of Schoolchildren 6 to 15 Years.a
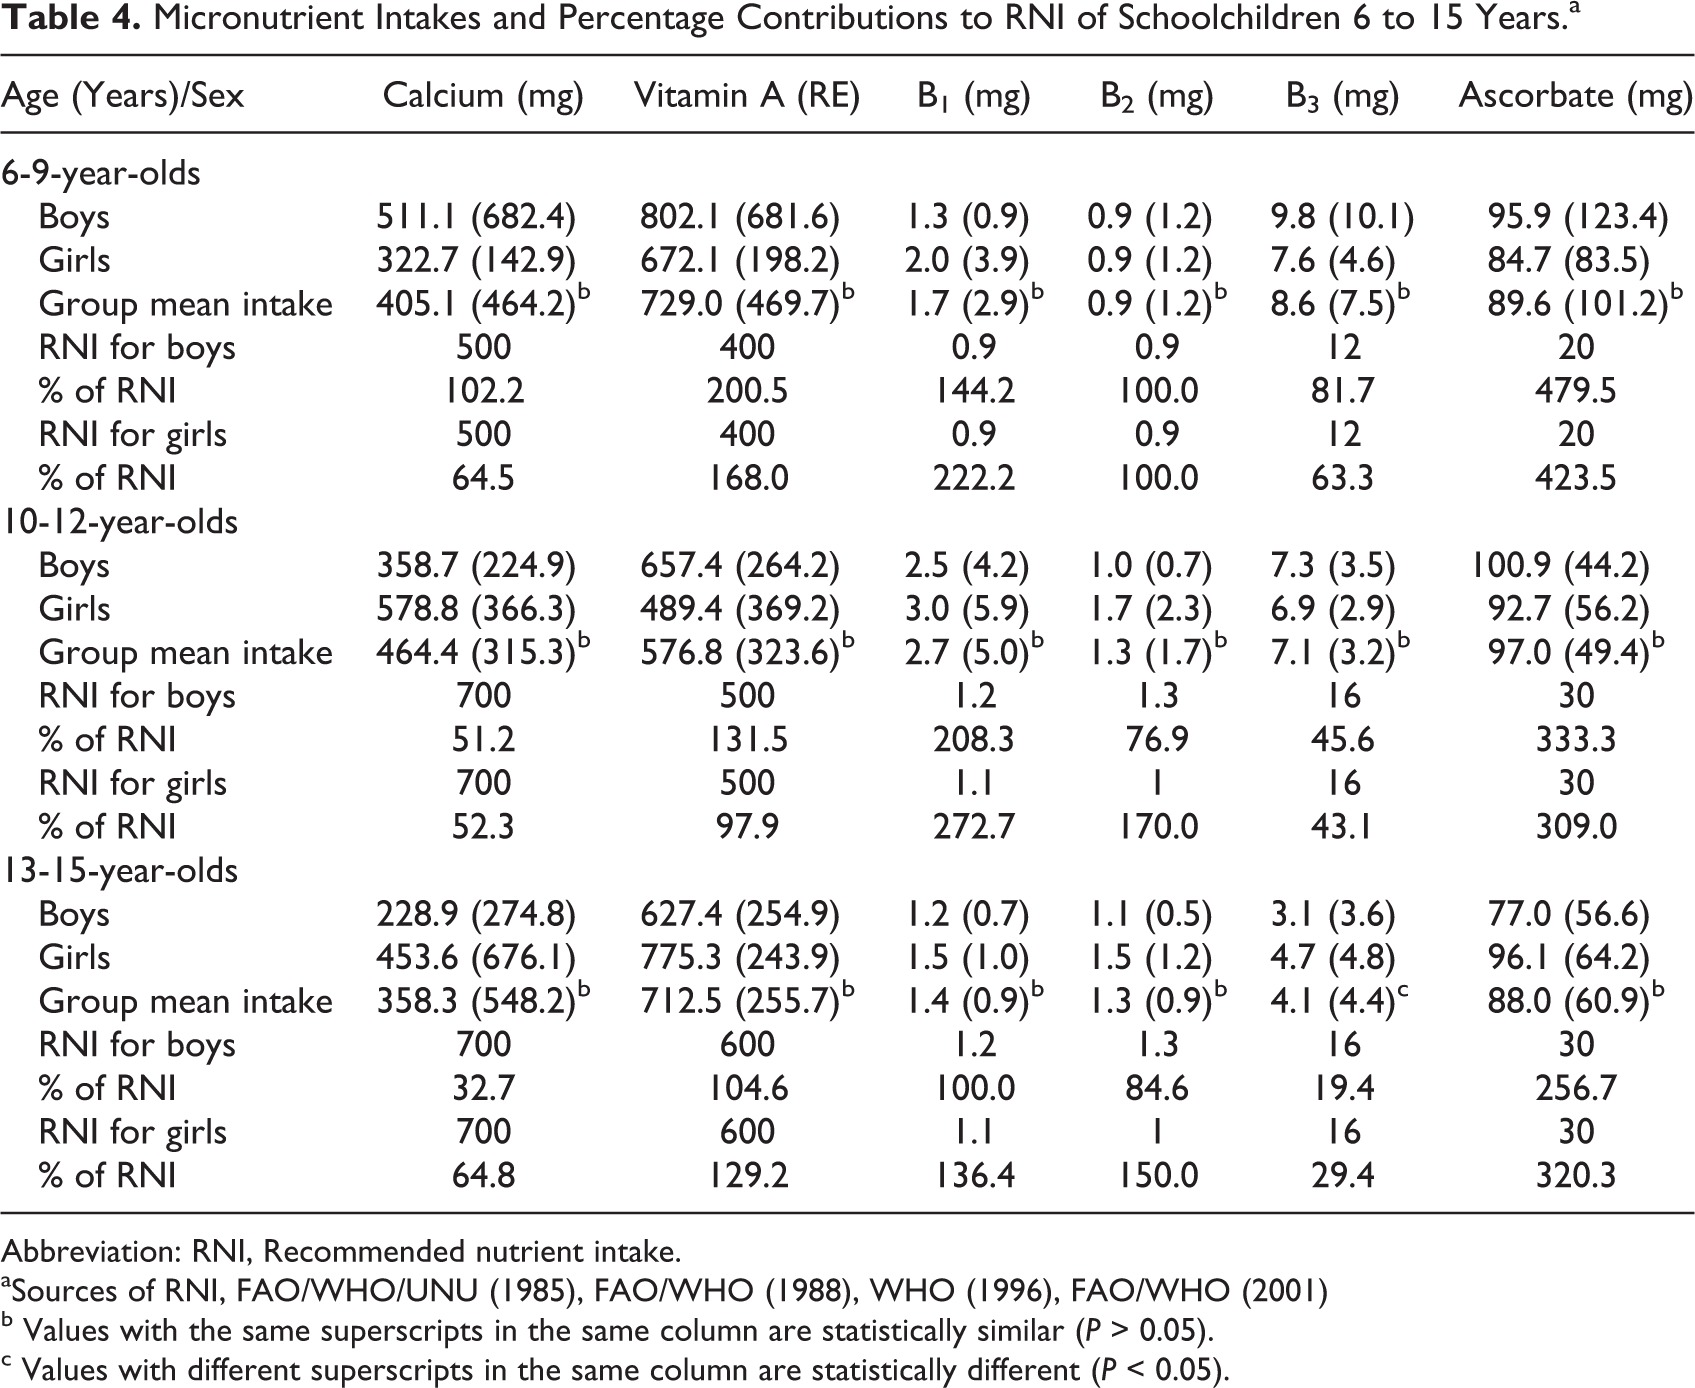
Abbreviation: RNI, Recommended nutrient intake.
aSources of RNI, FAO/WHO/UNU (1985), FAO/WHO (1988), WHO (1996), FAO/WHO (2001)
b Values with the same superscripts in the same column are statistically similar (P > 0.05).
c Values with different superscripts in the same column are statistically different (P < 0.05).
Figure 2 shows the prevalence of inadequate nutrient intakes among the schoolchildren according to age and sex. Inadequate intake of vitamin A was significantly (P < .05) higher among boys (21.4%) than girls (0.0%) of 6 to 9 years and significantly (P < .01) higher in girls of 10 to 15 years (35.5%) than girls of 6 to 9 years (0.0%). Inadequate intake of riboflavin was significantly (P < .05) higher among boys of 6 to 9 years (92.9%) than boys of 10 to 15 years (59.3%).
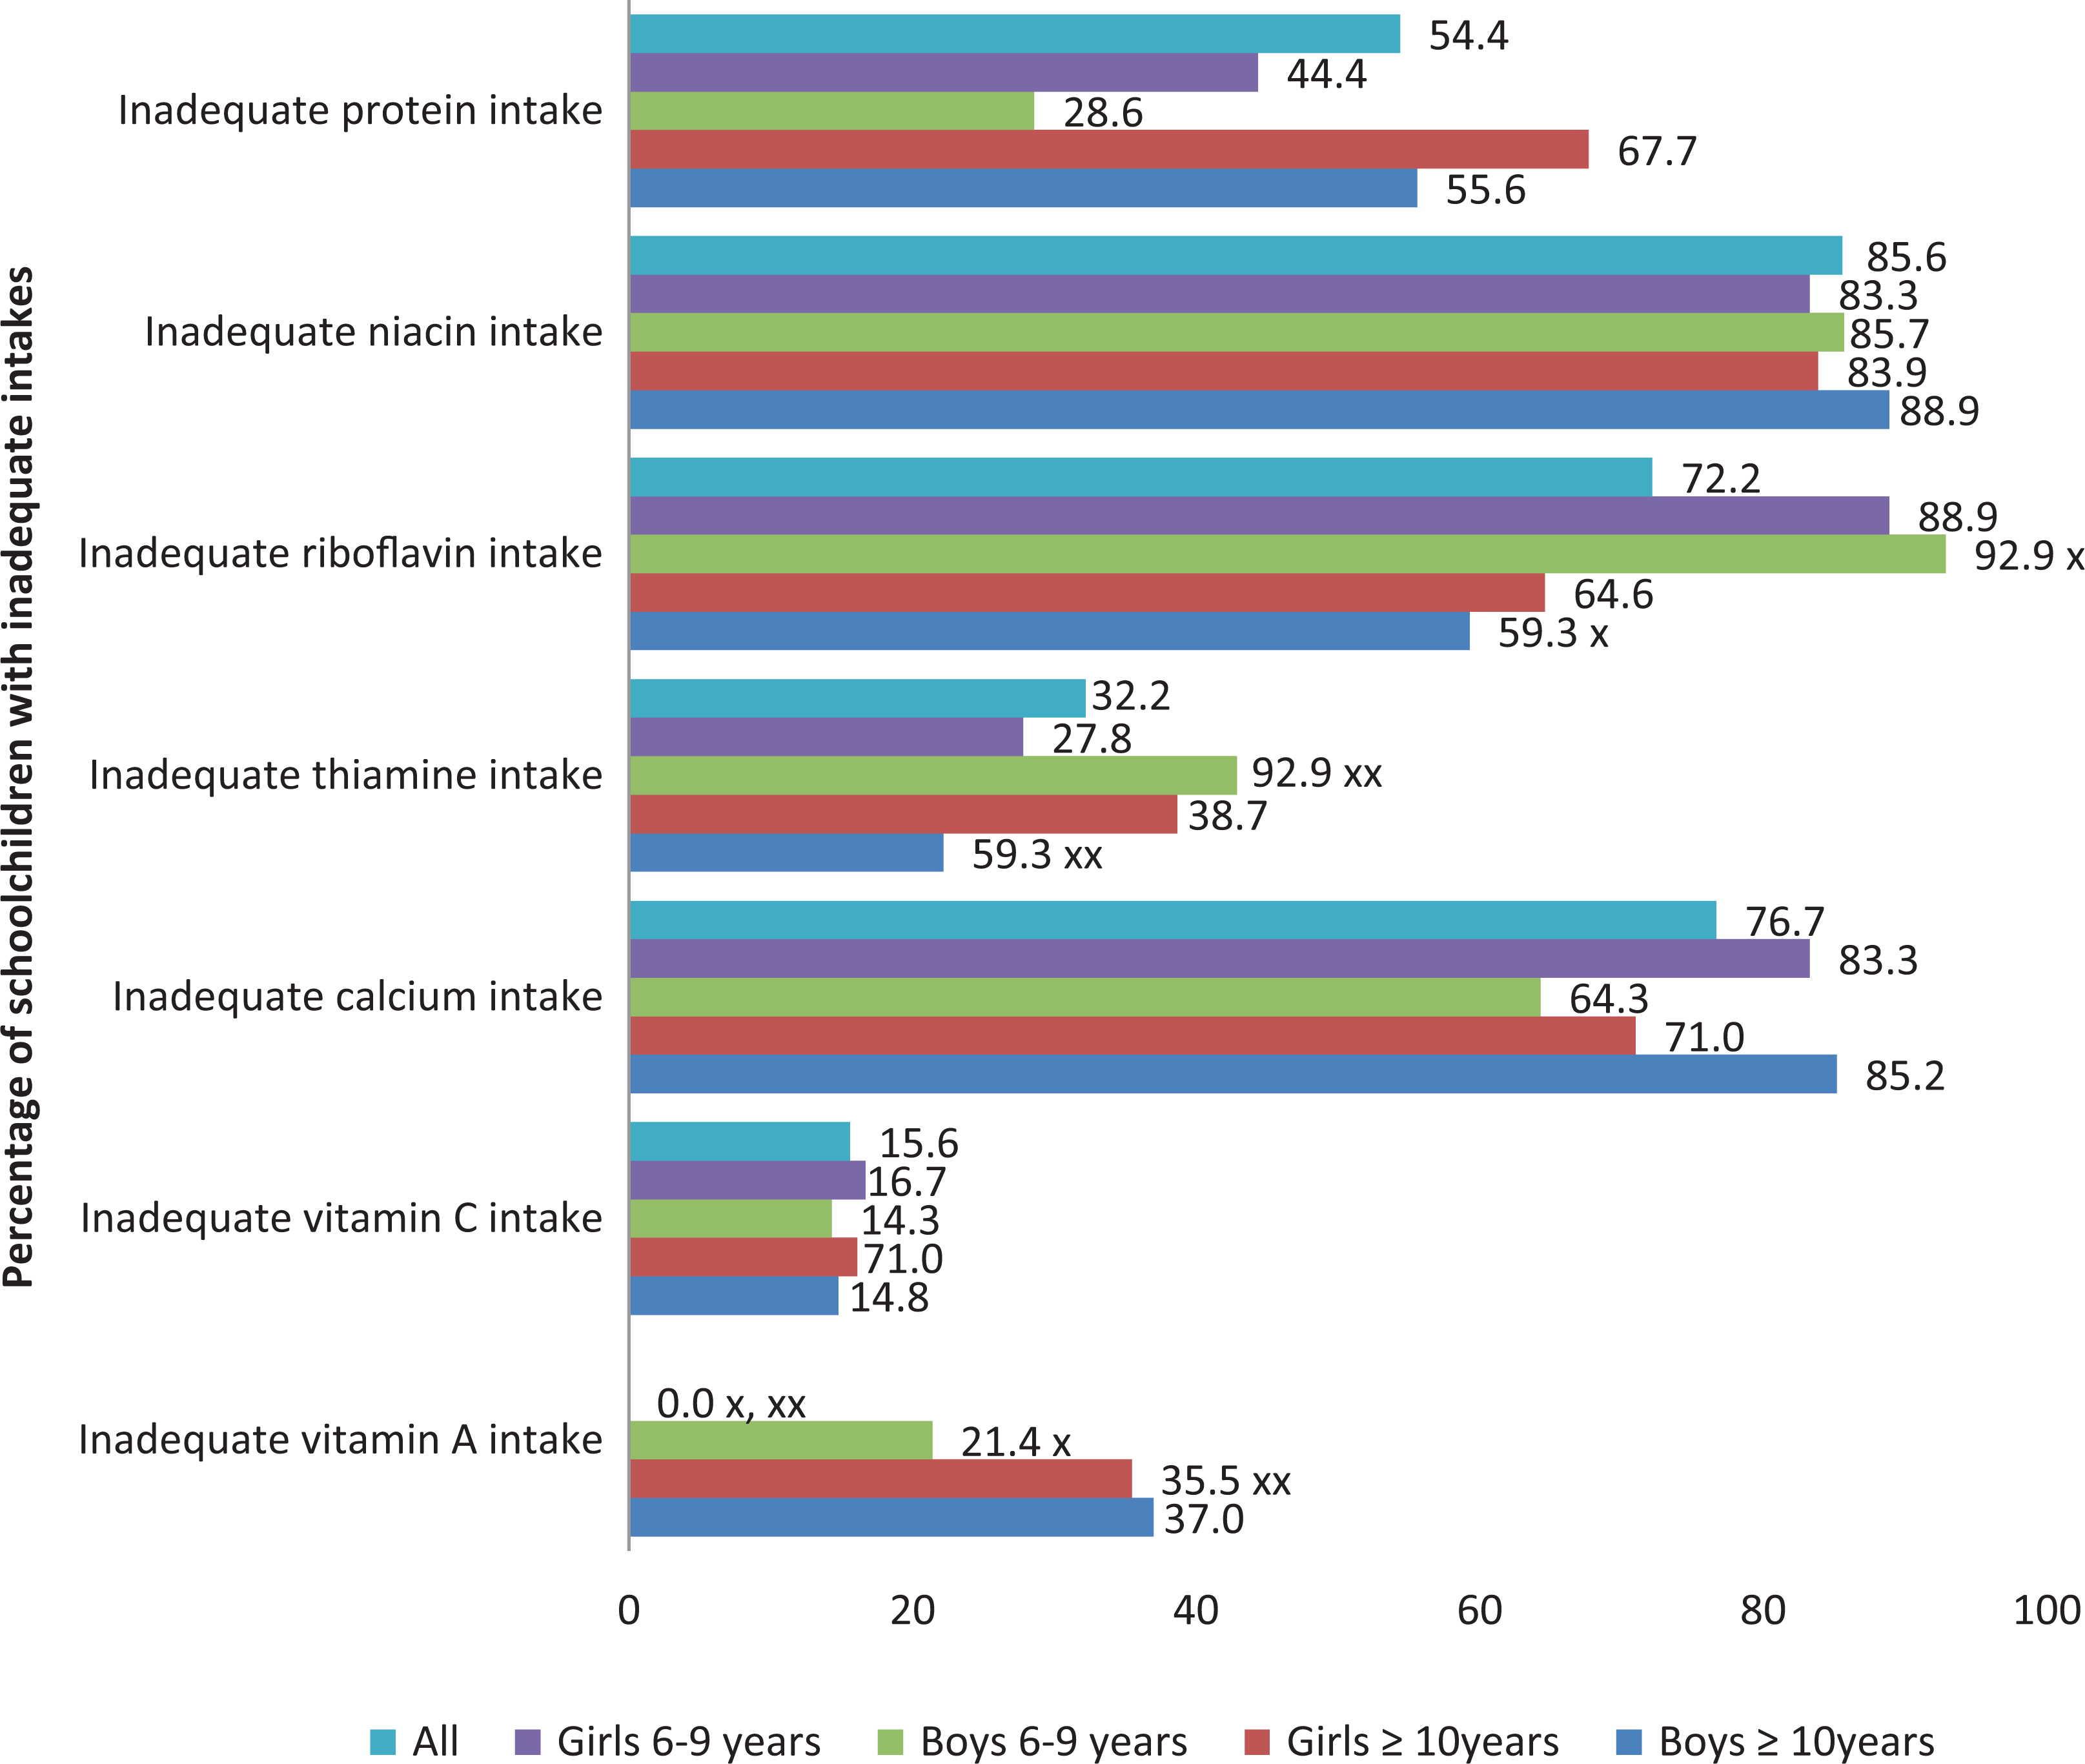
Prevalence of inadequate nutrient intakes according to age and sex. x = significant (P < .05); xx = significant (P < .01).
Association of Dietary Diversity With Energy and Nutrient Intakes
Table 5 presents the association of energy and nutrient intakes with DDS of the schoolchildren. Children with medium DDS had significantly (P < .05) higher prevalence of inadequate iron (OR = 0.744, 95% CI = 0.653-0.847), and thiamine (OR = 5.651, 95% CI = 1.214-26.310), intakes than those with high DDS. Although prevalence of inadequate intakes of protein, carbohydrate, energy, calcium, and niacin nutrients was higher in children with medium DDS, the relationship did not reach statistical significance.
Association of Energy and Nutrient Intakes With Dietary Diversity Scores.
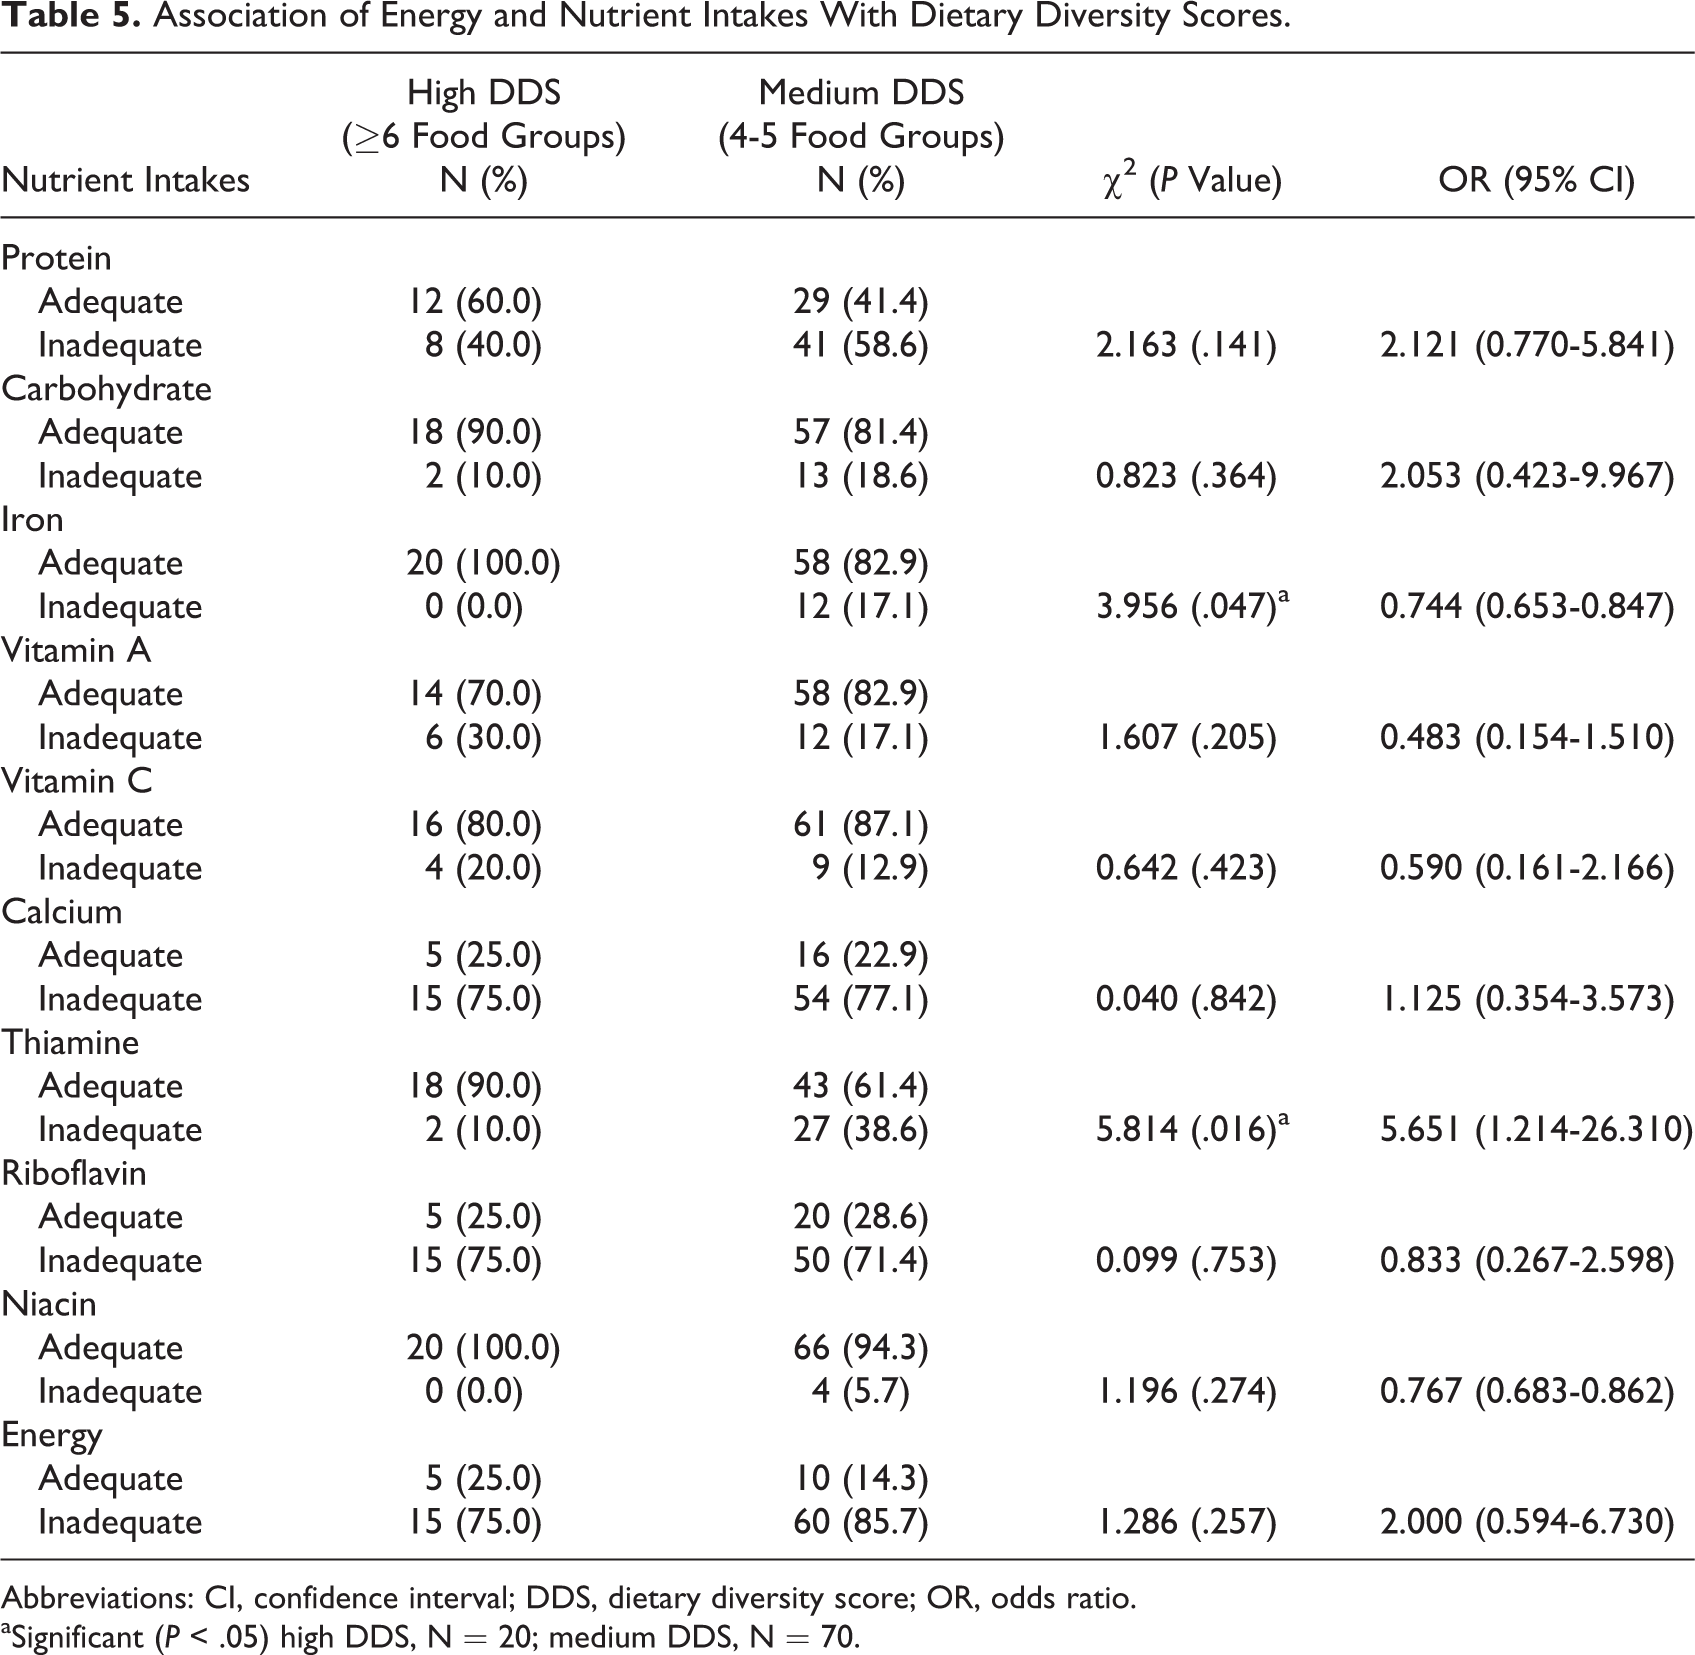
Abbreviations: CI, confidence interval; DDS, dietary diversity score; OR, odds ratio.
aSignificant (P < .05) high DDS, N = 20; medium DDS, N = 70.
Discussion
Consumption of Food Groups
The schoolchildren consumed a total of 50 food items which is lower than 63 food items reported by another study 20 on schoolchildren in Nairobi, Kenya. That majority (96.7%) consumed starchy staples (cereals and starchy roots, tubers and fruits) was not a surprise. Most of these staples especially cassava-based foods are major carbohydrate staples consumed by indigenous people of South-eastern Nigeria. Chandrasekara and Kumar 21 affirmed that starchy root and tuber crops are second only in importance to cereals as global sources of carbohydrates. Cassava is cultivated by most rural households and this makes cassava and its products available, accessible, and affordable. It is usually fermented and eaten as fufu with soup but is also consumed as abacha (dry/wet cassava chips).
Low consumption of meat, fish, and seafood group was attributed to cost. Income, culture, and, availability are 3 important factors that affect food consumption. 22 Of all foods in this group, crayfish occurred most frequently. The quantity of crayfish consumed at each meal may be very small but essential in promoting the bioavailability of micronutrients necessary for energy metabolism and good nutritional status. Snails were never consumed by majority of the children. In a study on nutrient composition of traditional foods and their contributions to the energy and nutrient intakes of children and women in rural households in Igbo cultural area, Okeke et al 23 reported that snails are prohibited in some parts of Igbo land (South-eastern Nigeria) for cultural reasons. The rejection of snails is a cause for concern because snails are naturally abundant especially during rainy season and can enhance protein intake since it is available, free, and accessible with no adverse health effect associated with its consumption. Nutrition education to dispel fear and clear misconceptions associated with snail consumption is important.
The low consumption of milk, egg, fruits, and vegetables is worrisome. Egg yolk is a rich source of preformed vitamin A. Infrequent consumption of animal foods such as milk and eggs implies overdependence on plant sources of calcium and vitamin A and with its reduced bioavailability, low plasma status may occur. Low consumption of milk has implications for poor bone health and osteoporosis. Hong and Piaseu 24 in a study on fruit and vegetable consumption among primary school children in Nakhon Pathom, Thailand, affirmed that the proportion of children with sufficient fruit and/or vegetable intake was low. Some fruits were not consumed despite their being in season. It was observed that fruits and vegetables were not consumed with meals except in cases where vegetables were integral components of the cooked food(s). In a study on intrafamilial distribution of food and nutrients in a rural Nigeria population, Okeke and Nnayelugo 25 affirmed that fruits were not eaten in conjunction with meals but consumed between meals as snacks. Fruits and vegetables are rich sources of micronutrients, antioxidants, and phytochemicals; regular adequate intake is therefore emphasized.
Dietary Diversity
Dietary diversity score reported in this study agreed with DDS reported by Mwaniki and Makokha 20 that less than half (45.2%) of primary school children in Nairobi, Kenya consumed foods from more than 4 food groups. The dietary intake of schoolchildren and adolescents in developing countries has been shown to be limited in diversity, comprising mainly plant-based food sources. 26 Seasonality of some foods and fruits may be responsible for the low DDS observed in this study. In a study 27 that examined the role of seasonality on diet and household food security, seasonality was found to be associated with dietary diversity (P = .026). In most rural households in South-eastern Nigeria, DDS may be low when planting season is over and harvest awaited. This implies that intakes from few food groups may not be adequate. Intake of a diverse variety of foods has been recommended for achieving adequate nutrient intake. Kennedy et al 28 and Steyn et al 11 affirmed that shift from a monotonous diet to a diversified one increases micronutrient and energy intakes.
High household income has been shown to exercise strong positive influence on dietary diversity. 29,30 This was not the case in this study (Table 2). This study showed that children from households with higher income had lower DDS. This however was not significant (P > .05). This finding may be attributed to ignorance because this study also showed that low maternal education was associated with medium DDS though the relationship was not significant. Children of mothers with less than secondary education were more likely to have lower DDS (P > .05). This finding corroborated with the findings of Aboussaleh et al 31 that maternal level of instruction was positively associated with higher fruits and vegetables and milk intakes of schoolchildren in Morocco. It implies that effective nutrition education of schoolchildren, mothers, and other household members would enhance DDS and improve nutrient intakes and the overall nutritional status of schoolchildren. A study by Kuchenbecker et al 32 on impact of nutrition education on dietary diversity of children affirmed that nutrition education improves dietary diversity of children. High DDS has also been shown to be significantly associated with lower risk of stunting among children 10,33,34 and should therefore be encouraged.
This study showed that female headed households provided the children with more diversified foods than male-headed households. This is in line with prior expectations but contrasted with the report of Workicho et al 29 on household dietary diversity and animal source food consumption in Ethiopia. A woman could make better food choices even with her meagre income. This is inherent in women as better child care givers than men. However, Musemwa et al 35 in a study on household access to enough food in Eastern Cape town, South Africa observed that women are engaged in many household activities and most of them in the rural areas are not employed and so the low economic powers of women could be a hindrance to high DDS. In this study, it was not a constraint although quantity of food consumed at meal times may be affected. Income generating activities to improve women’s income are therefore advocated to ensure higher DDS for their children and consequently better nutritional status.
Energy and Nutrient Intakes
Low protein intake observed among the adolescents in this study is in line with the report of Fiorentino et al 36 on the study on nutrient intake among Senegalese urban school children and adolescents. Protein foods mostly consumed by the children were plant foods with relatively low values, poor digestibility, and low biological value. Protein is necessary for adequate body utilization of micronutrients and inadequate intake may adversely affect micronutrient status. Reduced protein intake or intake of protein of low biological value has been associated with decreased production of hemoglobin and other iron—containing proteins such as myoglobin, catalase, peroxidase, and cytochromes. Synthesis of niacin, blood transferrin, retinol, and zinc-binding proteins are also affected by low protein intake. 37 Nestlé’s Fortieth Anniversary Report 38 affirmed that individuals with micronutrient deficiencies often simultaneously have a deficit in energy and protein intakes.
The low calcium intake observed in this study was not a surprise since milk was poorly consumed. Calcium is required for bone and teeth health, and the low intake implies a predisposition to rickets and osteoporosis as a consequence of low bone density. Adequate intakes of thiamine and vitamin C imply good glucose metabolism and iron absorption. Low riboflavin and niacin intakes were attributed to low intake of animal foods. Animal foods are rich sources of micronutrients and when their consumption is low, micronutrient intakes may also be low. Low intakes of riboflavin and niacin may be associated with general body weakness due to poor glucose metabolism. Absence of significant (P > .05) relationship in the mean intakes of most nutrients between age groups and gender implied that inadequate nutrient intakes is a problem of schoolchildren irrespective of age and gender.
Relationship Between Nutrient Intakes and DDS
It was observed that children with high DDS had lower prevalence of inadequate energy and nutrient intakes. A significant (P < .05) relationship was found with iron and thiamine only. This affirms the link between dietary diversity and adequacy of energy and nutrient intakes as shown by Kennedy et al 28 and Steyn et al. 11 Kennedy et al 28 showed that DDS was a useful indicator of adequate micronutrient intake. This implies that to ensure better nutrient and energy intakes, diet counseling, and nutrition education should emphasize dietary diversification which will invariably improve nutrient intakes and nutritional status.
Limitation and Implications
The study was limited to a subsample of 90 used for weighed food intake on which dietary diversity was based. Besides this, the cross-sectional survey design of the study could not be used to judge any cause-effect relationship between nutrient intakes and dietary diversity. Notwithstanding, this study was able to show the relationship of dietary diversity with nutrient intakes of schoolchildren and to the best of my knowledge; it is the first study of this kind in the study area. There is need therefore, to conduct a nationwide study among schoolchildren in Nigeria as this will provide a nationwide data that will enhance planning, implementation, and evaluation of school-based nutrition programs (school lunch, nutrition education, and nutrient supplementation) in Nigeria.
Conclusion
Most children had medium DDS. Maternal education and female household head were positively associated (P < .05) with DDS. Only vitamin C and thiamine intakes were adequate for all age groups and sex. The 6- to 9-year-old children had better energy and nutrient intakes than the adolescent groups. Children with high DDS had lower prevalence of inadequate energy and nutrient intakes.
Recommendation
Nutrition education on dietary diversity for improved nutrient intakes is advocated.
Footnotes
Acknowledgments
The author acknowledges with respect the inputs of late Professor Elizabeth Okeke. She is also grateful to the schoolchildren and their households for their consent and active participation in the study.
Declaration of Conflicting Interests
The author(s) declared no potential conflicts of interest with respect to the research, authorship, and/or publication of this article.
Funding
The author(s) received no financial support for the research, authorship, and/or publication of this article.