
Abstract
Numerous governments in developing countries institute school lunch programs or school feeding programs as a strategy to address high malnutrition and low education rates among children. In 2005, the Ghanaian government launched the Ghana School Feeding Programme (GSFP). The GSFP policy does not document (1) the actual meal and associated nutrient profile received by the student, (2) the cost of the meal ingredients to the caterer who prepares the food, nor (3) the recipe derivations that may supply an enhanced nutritional profile. We address these 3 information gaps by employing a detailed case study of 4 caterers supplying a traditional tomato stew recipe in northern Ghana within GSFP-supported school lunch programs. Specifically, we explore the following propositions: (1) GSFP caterers can deliver a school lunch for under 100 pesewas (1 GH¢ or $0.21 USD) per student; (2) the meal meets the recommended daily allowance for protein; (3) soy can serve as a cost-effective ingredient to fortify the meal in terms of protein level and protein quality; and (4) significant differences exist in the macro- and micronutrient profile due to caterer discretion. We answer the above 4 propositions, and by doing so show the importance of accurately measuring the nutritional content, costs, and quantities of the actual school lunch under study. Second, among our results, we show the economy of locally produced soy flour as an ingredient that can lower costs and raise nutrition when substituting for other locally produced proteins such as ground beef and mackerel.
Introduction
The nutrition goals for infants and growing children continue to include adequate intakes of calories, quality protein, and micronutrients. In the case of sub-Saharan Africa, diets in households mainly consist of starchy staples (eg, rice, maize, cassava, plantain), which are inexpensive, but normally devoid of high-quality protein and micronutrients. The purpose of the presented work is to argue that the exchange of a small amount of high-calorie, nutrient-poor staple such as rice with a nutrient-rich legume such as soybean could result in better nutrition to children. School lunches provide the context for improving protein quality as recent evidence associates the low levels of essential amino acids in the diet of children with stunting. 1
Numerous governments in developing countries institute school lunch programs or school feeding programs as a way of addressing high malnutrition rates and low education rates among children. In 2005, the Ghanaian government launched the Ghana School Feeding Programme (GSFP). 2 Today the program includes participating schools from all 216 districts in Ghana and reaches 1 642 271 students, which is 38% of the country’s student population. 2 The government requires participating schools to serve a cooked lunch 195 days a year. The mandated lunch must consist of approximately 150 g of cereal with 40 g of legumes and 10 g of vegetable oil per child per day. The expectation is that the lunch will provide more than 30% of the recommended daily energy allowance for a young student, amounting to 760 kcal. 2 However, the GSFP policy does not document (1) the actual meal and associated nutrition profile received by the student, (2) the cost of the meal ingredients to the caterer who prepares the food, nor (3) the recipe derivations that may supply an enhanced nutrient profile. We address these 3 information gaps by employing a detailed case study of 4 caterers supplying a traditional tomato stew recipe in northern Ghana within GSFP-supported school lunch programs. Specifically, we explore the following propositions: (1) GSFP caterers can deliver a school lunch for under 100 pesewas (1 GH¢ or $0.21 USD) per student; (2) the meal meets the recommended daily allowance (RDA) for protein; (3) soy can serve as a cost-effective ingredient to fortify the meal in terms of protein level and protein quality; and (4) significant differences exist in the macro- and micronutrient profile due to caterer discretion, and these differences affect the marginal cost of adding a unit of protein at the caterer level.
Literature Review
There exists significant literature studying school feeding programs in developing countries. 2 -7 However, to our knowledge, only one study 8 actually measures the nutrient profile of the plated school meal consumed by a student in an actual school or lunchroom setting. A 2007 report published by the World Food Programme’s Homegrown School Feeding Project concluded that the Ghanaian government’s monitoring and evaluation system of the GSFP is “very weak” and that “robust empirical evidence is limited.” 4 The actual meal delivered to a student may vary despite the fact that government recommendations may exist, or that recipes are posted and available. Food preparers receive payment per meal and not by the level of nutrition delivered to each child. Caterers have an incentive to lower costs per student, and as such, a caterer might choose to add water to the recipe (ie, dilution). The lack of enforcement of nutritional standard compounds the nutrition delivery challenge, as these efforts are expensive and limited.
“A review of nutritional guidelines and menu compositions for School Feeding Programs in 12 countries,” for example, “analyzed the nutrition guidelines and menu compositions of school meal provisions” using Ovid MEDLINE databases and program websites. 5 From these secondary sources, the authors calculated the nutritional composition of these menus using a nutrition linear programming tool. The Aliyar study did conclude, based on their calculations, that a gap exists between nutritional standards and menu composition. However, the study did not assess the gap between the menu composition and the actual nutrition of the meal served to the student.
Similarly, due to cost constraints and methodological challenges, research of school feeding nutrition does not evaluate the actual meal consumed, but utilizes secondary data, 24-hour recalls, or qualitative interviews to calculate the theoretical nutritional value of prescribed school menus. 2,3,5,9 For example, the Impact of Feeding Children in School: Evidence in Bangladesh study measured the impacts of school meals on student’s nutritional status, school enrollment, and test scores. 3 The study relied on a 24-hour meal recall rather than a measurement of the actual meals consumed in a school lunch.
The World Food Programme Office of Evaluation sought to determine whether their school feeding program met the government of Kenya’s broadly defined educational, gender, and nutritional objectives. 9 The study employed 24-hour recall, interviewed students, teachers, and caregivers about their schools, households, and school meals, and compared students who received a daily school lunch with those who irregularly received a school lunch. The study concluded that the school lunch met the Kenyan government’s objectives and that the school lunch accounted for “more than half of the recommended daily allowances for about 40% of the students.”
A 2016 detailed analysis of the nutrition of a school lunch program compared the total energy and nutrient intake provided by meals in the GSFP as well as a nongovernmental School Feeding Program. However, the 2016 study did not conduct a scientific evaluation of the foods served by either program, and instead relied on a 24-hour dietary recall, in addition to weighing the portion sizes that students consumed. 10
A similar study of the GSFP from Wageningen University’s Division of Human Nutrition assessed the impact of the GSFP in 4 schools in 4 districts in Ghana’s Central Region. 11 The data collection involved weighing portion sizes and “1-day weighed dietary records” for calculating the nutrition of the weighed portions. 11 The study found that the GSFP succeeded in increasing the dietary diversity among schoolchildren in selected schools by providing, on average, one additional food group than what the children consumed at home. However, as the study did not provide the exact nutritional content of the school meal, the authors were only able to argue indirectly that the lunches helped students meet their daily-recommended value for energy and protein, but not iron. 11
Finally, another study entitled “School feeding and educational access in rural Ghana: is poor targeting and delivery limiting impact?” explored “…the experiences of beneficiaries and implementers of the [GSFP] within three rural communities in Ghana, using interviews and observations.” 12 The study highlighted challenges faced by the caterers that prevented them from properly delivering the school feeding service, such as time management and irregular funding. However, the author did not link these factors to the quality of the nutrition delivered to students.
The methodology described in this manuscript most similarly follows 8 where the authors studied school lunch feeding in Enugu and Anambra States in Nigeria. The study collected samples from school meals for 5 days in a row from 3 schools participating in the feeding program. These samples were analyzed for nutrition content at the Department of Home Science, Nutrition and Dietetics at the University of Nigeria, Nsukka. 8 This study provides a detailed and firsthand account of the content of the meal served to students, including the ingredients, amount or volume of each ingredient, portion size, and nutritional value of the meal. The school meals provided a significant proportion of the RDA (see 13 ) for protein, vitamins A and C, and zinc but were deficient with respect to energy, calcium, and iron. Additionally, the study provides an economic analysis of the school meal to explain how it fits within the per child budget allocated to the caterers by the national government.
Method
The data collection involved a 6-step process with the caterers.
Step 1
Researchers from Catholic Relief Services/Ghana interviewed 12 caterers associated with the GSFP in Tamale, Ghana. All 12 caterers operate as independent contractors engaged by the Ghanaian government to provide hot and nutritious meals to each schoolchild in selected primary schools. The interviews revealed the most common dishes that they make for school lunches, the general process and procedures of working within the GSFP, recipe development, nutritional understanding and expectations, and the specifics related to ingredient procurement, decision-making, meal preparation, cooking, and serving. Caterers cook 5 meals in a week and employ the help of local cooks during food preparation.
Step 2
From the answers captured in step 1, the research team selected a recipe common to 6 of the caterers, and one frequently served. Tomato stew with rice served as our case study meal.
Step 3
Third, because of cost constraints, the research team selected 4 caterers from the original 12, who had experience preparing the tomato stew and were willing to cooperate with the team.
Step 4
The research team then visited with each of the 4 caterers twice by telephone in order to establish an onsite visit date and time to watch their school lunch preparation, the serving of the meal, and consumption by the children.
Step 5
Following the 2 preparatory phone visits, the team then spent the day watching and collecting data as caterers assembled, prepared, cooked, and served the tomato stew lunch.
Step 6
Finally, the team went back to 2 of the caterers on a separate occasion to watch again the tomato stew preparation. The purpose of the follow-up visit was to double check the water levels used to both prepare the rice and add to the stew. Measuring water usage levels is critical because when used in excess water negatively affects nutrition levels per serving and positively effects caterer margins.
All interviews, ingredient cost surveys, and visits took place between January 26 and March 12, 2018. Caterers provided their costs per ingredient. Researchers verified caterer ingredient costs or supplied missing costs by surveying prices in the local market. Onsite interviews and observations in the schools took place from 5:30
The researchers weighed and recorded the volume of each ingredient that went into the meal including the water, the volume of fuel used to cook the meal, the number of servings in the meal, and the volume of an average serving. The team used these data to calculate the nutrition per serving, using the USDA Food Composition Database compared with the Institute of Medicine nutrition requirements for children. We estimated costs per ingredient using 2 sources of data: (1) interviews with individual caterers on the day they prepared the meal and (2) through a local market survey, which were collected at the time of meal preparation.
Finally, we simulated the addition of 3 soy products, soy flour, texturized soy protein (TSP), and tofu, to the recipes. The 3 soy products significantly differ with respect to nutrient content per kilogram (Table 1). Soy flour and tofu costs originate from a local vendor. One caterer uses tofu in her preparation, which provided additional cost validation. The TSP is currently not available in northern Ghana. However, a local food manufacturer may soon offer the product because of its potential to support school lunch nutrition. This vendor estimated the price of TSP at between 15 and 20 GH¢/kg. For this study, we used the midpoint of 17.50 GH¢.
Nutrition and Cost Comparisons of Protein Ingredients.
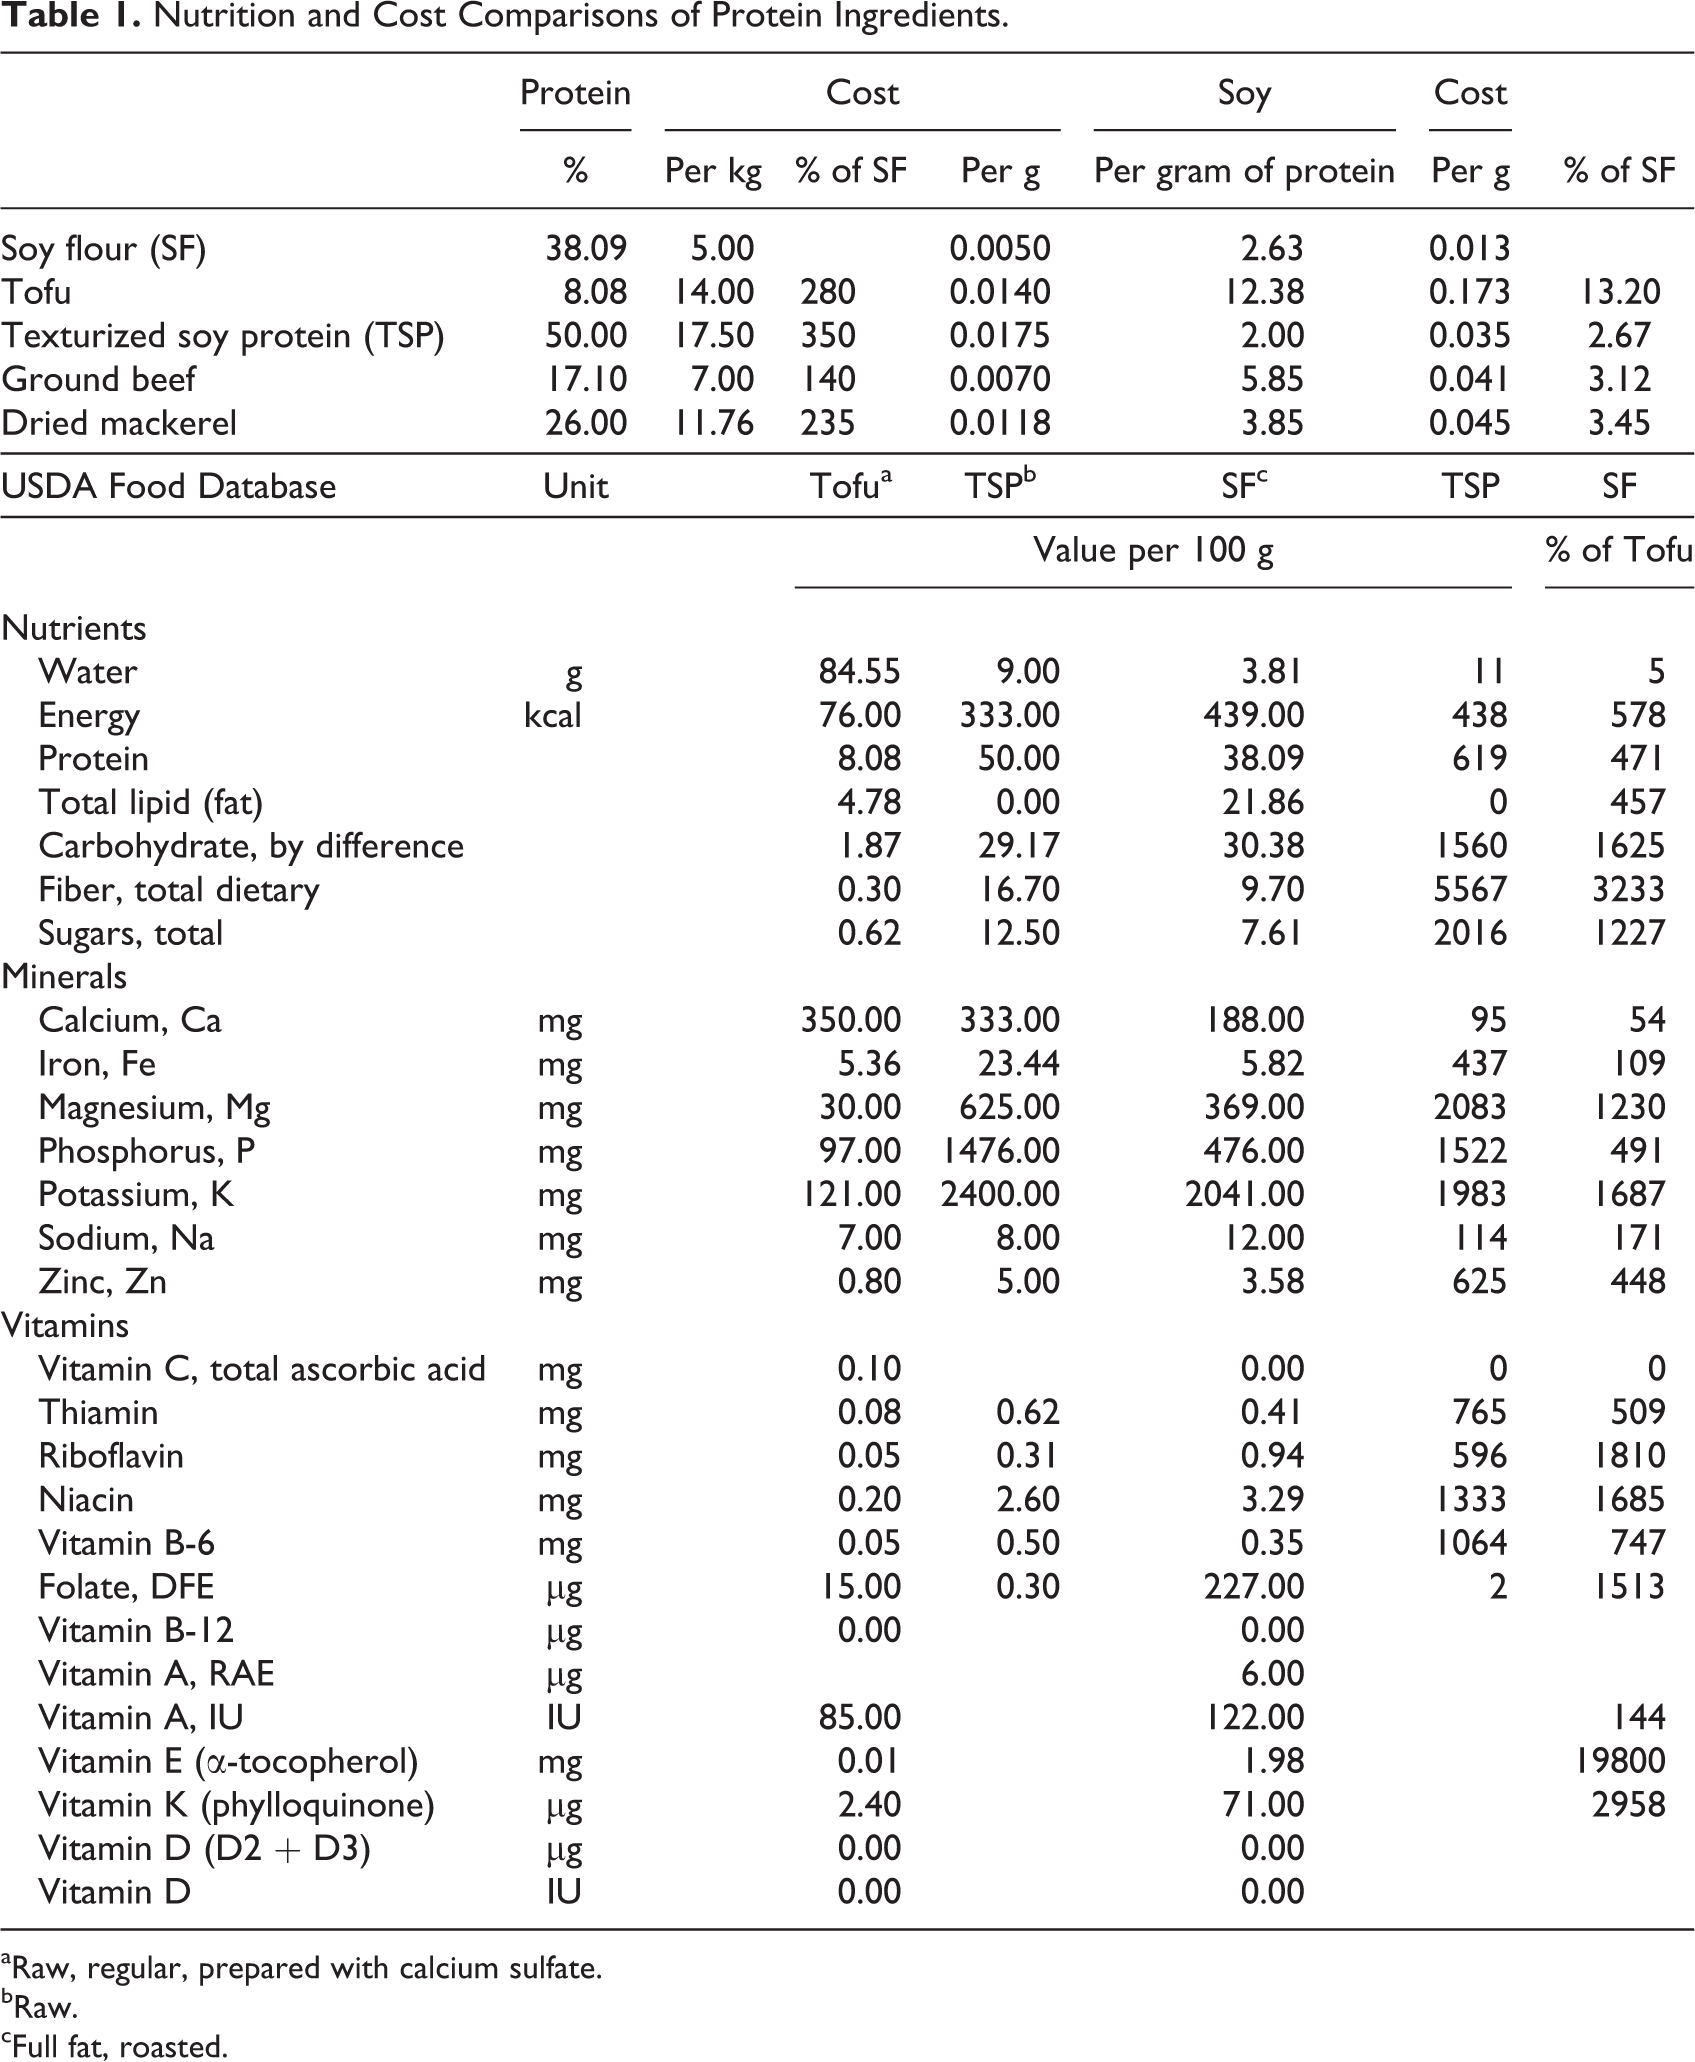
aRaw, regular, prepared with calcium sulfate.
bRaw.
cFull fat, roasted.
Data Description
The caterers receive their instruction for administering the program through their District Assembly. Only 1 caterer (caterer #2) reported that the District Assembly provided her with a guide and schedule of meals to prepare on each day. The other 3 caterers reported relying on their own experience and resources for cooking guidance. Two of these caterers reported that they were not aware of any sort of guidance provided by the GSFP, and the third reported that the GSFP only trained her on neatness and proper attire in the kitchen. Three caterers reported that the District Assembly recently raised the per child budget for school lunch to 1 GH¢ from 80 pesewas (0.80 GH¢ or $.18 USD). One reported still only receiving 80 pesewas. Three futher indicated that they intend to keep the additional revenue (20 pesewas) as profit.
The one caterer, who receives a menu schedule from her District Assembly, reports tomato stew on the menu. All 4 caterers report that they cook tomato stew at least once a week; 2 cook it twice a week. All 4 caterers report that fish is the protein source they use in the stew—2 specified canned fish, another specified dried fish. One of the caterers currently uses tofu when they prepare tomato stew. Two caterers report that they do cook with soy ingredients, using soy flour when they make tubani for school lunch.
The students served by the caterers are in primary school with ages ranging from 2 to 15 years. The interviews revealed that some children who are located in close proximity to the school or with a sibling attending the school, but who are not yet enrolled in school, also receive a meal. On average, the 4 selected caterers serve 191 students per meal, ranging between 156 and 248 students.
Results
Recipe Nutrient and Cost Overview
The students receive a tomato stew lunch with an average serving size of 254 g, with a range of 232 to 273 g (Table 2). The meal provided varies from caterer to caterer with respect to the ingredients, ingredient amounts, and ingredient costs. For the tomato stew recipe, caterers in total employ 17 ingredients, 8 of which are common across all 4 preparations, and 9 of which are not. Oil, canned/dried mackerel, tin tomatoes, Maggi cubes, rice, pepper, onions, and salt comprise the common set of ingredients (Table 3). These core 8 common ingredients comprise on average 90% of the cost and 93% of the weight of the meal.
Tomato Stew (Including Rice) School Lunch Summary Statistics.
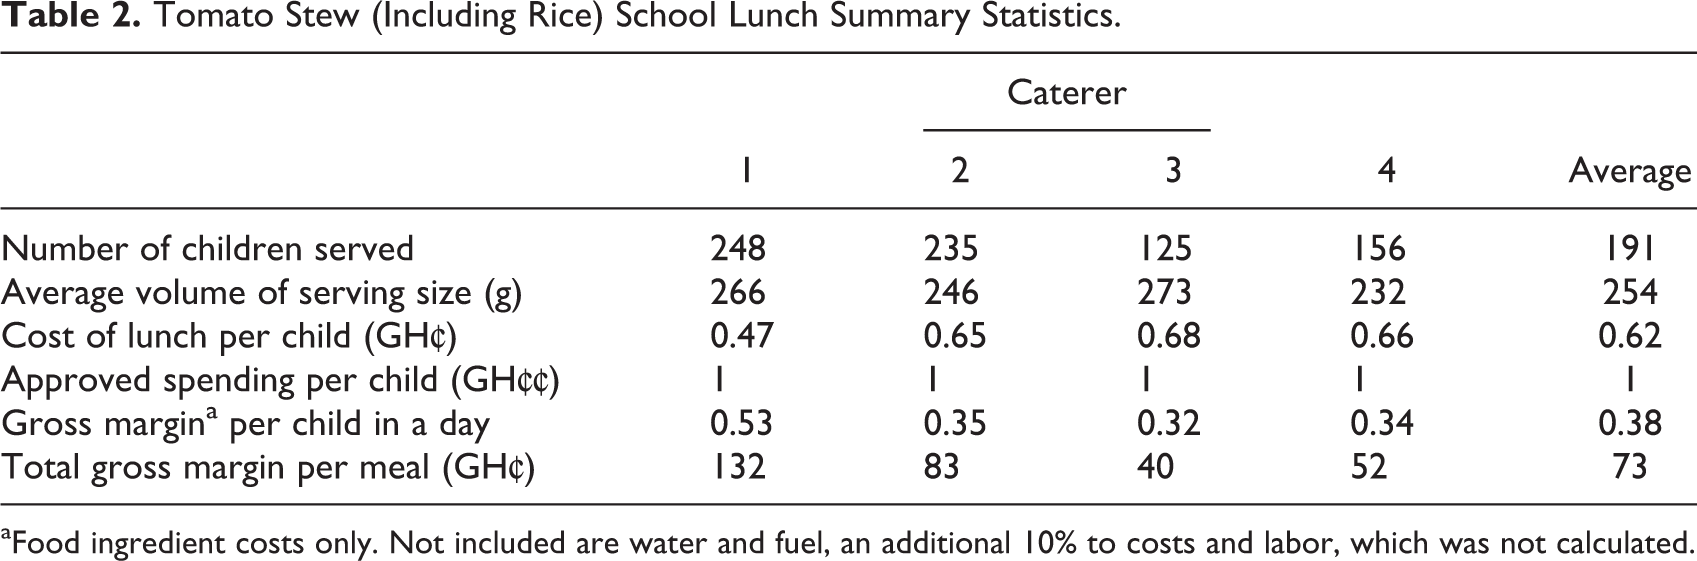
aFood ingredient costs only. Not included are water and fuel, an additional 10% to costs and labor, which was not calculated.
Tomato Stew Recipe and Ingredient Costs for 4 Caterers in Northern Ghana.
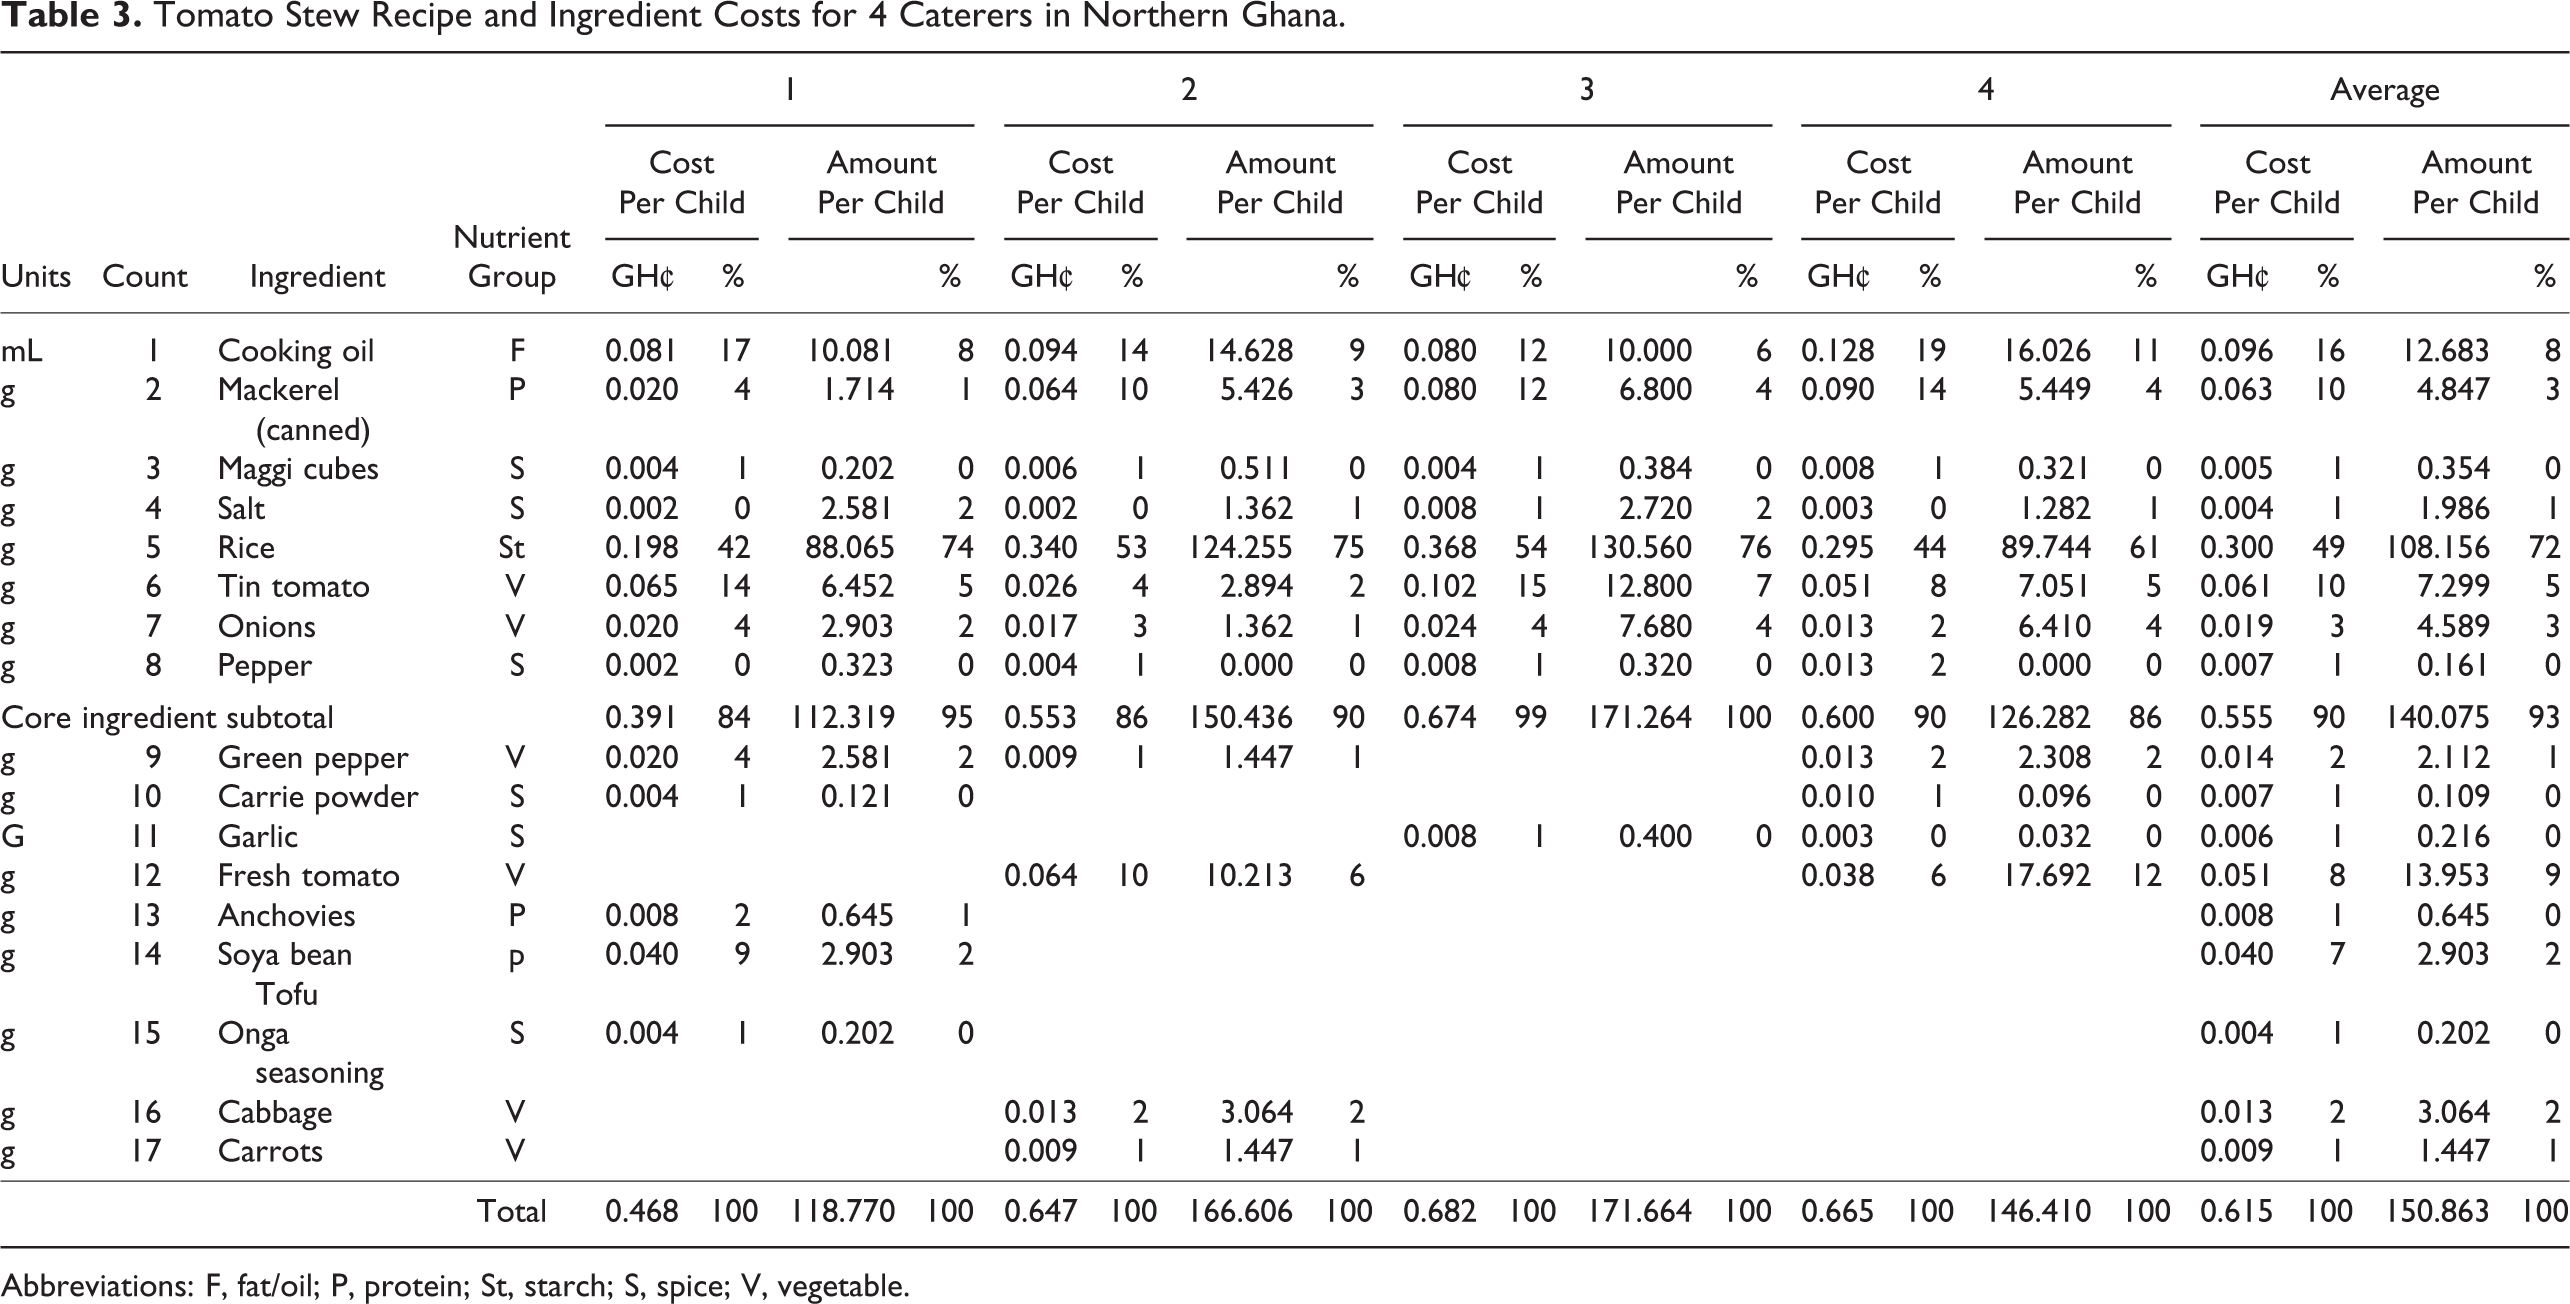
Abbreviations: F, fat/oil; P, protein; St, starch; S, spice; V, vegetable.
Of these core stew components, mackerel, the protein source, averages 3% of the volume and 10% of the cost. Mackerel usage ranges from 1.7 to 6.8 g per serving across the 4 caterers. Rice inclusion ranges from 88 to 131 g per serving per student. Starch (rice) comprises on average 49% of the cost and 72% of the weight of the tomato stew, with a range among the 4 caterers of 42% to 54% of the cost (Figure 1). Vegetables are the second most costly group averaging 20% of the cost, while protein only averages 12% of the cost of the food ingredients.
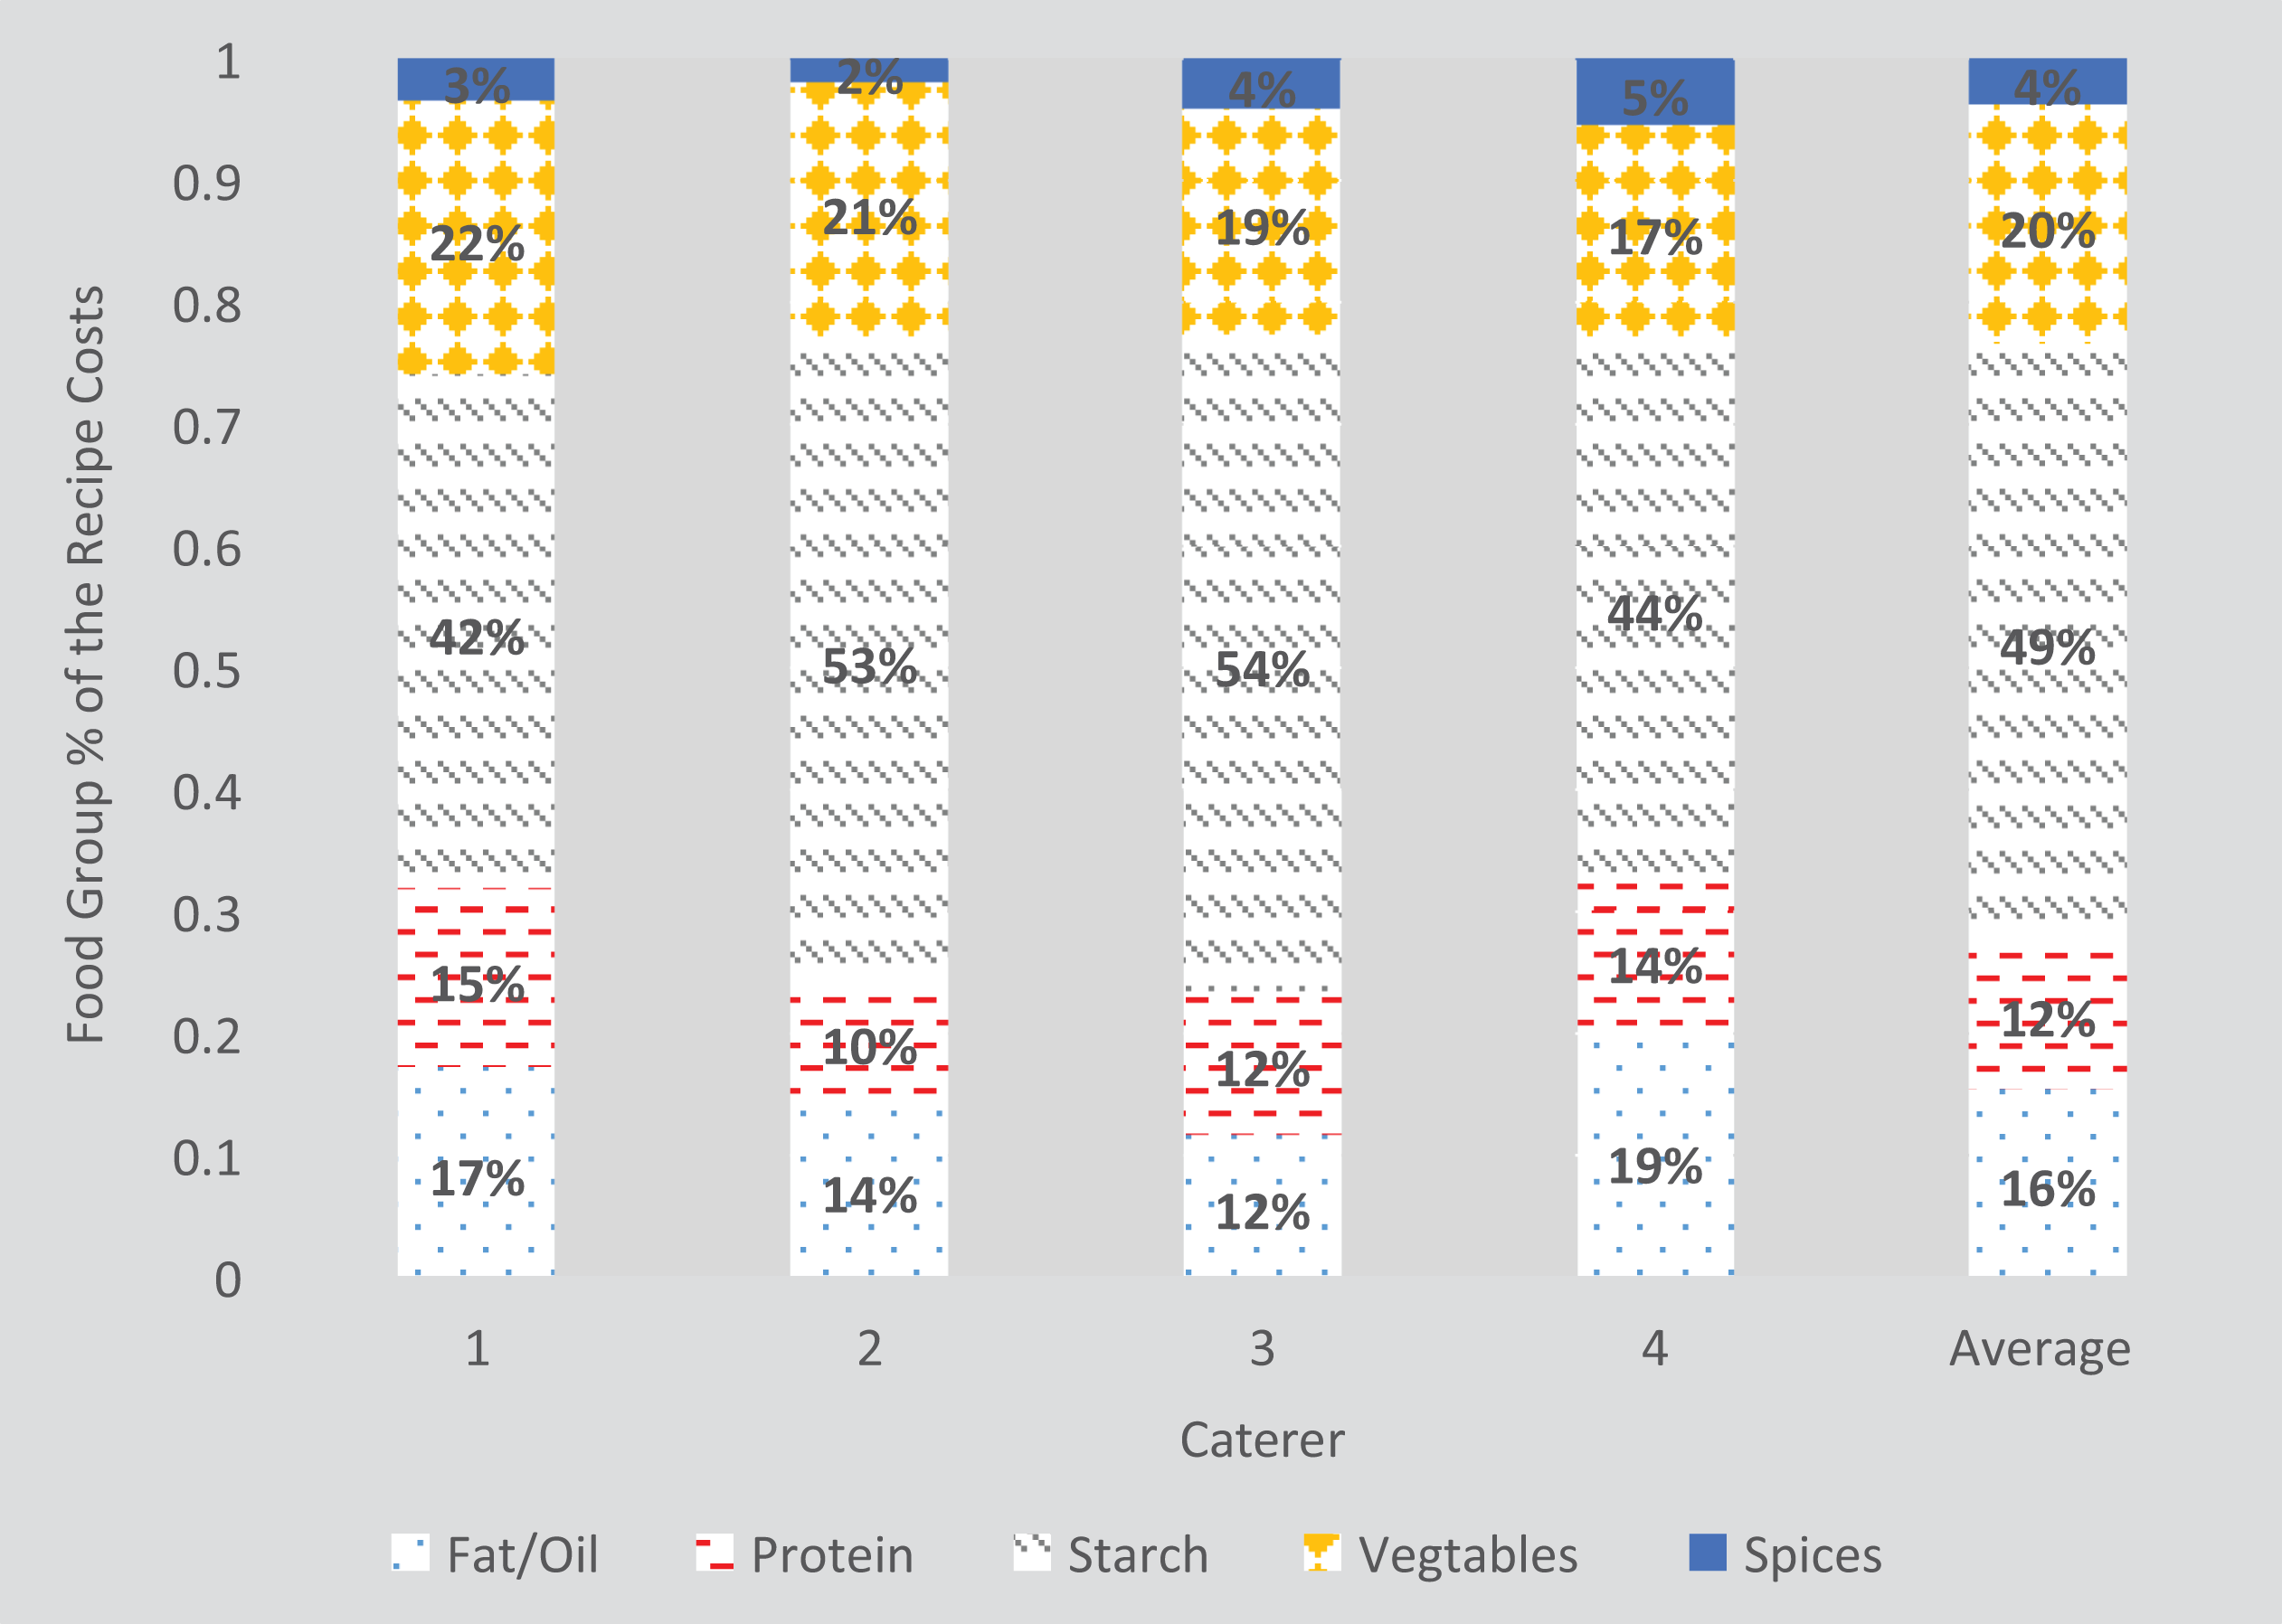
Food groups as a percentage of each caterer’s preparation.
Research Aim 1 Proposes That GSFP Caterers Can Deliver a School Lunch for Under 100 Pesewas
The average total cost of the food ingredients across the 4 caterers was 62 pesewas ($.13 USD), with a range of 47 to 68 pesewas ($.10-$.15 USD). With respect to the tomato stew meal, the GSFP’s offer of 100 pesewas allows for an average gross margin of 38%. Average gross margin per meal then amounts to 73 GH¢ ($15.67 USD), assuming an average student ingredient cost of 62 pesewas and 191 servings per lunch day. Thus, our proposition is correct.
Research Aim 2 Proposes That the Tomato Stew, as Prepared, Meets the RDA for Protein in the Lunch Meal
Macro- and micronutrient content per meal served varies considerably across the 4 caterers with respect to the percentage of the RDA for 4- to 8-year-old children. For reference purposes, the protein RDA for 4- to 8-year-old children is 19 g of protein per day. It is significantly higher (78%) at 34 g for 9- to 13-year-old children. Thus, age becomes very important when estimating the effectiveness of a meal to meet the RDA for a particular child. On average, the tomato stew meets 46% of the carbohydrate needs and 32% of the protein needs of our reference age group, 4- to 8-year-old children (Figure 2). Assuming similar portion sizes, achievement percentage by the tomato stew of the RDA for protein falls to 18% when 9- to 13-year-old children consume the meal. In terms of minerals, the stew provides only 2% of the calcium and 7% of the iron required, but 68% of sodium for children 4 to 8 years old. The tomato stew provides 31% of a 4- to 8-year-old child’s vitamin D needs and more than 20% of vitamins B-6, B-12, and E. Thus, the meal does meet the single meal threshold for protein for 4- to 8-year olds, but does not meet the threshold for 9- to 13-year olds.
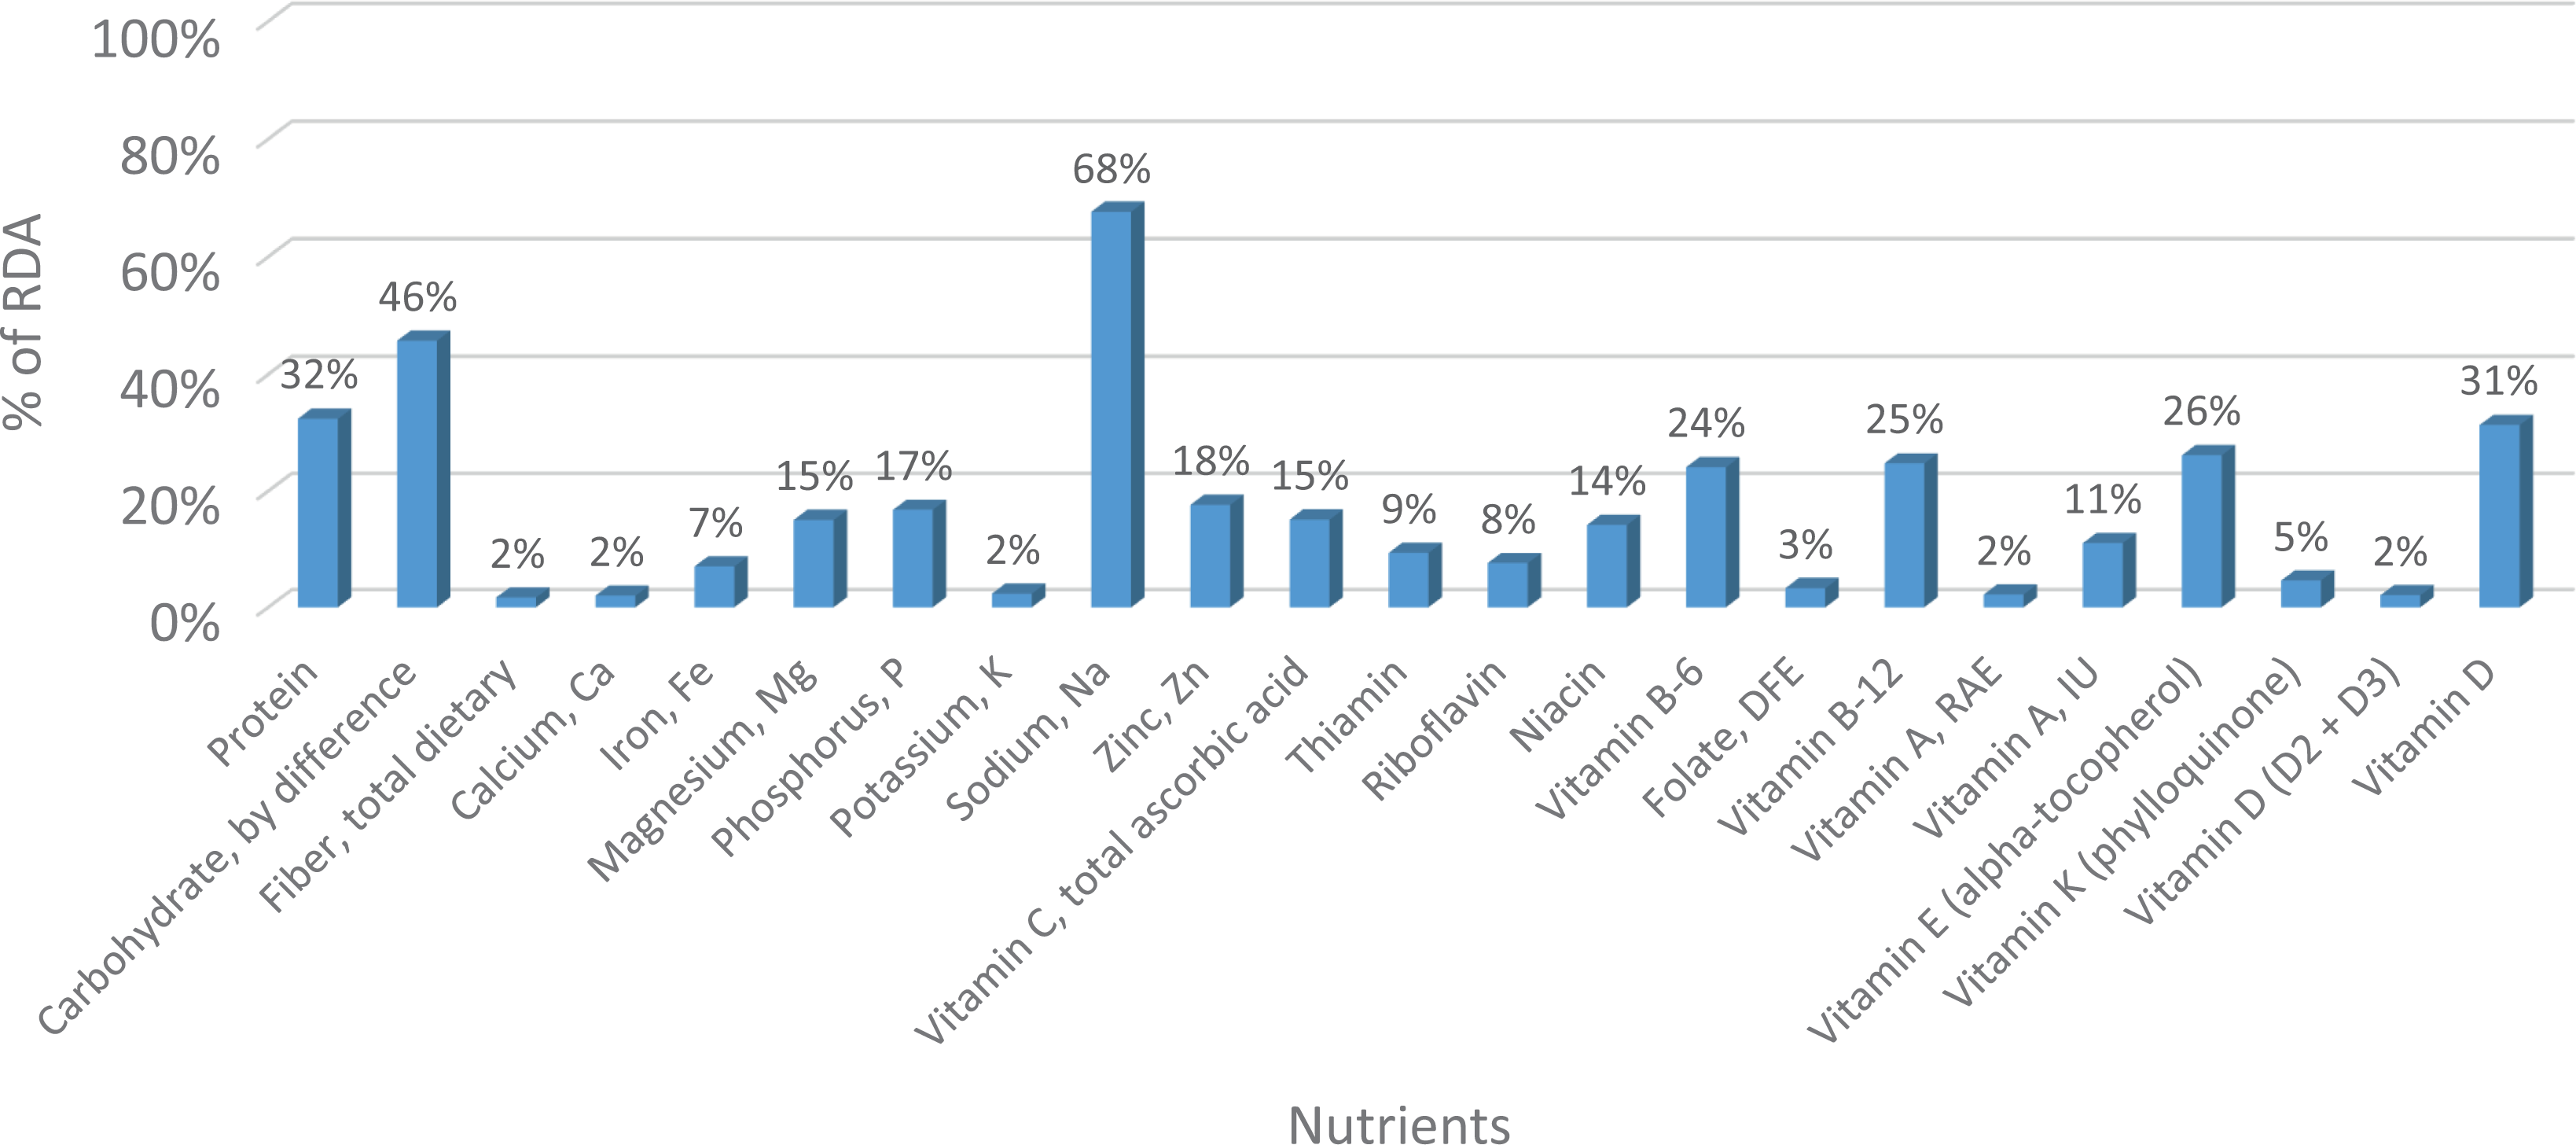
The average nutrient profile for the tomato stew meal across all 4 caterers, as a percentage of the RDA, for 4- to 8-year olds. RDA indicates recommended daily allowance.
Research Aim 3 Proposes That Soy Can Serve as a Cost-Effective Ingredient to Fortify the Meal in Terms of Protein Level and Protein Quality
Addition of soy into foods represents an easy strategy to improve the nutrient composition of meals; however, it is not without complications. Soy ingredients have unique flavors, which if added in high quantity, can unduly influence the final flavor profile of the recipe, resulting in changes in consumer compliance. Some authors use soy flour to enhance the nutritional value of different foods, reporting exchanges ranging from 5% to 40% to make specific recipes such as bread, 14 tortillas, 15 biscuits, 16 fritters, 17 garri, 18 and soup. 19 In any of these publications, exchange of soy flour for other main ingredients in less than 10% of weight did not modify the acceptability of the food. In this study, we simulated replacing a small amount of rice (10 g) with 10 g of either TSP, soy flour, or tofu, which represents 13% of the rice and 4% of the total recipe by weight. The 3 soy products significantly vary with respect to their nutrient composition effects on the tomato stew recipe when substituting 10 g of soy for 10 g of rice (Figure 3).
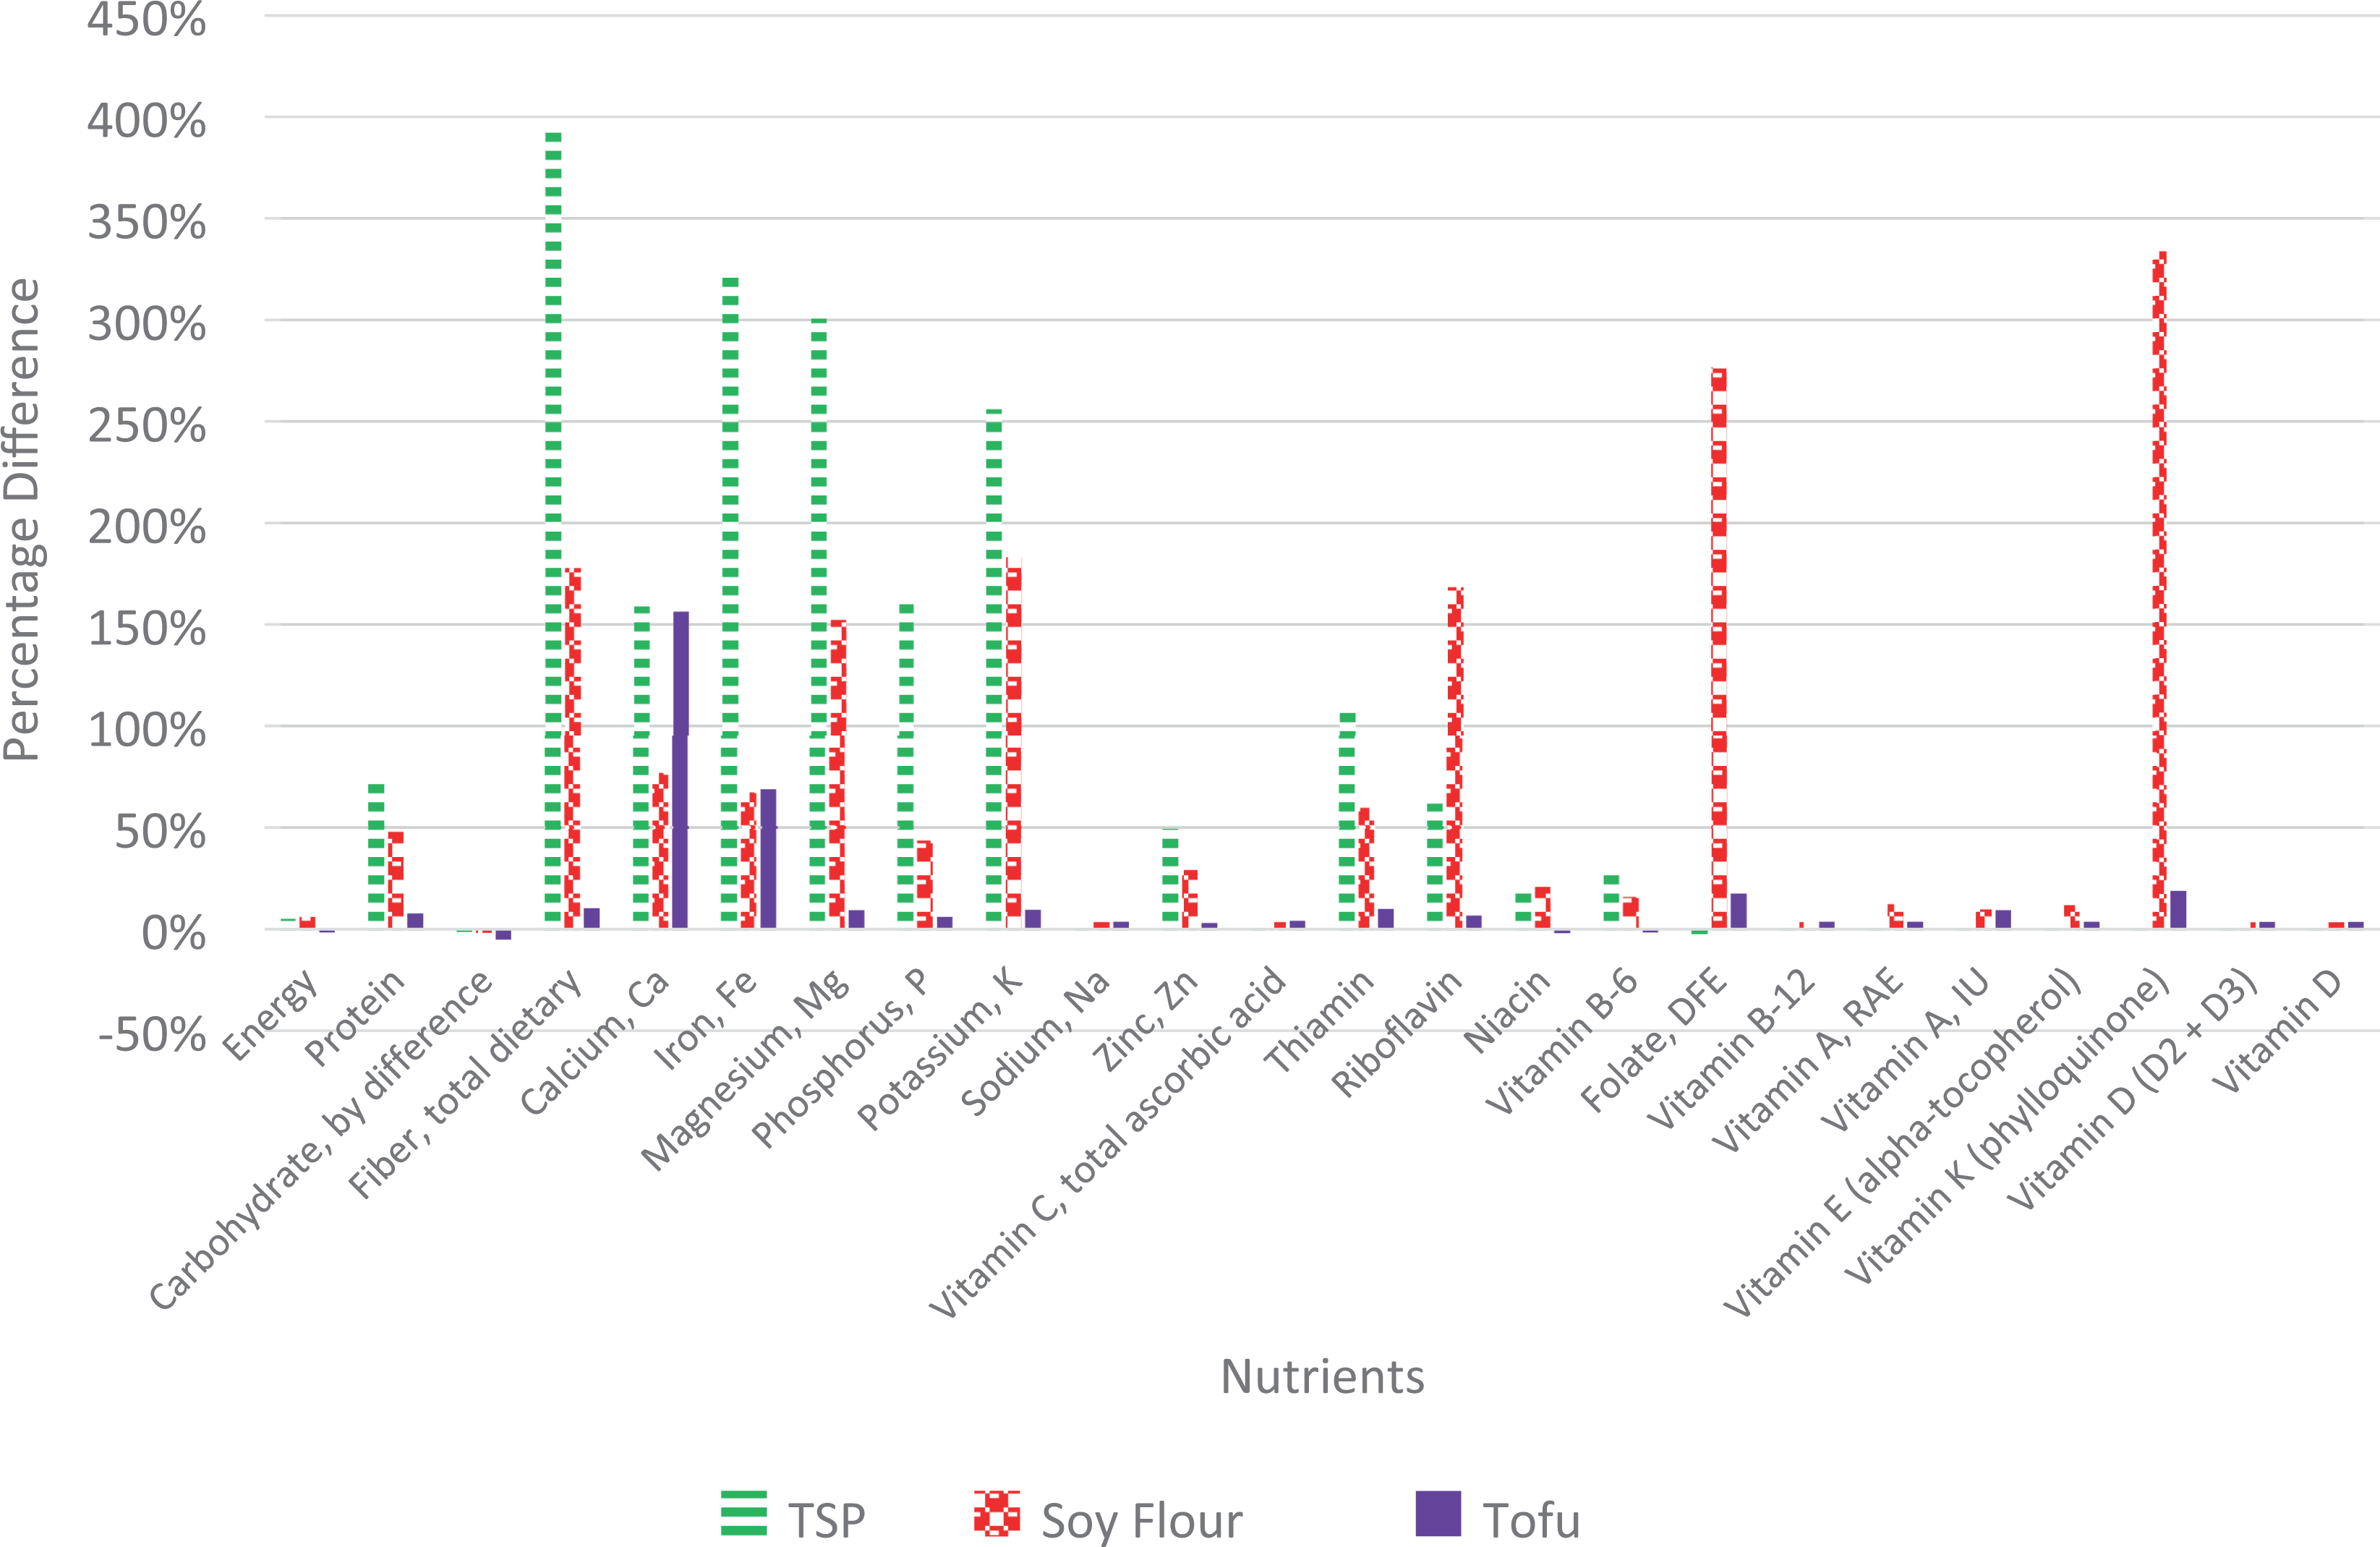
Nutritional differences on average across the 4 caterers when modeling the addition of 10 g of soy and removing 10 g of rice.
The TSP serves as a low-cost, defatted, high-protein, vegetable-based ingredient that is also shelf-stable. 20 Texturized soy protein (TSP) is an extruded form of soy flour that provides cooking functionality and, as a meat analog, it provides a number of consumption attributes, such as mouthfeel and meal density. These characteristics make TSP a viable meat substitute, especially for the national school program in the United States that seeks ingredients that can simultaneously reduce fat yet maintain protein levels in the meal. 21,22 We assumed for the analysis that TSP contains 50% protein and costs 17.50 GH¢/kg ($3.68 USD) or 0.0175 GH¢/g. As noted above, a Ghanaian soy processor who will soon begin producing TSP in Ghana provided us with the data specific to TSP pricing. Adding 10 g of TSP represents adding 0.175 GH¢ and 5 g of protein to the recipe. Each gram of protein delivered through TSP costs 0.035 GH¢. The net average cost of the tomato stew recipe rises 25% (15 pesewas or $.03 USD) from 62 ($.13 USD) to 77 ($.17 USD) pesewas when adding 10 g of TSP and removing the cost of 10 g of rice (Table 4). The percentage of the RDA for protein advances 24 points.
Change in Costs and Nutrition When Fortifying Tomato Stew With Soy.
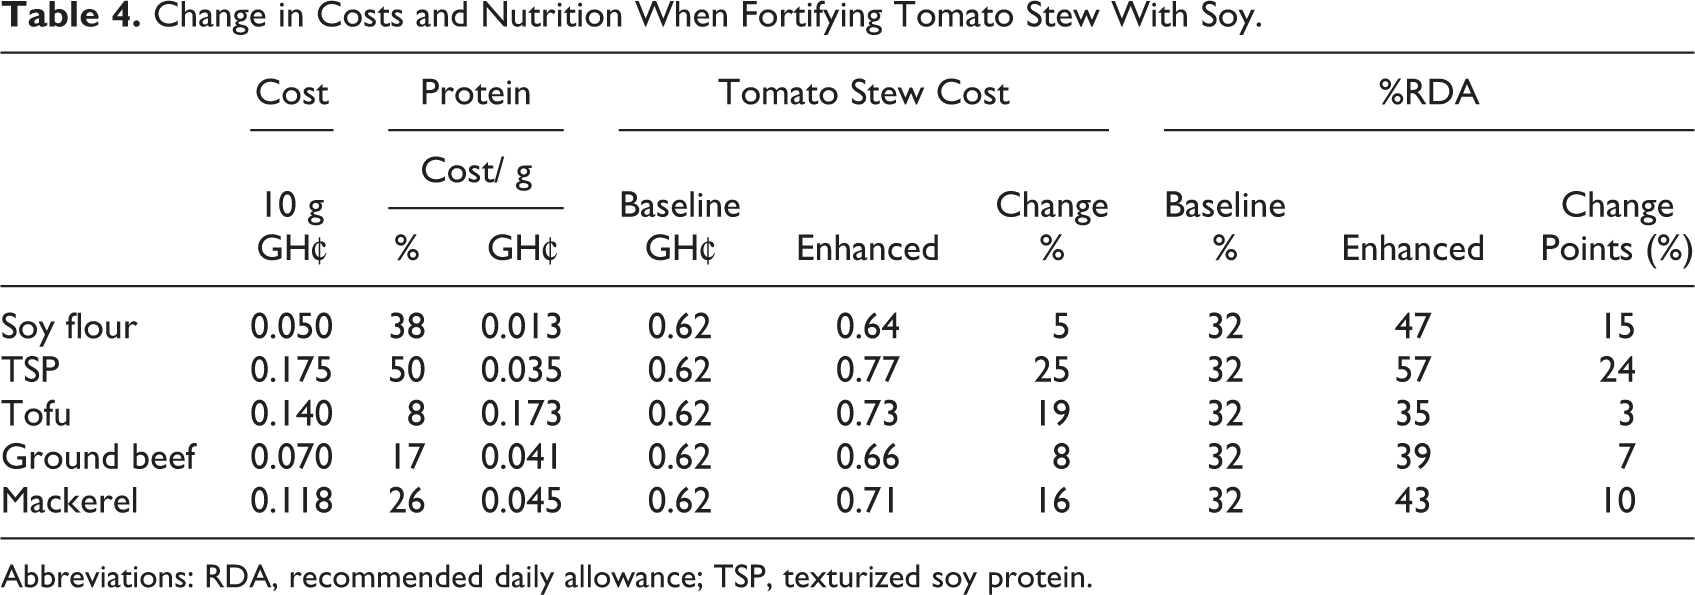
Abbreviations: RDA, recommended daily allowance; TSP, texturized soy protein.
Soy flour, which is less processed and cheaper than TSP, is a high-protein cooking and baking ingredient. 20 It is shelf-stable so too is appropriate for institutional settings. For this analysis, we assumed that soy flour contains 38% protein and costs 5.00 GH¢/kg or 0.005 GH¢/g. Adding 10 g of soy flour contributes 0.05 GH¢ to the recipe’s gross costs and 3.8 g of protein to the tomato stew. Thus, each gram of protein delivered through soy costs 0.013 GH¢. The cost of adding a gram of soy flour is 38% of the cost of adding a gram of TSP. Food preparers use soy flour in limited quantities because it does not have near the range of applications or consumer acceptance as TSP or tofu. However, as an ingredient, it balances nutrient density and cost, so it can efficiently deliver protein to a meal when used in moderation. Each gram of protein delivered through soy flour costs 0.013 GH¢. The net average cost of the tomato stew recipe rises 5% (2.84 pesewas or $.01 USD) from 62 to 64 pesewas when adding 10 g of soy flour and removing the cost of 10 g of rice. The percentage of the RDA for protein advances 15 points.
Finally, we modeled the addition of tofu to the tomato stew, which is a coagulated form of soymilk. Tofu as an ingredient readily absorbs the spices and flavors of a recipe. 23 Tofu serves as an important component of the portfolio of food products and ingredients, such as milk, yogurt, cheese, and okara, produced by soy dairy processing plants. Tofu costs about 14 GH¢/kg or 0.14 GH¢/g, which is 80% the cost of TSP and is 2.8 times the cost of soy flour. Though it varies depending on the preparation, tofu contains less protein (6%-10%) than soy flour (38%) and TSP (50%). 24 Tofu’s relatively lower protein density results from containing over 80% moisture compared to less than 10% for flour and TSP. In terms of protein density, tofu contains about one-fifth (22%) the level of protein per gram of soy flour and just 16% the level of TSP. At 8% protein and costing 1.4 pesewas ($.003 USD) per gram, the cost of 1 g of tofu protein is 17 pesewas ($.04 USD), which delivers protein to the tomato stew at a cost about 13 times that of soy flour. The net average cost of the tomato stew recipe rises 19% (12 pesewas or $.03 USD) from 62 to 73 pesewas when adding 10 g of tofu in exchange of 10 g of rice. The percentage of the RDA for protein only advances 3 points.
Thus, in terms of research aim 3, soy can serve as a cost-effective ingredient to fortify the meal in terms of protein level and protein quality. However, the form of soy matters.
Research Aim 4 Proposes That Significant Differences Exist in the Macro- and Micronutrient Profile Due to Caterer Discretion, and These Differences Affect the Marginal Cost of Adding a Unit of Protein at the Caterer Level
For comparative purposes, we modeled the addition of 10 g of ground beef or 10 g of the standard protein used in the stew, mackerel. We assume for ground beef a protein level of 17% (USDA, 2018) and a cost of 0.7 pesewas ($.002 USD) per gram. The beef cost originates from our field research in local markets in Tamale during the study period. Adding 10 g of ground beef adds 7 pesewas ($.02 USD) of additional cost and 1.71 g of additional protein to the recipe. Ground beef, when priced at 7 GH¢/kg, is about 40% more expensive than soy flour and contains less than half the level of protein. The net average cost of the tomato stew recipe rises 8% (4.84 pesewas or $.01 USD) from 62 to 66 pesewas when adding 10 g of ground beef and removing the cost of 10 g of rice. The percentage of the RDA for protein only advances 7 points.
The main protein source for the tomato stew in northern Ghana is mackerel. Caterers employ on average about 4.8 g of mackerel per serving costing about 6 pesewas ($.01 USD). We assume a protein level of 26% 24 and a cost of 11.76 GH¢/kg. The cost is about 1 pesewa/g, or an additional 12 pesewas ($.03 USD) when substituting for 10 g of rice. The net average cost of the tomato stew recipe rises 16% (9.61 pesewas or $0.02 USD) from 62 to 71 pesewas when adding 10 g of mackerel and removing the cost of 10 g of rice. The percentage of the RDA for protein advances 10 points.
Recipe Protein Details
Finally, for example purposes, we more deeply explored caterer #1’s prepared recipe to understand better the sources of protein in the recipe (Table 5). Caterer #1’s original prepared recipe contains 13 ingredients, which include mackerel, tofu, and anchovy. For example purposes, we then replace 10 g of rice with 10 g of TSP per serving. Rice provides the majority of the protein followed by tomatoes and mackerel, before adding the TSP. The major protein source shifts from rice to TSP when replacing 10 g of rice with 10 g of TSP, per serving. The TSP provides 5.00 (62%) of the 8.11 g of protein per serving under the TSP fortified recipe (Figure 4). Rice contributes 1.84 g (23%), and tofu, anchovy, tomato, and mackerel combined provide an additional 1.20 g (15%) within the fortified recipe.
An Example Protein Profile: Caterer #1 +10 g TSP/−10 g Rice.
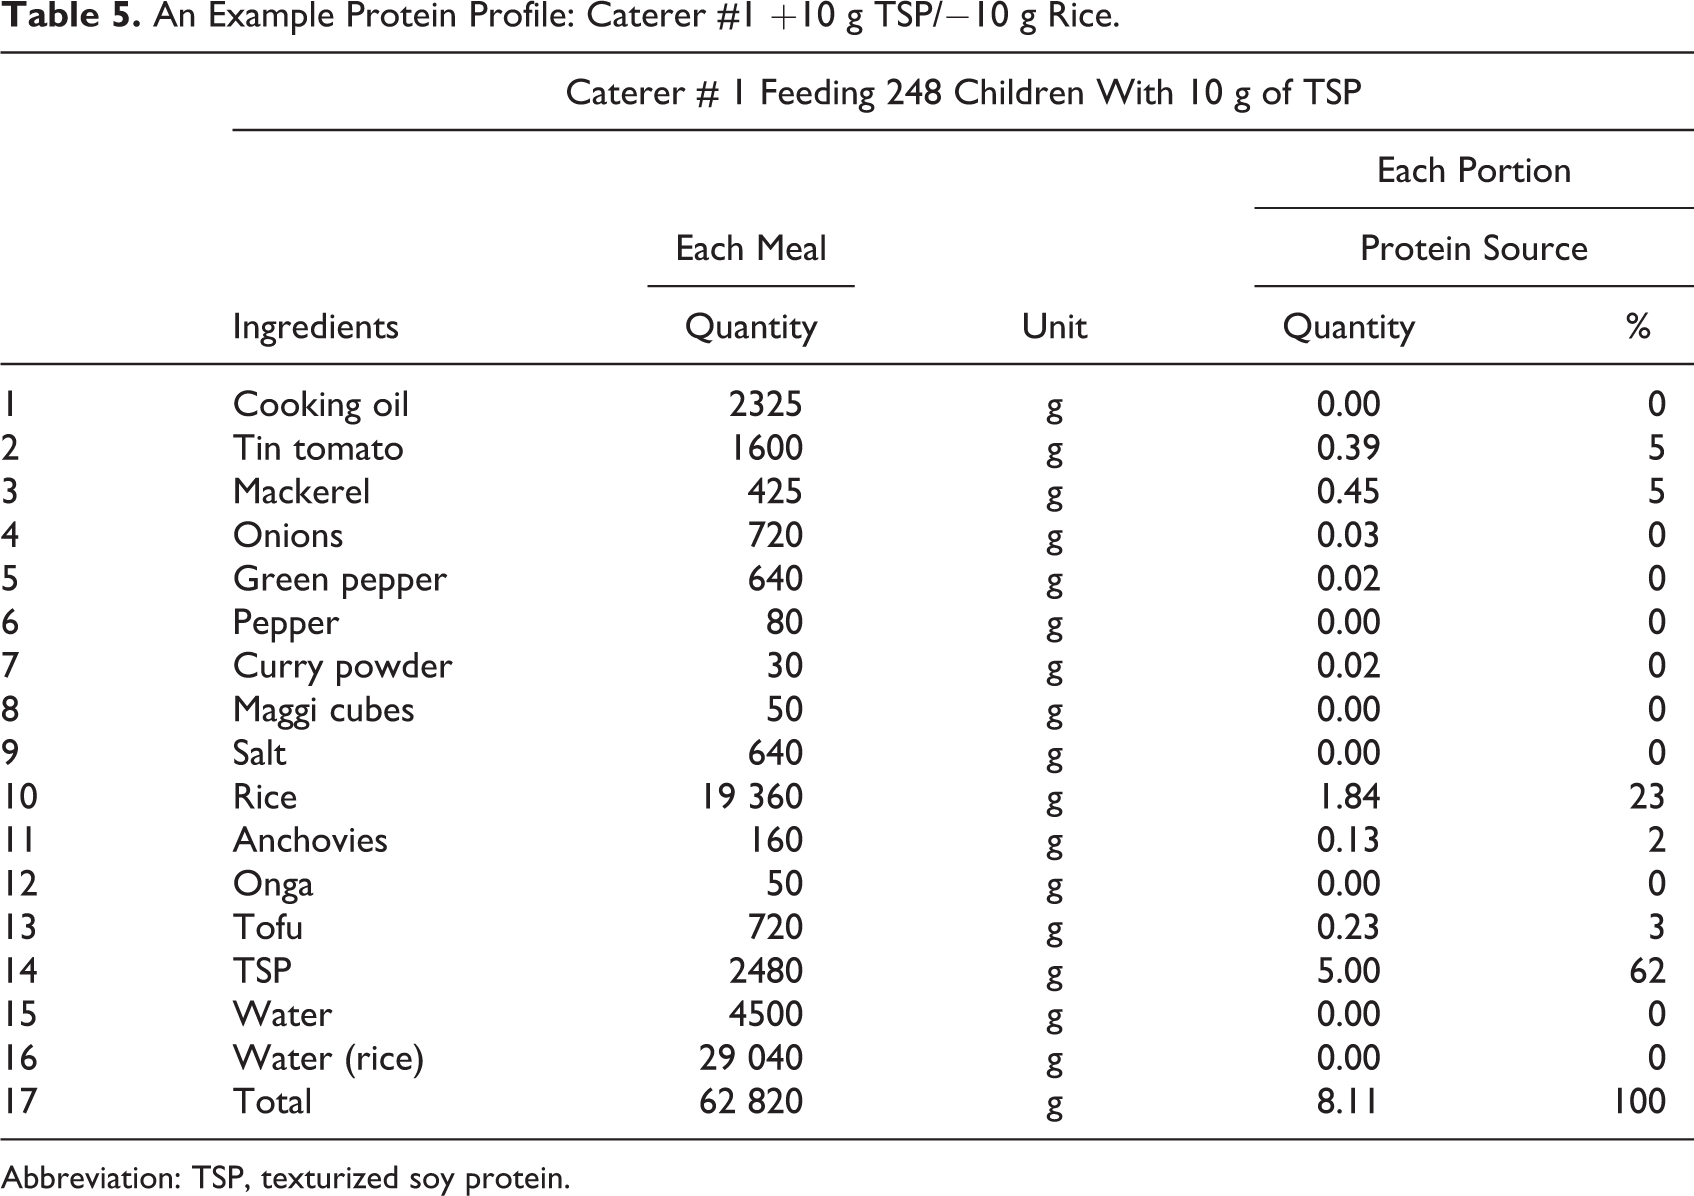
Abbreviation: TSP, texturized soy protein.
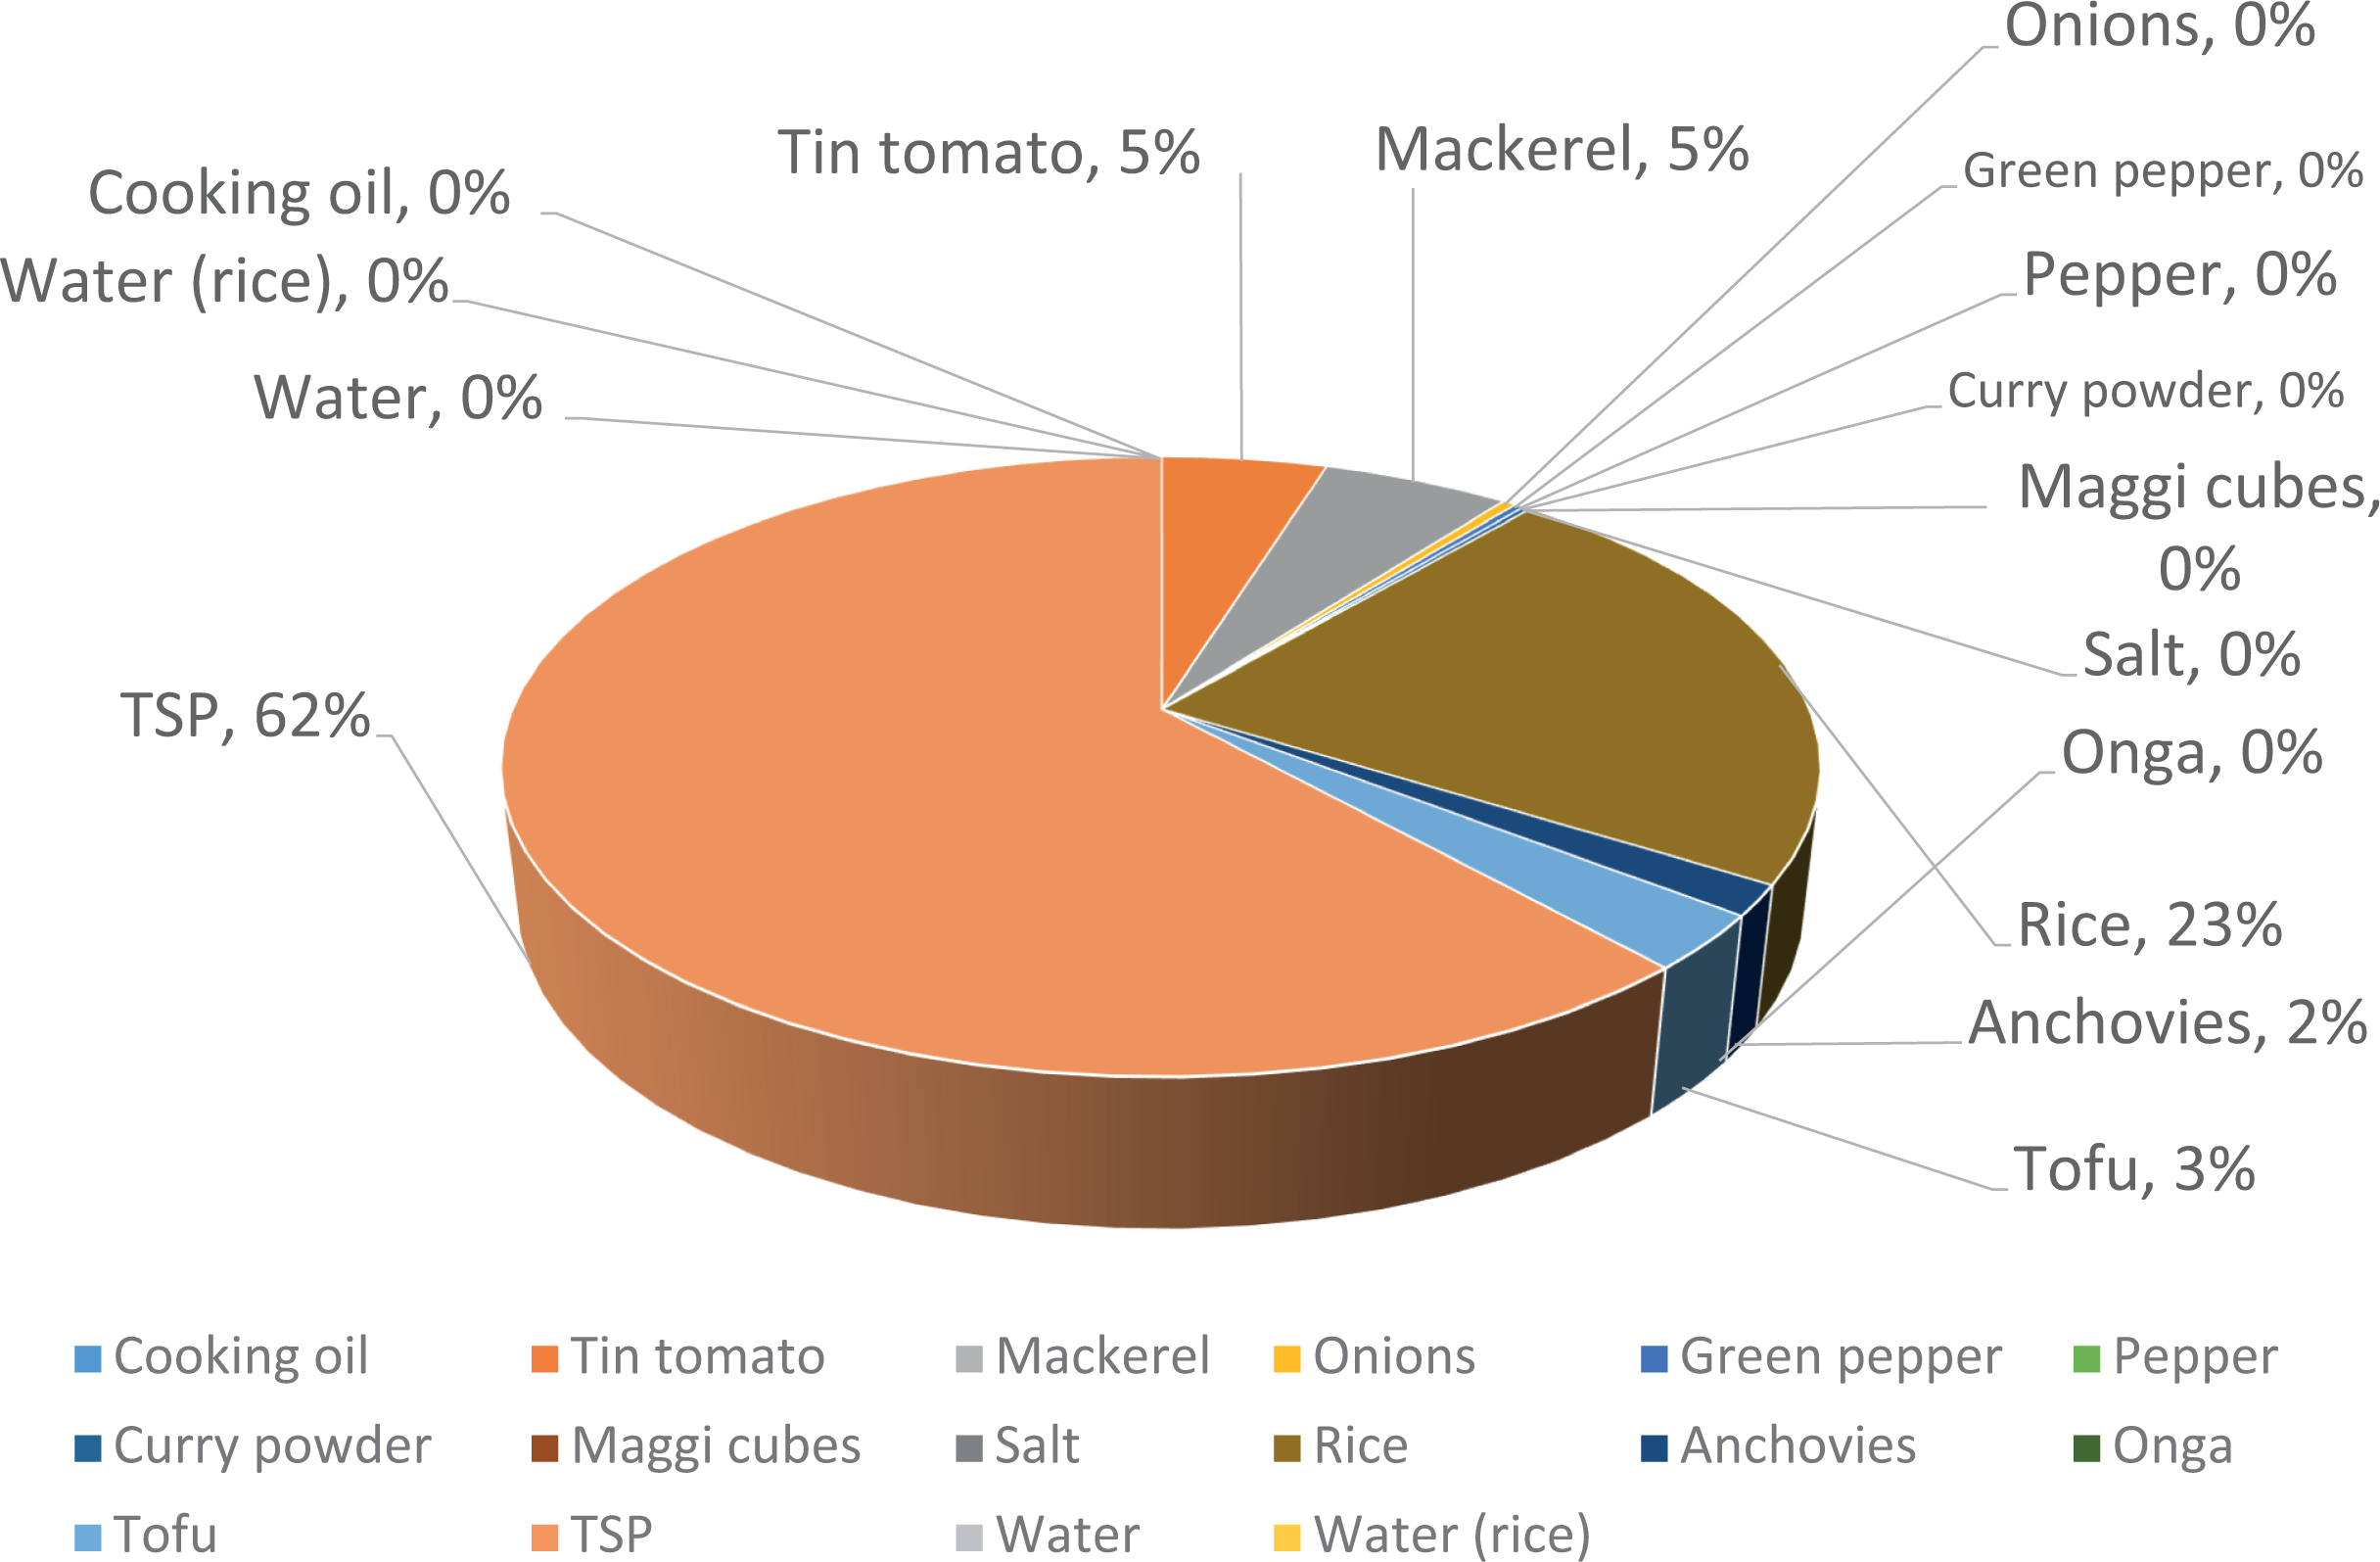
An example protein profile: Caterer #1 +10 g TSP/−10 g rice. TSP indicates texturized soy protein.
Thus, differences in protein source not only exist across the 4 caterers, but adding soy significantly alters the protein profile of the tomato stew.
Summary
On average, the 4 caterers provide 32% of the RDA for protein, ranging from 27% to 37%, in their tomato stew preparations for students aged 4 to 8 years, but falls to 18% for children aged 9 to 13 years. Adding soy flour raises the RDA percentage by about 15 points, to 111% of the RDA for 4- to 8-year-old children and 62% of the RDA for 9- to 13-year-old children. The average tomato stew recipe enhanced with 10 g of soy flour delivers 47% of the RDA for protein and raises the gross cost 5%. As a measure of protein delivery efficiency, each gram of protein cost delivered by soy flour costs 0.013 GH¢ and is the most cost-effective form of protein among the soy products, ground beef, and mackerel (Figure 5). Soy flour costs 0.0019 GH¢ per point improvement in the achievement level for the RDA for protein, assuming a one-to-one replacement with rice.
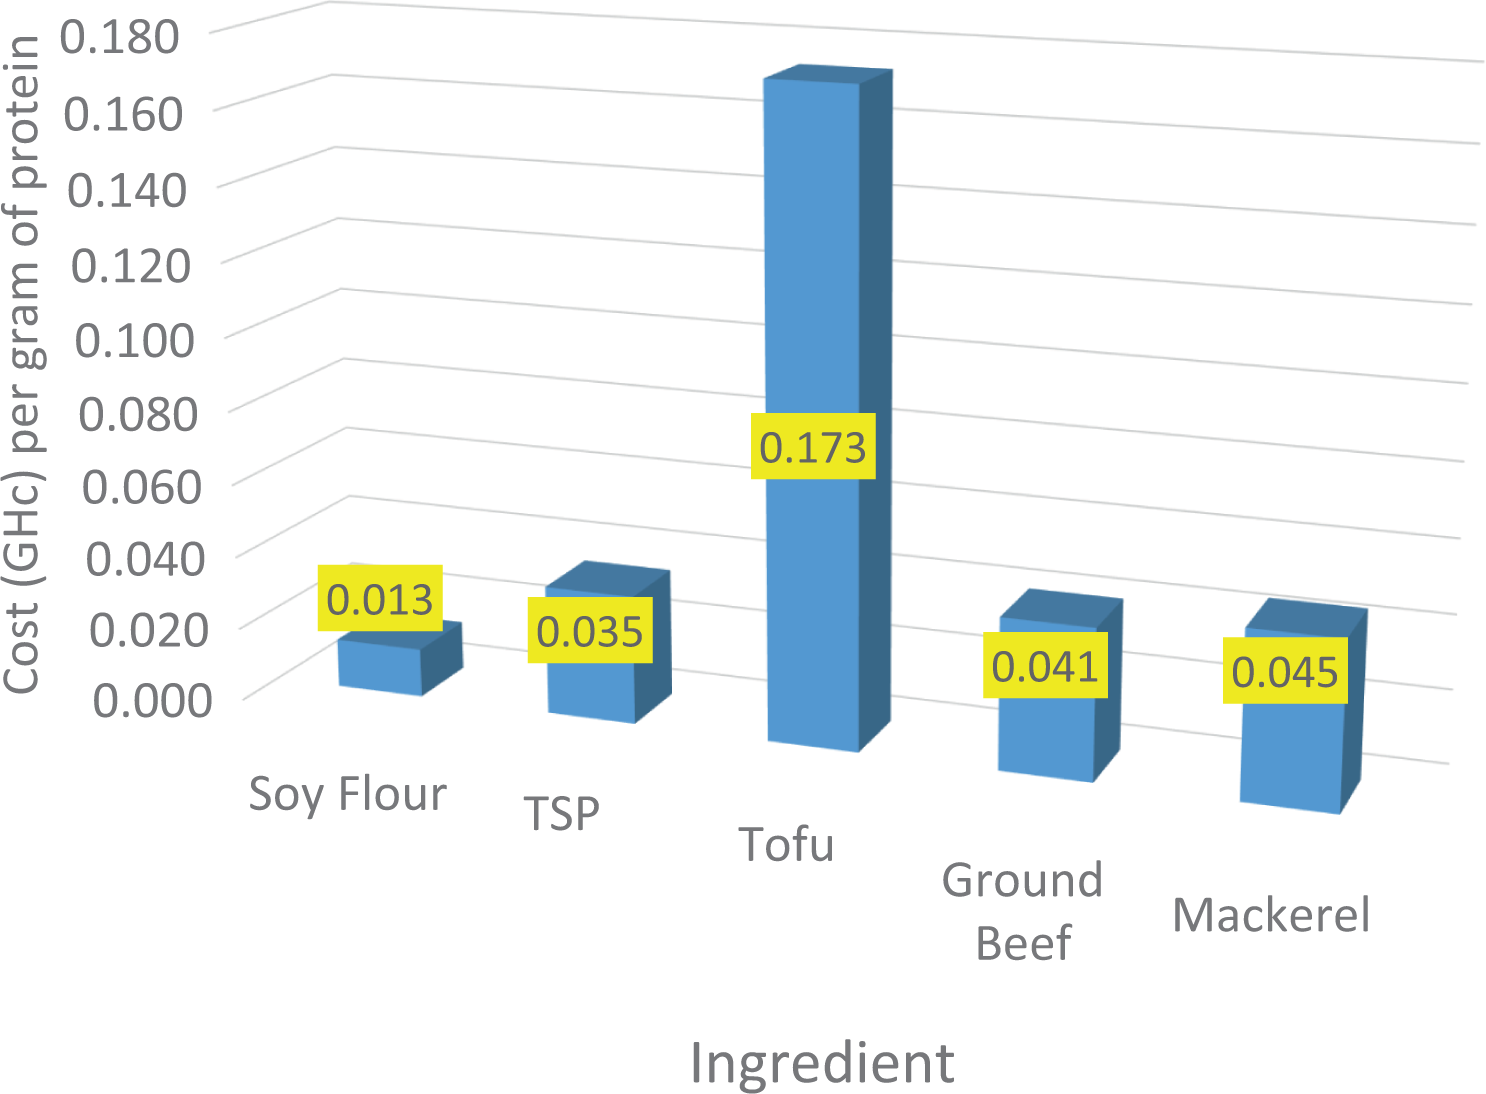
The cost efficiency of protein ingredients: Cost per gram of protein.
Alternatively, TSP, the second most cost-effective ingredient, costs about 2.5 times soy flour but is a more efficient deliverer of protein than tofu, ground beef, or mackerel. It is the most costly ingredient, but contains the highest percentage of protein. The TSP also has the added advantage of superior functionality as an ingredient compared with soy flour. Each unit improvement of the RDA for protein using TSP costs 0.0063 GH¢, about 3 times more expensive per unit improvement than soy flour, assuming a similar reduction in rice. Conversely, tofu, ground beef, and mackerel cost 0.0431 GH¢, 0.0071 GH¢, and 0.0092 GH¢, respectively, in terms of per unit improvement of the RDA for protein.
Finally, a word of caution. We engaged a thorough field methodology to effectively ground our findings and reduce some of the estimation bias common to comparable studies of school lunch nutrition. Due to cost constraints, we selected only 1 recipe and 4 caterers as a data set. Therefore, we urge a measure of caution in generalizing our results because of our small sample size. Our measurement of actual recipe preparation and serving quantities, qualities, and costs may suffer from small sample bias.
Conclusion
Our 4 research propositions center on the delivery of nutrition through a typical school lunch meal. We depart from previous methodology, except for one study, 18 and show that significant differences exist in the food delivered to children because caterers in a developing country setting such as Ghana maintain a significant amount of discretion as to the actual recipe they utilize. Specifically, our fieldwork shows significant differences across caterers preparing the same tomato stew meal. Therefore, we suggest accurately measuring the nutritional content, costs, and quantities of the actual school lunch under study is critical to proper analysis of the level of nutrition served to the student.
Consistent though with the goals of the GSFP, the tomato stew achieves the protein targets for 4- to 8-year-old children by delivering over 6 g of protein at an average total ingredient cost of 62 pesewas ($.13 USD). Concerns though exist if caterers use the same 254-g serving for older children aged 9 to13. Under such conditions, the tomato stew recipe will deliver only 18% of the RDA for protein. Our focus on macro- and micronutrient delivery, rather than broad food groups, provides specificity that complements the recommendations of 2 and their study of the GSFP.
For parsimony, we only analyze a one-to-one substitution of the protein with rice, in this manuscript. For policymakers though, the results show the economy of soy flour as an ingredient that can lower costs and raise nutrition when substituting for mackerel, the local protein source of choice. Soy flour as an ingredient generally involves lower levels of inclusion because at higher levels, for example, in excess of 10 g per serving, the taste and functionality of the meal might negatively influence consumer acceptability. 18 Soy flour delivers the most protein for the least cost, providing about 3, 4, and 5 times the protein improvement per GH¢ than TSP, ground beef, and mackerel, respectively. Additionally soy flour is shelf stable, which is valuable for institutional feeding situations. Our findings indicate that GSFP policymakers can lower their costs per meal, while increasing the level of protein and thus the quality of the meals using soy flour or TSP. Assessing the specific maximum inclusion levels of soy flour in a school lunch requires additional research. Though not discussed in this manuscript, soy contains a more complete amino acid profile than most cereals and legumes. 25
On the other hand, though TSP is not as efficient a deliverer of protein as soy flour, it does compare very favorably to local proteins, such as mackerel and ground beef. The TSP, like tofu, has a superior level of functionality and consumer acceptance in cooking applications, 22 even at levels in excess of 10 g. Policymakers would be able to lower meal costs and improve protein levels by recommending the substitution of TSP for commonly available proteins such as ground beef and mackerel, assuming TSP products such as flour and grits were available on the market.
Finally, policymakers need to validate soy supply chains to assure wide availability, stable pricing, and reliable quality levels, whether the product is soy flour, TSP, or tofu. Guidance from the private sector estimates that TSP may soon be available and would sell for 17.50 GH¢/kg compared with mackerel that sells for 11.70 GH¢/kg. The TSP though contains double the protein level at less than twice the cost per kilogram, so is a cost-effective protein substitute.
Footnotes
Declaration of Conflicting Interests
The author(s) declared no potential conflicts of interest with respect to the research, authorship, and/or publication of this article.
Funding
The author(s) disclosed receipt of the following financial support for the research, authorship, and/or publication of this article: This research is in part funded by the USAID Feed the Future Lab for Soybean Value Chain Research. The award number is Cooperative Agreement Number AID OAA-L-14-00001.