
Abstract
Background:
India became self-sufficient in food because of the Green Revolution in the 1960s. However, both the technological innovation and policy support have been biased toward cereals. It is expected that cereals are the major source of proteins in the diet. In recent years, the consumption of cereals is declining in spite of increasing output due to declining preference. Therefore, the country needs to increase production and consumption of pulses to meet the nutritional requirements of the population.
Objectives:
This article discusses the trends in pulse and protein consumption over the years. Further, it focuses on the substitutability and complementarity between various sources of proteins.
Methods:
A seemingly unrelated regression estimation (SURE) framework is used to study the price and income effect on proteins from different sources—cereals and pulses (plant sources), milk and milk products, animal sources such as eggs, fish, and meat, and other sources of protein.
Results:
It is found that the expenditure on proteins is large and significant. As income increases, consumption of proteins increases. Higher disposable incomes have led to higher demand of animal sources of proteins. There are significant food price effects in our analysis—negative for cereals and positive for eggs. As the price of pulses increases, consumption of animal sources of proteins increases.
Conclusion:
It becomes important to contain volatility in pulse prices given that it is a major source of plant protein. States distributing pulses in the Public Distribution System show higher consumption of proteins than other states.
Introduction
In any economy, development of both the production and consumption sector is important. With careful planning and technological development, it is possible to bring about significant changes in the production sector in a short span of time. The consumption sector, however, is built on well-established social and cultural norms that evolve slowly over time. 1 Further, the study analyzed the continuities and discontinuities in consumption in a changing environment and argues that people cling to primitive patterns of consumption as an effective defense against forces of change. Thus, changes occurring in the consumption sector are not as dramatic or visible as those happening in the production sector but are equally important to take into account. In the Indian context, both consumption and production patterns have been largely influenced by the policy environment. So, even though food preferences are determined by social and cultural norms, the quantity of foods consumed dependents on various factors including resource constraints and food policies. For instance, distribution of cereals in the Public Distribution System (PDS) leads to Indian diets being cereal dominated.
India is home to the highest number of malnourished children under 5 years of age. Thirty-seven percent of the children were stunted, 21% wasted, and 34% were underweight in 2014-2015, according to the Fourth Round of the National Health and Family Survey (NFHS-4). 2 Protein-energy malnutrition as well as micronutrient deficiencies can be reduced by increasing the consumption of pulses, which are a rich source of protein, minerals, iron, and fiber. Thirty-one percent of Indians are vegetarian, according to the 2006 The Hindu-CNN-IBN State of the Nation Survey (note 1). Pulses are consumed by vegetarians as well as nonvegetarians in India. Indeed, despite the proportion of nonvegetarians, the quantity of consumed egg, fish, and meat is small. Thus, a large part of the protein requirement could be met by pulses. Food security stands on the 3 pillars of availability, access, and absorption (nutrition; UNICEF). 3 Although food security is a flexible concept, food safety and affordability are also important components. Recently, there has been a paradigmatic shift from food availability to household food insecurity, and from energy intake (input measures) to anthropometric measures (output indicators), thereby shifting the focus to proper nutrition. 4
Consumption patterns have been found to be affected by rising incomes, changing prices, urbanization, globalization, demographic shifts, improved transportation, and changing consumer tastes and preferences. Apart from this, there are regional differences. The staple diet in one state is very different from that in another. Given different diets, food expenditure responses to income and price changes vary between different states. 5 Low-income households spend a greater portion of their budget on staple food products and are generally more responsive to food price and income changes. The magnitude of a household’s response to income and price change also differs across food items. For example, in poorer households, greater budget adjustments are made to higher value food items such as dairy and meat, and staple food budgets undergo little change. Rural and urban spending patterns are extremely different. Urbanization has played a significant role in changing food consumption patterns. Given the different lifestyles of urban and rural residents, as well as increased food availability and higher purchasing power in urban areas, urban and rural diets tend to differ significantly. With higher disposable income among urban residents, the demand for meat, horticultural, and processed products is expected to increase within developing countries. 6,7
The analysis of consumption patterns in a developing country like India has to take several factors into account. The process of development is accompanied by rising levels of income, leading to increases in real per capita expenditure, changes in institutions and organizations, and, in general, a change in preferences. Change in global prices is another important factor that affects the consumption patterns in any country. The economic reforms undertaken in India during the 1990s, along with a sharp rise in her growth rate, make this decade a significant one for the country, as it saw India become one of the world’s fastest growing economies. The results of changing consumption patterns are important for policy makers because they are concerned with food and nutrition security in a period of significant economic change that is meant to improve the overall well-being of the people.
India became self-sufficient in food because of the Green Revolution in the late 1960s. However, both technological innovation as well as policy support has been biased toward cereals, namely, wheat and rice. Minimum support prices for rice and wheat are highly lucrative. In terms of calories, cereals supply well over 50% of the total calorie intake of the household. 8 Cereals are a moderate source of protein as they contain only about 10% protein. However, in the Indian diet, they are the major source of protein (National Sample Survey Organisation [NSSO], 2011-2012). 9 In recent years, the consumption of cereals has been declining in spite of increasing output because of changing preferences. In 2004-2005, 66.4% and 56.2% of total protein came from cereals in the rural and urban sectors, respectively. 10 This declined to 62.5% and 53.7%, respectively, in 2011-2012. Therefore, the country needs to increase consumption and production of pulses in order to meet the nutritional requirements of the population. Using nationally representative data, Maitra et al found evidence of a worsening of calorie intake over the periods 1998-1999 and 2005-2006.
There have been some studies on calorie intake, such as those authored by Deaton and Dreze, 11 Chatterjee et al, 12 and Maitra et al, 13 among others. However, there is a shortage of theses focusing on protein intake. A few studies that focus on protein intake include Swaminathan et al, 14 Minocha et al, 15 and Roy et al. 16 The studies emphasize that it is not just essential to enhance the quality of protein intake in the diets but also the quality of the diet in general which is a severe challenge that needs to be met in a country where diets are primarily cereal-based. Although milk production has risen in India, its consumption by the poor remains low, and leguminous (protein-rich) grain production and consumption has fallen; even though this can help resource-poor farmers increase their intake of quality food. The current study adds to the literature on protein consumption in India. Cereals and pulses are the major sources of protein from plant sources in the Indian diet. Pulses are nutrient-dense crops and an increased consumption of pulses in the diet is also associated with better nutrition. Encouraging the production and consumption of pulses is in line with the second Sustainable Development Goal (SDG) with the 3-fold objective to end hunger, achieve food security and improved nutrition, and promote sustainable agriculture. 17 State governments have taken proactive steps to make pulses available at reasonable prices. Distribution of pulses through PDS has been taken up by some states, following the National Food Security Act (NFSA). 18 Ensuring a smooth supply of pulses at affordable prices, however, remains a major challenge.
This article examines the consumption patterns of various pulses and proteins over the years. It then undertakes a detailed seemingly unrelated regression estimation (SURE) of protein consumption for the 68th round of the National Sample Survey (NSS) for different occupations, education groups, social castes, and monthly per capita expenditure (MPCE) for the 5 food groups of (1) cereals, (2) pulses, (3) milk and milk products, (4) egg, fish, and meat, and (5) other sources of protein. It tries to explain how the consumption of protein varies with income and prices and how these are conditioned by education, occupation, household size, and social group. Further, it focuses on the substitutability and complementarity between various sources of protein with emphasis on the plant sources of protein—cereals and pulses.
Consumption Patterns of Various Pulses and Sources of Protein
On an average, 100 g of Bengal gram (chana) comprises around 17 g of protein, 4.6 mg of iron, 186 mg of folic acid, 202 mg of calcium, and roughly 360 calories. Red gram (arhar) and black gram (urad) have a higher proportion of protein (24 g per 100 g). According to the Indian Council of Medical Research 19 (note 2), 56 g of pulses is the recommended daily intake for a low-cost Indian vegetarian diet.
In 1993-1994, the total pulse consumption was about 25.3 g per day in rural India, while it was 28.7 g per day in urban India. The consumption increased in the next 5 years to 28 g per day in the rural sector and 33.3 g per day in the urban. The consumption of pulses showed a decline during the NSSO 61st Round in 2004-2005, to 23.67 g per day in the rural sector and 27.3 g per day in the urban sector. In 2011-2012, during the NSSO 68th Round, about 26.1 g per day were consumed in the rural sector while it was 30.03 g per day in the urban sector (Table 1). The per capita per day consumption has always been higher in the urban sector as compared to the rural sector, even though a higher proportion of the population consumed pulses in the rural sector.
Consumption of Different Pulses and Pulses Products in Rural and Urban India.a
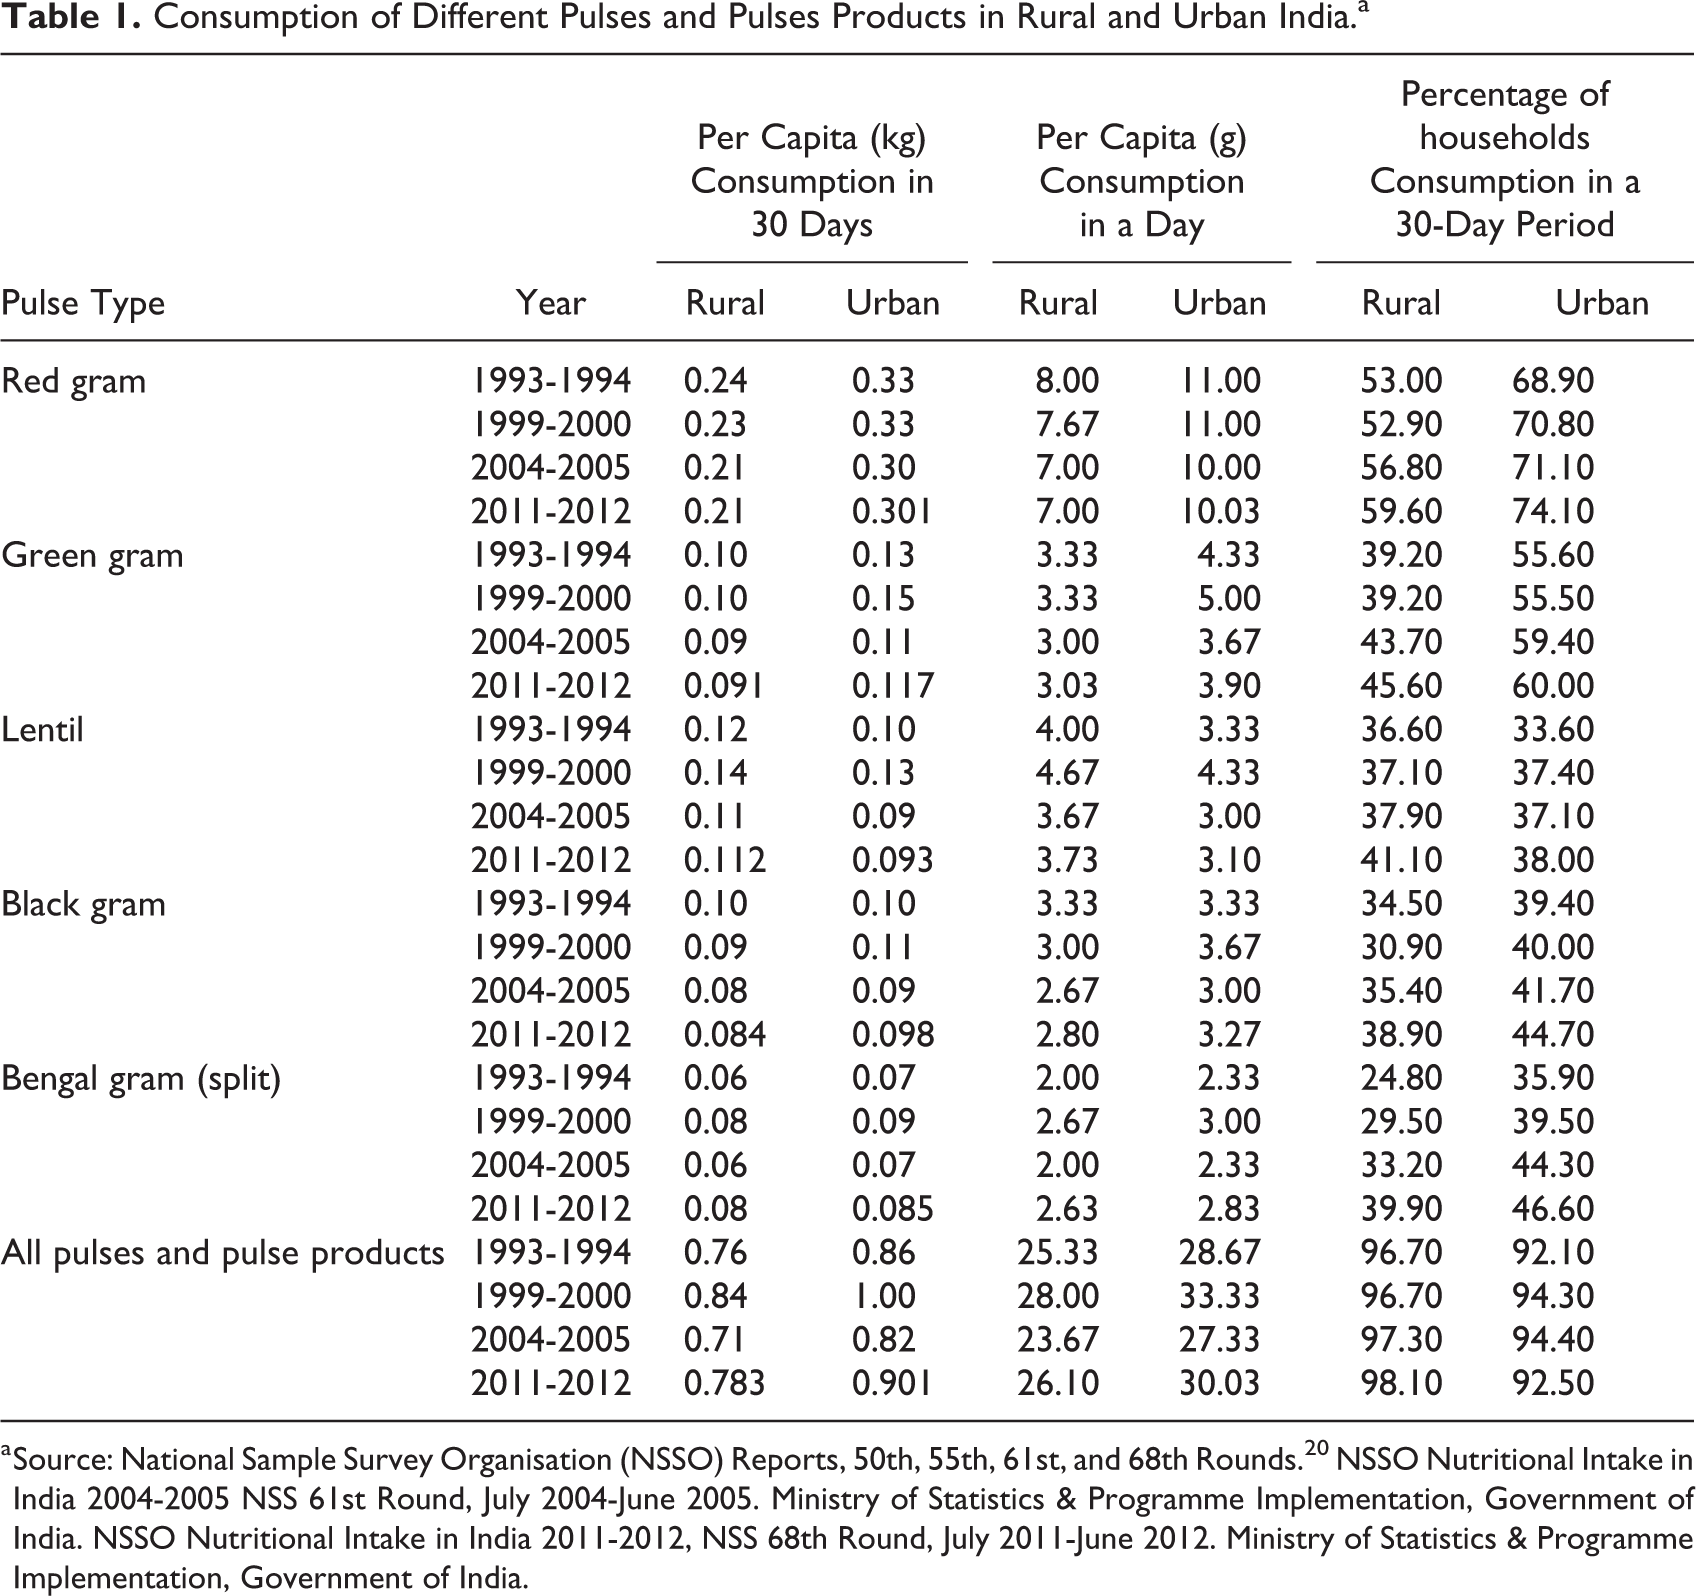
a Source: National Sample Survey Organisation (NSSO) Reports, 50th, 55th, 61st, and 68th Rounds. 20 NSSO Nutritional Intake in India 2004-2005 NSS 61st Round, July 2004-June 2005. Ministry of Statistics & Programme Implementation, Government of India. NSSO Nutritional Intake in India 2011-2012, NSS 68th Round, July 2011-June 2012. Ministry of Statistics & Programme Implementation, Government of India.
On looking at the 5 important pulse crops individually, it is observed that the consumption of red gram, green gram (moong), lentil (masur), black gram, and split Bengal gram has fallen over the time period for both the rural and urban sectors.
On examining data from the consumer expenditure surveys of the NSS, it is seen that the average consumption of pulses increased in rural India between 2004-2005 and 2011-2012, from 22 g to 26 g (Table 2). This is less than 70% of the norm of 40 g per day. Further, there were large differences across expenditure classes. In the lowest decile according to MPCE, the deficit in the consumption of pulses per day was 25 g in 2004-2005 which came down to 22 g in 2011-2012, and only persons in and above the eighth decile consumed more than 70% of the recommended dietary allowance for pulses.
Decile-Wise Consumption of Pulses and Pulses Products in Rural India Per Day Per Capita in Grams.a
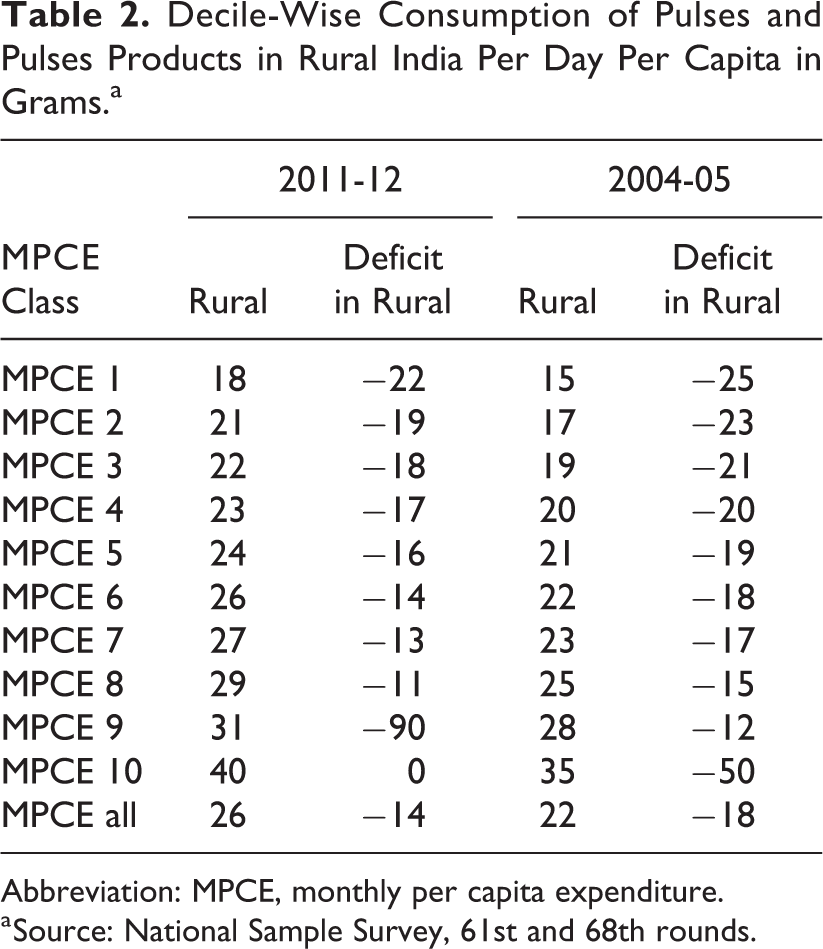
Abbreviation: MPCE, monthly per capita expenditure.
a Source: National Sample Survey, 61st and 68th rounds.
For the pulses and pulses product group as a whole, per capita consumption rose by 77 to 78 g between 2004-2005 and 2011-2012: from 705 g per month to 783 g in the rural sector and from 824 g to 901 g in the urban sector. However, in 2011-2012, the minimum requirement of 40 g per day was not observed in any of the states. Comparing the consumption of pulses between 2004-2005 and 2011-2012, the highest consumers of pulses and pulses products were Andhra Pradesh, Gujarat, Karnataka, Punjab, Maharashtra, Madhya Pradesh, Tamil Nadu, and Uttar Pradesh (Table 3). The consumption of pulses was higher in the urban sector as compared to the rural sector. Even though Rajasthan was among the highest producers of pulses, it was not among the highest consumers.
Consumption of Pulses and Pulses Products in Rural and Urban India in 2004-2005 and 2011-2012 (Per Capita, Per Day, in Gm).a
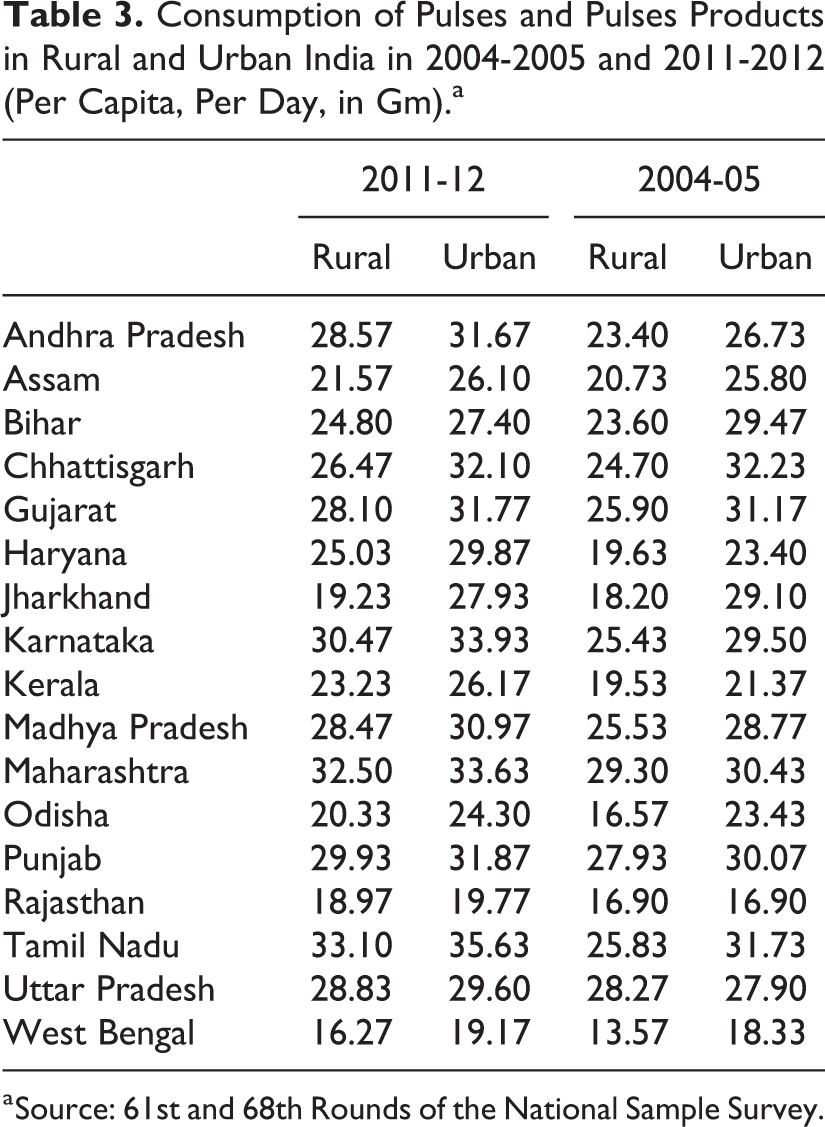
a Source: 61st and 68th Rounds of the National Sample Survey.
On looking at protein consumption across sectors, social groups, wealth quantiles, and household types, it is found that the highest share of protein in the diet is met by cereals (Table 4). The rural sector consumes more cereals than the urban sector while consumption of pulses and animal sources of food such as milk, meat, eggs, and fish is higher in the urban area. This is because the urban sector has a more diversified diet than the rural sector. The structural shift in consumption patterns is on account of the diversification effect because of easy access to supply, changed tastes and preferences, and change in relative prices. 20,21
Per Day Per Consumer Unit Consumption of Protein From Plant and Animal Sources in 2011-2012.a
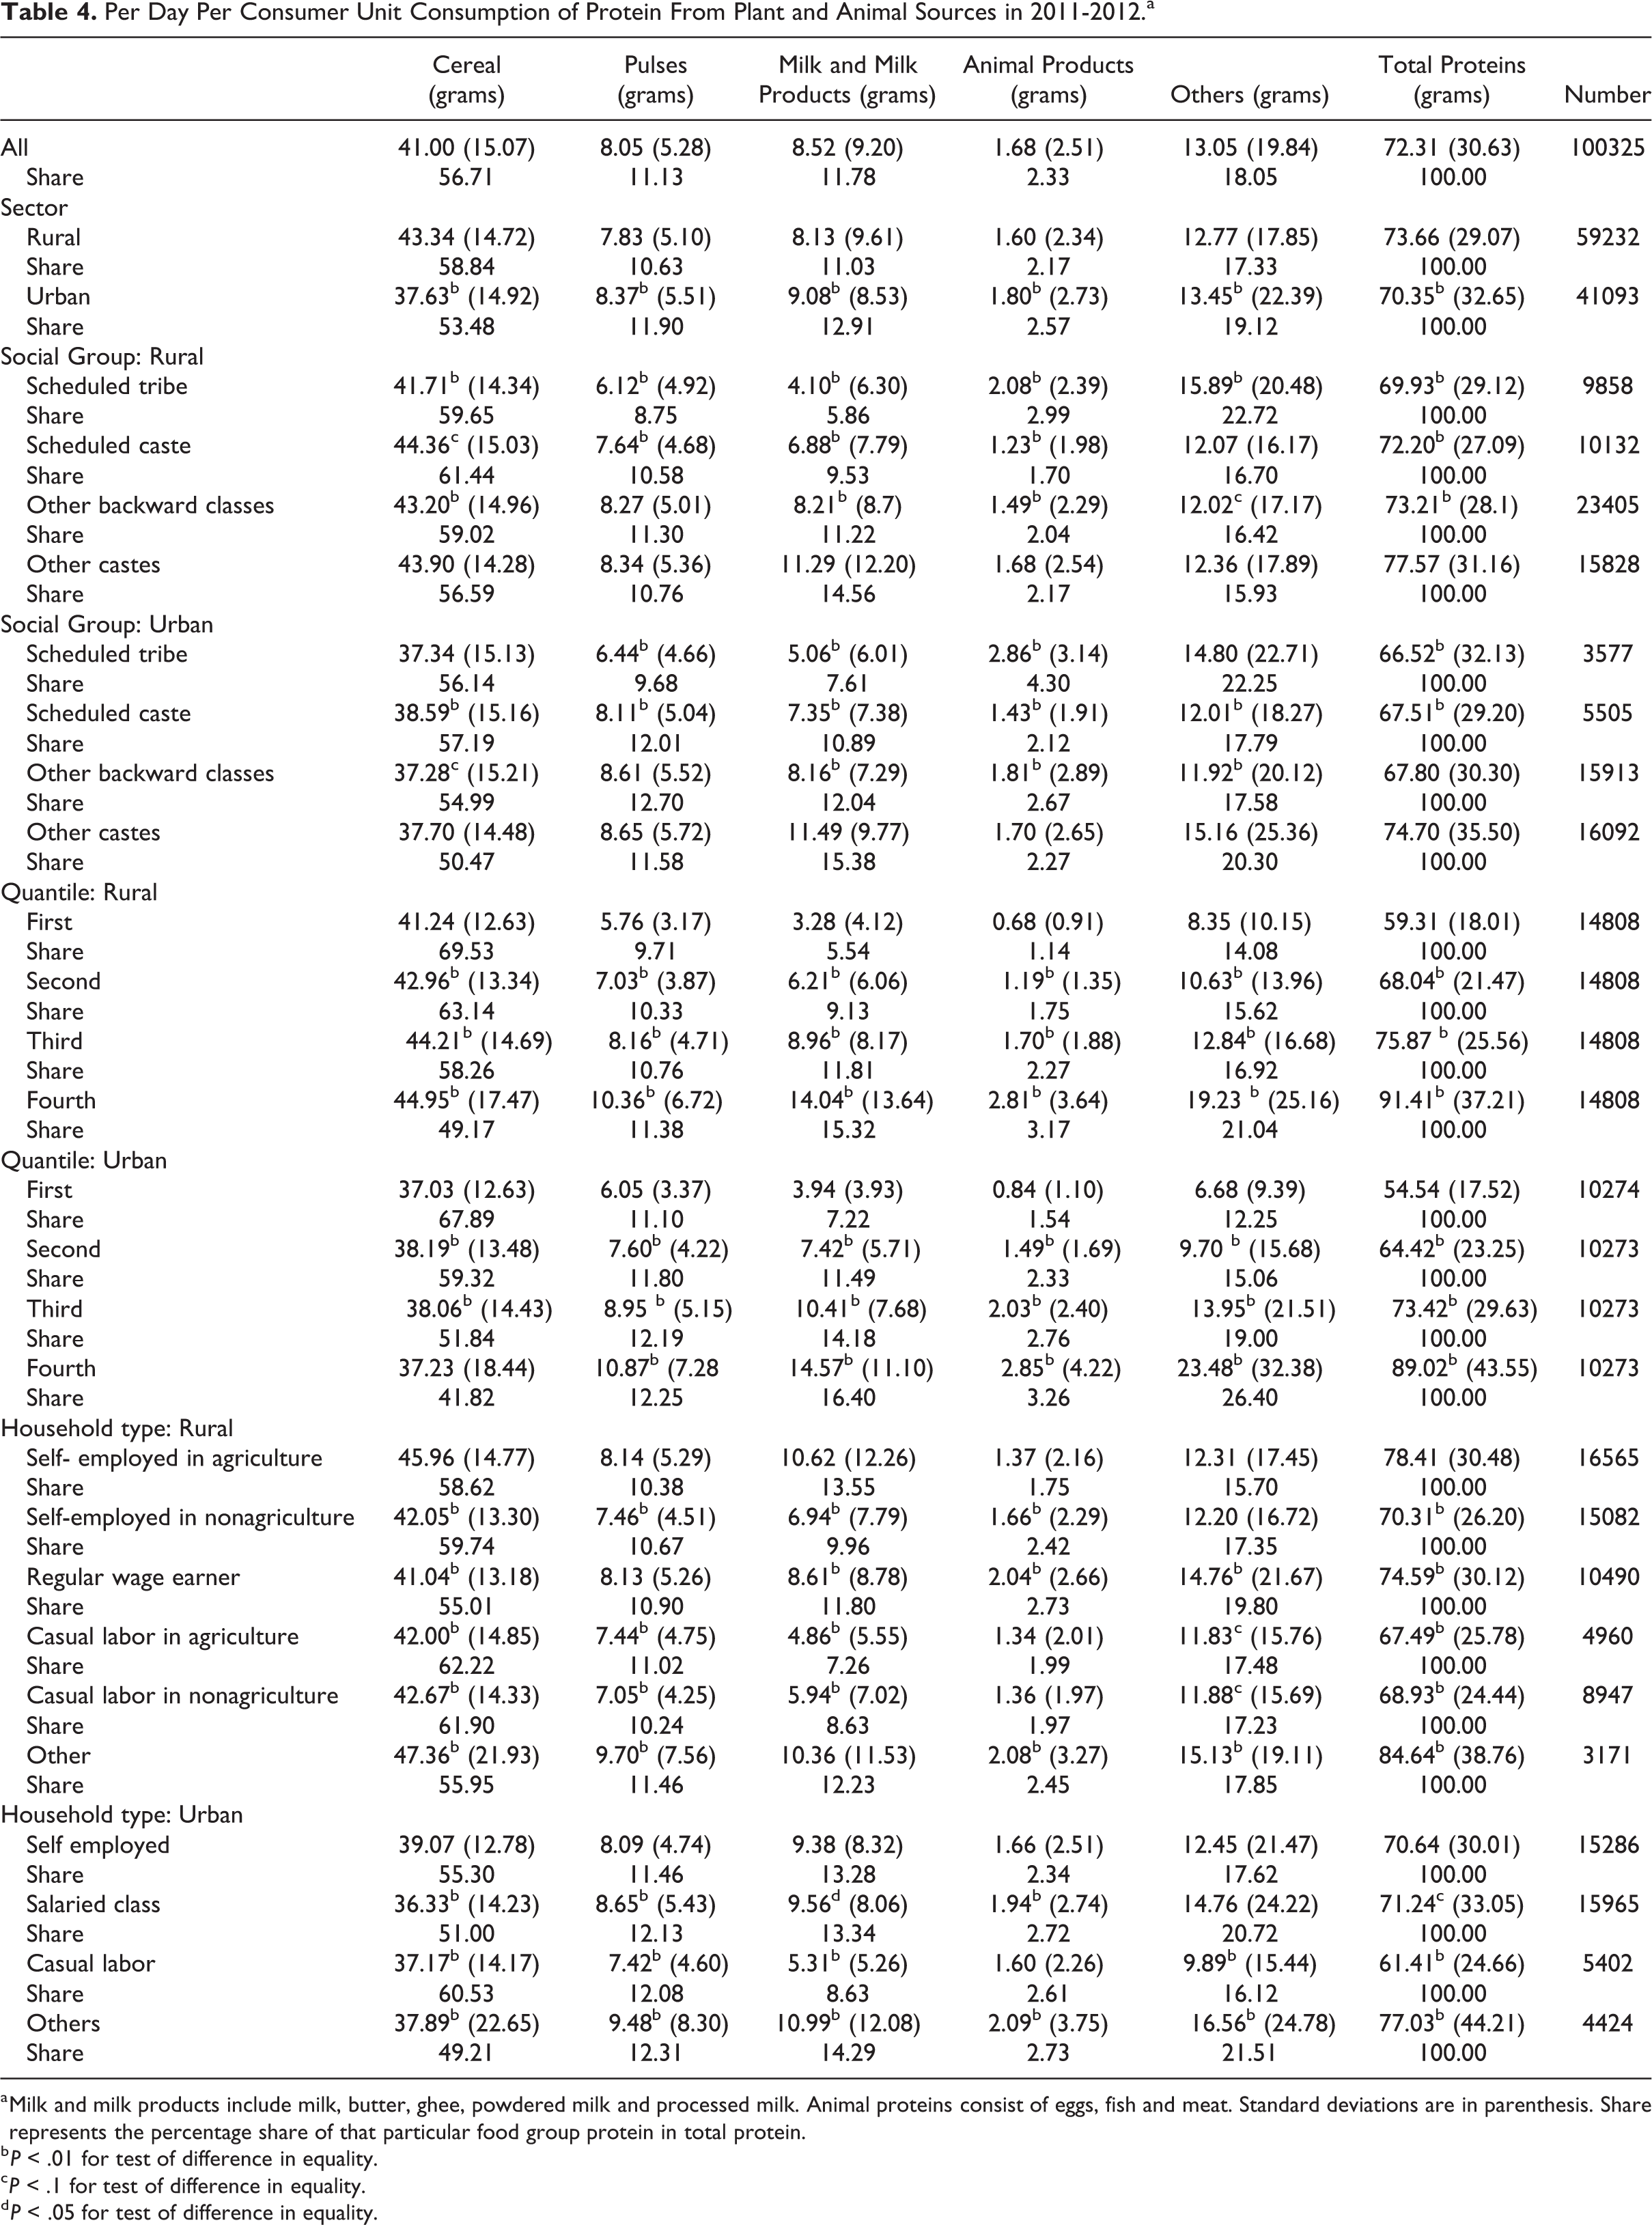
a Milk and milk products include milk, butter, ghee, powdered milk and processed milk. Animal proteins consist of eggs, fish and meat. Standard deviations are in parenthesis. Share represents the percentage share of that particular food group protein in total protein.
b P < .01 for test of difference in equality.
c P < .1 for test of difference in equality.
d P < .05 for test of difference in equality.
Kumar and Mathur find per capita consumption of all nonstaples higher in both rural and urban areas in 1987 than in 1977, and higher in urban than rural households. Moreover, rural households had higher growth rates of consumption over that period for only livestock products, but not for fruits and vegetables. Kumar 22 claims that diversification in the food basket is expected to provide food security and improve the quality of life by adding to the nutritional status and welfare of the population. Shifts in dietary pattern occur either due to rise in income or changes in prices, and consumers are exposed to a wider choice of foods. Meenakshi 5 indicates that shift in the dietary pattern from cereal consumption to more expensive milk, poultry, and meat products is a consistent change associated with economic growth the world over. This implies that indirect demand for cereals will increase, as increasing milk and meat demand exerts in turn a demand for cereals as livestock feed. Meenakshi and Ray 23 found large regional differences in expenditure patterns and claim that in a developing country, cultural and other noneconomic factors are as important as the conventional economic variables in explaining observed differences in food expenditure patterns. The poor are also consuming fewer calories over time, though it is possible that this change reflects the fact that their work involves less physical effort. 24,25 According to Ray and Lancaster, 26 a large number of households failed to meet the minimum calorie requirements right through the reform decades. Chatterjee et al 8,12 point out that cereals continue to supply well over 50% of the total calorie intake of the households. They also bring out some significant regional differences; for instance, the rural southern region represented by Andhra Pradesh recorded a sharply lower calorie intake than the rural north represented by Punjab. Murty 27 breaks down the changes in cereal quantity consumption as changes in income, prices, tastes and preferences, and other omitted variables. The analysis shows wide variation in demand elasticity across states, income groups, and sectors.
Scheduled castes (SC) consume more cereals than scheduled tribes (ST) in the urban sector while all groups consume more pulses than ST, other castes (OC) being the highest in both urban and rural sectors. Scheduled tribes consume higher quantities of animal sources of protein than other groups in both the urban and rural sectors (Table 4). The higher quantiles have a higher consumption across all food groups. In the urban sector, the middle quantiles are associated with higher consumption of cereals than other food groups. This is because as income increases, the consumption of other food groups increases and cereal consumption declines, especially in the urban sector. In the rural sector, diets are primarily cereal-based and consumption increases with income. Radhakrishna 28 also finds that, despite some improvement in the incomes of the poor and decline in relative prices of cereals, cereal consumption per head has not risen. According to him, there has been a taste shift away from cereals and some nonfood items have entered the basket of the poor and, within cereals, there has been a substitution of commodities with higher cost per calorie. A study argues that shifts in food consumption are not a measure of increased prosperity, rather food preferences have been changing over time. 29
In the rural sector, households that consume high quantities of cereals, pulses, and animal food are primarily the ones self-employed in agriculture and those with a regular wage. In the urban sector, the salaried class and other types consume higher quantities of pulses and animal sources of food while casual labor and self-employed households consume high quantities of cereal. Radhakrishna and Ravi 20,21 demonstrate that taste changes were an important factor in explaining the decline in cereal consumption, accounting for nearly 17% of the decrease in cereal intake in rural areas observed between 1972-1973 and 1987-1988. In urban areas, the corresponding figure is 8%.
On plotting the local polynomial graphs for log of protein consumption from various food groups, against log of MPCE, it is seen that cereals remain the single most important source of protein, followed by other sources of protein which include proteins from fruits, vegetables, nuts, and so on, and milk and milk products for higher income levels (Figure 1). For lower income levels, protein consumption is highest through cereals and pulses than all other sources.
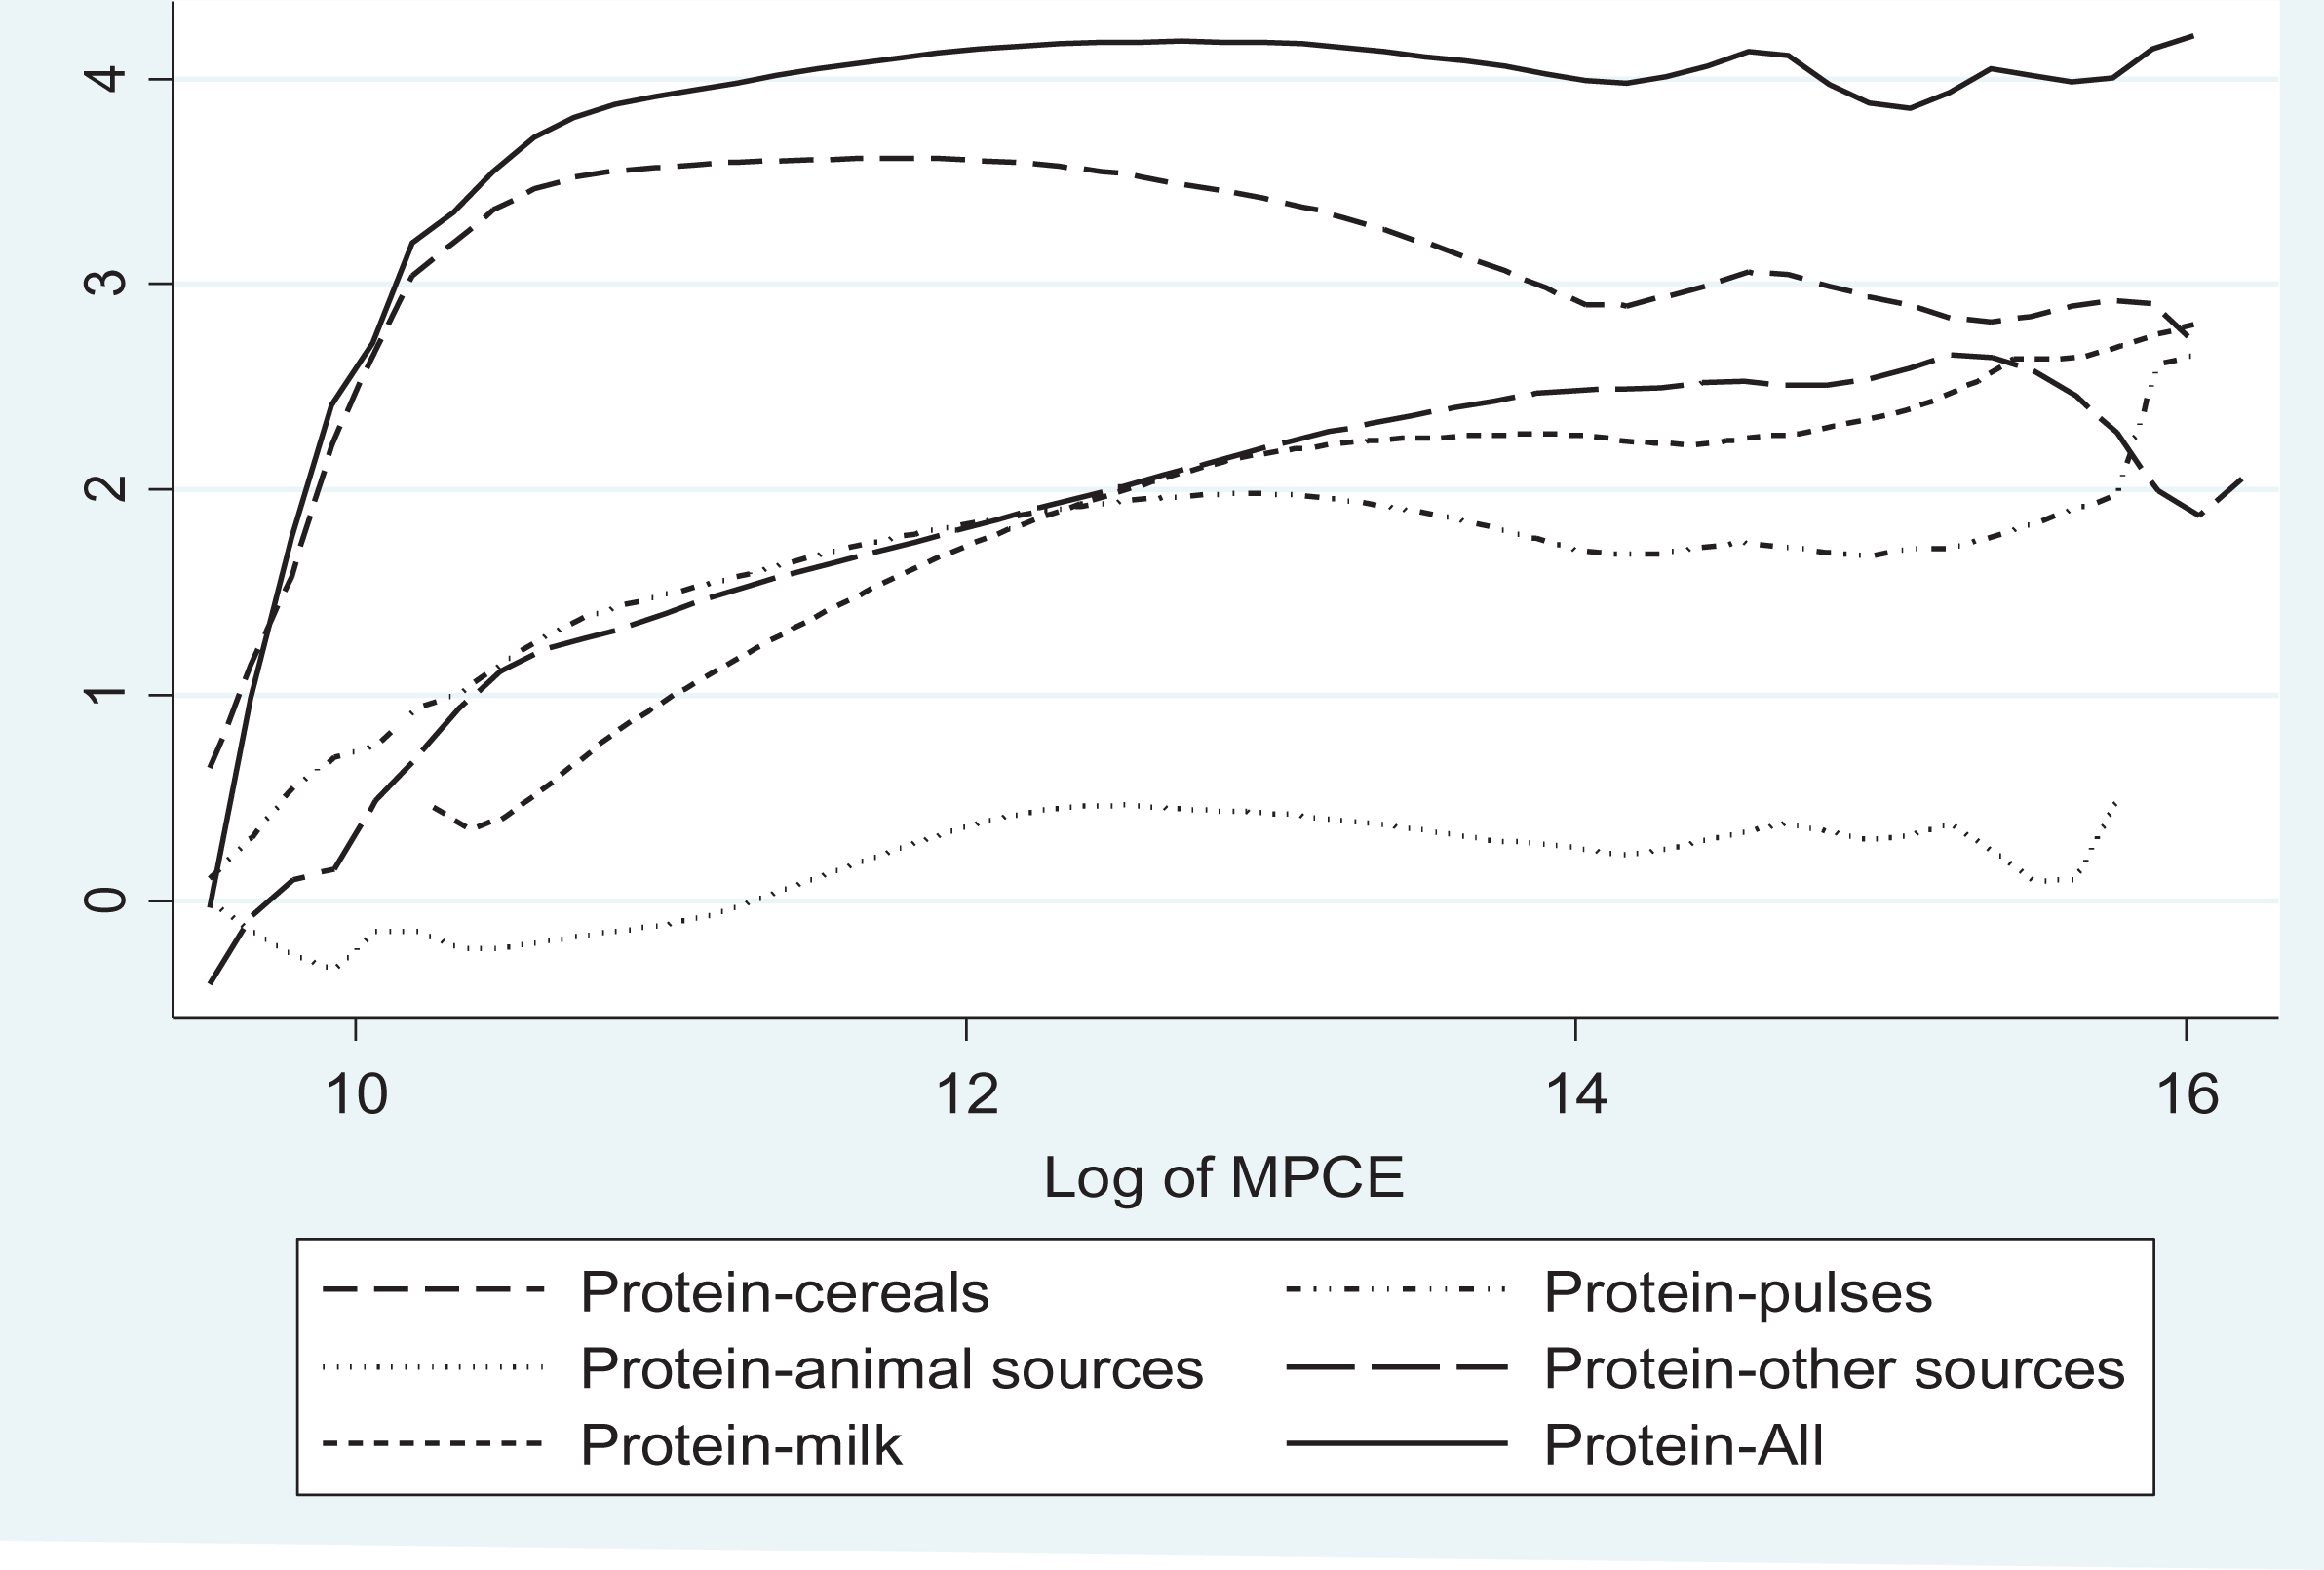
Log of protein consumption per consumer unit per month from different food groups.
On disaggregating the analysis according to sector, it is observed that the consumption of food groups is higher in the rural sector than in the urban. On analyzing protein consumption by social groups, similar patterns are observed at the all-India level (Figures 2 and 3).
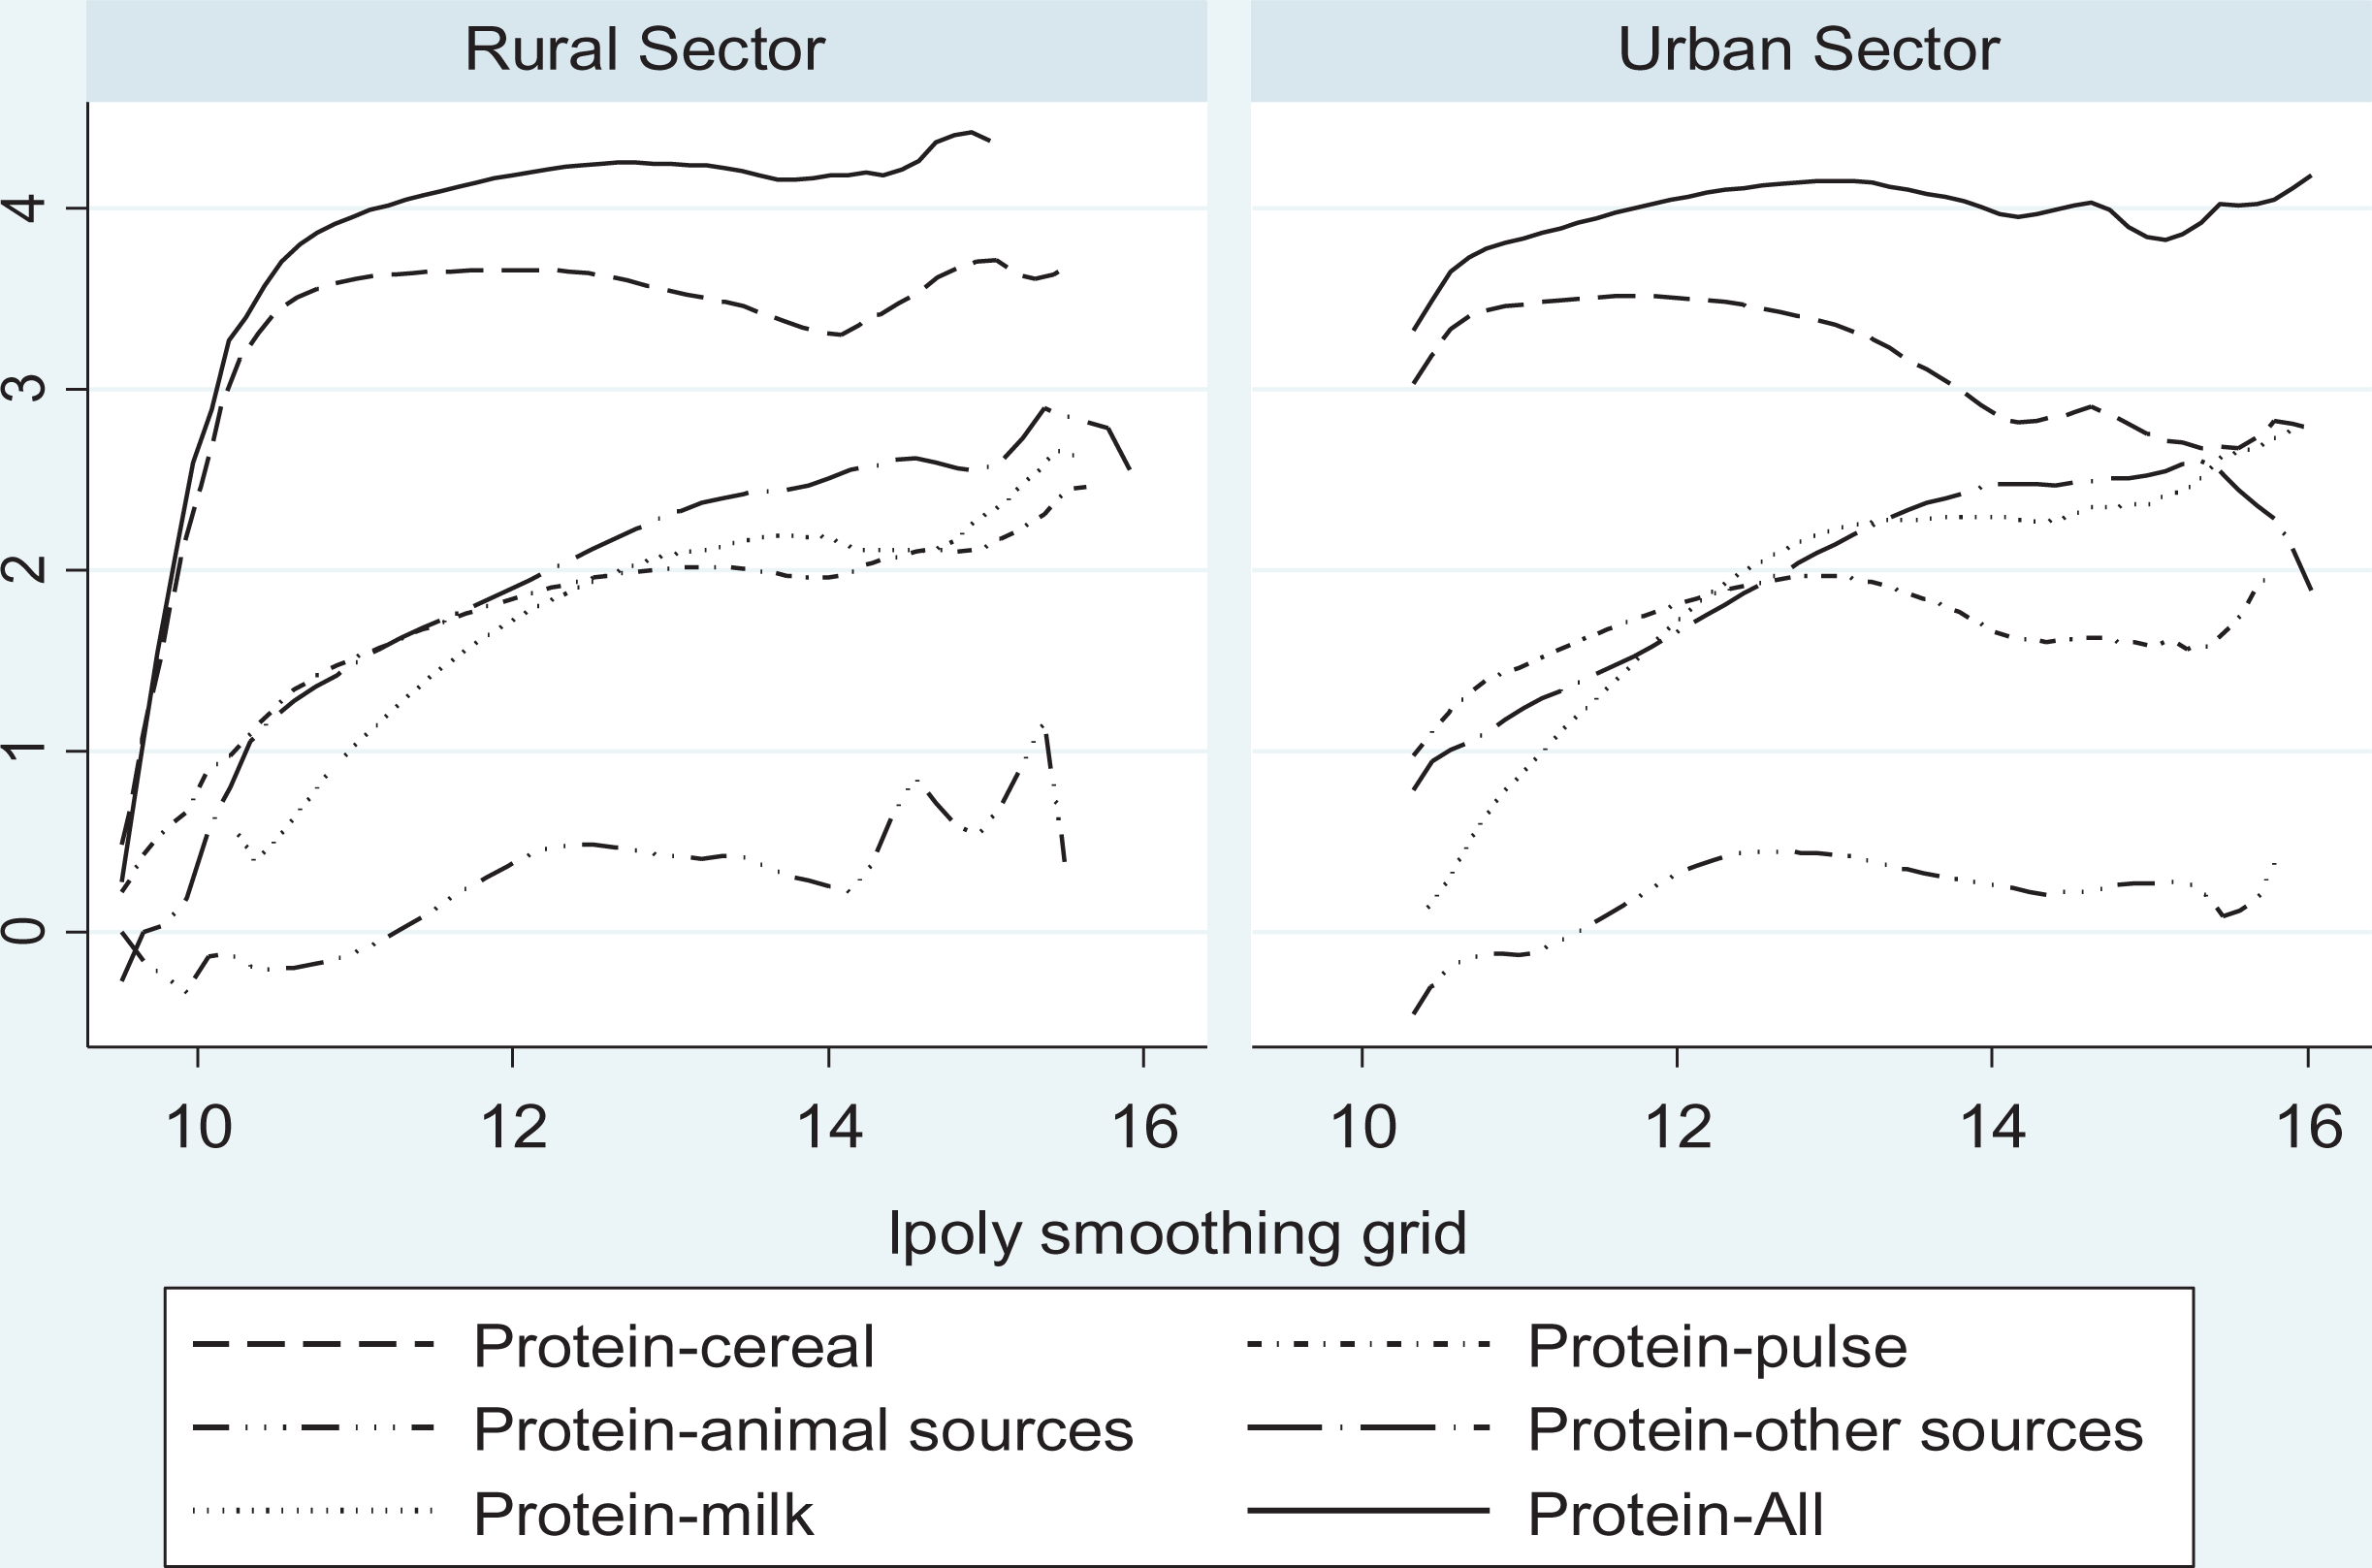
Log of protein consumption per consumer unit per month from different food groups, by sector.
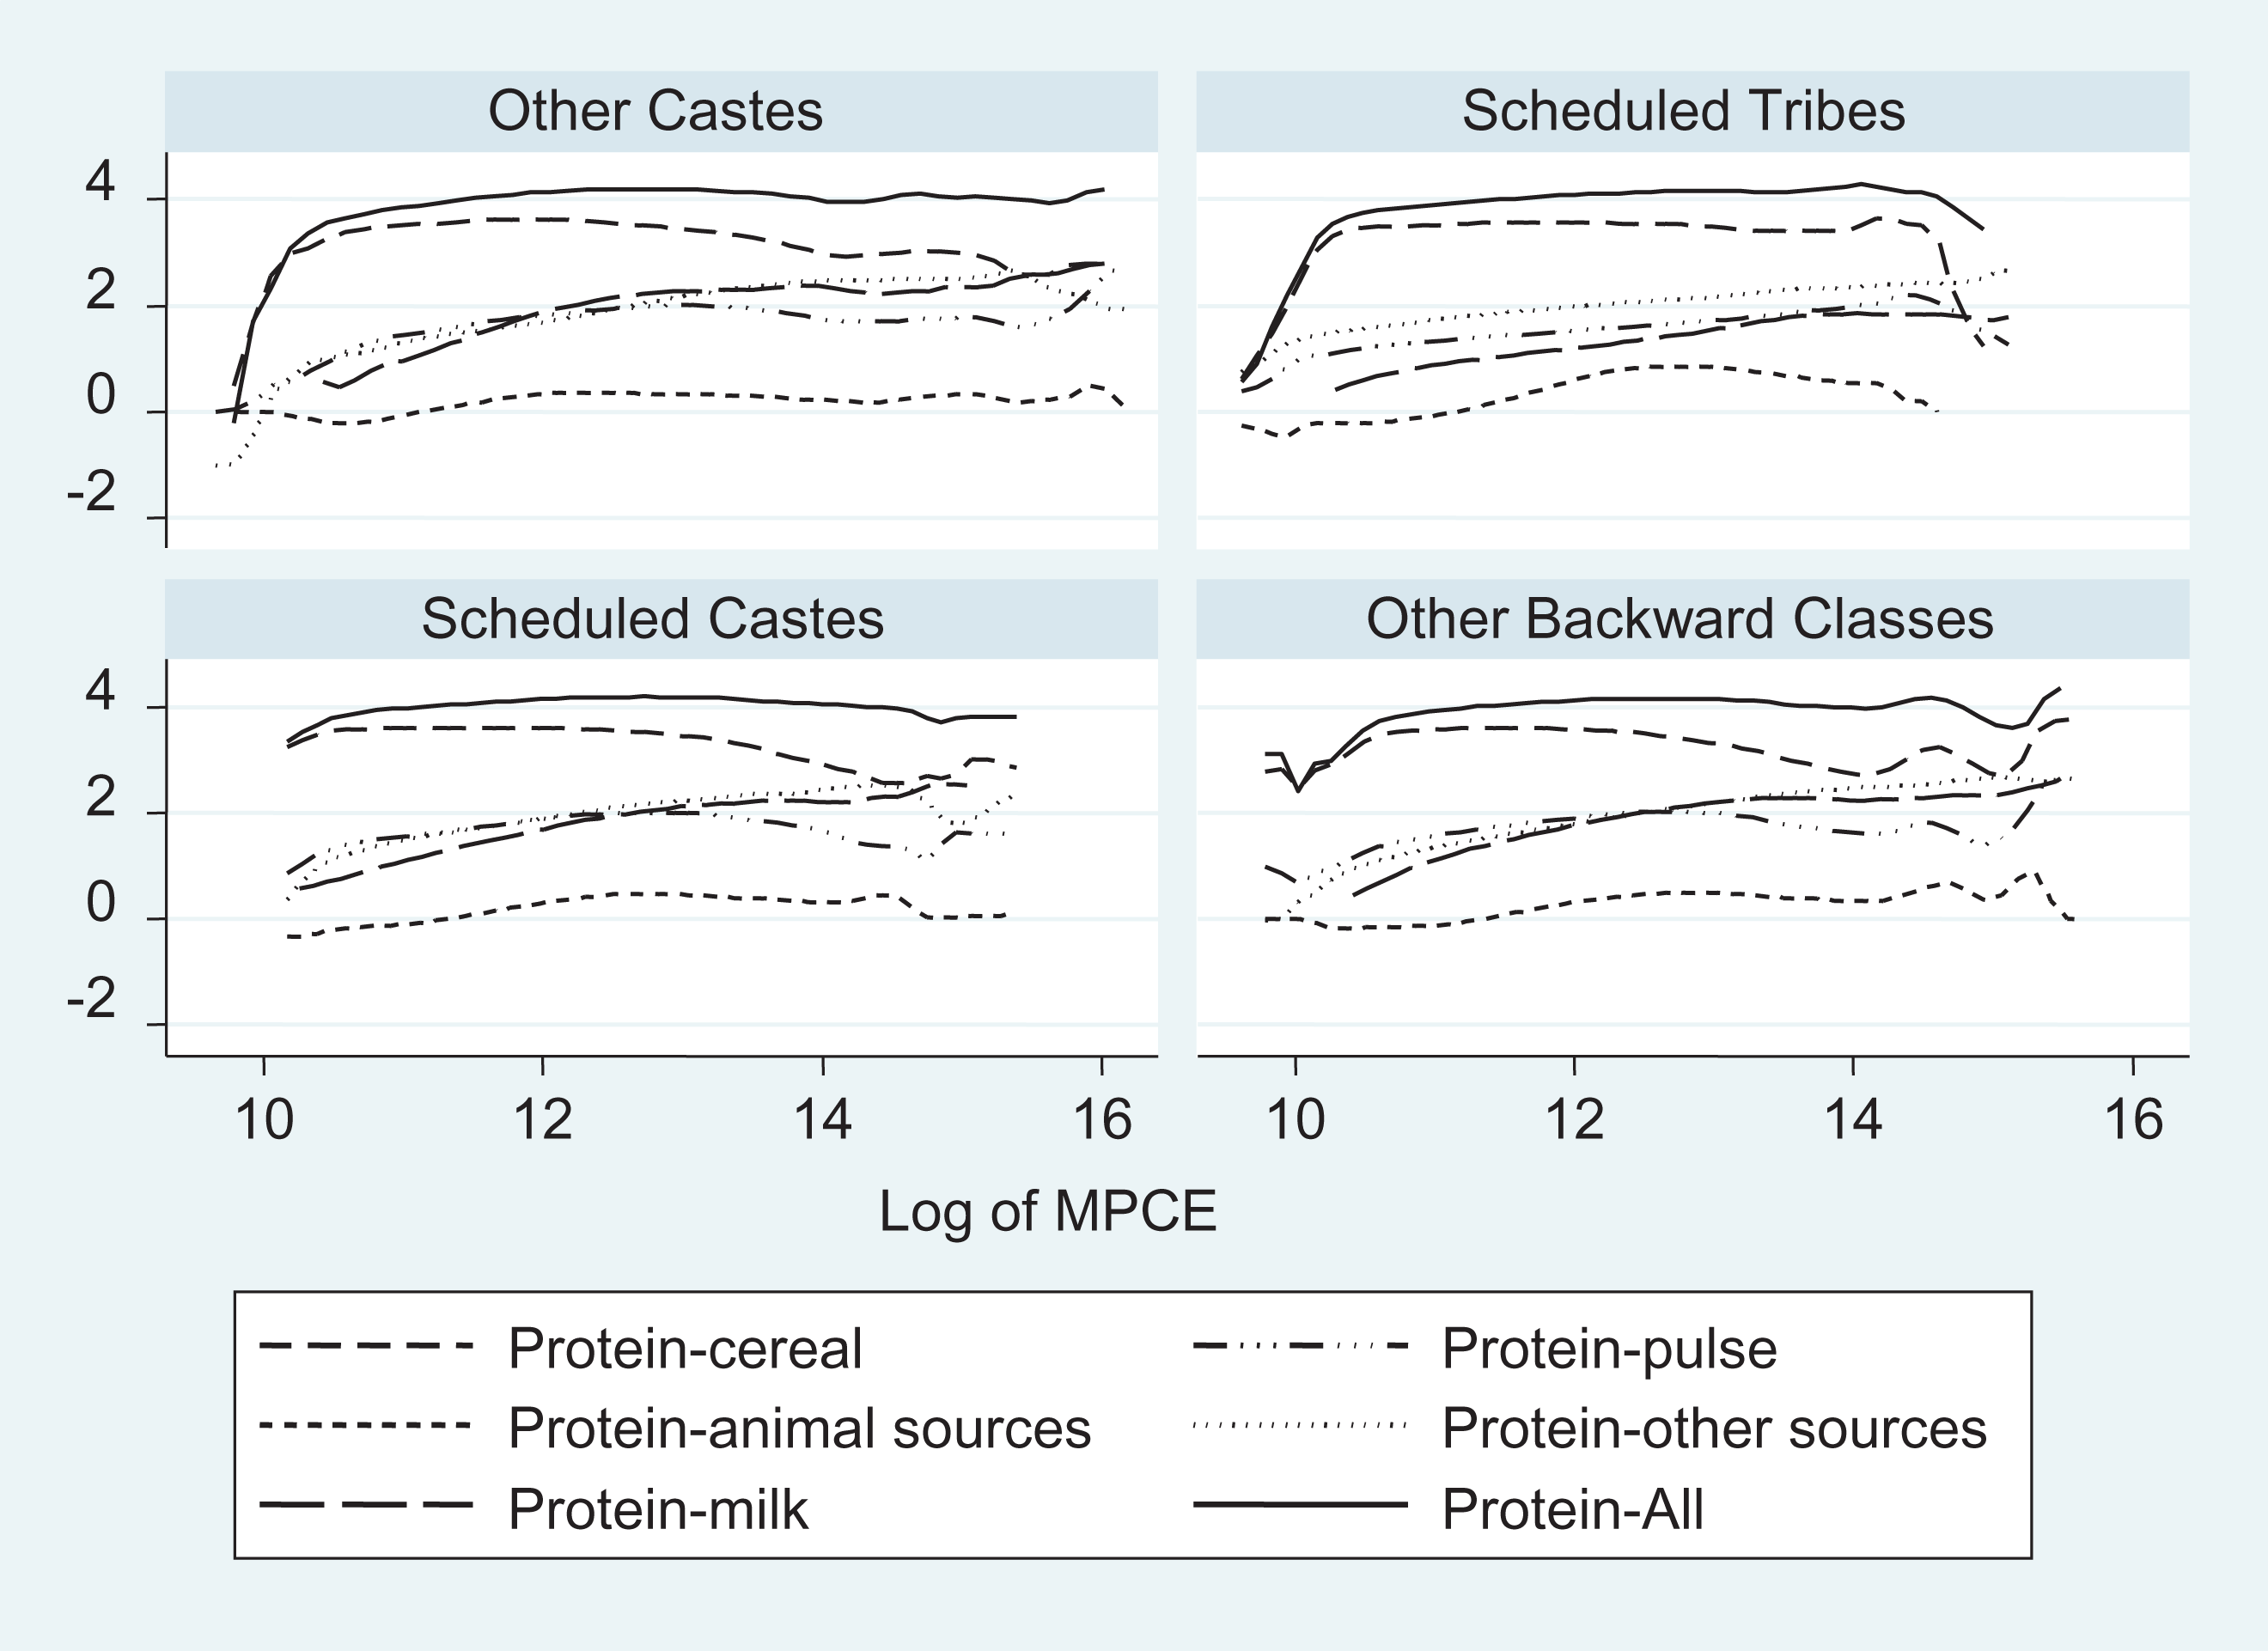
Log of protein consumption per consumer unit per month from different food groups, by social groups.
Data and Methodology
The objective is two fold. First, to examine the factors that affect protein consumption from plant and animal sources in the year 2011-2012 across social groups, sectors, wealth quantiles, and household occupations. Second, to identify factors that affect protein consumption from different sources of food.
For the first objective, following Gaiha et al, 30 there is one demand equation for protein consumed for major food groups:
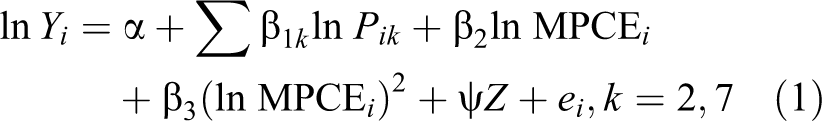
The dependent variable in Equation (1) is log of per consumer protein consumed by the ith household. The protein consumption in the household is adjusted for the household size and composition by using Gopalan et al’s equivalent scales 31 presented in Supplemental Table A1. Ln P ik is the vector of log of food prices computed from the NSS at the district level for 7 food groups, that is, k ranges from 1 to 7 (note 3). These include cereals, eggs, vegetables, milk, fish, chicken, and pulses. Since calculation of unit prices was done using household consumption data, commodities which were not consumed by a household would get an undefined unit price. Therefore, an average of the unit price for the district was used. Ln MPCEi is the log of MPCE for ith household. Z is the vector of household characteristics such as household size and ethnic group, which have a significant impact on consumption. Occupation has an impact through income. Education plays a major role in consumption as it helps identify nutritious food. Living environment is also important, that is, whether the individual resides in the urban or rural sector.
For the second objective, there are 5 equations which describe 5 protein consumption functions from 5 different sources, namely, cereals, pulses, milk and milk products, other animal sources (such as egg, fish, and meat), and other plant sources (such as fruits and vegetables). In general, cereal and pulses are the major sources of plant protein while eggs, milk, and meat are major sources of animal protein. Different equations contain different variables as the price of one particular food group might increase or decrease the demand for another. Therefore, the control is for own price and cross-price effects. The equations may look distinct individually but there is some kind of relationship that exists among them. Such equations can be used to examine the jointness of the distribution of disturbances. It seems reasonable to assume that the error terms associated with the equations may be contemporaneously correlated. The equations are apparently or SURE rather than independent relationships 32 :
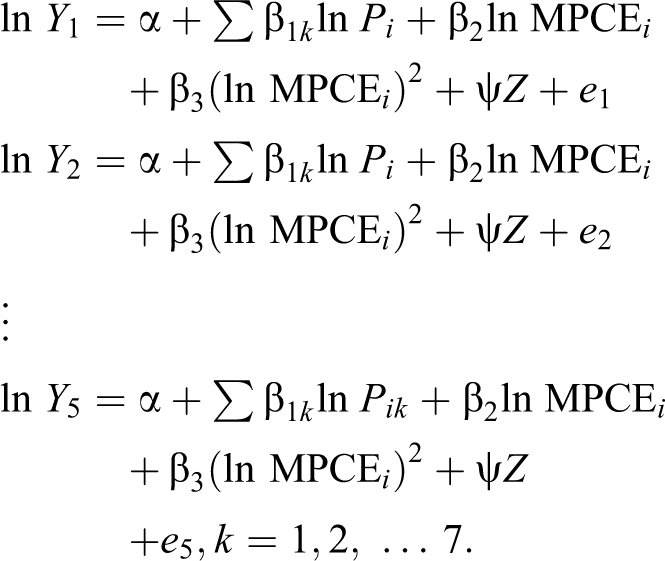
Here Y i is the dependent variable, that is, per consumer unit consumption of protein from 5 different sources—cereals, pulses, milk and milk products, animal sources, and other sources. P i is a k × 1 vector of prices, own price, and cross price for different food groups, namely, cereals, eggs, vegetables, milk, fish, chicken, and pulses. lnMPCEi is the log of MPCE. As before, Z is the vector which includes demographic factors.
Results and Discussion
Data Description
Fifty-nine percent of the sample data is from the rural sector while 41% belongs to the urban sector (Table 5). The majority of the households are headed by male members. The percentage of social groups in the sample is almost proportional to the all-India percentage. In the rural sector, more than 50% of the households are self-employed—28% in agriculture and 25% in nonagriculture. In the urban sector, 37% are self-employed while 39% are the salaried class. Almost a quarter of the population is nonliterate.
Descriptive Statistics.a
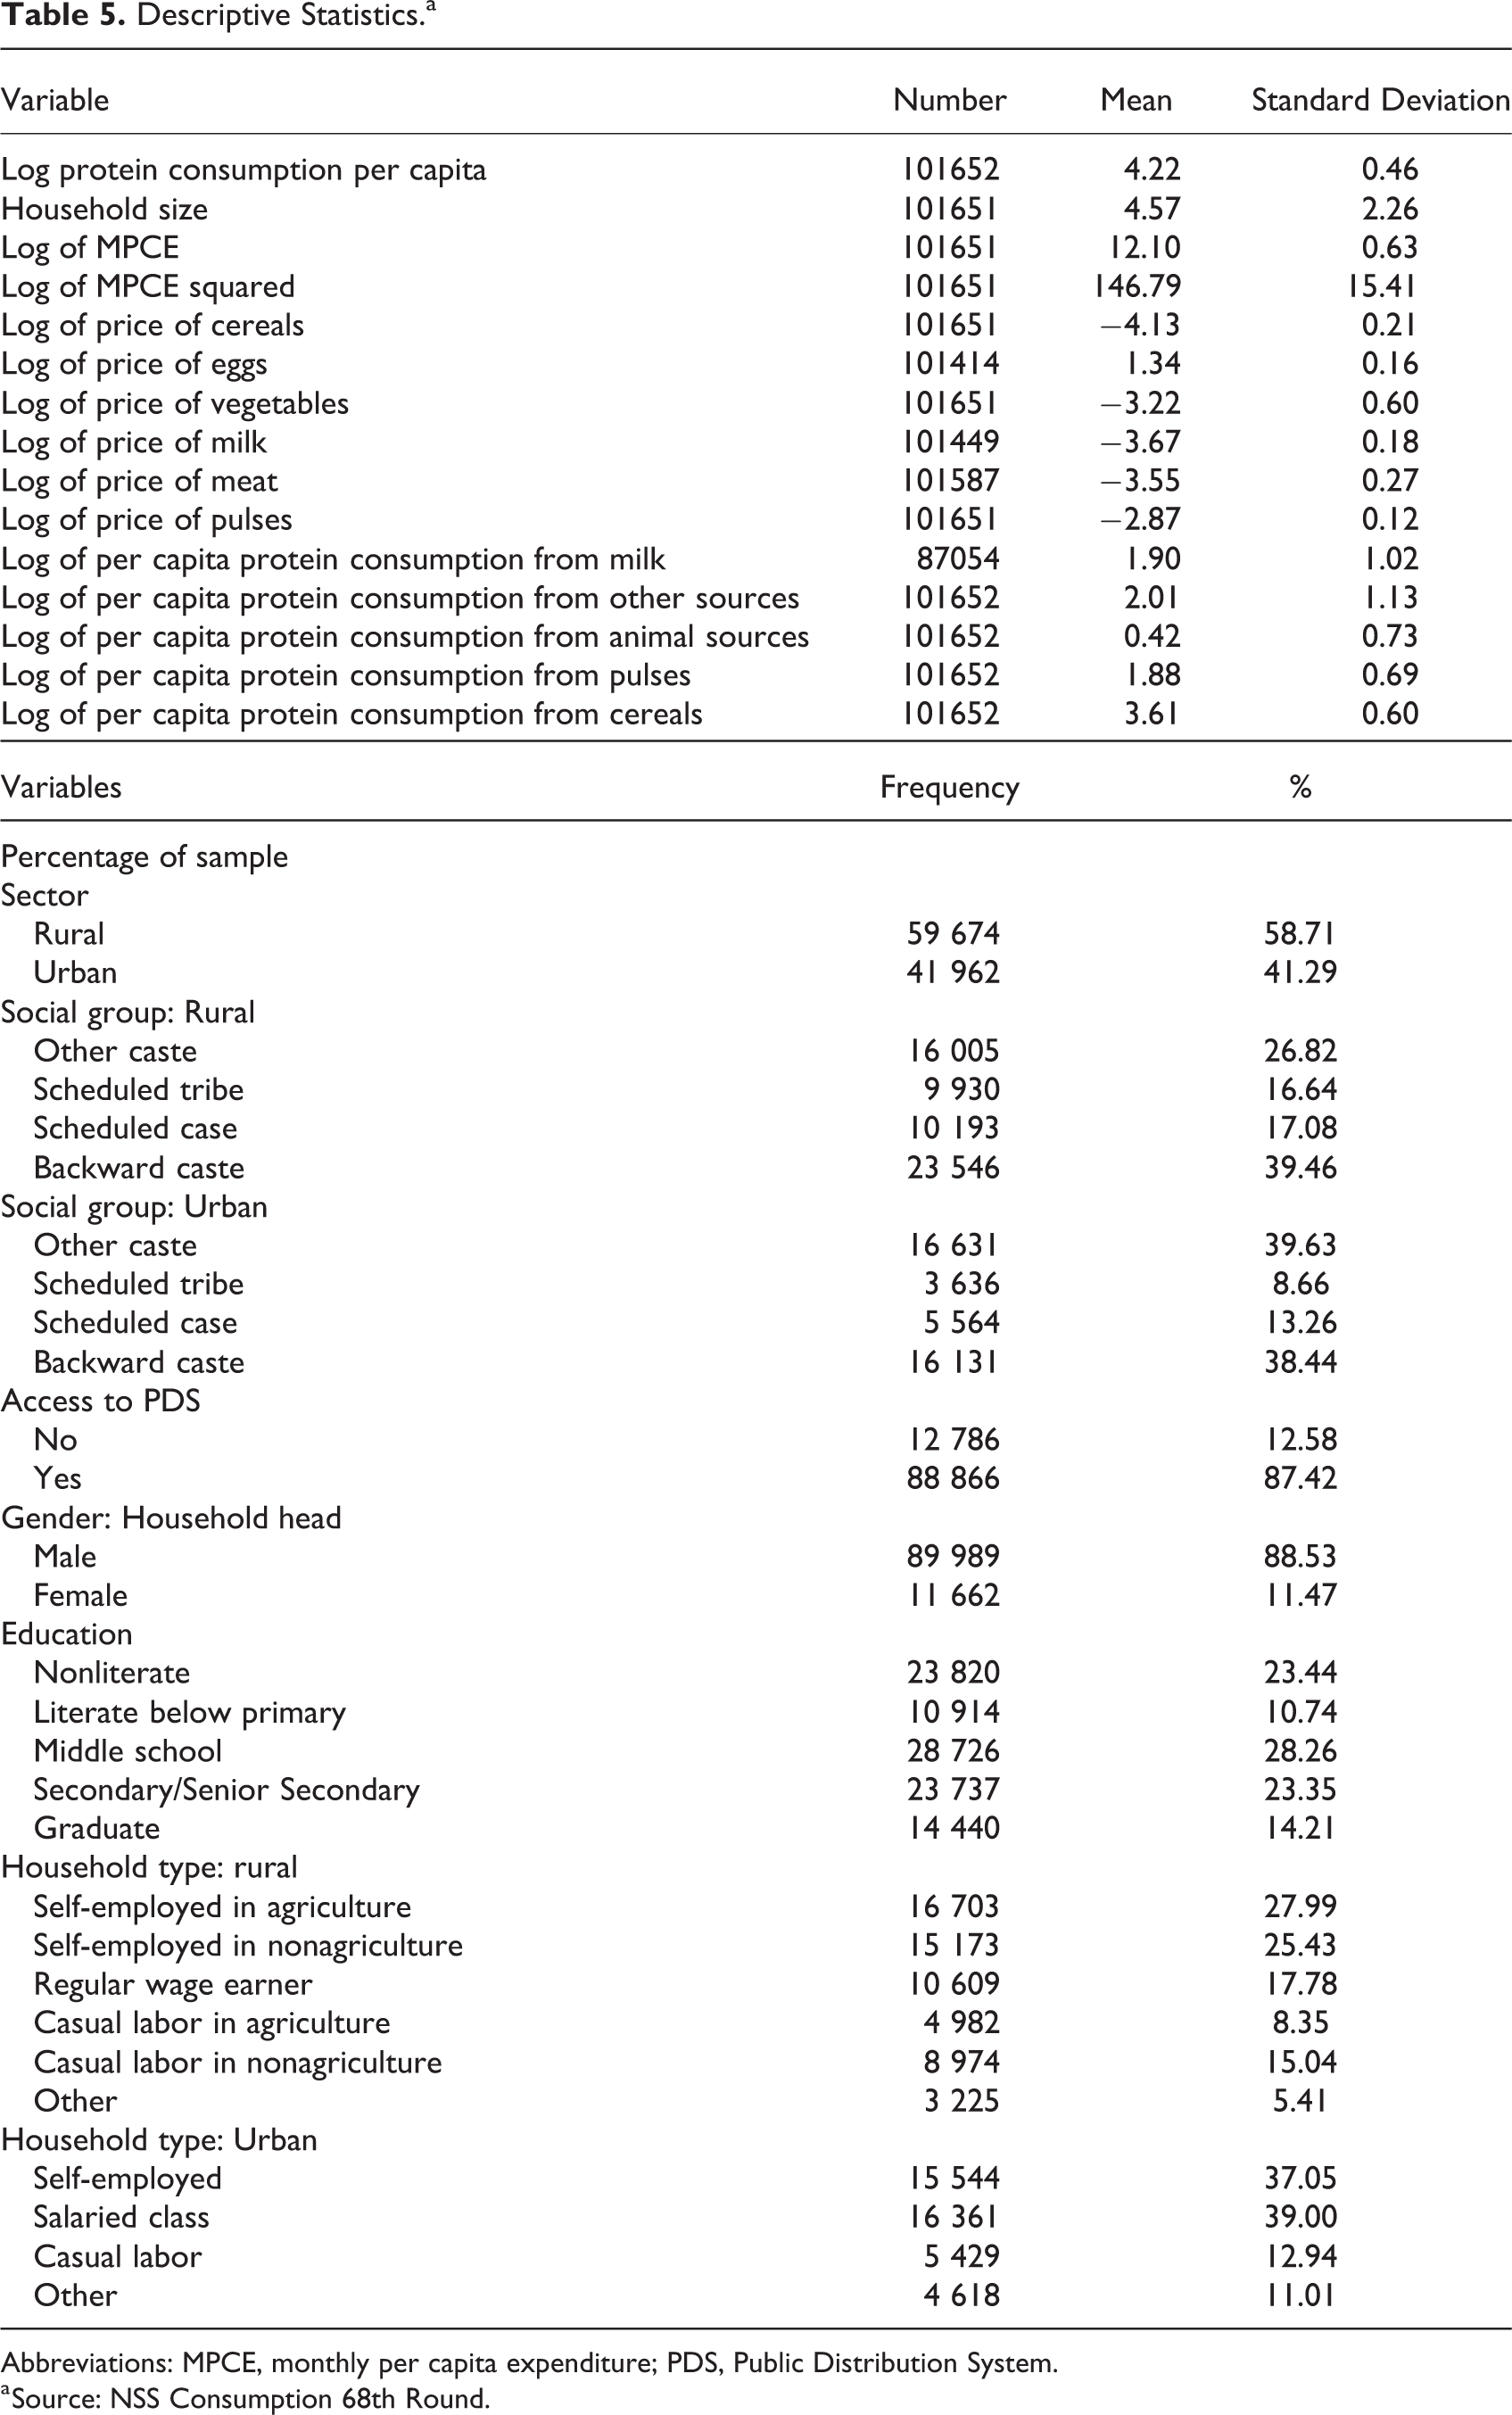
Abbreviations: MPCE, monthly per capita expenditure; PDS, Public Distribution System.
a Source: NSS Consumption 68th Round.
Discussion
Following Gaiha et al, it is observed that the consumption of protein is positively related to the MPCE. As MPCE (which is a proxy for income) increases, consumption of protein rises for both urban and rural sectors. The second order of MPCE is negative and significant, implying that expenditure will fall after a point in time. This is true of necessities such as food (Table 6). It is also clear that in the urban sector, protein consumption is a necessary good while in the rural sector, it is a luxury good as can be seen from the income elasticity of demand which is the coefficient of the log of MPCE.
Regression Results of Determinants of Consumption of Consumer Unit of Protein.a
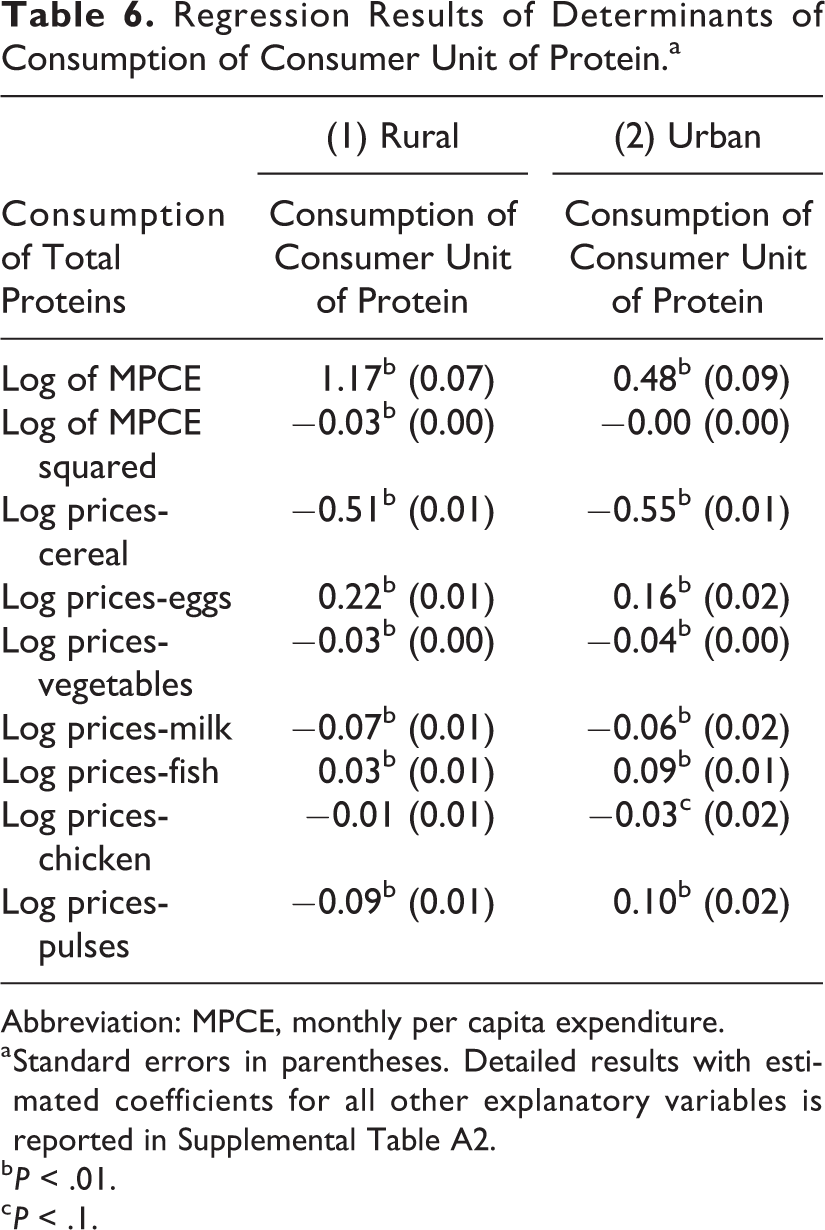
Abbreviation: MPCE, monthly per capita expenditure.
a Standard errors in parentheses. Detailed results with estimated coefficients for all other explanatory variables is reported in Supplemental Table A2.
b P < .01.
c P < .1.
Price effects capture both own and cross-price effects through substitutions between food commodities. The results confirm significant food price effects—negative for cereals, pulses, milk, and vegetables in the rural sector (Table 6). The expenditure on protein demand is positive and large. As prices of cereals, pulses, vegetables and milk increase, the consumption of protein shows a decline in the rural sector. In the urban sector, the prices of cereals, vegetables, milk, and chicken are negatively associated with protein consumption. However, the price of pulses, eggs, and fish is positively related to protein consumption. The positive relationship between some commodity prices and their quantities can possibly be attributed to switching to better quality pulses, eggs, and fish. The results are similar to Gaiha et al. As there are improvements in income, consumers tend to switch to consumption of better quality proteins than those available in cereals. There is also greater dietary diversification. 20,21,30
The SC in the urban and backward classes in the rural sector consume the least protein in all the social groups. In terms of household type, self-employed in agriculture in rural and self-employed in urban areas have a higher consumption of protein than all other types of households. Deaton and Dreze claim people do not buy nutrients but food commodities. However, if consumers are aware of the nutrient value of foods, demand for protein can be studied. 30,33
In the second part of the analysis, the attention is on the consumption of protein from 5 different sources: cereals, pulses, milk and milk products, other animal sources, and other plant sources in both the urban and rural sectors (Table 7). It is seen that overall protein consumption from all the 5 sources increases as income or MPCE increases that is, income elasticity of demand is positive. The second order MPCE is negative. This means that the goods are normal goods.
Regression Results of Determinants of Consumption of Consumer Unit of Protein From Cereals and Pulses for Rural and Urban India.a
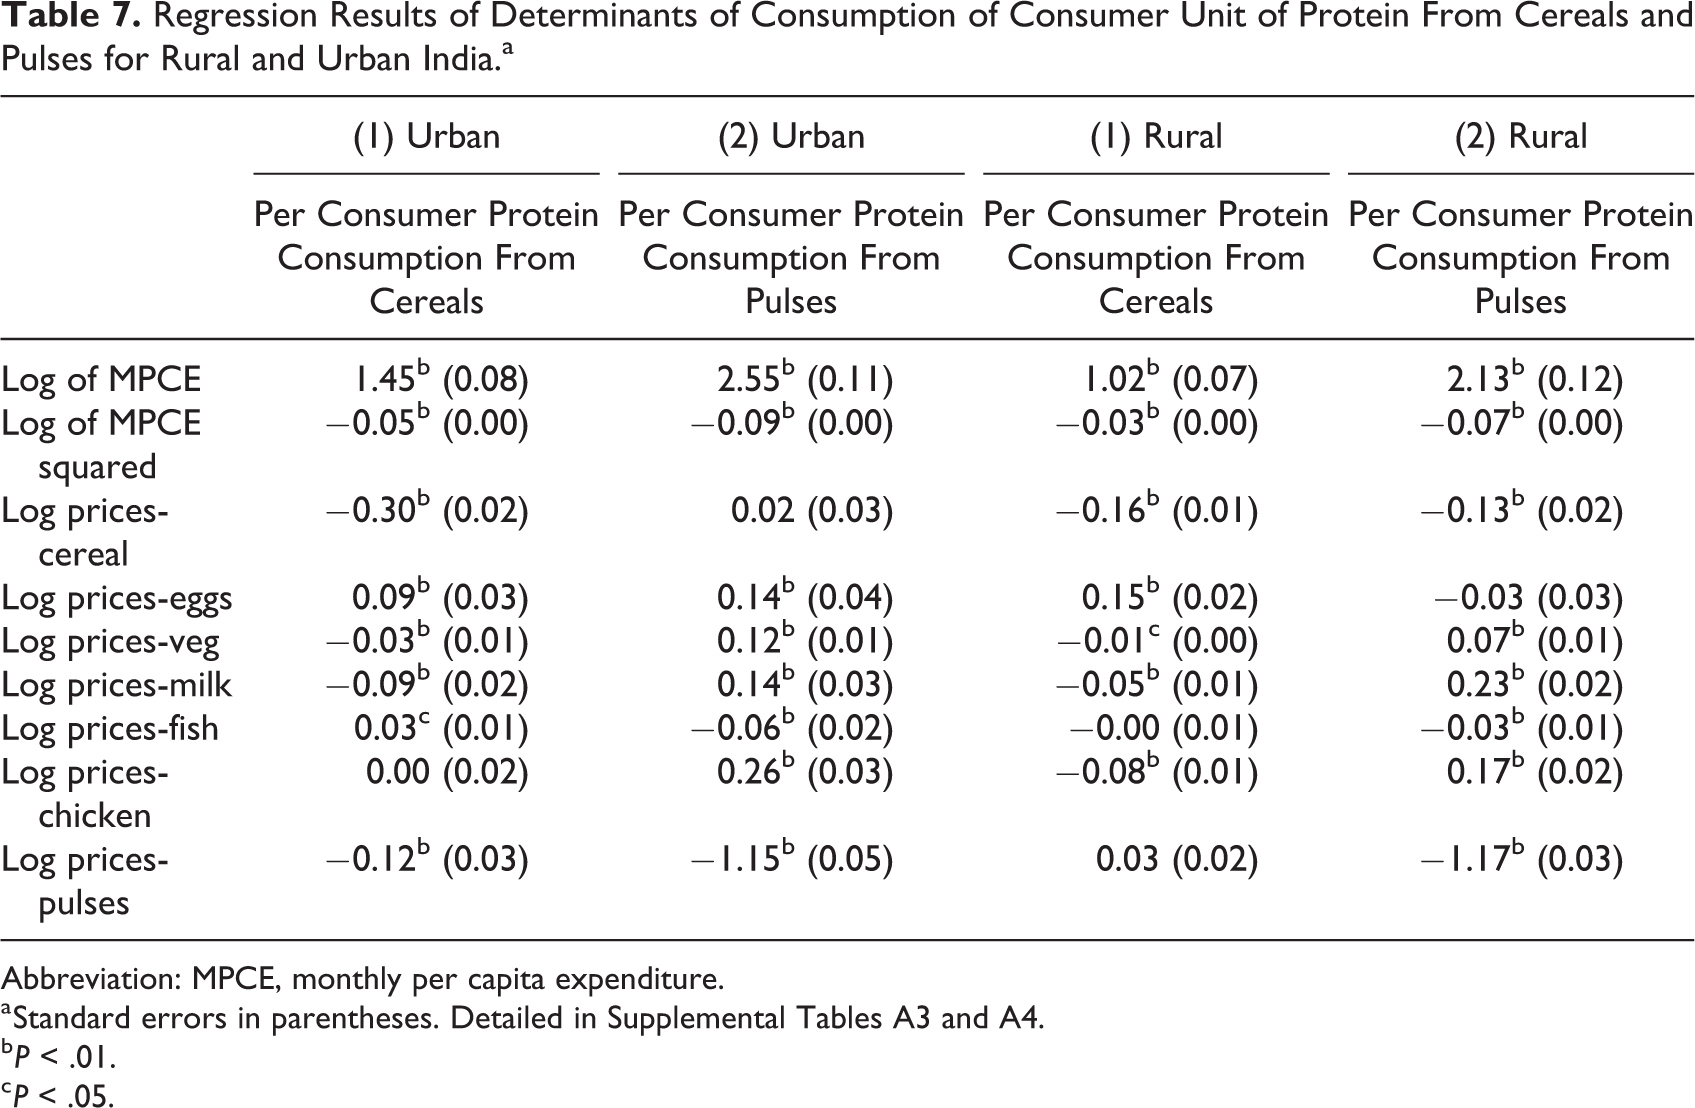
Abbreviation: MPCE, monthly per capita expenditure.
a Standard errors in parentheses. Detailed in Supplemental Tables A3 and A4.
b P < .01.
c P < .05.
In both the sectors, the consumption of protein from cereals decreases as price of cereals increases, in accordance with the demand theory. Consumption of protein from cereals increases as price of eggs increases, that is, the cross price elasticity of protein consumption from cereals and price of eggs is positive. Since the proteins from cereals are not of very good quality, as price of eggs decreases, consumers have a tendency to decrease their consumption of proteins from cereals.
Consumption of protein from pulses increases as price of pulses decreases. The consumption of protein from animal foods and milk and milk products is positively related to the price of pulses, that is, consumption of protein from pulses shows an increase as price of milk and milk products and price of chicken increases. This means that the consumers treat protein from pulses, protein from animal sources of protein, and milk as substitutes as the cross-price elasticity is positive (Table 7). As price of pulses increases, the sample shifts to consumption of protein from animal sources and milk and milk products. Egg prices are also positively related to consumption of protein from milk and milk products. As price of cereal decreases, an increase in the consumption of protein from pulses is observed.
As the MPCE increases, consumption of protein from various sources increases. The second order of MPCE is negative, suggesting that there is only a certain amount of income that is spent on food in the household budget.
On disaggregating the analysis sector-wise, it is seen that in the urban sector, ST, and backward castes consume more protein from cereals and consumption of protein from pulses is least for SC. Least quantities of animal protein and the most quantities of protein from milk and milk products are consumed by OC. In the rural sector, SC, ST, and backward castes consume higher quantities of protein from cereals. Other castes consume the highest quantities of protein from pulses, and milk and milk products. In both the sectors, households where the household head is more educated consume the highest quantities of protein from milk and milk products. Female-headed households in general show a higher consumption of protein.
In the urban sector, households which are self-employed consume the highest amount of protein from cereals. Households employed in other occupations consume more protein from pulses, milk, and milk products. In the rural sector, self-employed in agriculture consume the highest quantities of protein through cereals, pulses, and milk. Households that are self-employed in nonagriculture as well as regular wage earners consume the highest quantities of protein through animal and other sources. Households having access to PDS show a higher consumption of protein from cereals in both the rural and urban sectors.
State-wise, those who consume the highest amount of protein from cereals include Jammu and Kashmir, Rajasthan, Uttarakhand, Uttar Pradesh, Bihar, Madhya Pradesh, Jharkhand, and Nagaland. States that consume most protein from pulses are Himachal Pradesh, Uttarakhand, Uttar Pradesh, Madhya Pradesh, Andhra Pradesh, Karnataka, and Tamil Nadu. Interestingly, 4 of these states provide pulses in the PDS. These are Himachal Pradesh, Andhra Pradesh, Tamil Nadu, and quite recently, Karnataka. Punjab, Haryana, and Jammu and Kashmir have the highest consumption of protein from milk and milk products. States that consume the highest quantity of protein from animal sources include Himachal Pradesh, Uttarakhand, Uttar Pradesh, Sikkim, Assam, West Bengal, Jharkhand, Kerala, and Tamil Nadu.
Conclusions
Between 1993-1994 and 2011-2012, the consumption of pulses per consumer unit including red gram, green gram, lentils, and black gram has fallen, while the per capita consumption of split Bengal gram shows an increase. However on the whole, there is an increase in the quantity of pulses and pulses products consumed over the same period. This can be largely attributed to increased consumption of processed pulse products such as besan, sattu, and others. This confirms that consumers have diversified their consumption to include processed food due to globalization, improved transportation, and changing consumer tastes and preferences.
On looking at protein consumption, it is found that the expenditure on protein is large and significant. As income increases, consumption of protein increases for both urban and rural sectors. Higher disposable incomes have led to higher demand of animal sources of protein. There are significant food price effects in the analysis. As pointed out in the earlier discussion, with decrease in the price of cereal, an increase in the consumption of protein from pulses is observed. The consumption of protein from animal foods and milk and milk products is positively related to the price of pulses. As price of pulses increases, the sample shifts to consumption of protein from animal sources and milk and milk products. This is a consistent change associated with economic growth.
However, even till 2011-2012, all the states were not meeting the minimum requirement of 56 g of pulses per day. The consumption is higher in the states which distribute pulses in the PDS. It is also observed that most pulses cannot be substituted in the diet as state-wise tastes and preferences are very important determinants of pulses crops and their inclusion in the diet. For instance, urad is more popular in the southern states and Bengal gram in the northern states.
Diets in India are predominantly cereal-based, and cereals are the most important source of protein in Indian diets. Cereals are also distributed in the PDS in all states. It is important to increase the quality of diets in India and specifically protein intake in rural India. Pulses are often referred to as “poor man’s meat” and, together with millets, as “orphan crops.” This mindset needs to be changed. Inclusion of pulses to form a balanced diet is crucial. The quality of proteins from pulses and those from cereals is very different. The consumption of all pulses and even less popular pulses such as moth bean and cow pea should be promoted and encouraged. This is important in a country which has a large vegetarian population. Pulses are a nutrient-dense crop, and their inclusion in the diet is important to tackle protein-energy malnutrition, especially for vegetarians. Pulses, along with cereals, meet a large part of the protein requirement of an individual. However, the protein derived from pulses is more nutritious and different from the protein in cereals. It is vital that awareness about the benefits and nutritive value of pulses be made known to the masses.
Supplemental Material
Supplementary_material - An Analysis of Protein Consumption in India Through Plant and Animal Sources
Supplementary_material for An Analysis of Protein Consumption in India Through Plant and Animal Sources by Priya Rampal in Food and Nutrition Bulletin
Footnotes
Authors’ Note
This study is part of the ongoing research program on Leveraging Agriculture for Nutrition in South Asia (LANSA) funded by UKaid from the Department for International Development, United Kingdom. The views expressed do not necessarily reflect the United Kingdom government’s official policies. LANSA is finding out how agriculture and agri-food systems can be better designed to advance nutrition. LANSA is focused on policies, interventions, and strategies that can improve the nutritional status of women and children in South Asia. For more information see ![]() . I would like to thank Dr R. V. Bhavani, Dr Brinda Vishwanathan, Dr Madhura Swaminathan and the LANSA team for their valuable feedback. An earlier version of the article was presented at the TASS-IFPRI Conference in May 2017 at Delhi and a poster at the Agriculture, Nutrition and Health (ANH) Academy in Kathmandu, Nepal. I am thankful to the participants for their useful comments and suggestions.
. I would like to thank Dr R. V. Bhavani, Dr Brinda Vishwanathan, Dr Madhura Swaminathan and the LANSA team for their valuable feedback. An earlier version of the article was presented at the TASS-IFPRI Conference in May 2017 at Delhi and a poster at the Agriculture, Nutrition and Health (ANH) Academy in Kathmandu, Nepal. I am thankful to the participants for their useful comments and suggestions.
Declaration of Conflicting Interests
The author(s) declared no potential conflicts of interest with respect to the research, authorship, and/or publication of this article.
Funding
The author(s) disclosed receipt of the following financial support for the research, authorship, and/or publication of this article: This study is part of the ongoing research program on Leveraging Agriculture for Nutrition in South Asia (LANSA) funded by UKaid from the Department for International Development, United Kingdom.
Supplemental Material
Supplemental material for this article is available online.
Notes
References
Supplementary Material
Please find the following supplemental material available below.
For Open Access articles published under a Creative Commons License, all supplemental material carries the same license as the article it is associated with.
For non-Open Access articles published, all supplemental material carries a non-exclusive license, and permission requests for re-use of supplemental material or any part of supplemental material shall be sent directly to the copyright owner as specified in the copyright notice associated with the article.