
Abstract
Background:
There are few effectiveness evaluations of food fortification programs, and little is known about what makes programs successful.
Objective:
We examined 3 food fortification programs in Latin America to identify common features that might explain their success and to draw lessons for program design and implementation everywhere: The vitamin A fortification of sugar in Guatemala with impact on vitamin A status of the population, the fortification of a basket of foods with iron and other micronutrients in Costa Rica with impact on iron status and anemia in women and children, and the fortification of wheat flour with folic acid in Chile, which reduced the incidence of neural tube defects.
Methods:
We identified pertinent literature about these preselected programs and asked regional experts for any additional information. We also conducted structured interviews of key informants to provide historical and contextual information.
Results:
Institutional research capacity and champions of fortification are features of successful programs in Latin America. We also found that private/public partnerships (industry, government, academia, and civil society) might be key for sustainability. To achieve impact, program managers need to use fortification vehicles that are consumed by the nutritionally vulnerable and to add bioavailable fortificants at adequate content levels in order to fill dietary gaps and reduce micronutrient deficiencies. Adequate monitoring and quality control are essential.
Conclusions:
For future programs, we recommend that the evaluation be specified up-front, including a baseline/end line and data collection along the program impact pathway to inform needed improvements and to strengthen causal inferences.
Introduction
Food fortification programs are aimed at reducing micronutrient deficiencies in populations and are deemed to have among the highest benefit–cost ratios among nutrition interventions, 1 but according to a regional expert, this is only the case if fortified foods are produced by centralized and relatively well-developed industries (personal communication, Omar Dary). Among the foods that are fortified with micronutrients are staples (eg, cereal flours and grains such as rice), condiments, and processed commercial foods. 2 Latin America has had a long history of fortification of cereal flours and salt dating back to the 1950s and is the region of the developing world, where people have the best access to fortified staples; for example, virtually all countries have legislation to fortify wheat flour, maize flour, and/or rice (Figure 1). 3
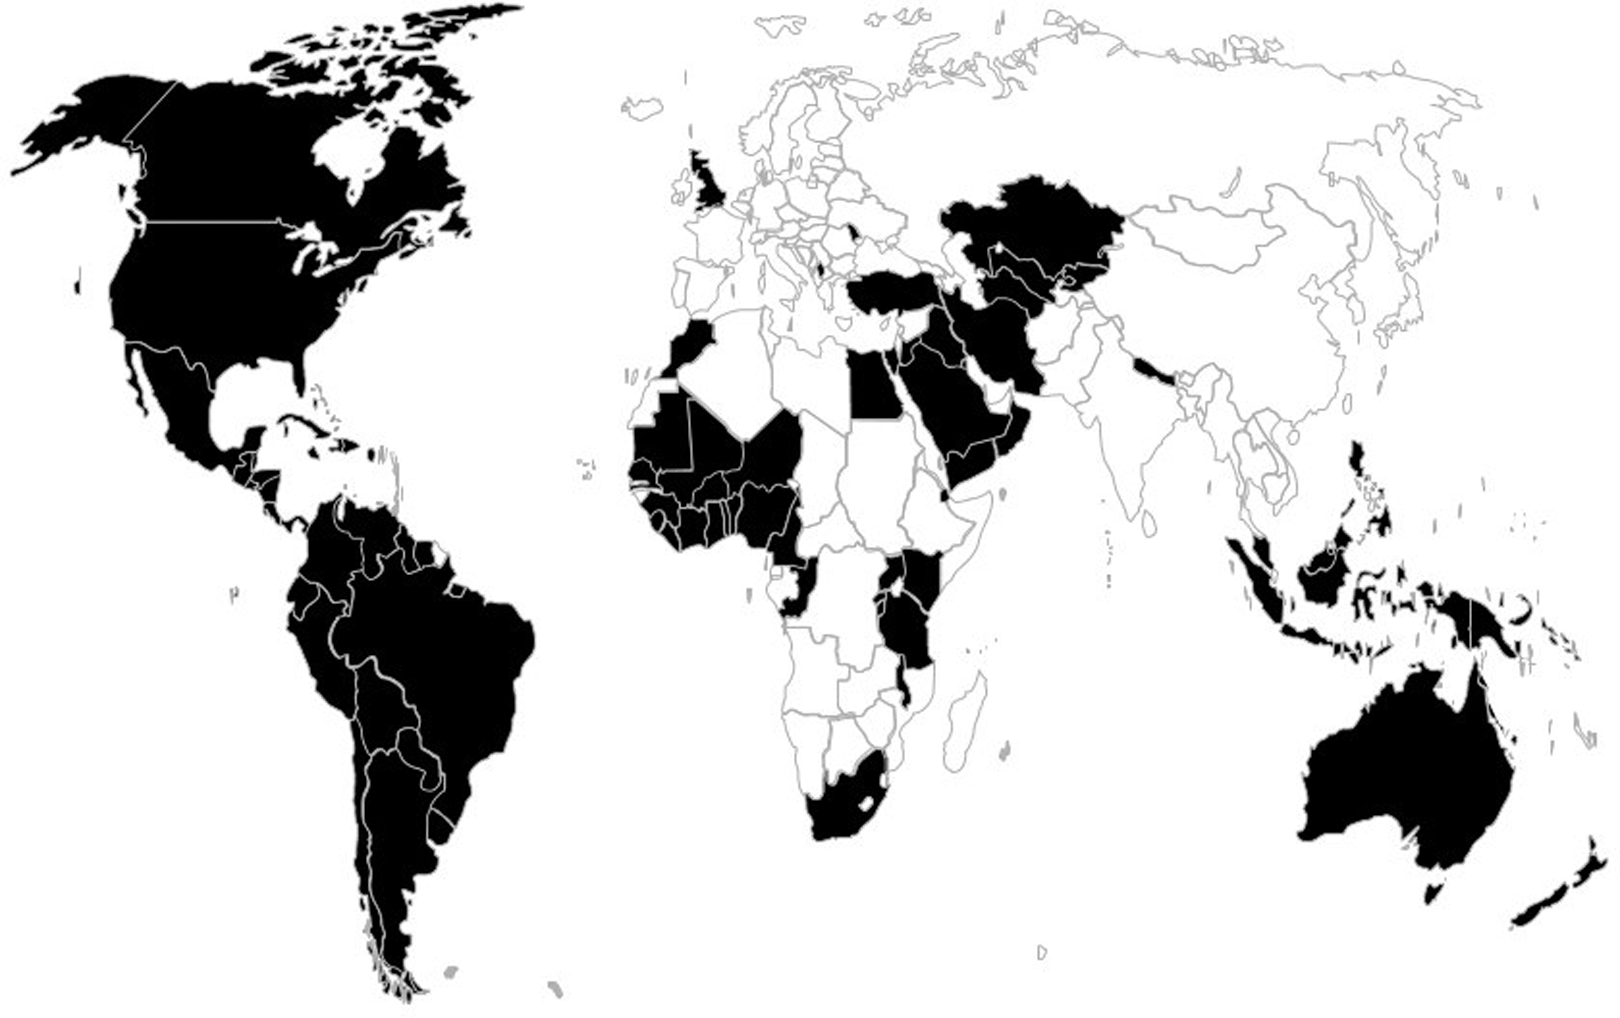
Legislation for fortification of cereal flours and rice.+84 countries require fortification of wheat flour, maize flour, and/or rice. Adapted from Food Fortification Initiative.3 To request data, e-mail
There are many reasons why the Latin American context favors food fortification compared to poorer countries in Asia and Africa. The region has high levels of urbanization, literacy, and purchasing power as well as a centralized food industry and wide consumption of commercial foods, permitting many choices for food fortification. By contrast, countries in sub-Saharan Africa and South Asia are poorer and more rural, with lower consumption of commercial foods and many small producers of staples such as wheat or maize flours. Latin America is also favored by having a strong history of collaboration among public, private, and civil society sectors and willingness to address nutritional problems. The region also has strong technical expertise in industry and certain academic research institutions that can be applied to developing fortified products and designing and implementing programs. The public sector, on the other hand, varies widely in technical capacity and resources to monitor and evaluate programs. The region has substantial regional trade and many multinational corporations, factors that push for uniformity in standards and regulations for fortification.
Despite the existence of many food fortification programs in Latin America, the evidence that they are effective in reducing micronutrient deficiencies is limited. A few evaluations exist; the results are mixed but generally suggestive of impact on micronutrient deficiencies. 4 –7 In some cases, bioavailable fortificants, particularly in the case of iron, were not used, and not enough of the “nutrient gap” may have been closed because of low consumption of the fortified product and/or low fortification content. 8 Poor quality control, enforcement, and monitoring systems may also have caused poor program implementation and lack of impact. Nevertheless, some programs may be actually effective, but impact evaluations are yet to be carried out.
The objective of this article is to examine successful programs in Latin America in an effort to identify the features that explain success and to draw lessons for fortification programs in the region and elsewhere. We defined success as having evidence of impact on micronutrient deficiencies. From our knowledge of the region, we preselected 3 programs, all using mass, mandatory fortification, for which impact evaluations had been conducted: the vitamin A fortification of sugar in Guatemala with impact on vitamin A status of the population, 9 the fortification of a basket of foods with iron and other micronutrients in Costa Rica with impact on iron status and anemia in women and children, 10 and the fortification of wheat flour with folic acid in Chile, which was shown to reduce the incidence of neural tube defects (NTDs). 11
Methods
We conducted a literature search of food fortification studies in Latin America and used a program impact model to guide the kinds of monitoring and evaluation information we abstracted from the studies (Figure 2). We examined PubMed, Google Scholar, the Latin-American and Caribbean Center on Health Sciences Information (LILACS), Nutrient, and Scielo to identify research articles by combining the terms “fortification,” “wheat,” “maize,” “salt,” “sugar,” “vitamin A,” “iron,” “iodine,” “zinc,” as well as other micronutrients, if available, and the name of each country in Latin America. Studies were not excluded based on language. We also searched Google for relevant reports that might contain information not included in previous searches. Finally, we checked the cited reports in reviews of the literature 4 –7 and contacted known experts in micronutrients in the region via e-mail to ask about fortification programs and related articles and reports. Through these steps, we identified relevant published and gray literature about the selected studies.
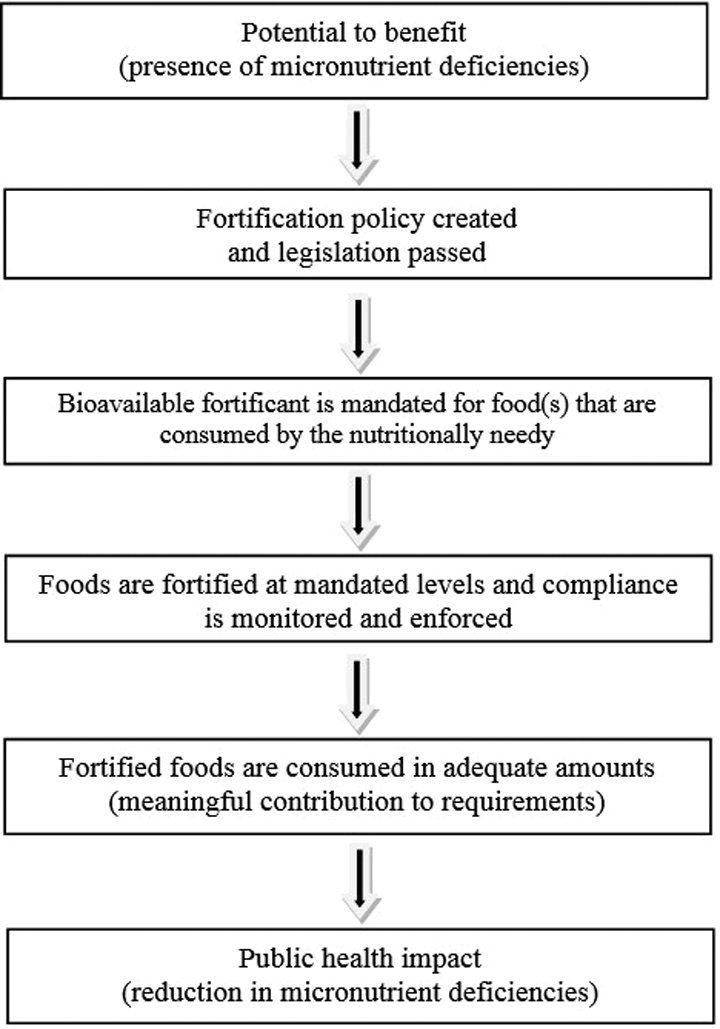
Program impact pathway for mass fortification programs (adapted from Martorell et al 10 ).
We identified key informants who participated or had participated in the process of implementation of fortification programs in Latin America; some informants were associated with the case studies in Chile (Drs Eva Hertrampf, Manuel Olivares and Fernando Pizarro), Costa Rica (Dr Luis Tacsan and Melanie Ascensio), and Guatemala (Dr Juan Aguilar), but we also included regional experts with wide knowledge of programs in Latin America (Drs Omar Dary, Jose Obdulio Mora, Rafael Flores, and Helena Pachón had wide knowledge about programs and Mr Scott Montgomery, specifically about industry). Table 1 lists the informants and their affiliations. An interview guideline was developed for experts knowledgeable about the selected programs that focused on the history of the food fortification programs in the country, coordination mechanisms, regulatory monitoring systems as they related to fortification, factors that contributed to the success of the program, the challenges that the programs faced, and results about process and impact evaluations conducted as well as current status of the programs. Face-to-face interviews were conducted by the authors with key informants in Guatemala, Chile, Costa Rica, Atlanta, and Washington DC. Interview notes were taken in all cases, and the conversations were also recorded where feasible. All interviews but one were conducted in Spanish. The interview guideline was used in summarizing the main points of the interview and in comparing the responses of the country program experts. For regional experts, the interviews were less structured, but we still used the interview guidelines in analyzing the responses; as expected, not all categories were touched upon by the regional responses. Key informants to whom we attributed information or direct quotes reviewed a draft of the article and provided written consent; this is acknowledged in the text for each person and cited as personal communication. In some cases, free-flowing conversations with more than 1 informant were combined when there was agreement in their statements and attribution to a single person was difficult.
Key Informants Involved With the Country Programs and Latin America Regional Experts in Fortifications.
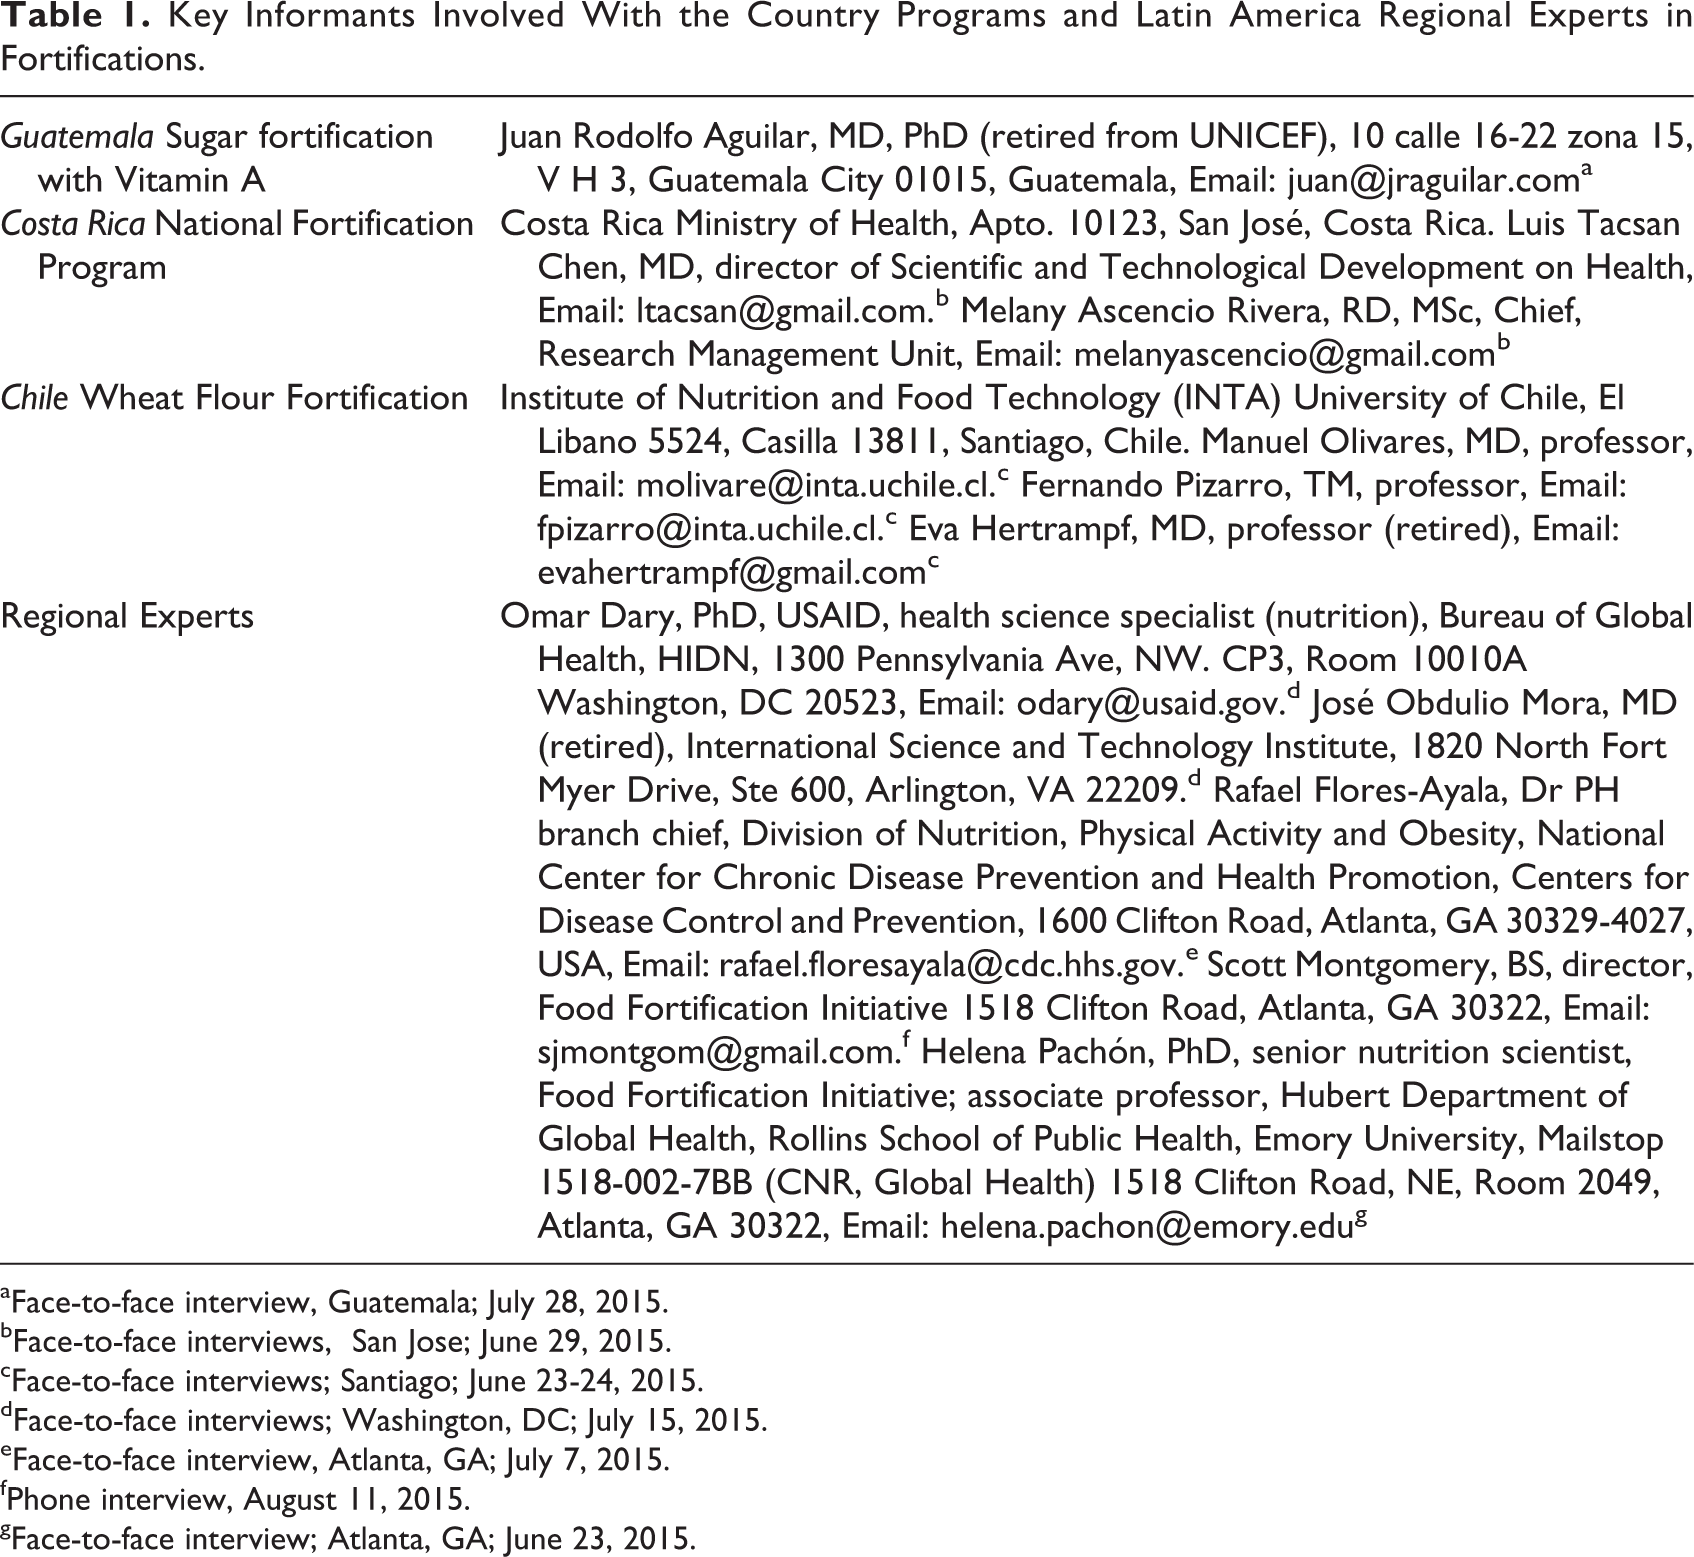
aFace-to-face interview, Guatemala; July 28, 2015. bFace-to-face interviews, San Jose; June 29, 2015. cFace-to-face interviews; Santiago; June 23-24, 2015. dFace-to-face interviews; Washington, DC; July 15, 2015. eFace-to-face interview, Atlanta, GA; July 7, 2015. fPhone interview, August 11, 2015. gFace-to-face interview; Atlanta, GA; June 23, 2015.
Results
The Latin American Context
In the introduction, we highlighted some of the factors that favor food fortification in Latin America; of these, the most critical is the highly centralized milling industry of the region. Almost all regional experts noted this (Omar Dary, Scott Montgomery, Helena Pachón, and Rafael Flores, personal communication); Scott Montgomery, director of the Food Fortification Initiative, referred to the region having a “strong industrial milling complex.” Helena Pachón also thought that having common languages (ie, Spanish and Portuguese speakers can largely understand each other) contributes to standardization of norms and practices about fortification as do regional trade agreements (personal communication, Helena Pachón).
Historically, there has been much less opposition from the wheat flour industry than was the case with sugar in Guatemala as will be described subsequently (personal communication, Omar Dary). This, he feels, is because the wheat flour industry is highly concentrated, and many mills are transnationals; by restoring nutrient lost in milling, the industry was simply following long-established practices in the United States. Nonetheless, Omar Dary points out that the impetus for large-scale fortification programs in Latin America has come from public health practitioners and researchers and not from industry (personal communication, Omar Dary). At the same time, Scott Montgomery views current widespread, voluntary fortification of commercial products by industry as a potential global problem that also affects Latin America; these practices are unregulated and may contribute too much of some nutrients in some population groups (personal communication, Scott Montgomery).
The region also benefits from strong regional and national capacity in nutrition in academia (personal communication, Rafael Flores). Several academic research institutions have provided critical technical expertise in support of fortification programs, and these include the Center for Nutrition and Health of the National Institute of Public Health of México: the Institute of Nutrition of Central America and Panama (INCAP), the Costa Rican Institute on Research and Teaching in Nutrition and Health (INCIENSA), the National Institute of Nutrition in Peru, the National Institute of Nutrition and Food Technology (INTA), and the University of Chile, among others. The Pan-American Health organization (PAHO) has also played an active role in promoting fortification programs in the region as has the United States Agency for International Development (USAID) and The United Nations Children’s Fund (UNICEF).
Most nutrition activities, including fortification programs, are under the purview of the Ministry of Public Health in units that tend to be weak in technical capacity and poorly funded relative to needs (personal communication, Rafael Flores). Their capacity to conduct research and to monitor and evaluate programs is often limited and is a key factor explaining the lack of information on effectiveness of fortification programs. Where permanent units with long-term continuity of technical personnel and resources are established, such as in Chile and Costa Rica, the technical capacity for monitoring and evaluation is greater.
National commissions on fortification/micronutrients are generally independent bodies established by law that have multisectoral representation of industry, various branches of government, civil society, and academia. They exist in several countries in Latin America and provide valuable program oversight, offer a forum for problem resolution, and foster accountability (personal communication, Omar Dary).
Latin America also has potential allies for advocacy and information dissemination in the press and other media. For the most part, media are independent and increasingly powerful, acting as a check on mismanagement and corruption and as a force for accountability. Civil society is also highly evolved and is playing an increasing role in advancing public health as in the case of Mexico in promoting the taxation of sugar sweetened beverages. 12
Sugar Fortification With Vitamin A in Guatemala
Early History
INCAP, based in Guatemala City, carried out national nutrition surveys in Central America and Panama in 1965 to 1967 with funding from USAID. These data showed alarmingly low intakes of vitamin A in the region, with 42% to 69% of families surveyed falling below 25% adequacy. 13 Children were specially affected by vitamin A deficiency; the percentage of rural children aged 0 to 9 years with vitamin A deficiency (serum retinol values <20 µg/dL) varied from 20% in Nicaragua to 50% in El Salvador. 13 Surveys also detected clinical signs (eg, xerophthalmia, Bitot spots, and night blindness) of vitamin A deficiency in the region.
Vitamin A deficiency was also a problem throughout Latin America, and the Ministers of Health in a meeting in 1972 in Santiago, Chile, called for goals to reduce vitamin A deficiency and for food fortification with several nutrients, including Vitamin A. 14 This motivated INCAP to continue research begun in 1969 on fortification options for vitamin A deficiency. INCAP had previously supported the implementation of fortified salt with iodine in the region in order to reduce goiter and other iodine deficiency disorders, an experience that left the belief among INCAP researchers that fortification programs can be effective. A variety of vehicles were considered for vitamin A fortification, but few foods were consumed by the poor in rural areas who relied on monotonous cereal diets. Attention was then focused on “universal” vehicles that were consumed by practically all in the population. Salt was considered but discarded for a variety of technical reasons. White sugar emerged as a suitable vehicle, in part because production was centralized in a few sugar mills, increasing the feasibility of fortification. In 1971, the Directing Council of INCAP, made up of the Health Ministers of Central America and Panama, called for the development of sugar fortification programs in the isthmus. INCAP then created the program, “The Program of Control of Hypovitaminosis A in Central America and Panama,” and charged a Guatemalan biochemist, Dr Guillermo Arroyave, with making sugar fortification possible.
Arroyave was a tireless, dedicated scientist according to Dr Juan Aguilar (personal communication, Juan Aguilar) who worked with Arroyave, initially from within the Ministry of Health and later at INCAP as the field director of the evaluation. Dr Aguilar attributed the eventual success of the program to Arroyave’s “vision and ingenuity” for he, along with his team, developed and innovated all the steps that led to the program: the identification of sugar as the vehicle, developing a suitable premix (retinyl palmitate in fine granular powder that was water dispersible and attachable to the sugar crystal by vegetable oil), estimating the needed characteristics of the premix in sugar, conducting chemical stability tests, testing organoleptic properties, carrying out bioavailability assessments of fortified sugar in experimental animals and humans, and finding a practical way to add evenly the premix to the sugar (with the cooperation of one of the sugar mills).
Arroyave worked on two fronts: leading applied research to develop the intervention and actively engaging in political lobbying to seek approval of the legislation and eventual program implementation. With the Ministry of Health, a draft of the law was prepared. Although he had the cooperation of one of the sugar mills, the proposed law faced fierce opposition from other sugar mill owners and reluctance in congress. Only Arroyave and Aguilar were in the public gallery when Congress denied passage of the law. Disheartened but not defeated, they then sought the help of the first lady who was sympathetic; she managed to convince the President of Congress to consider the law once more. Other allies advocating for the proposal legislation were the press and the Committee for the Blind and Deaf. In June 1974, with the public gallery jammed packed with blind and deaf school children, mothers, school teachers, patients from a vision and hearing hospital, physicians, and other professionals and members of the Lion’s club, the law was approved (personal communication, Juan Aguilar).
Program Evaluation
An evaluation was designed to assess program delivery (production at the sugar mills, marketing, and distribution) and nutritional impact. 13 Funding came from USAID, which played an important role in funding nutrition research in the region. Twelve villages were selected at random so as to be representative of the different ecological regions of the country, including villages in indigenous and “ladino” (Spanish speaking) areas; 30 families from each village were selected from among those with at least 1 child aged 0 to 71 months. Data were collected on 5 occasions, beginning with a baseline on October to November 1975, before the fortified sugar became available in December 1975. Four other surveys were planned every 6 months during dry (April to May) and wet seasons (October to November, during 1976 and 1977).
The fortification of sugar, at the time done by adding the premix manually to the centrifuges, was monitored by collecting samples at the 12 mills. 9 The percentage of sugar fortified was 75% in 1976 and 72% in 1977. Taking into account these percentages and the amount of pre-mix added, sugar provided 9.8 and 10.1 µg of retinol per gram in 1976 and 1977, respectively. Samples of sugar were also collected in the villages from retail stores and from households. Across the study period, 70% of samples in both retail stores and households were fortified.
Household dietary intakes were measured by the 24-hour recall method. 9,13 The amount of sugar consumed remained fairly constant across the study period 9 as did the intake of retinol equivalents per capita from the regular diet (Figure 3). On the other hand, the contribution of fortification increased the total intake substantially, reaching between 514 and 670 RE (retinol equivalents) per capita. Children younger than 6 years of age consumed about 35 g of sugar daily, which provided 350 RE from fortification. This is similar to the US RDA, which is 300 RE for children aged 1 to 3 years and 400 RE for children aged 4 to 8 years. 15 The contribution toward vitamin A requirements was therefore substantial.
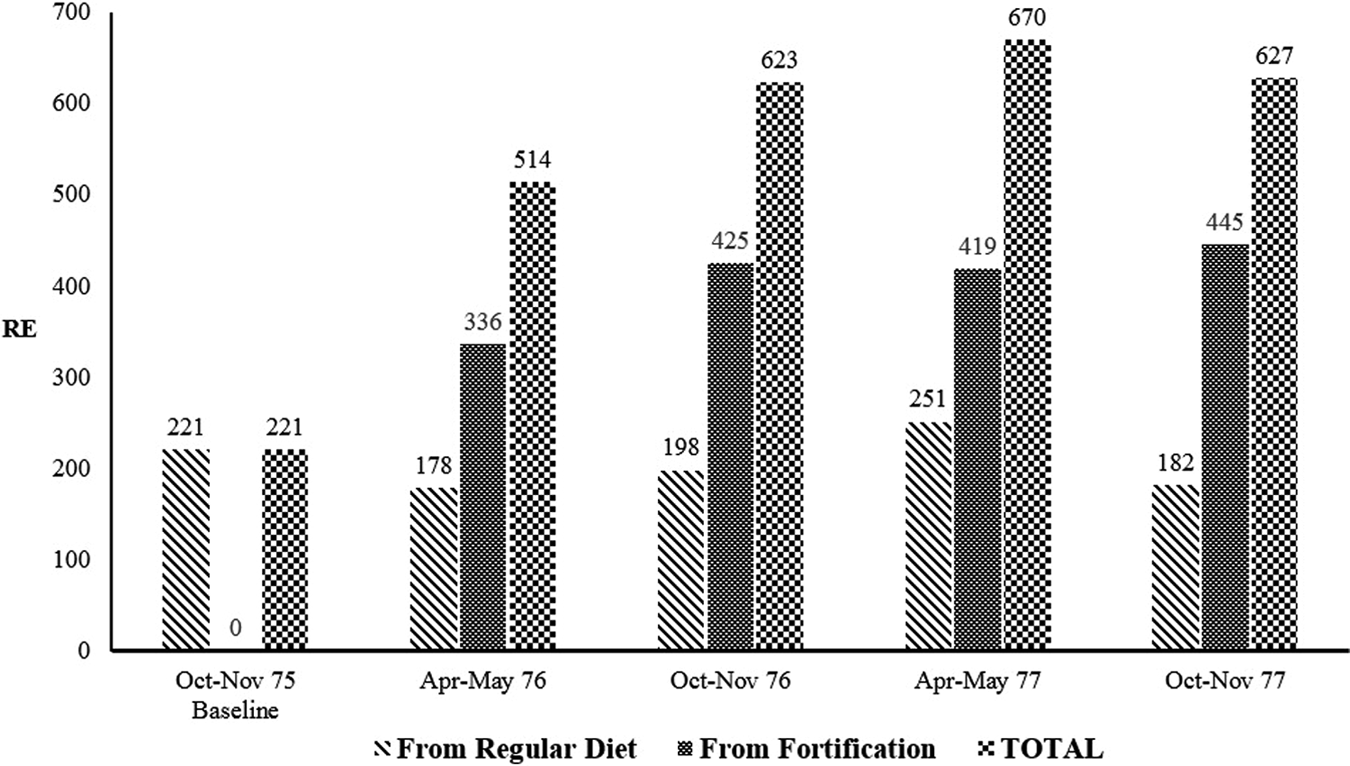
Intake of retinol equivalents per capita per day in Guatemalan households estimated from 24-hour recall surveys (adapted from data in Arroyave et al 9 ).
The percentage of children <6 years of age with low serum retinol concentrations (< 20 µg/dL) declined from 22% to 9% at the last survey round (Figure 4). Serum iron and serum ferritin improved throughout the study period; this finding that vitamin A interventions can improve iron status was novel at the time. 16 The percentage of breast-milk samples with low concentrations of retinol (< 30 µg/dL) also declined from baseline to end line (last survey), with no clear pattern by month of lactation (Figure 5). An ingenious component of the evaluation was the monitoring of retinol concentrations in liver samples from autopsies (n = 765) performed daily in Guatemala City on persons of all ages and both sexes who died in accidents (Figure 6). This was done from October 1975 to September 1977. The decline in liver samples with low retinol concentrations was marked, from 25% at baseline to 2.4% at end line.
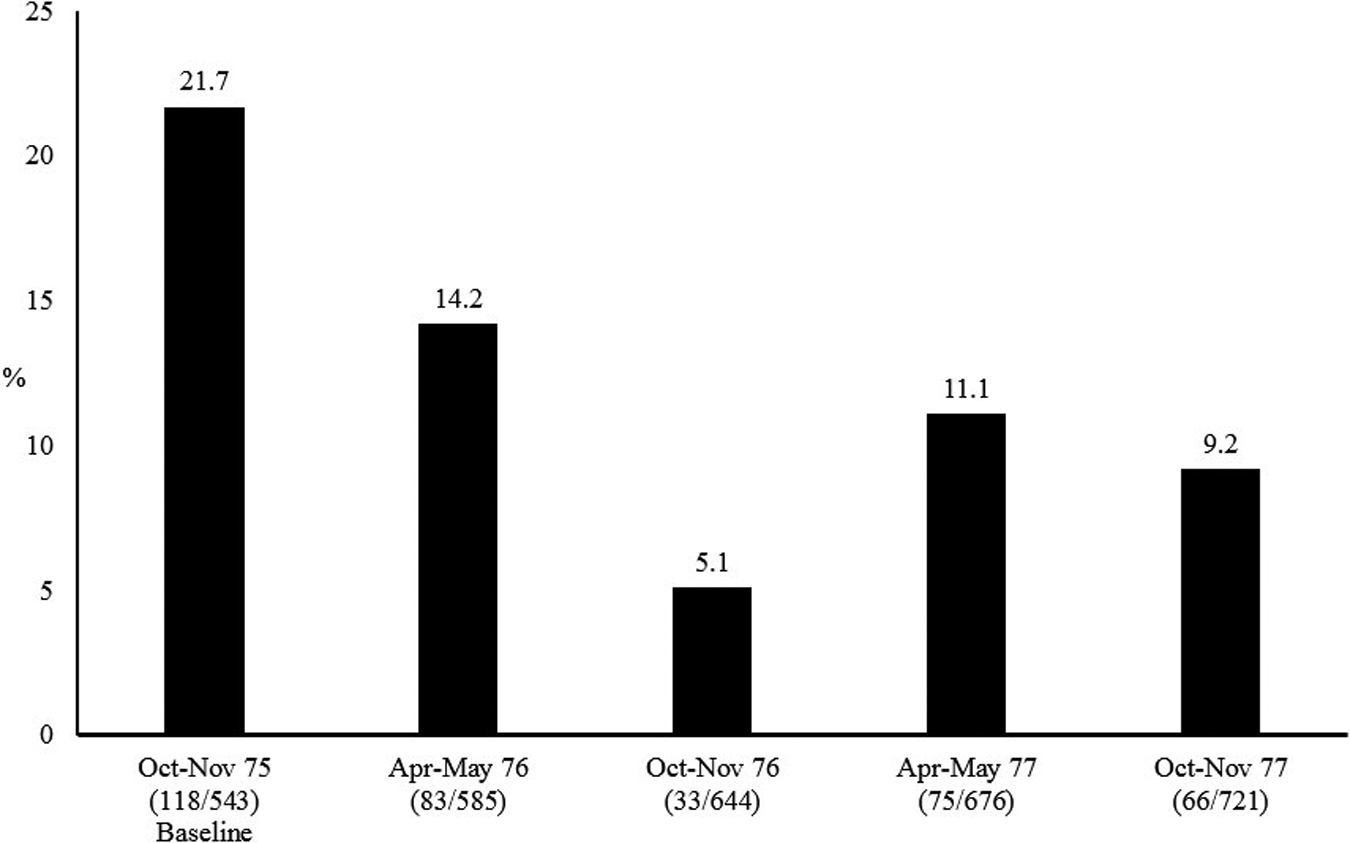
Percentage of preschool Guatemalan children with low serum retinol (<20 µg/dL; adapted from data in Arroyave 13 ).
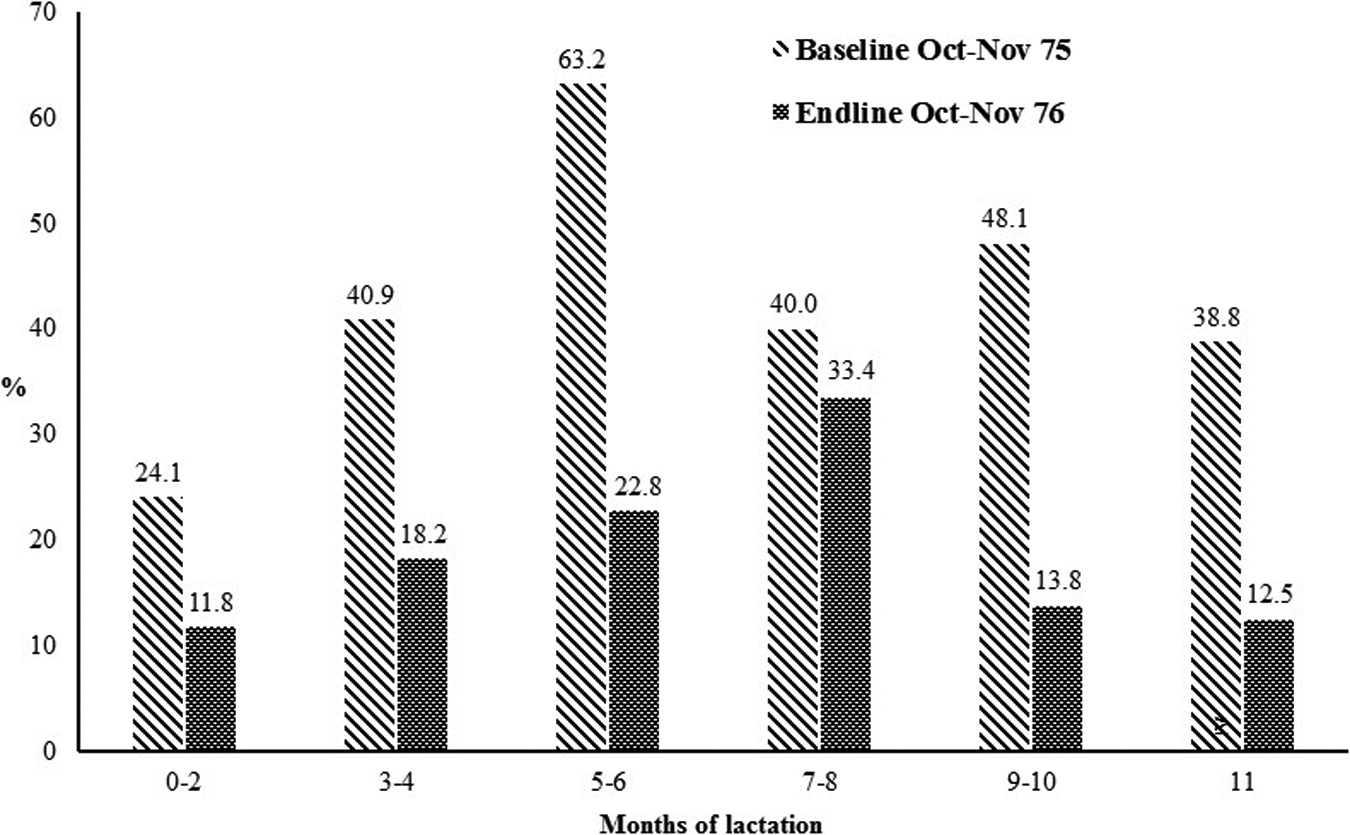
Percentage of breast-milk samples with low retinol concentrations (<30 µg/dL) at baseline and end line by months of lactation (adapted from data in Arroyave 13 ).
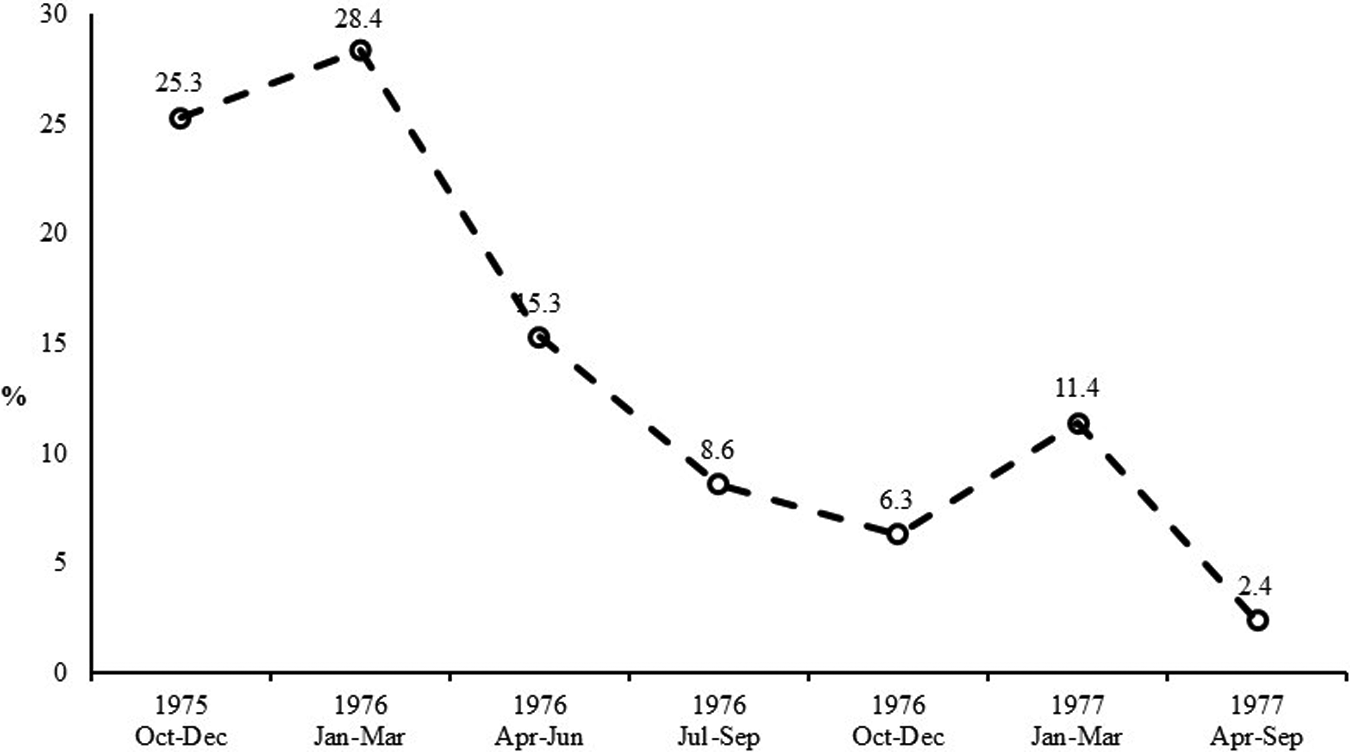
Percentage of liver samples with retinol concentrations of 50 µg/gm or less across the duration of the study (adapted from data in Arroyave et al 9 ).
Production costs per year were estimated as US $443 382, of which 99% was for purchasing retinyl palmitate, manufacturing, and transporting of the premix. 9 These costs, borne by producers and either absorbed and/or passed on to consumers, included quality control measures but not government monitoring or the evaluation conducted by Arroyave. The retail price of sugar in 1976/1977 was US $0.11 per pound (460 g) and the cost of fortifying 1 pound was US $0.0013. Fortification costs represented, therefore, about 1.2% of the retail price. The cost of fortification per person per year was US $0.07. For 1998 to 1999, costs of fortification in Guatemala, Honduras, and Nicaragua were US $0.30 per person per year. 17
Recent Developments
In answer to a question posed to Dr Juan Aguilar about what explained the success of the vitamin A fortification of sugar in Guatemala, he responded “Arroyave at INCAP” (personal communication, Juan Aguilar). Arroyave received many honors and awards for his work including The Order of the Quetzal (La Orden del Quetzal), Guatemala’s highest honor, and the Prince Mahidol Award, conferred by the King of Thailand. His work endures, and today Guatemala and its neighbors El Salvador, Honduras, Nicaragua, and Costa Rica fortify sugar with Vitamin A, with high coverage and program quality. 18 National programs also exist in Nigeria and Malawi (personal communication, Omar Dary). However, the path to success was rocky. 17,18 The sugar producers suspended fortification of the 1977 to 1978 harvest under the pretense that they lacked the foreign exchange currency to buy the premix. Actually, they resented the imposition of the program on them and were not persuaded of its value. It took new champions at INCAP, foremost Dr Oscar Pineda, to restart the program in 1987 but this time working closely with the sugar producers. The need was acute, as levels of vitamin A deficiency had reverted back to the situation in the 1960s. 17,18 With assistance from USAID and UNICEF, and the incorporation of Omar Dary at INCAP in 1990, major improvements were made to the program including improved technical standards and regulations, improved technology such as automated feeders to add the premix to the sugar in a consistent way, better monitoring and surveillance of fortification compliance, and the creation of accountability through, in part, the creation of national commissions for fortification in countries in the region; these included a variety of stakeholders from government, private sector, research institutions, and civil society.
From 1998 to 2004, events became turbulent again. 18 The politics were complicated and involved governmental decrees to rescind fortification and then reinstatements after public outcry, efforts by producers to increase the price of sugar, followed by permits by government to import unfortified sugar and successful challenges to sugar importation at the Constitutional Court by producers. The National Commission on Food Fortification or CONAFOR, researchers, and civil society were critical in defending the fortification program. CONAFOR, an independent, interinstitutional, and intersectoral entity responsible for coordinating and supervising food fortification programs, played a key role during the turbulent years between 1998 and 2004 by facilitating discussion and problem resolution. The program has continued without major challenges to date.
When the program was implemented in 1976 to 1977, the average consumption of sugar per capita was between 20 and 40 g/day in Guatemala, and in 2005, it was around 100g/day. 18 Yet, the fortification content remains in 2016 as in 1976, despite the rise in sugar consumption and the existence of other vitamin A interventions such as vitamin A supplementation of children aged 6 to 59 months, multiple micronutrient powders, and more widespread voluntary fortification by industry. There is concern that vitamin A intakes may be too high and therefore the fear that retinol liver stores may be equally high. A health and nutrition surveillance system found that only 3.1% of children aged 6-59 months and 0.1% of women aged 15-49 years were vitamin A deficient in 2013. 19 Clearly, there is a need to review the situation and make necessary adjustments to micronutrient programs in Guatemala.
There is concern in Guatemala, as well as in the region, about the growing problem of obesity. Should sugar fortification be stopped in view of this concern? Not necessarily. Sugar fortification is universal and there is no need to promote it as a vitamin A-containing product. Ideally, consumption levels should be monitored and the vitamin A content adjusted accordingly to maintain the desired dietary impact, a lower content if consumption rises or alternatively, a higher content if education efforts lead to a decrease in sugar consumption. As noted earlier, there is a need to review all vitamin A programs, and this is likely to result, at the very least, in the lowering of the vitamin A content of vitamin A in sugar.
Costa Rica
History
Costa Rica is a leader in fortification in the developing world. The Ministry of Health selected carefully a basket of staple foods to be fortified with nutrients deficient in the diet. Much thought was given to vehicle selection in order to reach vulnerable groups such as those living in rural areas and small children. The basket of staples that are fortified include wheat flour (since 1958), salt (since 1972), sugar (from 1974 to 1981; reinitiated in 2003), maize flour (since 1999), milk (since 2001), and rice (2002). 10 These fortification efforts continue to date.
Several factors have facilitated fortification in Costa Rica. The Ministry of Health has long had a unit in charge of science and technology development in health that was staffed with permanent positions, notably Luis Tacsan-Chen who has been a constant voice advocating for fortification programs and for their continued improvement. In addition, INCIENSA has participated in monitoring quality control and carrying out laboratory assessments of micronutrient status. Other partners have been INCAP, which has provided technical assistance, and PAHO. The country’s Micronutrient Commission on Micronutrients, an independent, multi-institutional and intersectoral body with broad representation of government, academia, and industry, has functioned well and this has facilitated negotiations between government and industry. According to Luis Tacsan-Chen and Melanie Ascensio, the government has pursued a “strategy of persuasion” with industry rather than imposition (personal communication, Luis Tacsan-Chen, Melanie Ascencio). They also note that Costa Ricans have a strong sense of civic duty and national pride, coupled with a strong civil society and press and other media outlets, aspects that have facilitated and supported public health measures, including food fortification. Luis Tacsan-Chen and Melanie Ascensio also highlight the importance of “evidence” throughout the process, from testing organoleptic properties but also about impact on micronutrient status, for program design and sustainability. As in many Latin American countries, the food industry in Costa Rica is well developed and highly centralized.
Program Evaluation
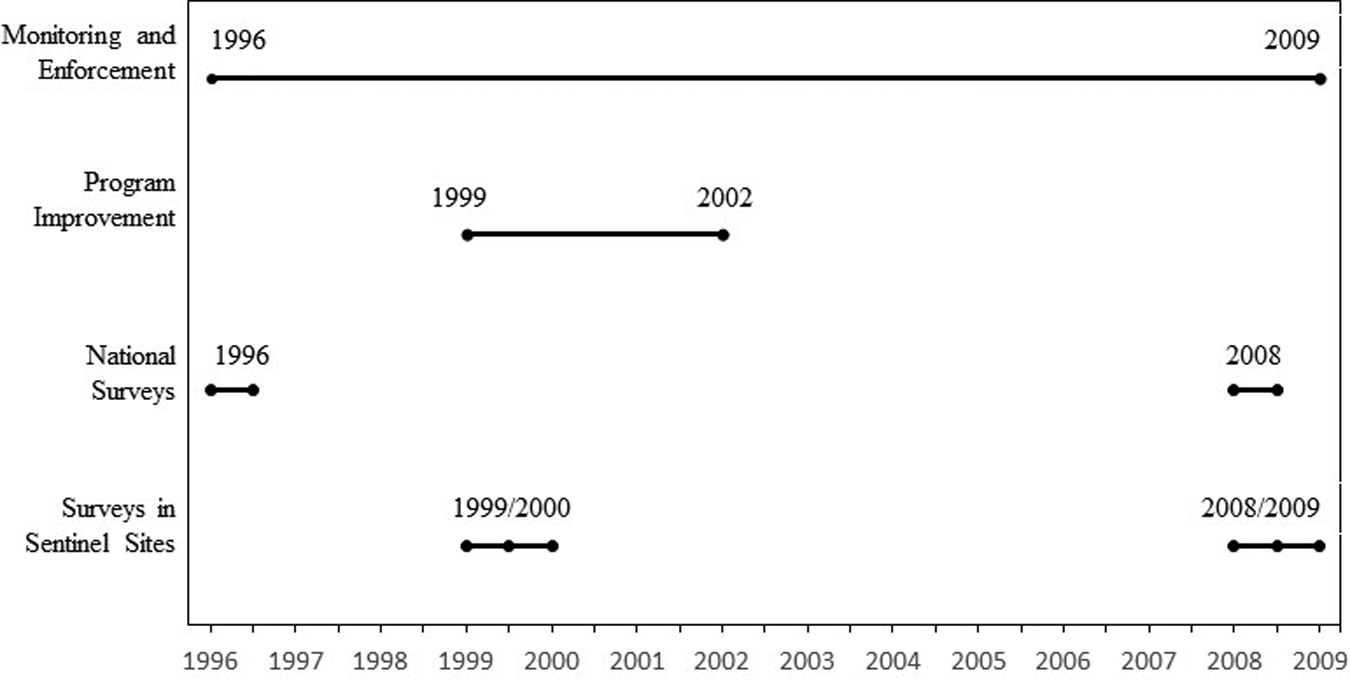
This section focuses on impact of iron deficiency and anemia in women and young children because of the strength of the evidence, although impact on NTDs has also been reported. 20 Some of the staples contained iron as well as other micronutrients: wheat flour, corn flour, and milk (both liquid and powder). Changes to the program improved the amount and quality of the iron in these staples (Figure 7). Reduced iron, an ineffective compound, was replaced by ferrous fumarate in wheat and pasta flour in 2002, and ferrous bisglycinate, a compound with good bioavailability, was added to maize flour in 1999 and to liquid and powdered milk in 2001. Corn flour was selected because this was consumed to a greater degree in poor rural areas and milk in order to reach young children, including those in isolated rural areas. Costa Rica provides milk to poor households, and milk tends to be consumed preferentially by children. Liquid milk is used in urban areas, but powdered milk is distributed in more isolated rural areas for logistic reasons. Monitoring of compliance with fortification was continuous. Martorell et al 10 took advantage of national surveys in 1996, before the improvements were made, and in 2008, after the improvements, to evaluate impact using a pre–post design. Also available were surveys in 1999 to 2000, in 2008 to 2009, and in sentinel sites (1 urban and 1 rural). These surveys provided information on serum ferritin and hemoglobin at both end points for children aged 1 to 7 years. Only hemoglobin was available for women aged 15 to 45 years. There were also 24-hour recall data at end line in the sentinel sites, which permitted the estimation of the percentage of contribution of fortification to requirements using methods developed by Imhoff-Kunsch et al. 21
Milestones of the food fortification history of Costa Rica. 7
Monitoring data from 2000 to 2012 showed very good compliance with fortification mandates for wheat and maize flour and for liquid and powdered milk. 10 A study of wheat flour samples from 246 bakeries from around the country showed that all of them had a total iron content slightly above the mandated 55 mg/kg (Figure 8). When the samples were grouped by any of the 14 brands of flour or the 10 flour mills in the country, all were in compliance.
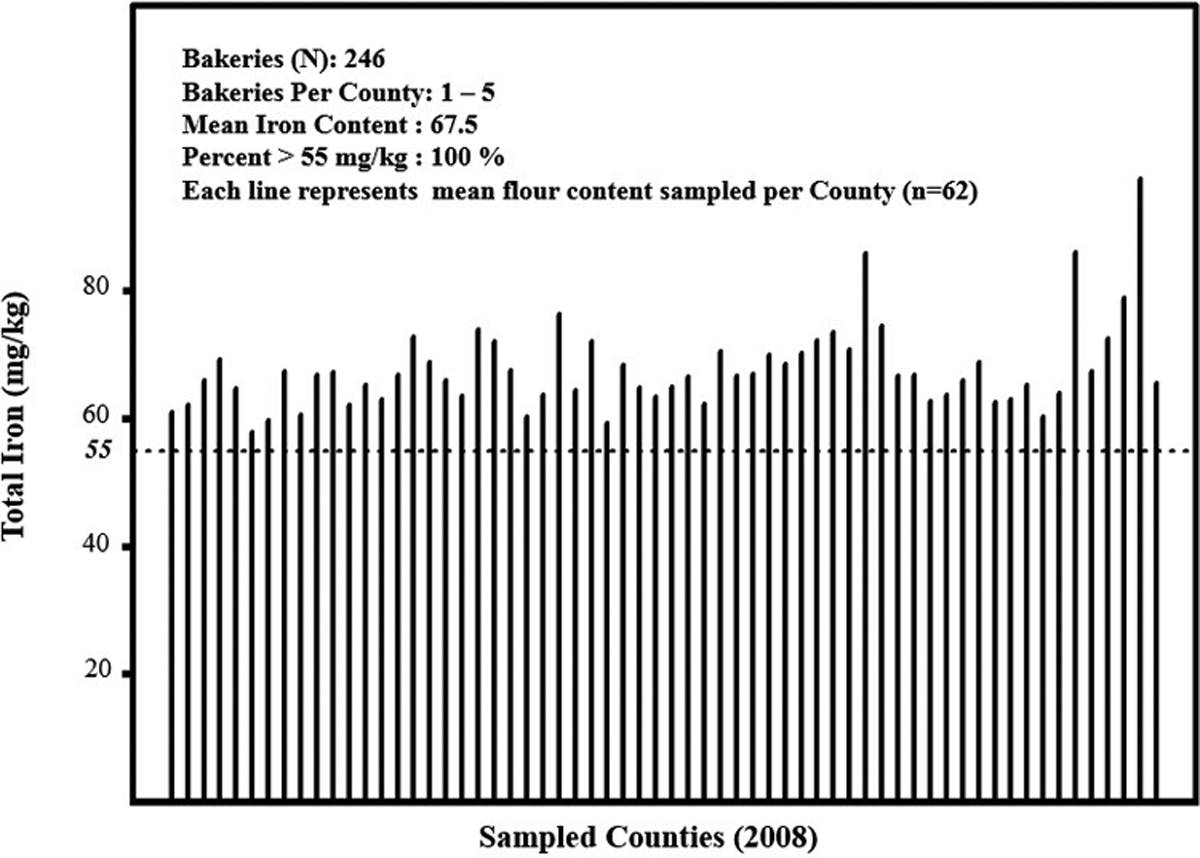
Total iron content (mg/kg) of wheat flour sampled from bakeries across all counties in Costa Rica in 2008. The dotted lines represent the mandated fortification content, 55 mg/kg (adapted from Martorell et al+). 10 Total iron content includes intrinsic iron as well as iron added as ferrous fumarate. The intrinsic iron is about 10 mg/kg.
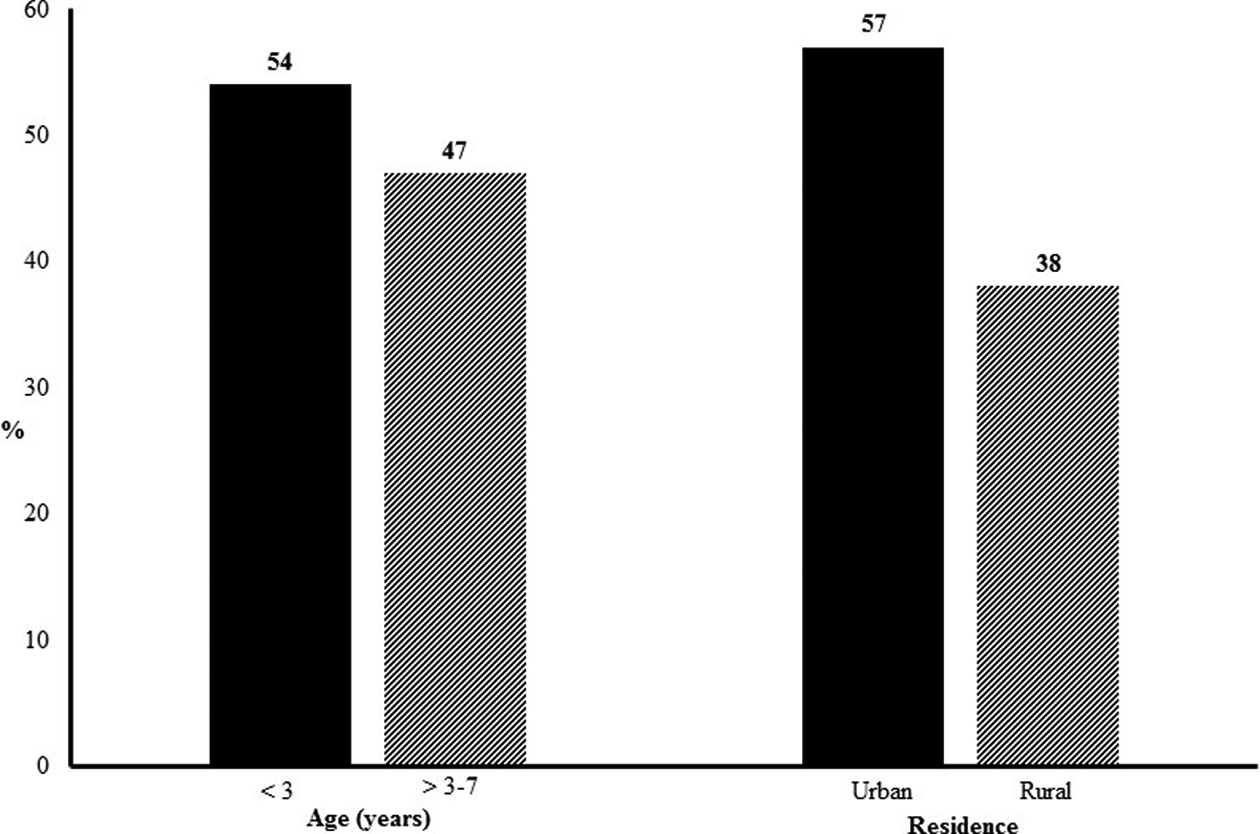
The fortification program contributed about half of the estimated requirement for iron for children aged 1 to 7 years (median 49%, 25th and 75th percentiles were 27% and 80%, respectively), with a similar contribution from milk and wheat flour and little contribution from corn flour. The contribution to the requirement was slightly greater for children aged 1 to 3 years; it was greater also in the urban than in the rural site (57% vs. 38%; Figure 9), explained in great part by the greater consumption of wheat flour in the urban site.
Contribution (% of EAR) of the fortification program to iron requirements by age and sex; sentinel site surveys carried out in 2008 to 2009 (adapted from data in Martorell et al 10 ).
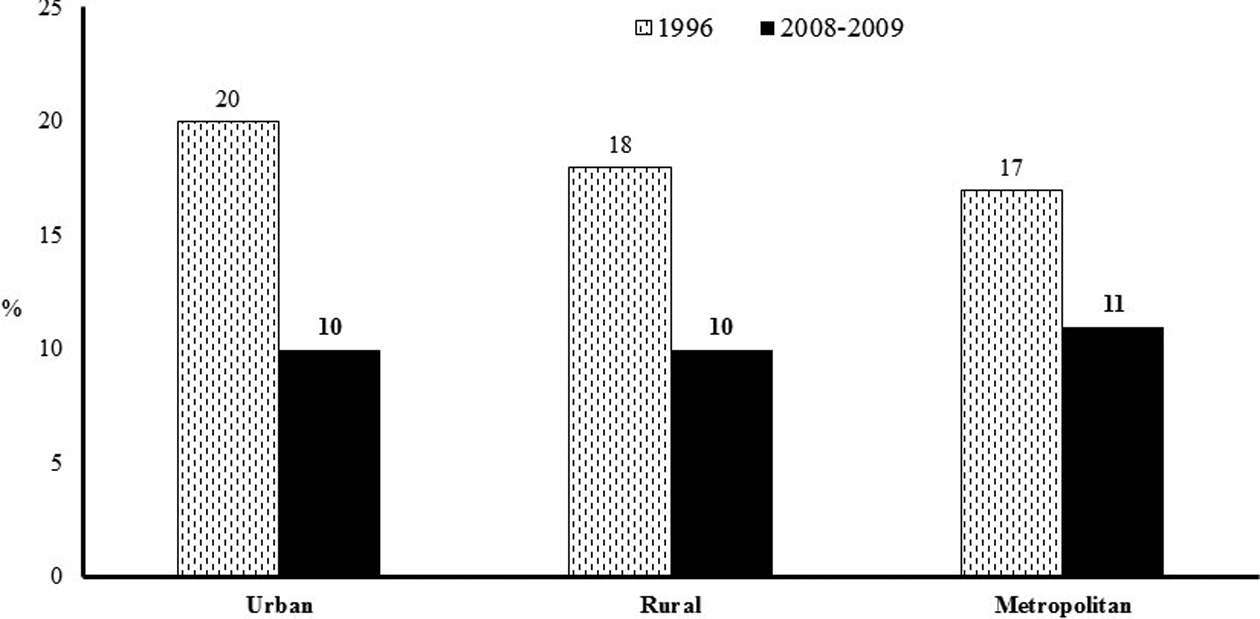
There were notable declines in anemia, iron deficiency, and iron deficiency anemia in children aged 1 to 7 years according to national survey results (Figure 10) and sentinel survey results. 10 Anemia in children declined from 19.3% (95% confidence interval [CI]: 16.8%-21.8%) to 4.0% (95% CI: 2.1%-5.9%). In children, iron deficiency declined from 26.9% (95% CI: 21.1%-32.7%) to 6.8% (95% CI: 4.2%-9.3%). Iron deficiency anemia, which was 6.2% (95% CI: 3.05-9.3%) at baseline, could not be detected at end line. There was a remarkable decline in anemia in children aged 1 to 3 years, from 30% to 5%; in children >3 to 7 years, the decline was from 15% to 4% (Figure 11). There were no differences in the changes observed in boys versus girls. A greater impact was seen in rural and urban areas than in the metropolitan area of San José, the capital. The greater declines in young children and in rural areas may reflect their greater initial prevalence of anemia and physiologically increased absorption rates.
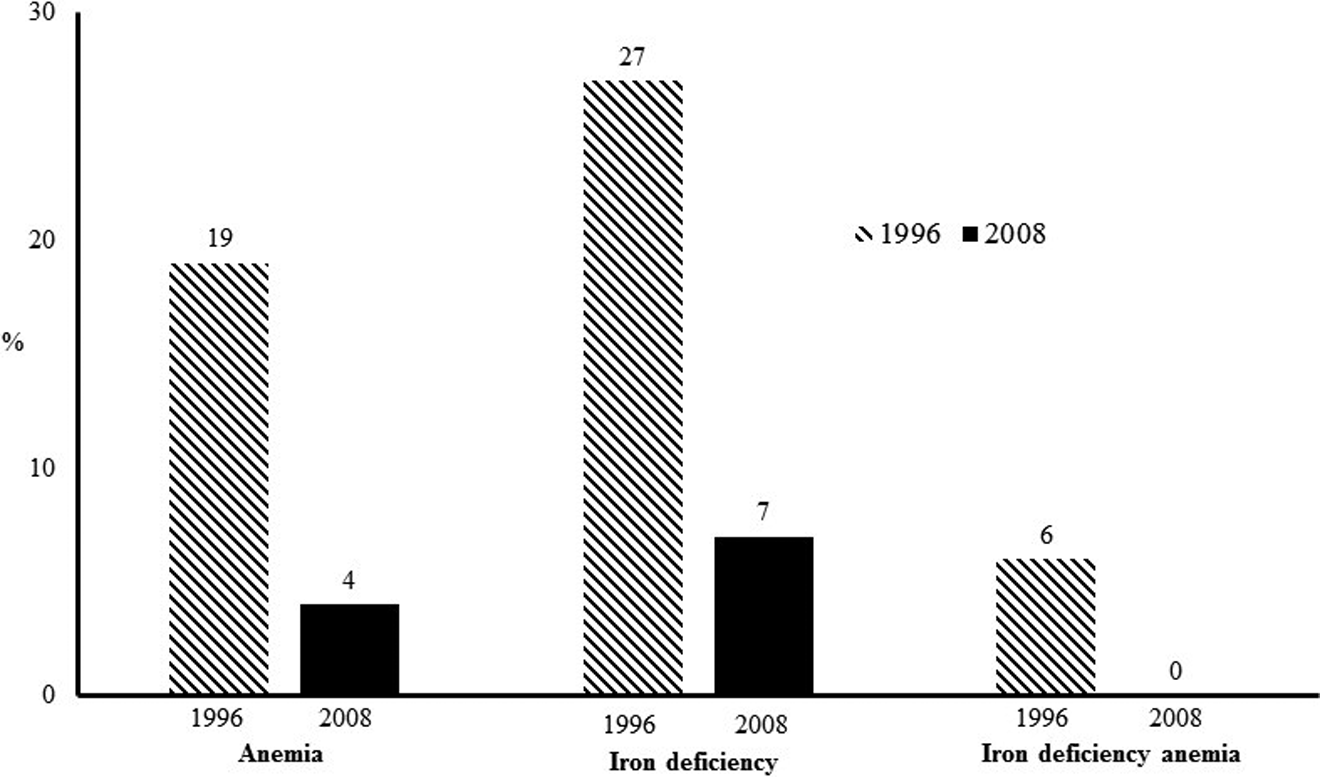
Changes in the prevalence of anemia in Costa Rican children aged 1 to 7 years; 1996 and 2008 national surveys (adapted from data in Martorell et al+). 10 Anemia was adjusted for altitude and defined as hemoglobin < 11 g/dL for children aged <5 years and <11.5 g/dL for children aged 5 to 7 years. Deficiency was defined as serum ferritin <12 µg/L for children aged <5 years and <15 µg/L for children aged ≥5 years.
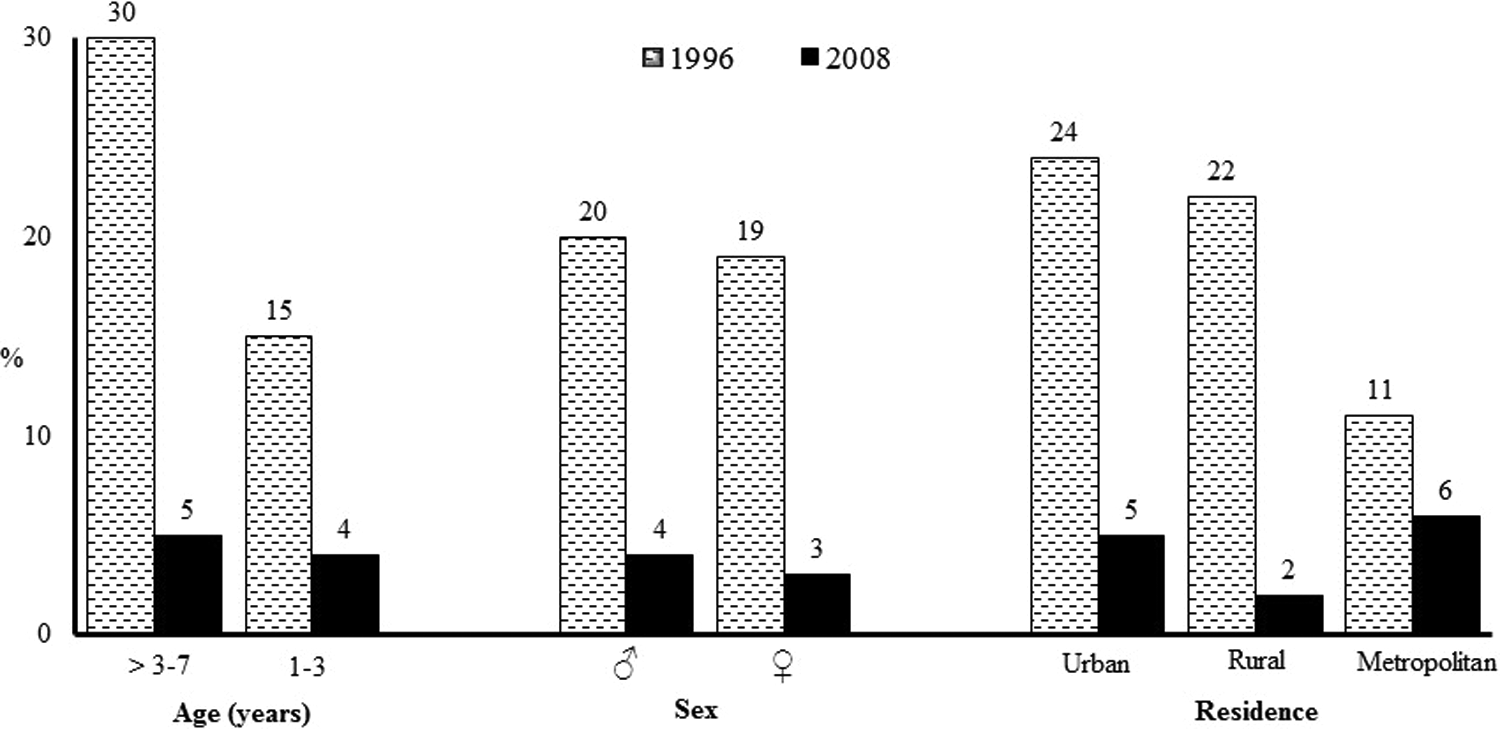
Changes in the prevalence of anemia in Costa Rican children 1 to 7 years by age, sex, and residence; 1996 and 2008 national surveys (adapted from data in Martorell et al+). 10 Anemia was adjusted for altitude and defined as hemoglobin <11 g/dL for children aged <5 years and <11.5 g/dL for children aged 5 to 7 years. Deficiency was defined as serum ferritin <12 µg/L for children aged <5 years and <15 µg/L for children aged ≥5 years.
Anemia declined in women from 18.4% (95% CI: 15.8%-20.9%) to 10.2% (95% CI: 8.2%-12.2%). The decline in urban and rural areas was greater than that observed in the metropolitan area (Figure 12).
Change in the prevalence of anemia in women aged 15 to 45 years by area of residence; 1996 and 2008 national surveys (drawn from data in Martorell et al 2015+). 10 Anemia was adjusted for altitude and defined as hemoglobin <11 g/dL for children aged <5 years and <11.5 g/dL for children aged 5to 7 years. Deficiency was defined as serum ferritin <12 µg/L for children aged <5 years and <15 µg/L for children aged ≥5 years.
A major weakness of the evaluation was that the end line surveys occurred about 6 years after the improvements to the fortification program, opening up the possibility that other aspects that changed in the interim could have caused the improvements in iron status and anemia. It would have been preferable to have done the end line sooner, perhaps 1 to 2 years after the improvements occurred. Still, the rapid reduction in prevalence, much faster than observed historically in regions around the world, 22 and the fact that a program impact pathway was demonstrated increase the robustness of the claims for impact.
Fortification is often viewed as an intervention that favors the better off. For example, in Guatemala, the key staple of the indigenous population of the highlands is corn and wheat flour fortification most likely benefits urban areas to a much greater extent. 21 Several reasons explain the equity in impact achieved in Costa Rica. A basket of foods was fortified, and the choice of vehicles considered the consumption patterns of the most vulnerable groups. Since small children consume small amounts of fortified flours, milk was fortified, a food that was distributed free to poor households. The fact that powdered milk was also fortified enabled the program to reach isolated rural areas. In an effort to reach poor rural areas, corn flour was also fortified, but consumption was low in children; no dietary data were available for women.
Future Needs
A new national survey is needed to assess how micronutrient deficiencies are evolving. This should include assessment of not only iron status and anemia but also biomarkers of inflammation, serum retinol, zinc, and water-soluble vitamin deficiencies.
Flour Fortification of Wheat Flour and NTDs in Chile
History
Chile was the first country in Latin American to fortify wheat flour with micronutrients. Mandatory fortification of wheat flour dates to 1951, and fortification was implemented soon after. This was achieved through the perseverance and leadership of Dr Jorge Mardones Restat. Manuel Olivares, Fernando Pizarro, and Eva Hertrampf, scientists at the Instituto de Nutrición y Tecnología de Alimentos (Nutrition and Food Technology Institute or INTA) in Santiago, Chile, recalled the history of the program (personal communication, Manuel Olivares, Fernando Pizarro, and Eva Hertrampf).
Much is owed to Dr Mardones Restat, who was a physician and university professor, and later a congressman. In 1950, he was appointed Minister of Public Health. At the time of his appointment, alcoholism was a growing public health concern, and B complex vitamin deficiencies were becoming prevalent, matters of great concern to Dr Mardones Restat. Aware of the impact that fortification of wheat flour with B-complex vitamins was having on vitamin deficiencies in the United States, he began efforts to implement such a program in Chile. This led to the passing of a law that called for the fortification of wheat flour with iron (as filings), calcium, thiamin, riboflavin, and niacin. The country had no experience in food fortification, and both the premix and the fortification technology had to be imported. The milling industry, wishing to remain in good terms with the minister, complied without any opposition and program implementation proceeded rapidly. The law was modified in 1967 to increase the iron content to 30 mg/kg and to modify the type of iron from metallic iron to ferrous sulfate, although it is not known when millers began to comply. This change occurred because at that time iron deficiency was becoming an important issue in the general population, particularly in children, but also because of technical difficulties with the use of metallic iron. As a response to new evidence showing that the provision of folic acid supplements to pregnant women reduced NTDs drastically, a second modification to the legislation occurred in 2000 to include this micronutrient in the premix. The level of fortification was set at 2.2 mg/kg flour assuming that the observed mean consumption of bread of approximately 200 g/day would provide women of child bearing age (15–44 years) a mean additional intake of approximately 400 µg/day of folic acid.
In answer to a question about which persons and institutions played a role in achieving legislation that added folic acid, Olivares and Pizarro responded that it was Mardones Restat for advancing the policy and researchers from INTA and the University of Chile advising the Ministry of Health, including Eva Hertrampf of INTA, for promoting the introduction of folic acid (personal communication, Manuel Olivares, Fernando Pizarro). Hertrampf also designed and carried out the evaluation of the program with colleagues from INTA, the institution that most supported the technical aspects of the program.
Chile has effective monitoring of wheat flour fortification at production levels, which was introduced in 1960; activities are coordinated by the Ministry of Health, with the Institute of Public Health (IPH) conducting the analyses of flour samples (Figure 13). 11 Inspectors obtain samples (at point of production and on-site warehouses but no downstream inspections at distribution, reprocessing, or retail levels) from each region several times per year and send them to the IPH 23 ; samples of imported flour are also sent for analysis. The IPH measures iron, thiamin, riboflavin, and folic acid concentrations, the latter only since 2005. Results are returned to the region where authorities impose fines or apply other measures when required. Most samples complied with fortification concentrations. Results of monitoring activities are published annually and disaggregated by region but not by mill. 23
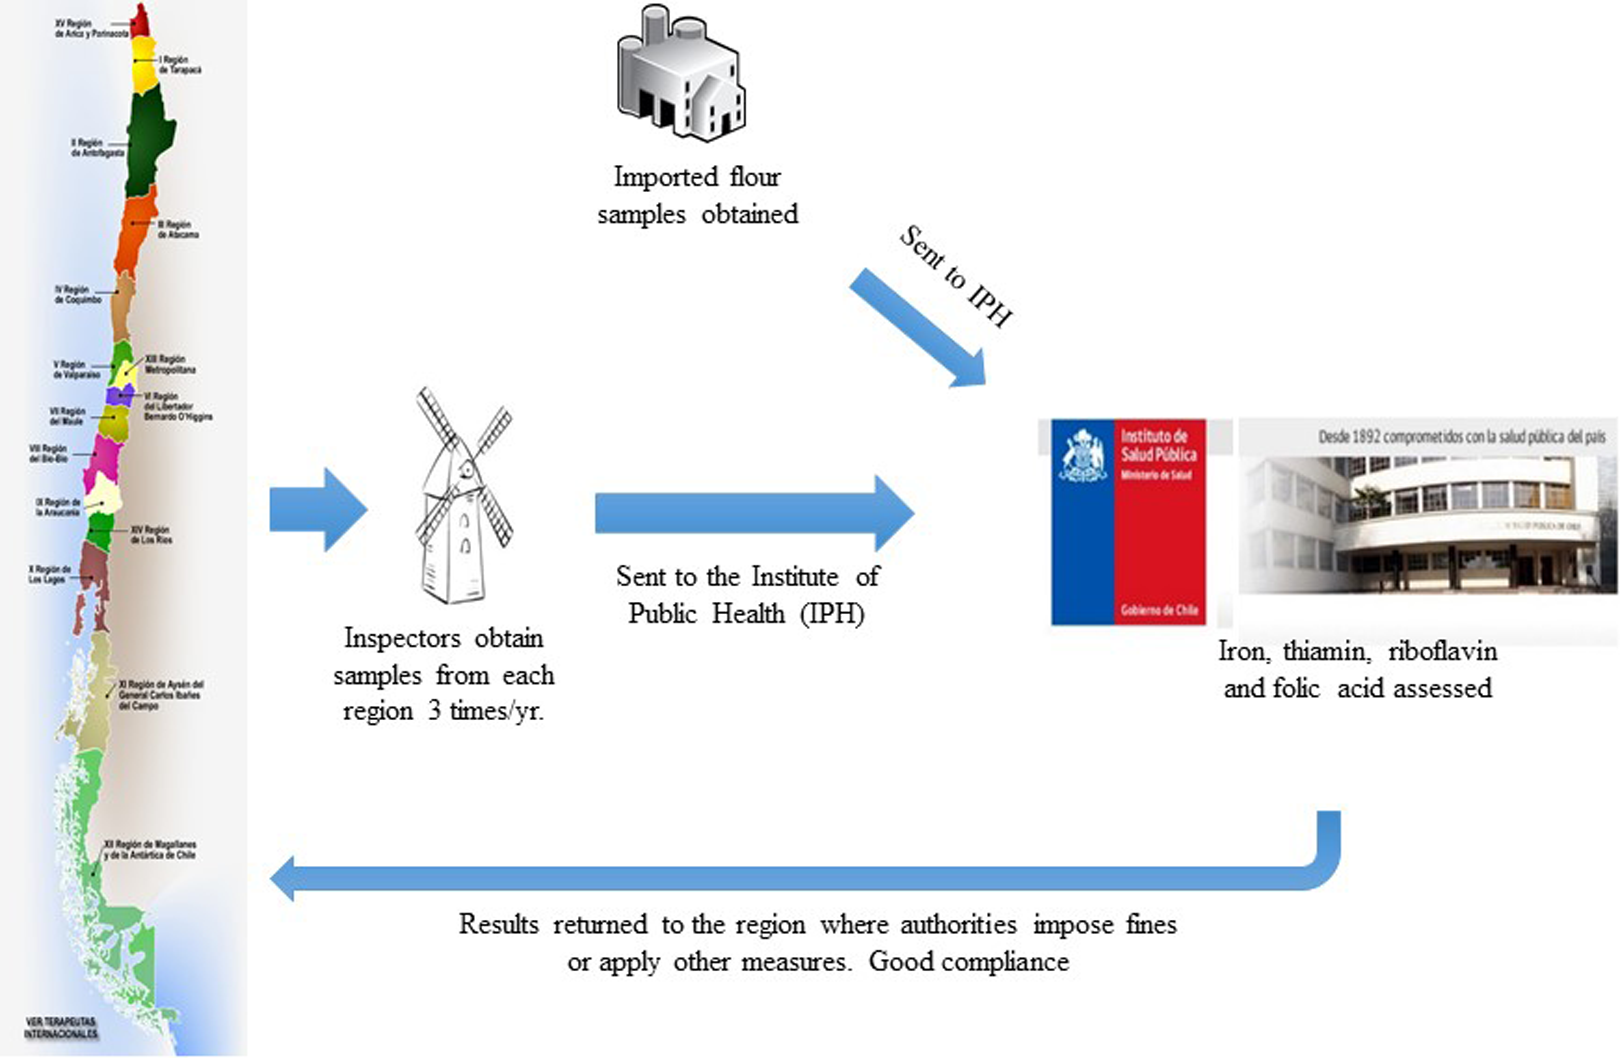
Regulatory monitoring of wheat flour fortification by the Ministry of Health in Chile.
Program Evaluation
The program was effective in increasing the folate content of bread. 24 The folate content of bread samples bought from randomly selected retail bakeries in the capital city of Santiago 3 and 6 months after fortification was initiated were measured in a separate evaluation conducted by INTA (Table 2). The analysis confirmed that soon after the legislation was mandated, the program had been implemented successfully. The mean (±SD) folate concentration of the 100 bread samples assessed in April and August 2000 was 202 ± 94 μg/100 g (range 22-416). Overall, 28 samples had less than the minimum set by law and of these, 9 were likely unfortified. 25
Folate Content in Bread From Bakeries in Santiago, Chile, 3 and 6 months After the Mandate for Folic Acid Fortification. 24
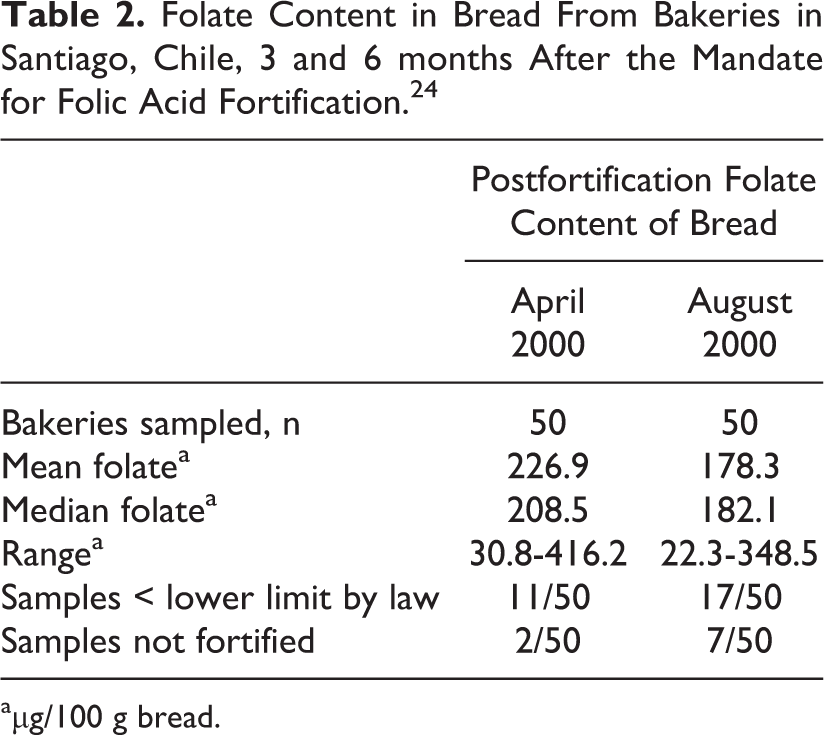
aµg/100 g bread.
Bread consumption and folate dietary intake were assessed in 605 reproductive-age women in a study conducted by INTA. 11,25 Women consumed 245 and 239 g of bread before (October-December 1999) and after fortification (October-December 2000), respectively. Some 98% of the women consumed bread daily, and 89% consumed >180 g/d. Of the bread consumed, 97% was industrially processed. None of the participants consumed other folic acid–fortified foods, and none took folic acid supplements. Taking into account the average concentrations of folate in bread, the mean (± SD) folic acid intake was 427 ± 18 µg/d (95% CI 409-445). Almost half of the women consumed >400 µg folic acid/d and only 3% consumed <100 µg/d. The requirement for women aged 19 to 50 years set by the Institute of Medicine (IOM) of the United States is 520 µg of folate (equivalent to 312 µg of folic acid); the IOM also recommends that reproductive-age women capable of becoming pregnant consume 400 µg of folic acid daily from fortified foods or supplements in order to prevent NTDs. 14
Both serum and red blood cell folate concentrations increased significantly (P < .001) between the pre- and postfortification periods, while B12 concentrations, as expected, did not change. 25 The distribution of red blood cell folate in the 605 women studied shifted markedly to the right, with mean concentrations increasing from 128 to 312 ng/mL (Figure 14).
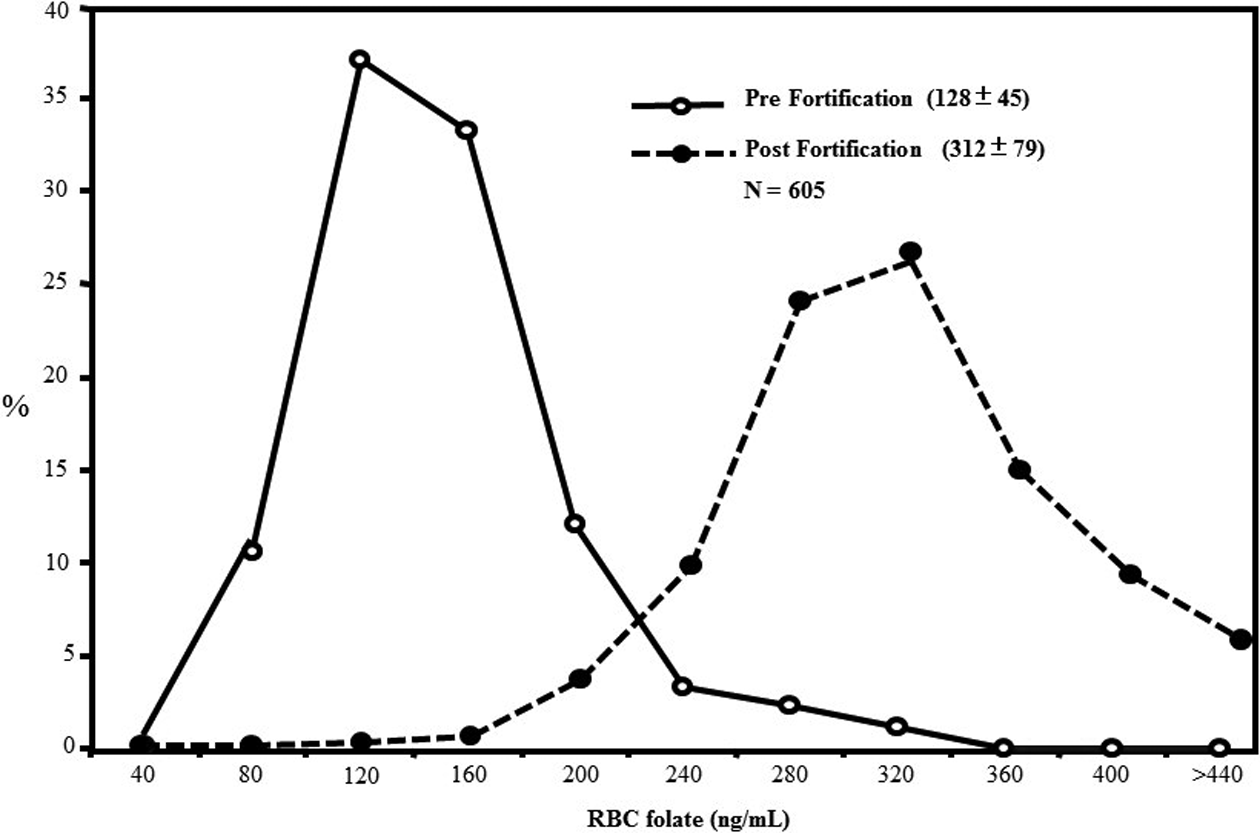
Red blood cell (RBC) folate concentrations, pre- and post-folic acid fortification in reproductive-age women (n = 605; adapted from Hertrampf et al 25 ).
INTA established an NTD surveillance system in 9 public hospitals in Santiago, which accounted for 60% of all births in Santiago and 25% of those in Chile. 11 The folic acid fortification program reduced the incidence of NTDs (NTD births/10 000 births) from 17.1% in the prefortification period to 9.7 after fortification or by 43% (Table 3). Termination of pregnancy and therapeutic abortion is unlawful in Chile, and these figures are thus fairly robust estimates of the true incidence.
Total NTD Rates Pre- and Post-folic Acid Fortification in Santiago, Chile. 11
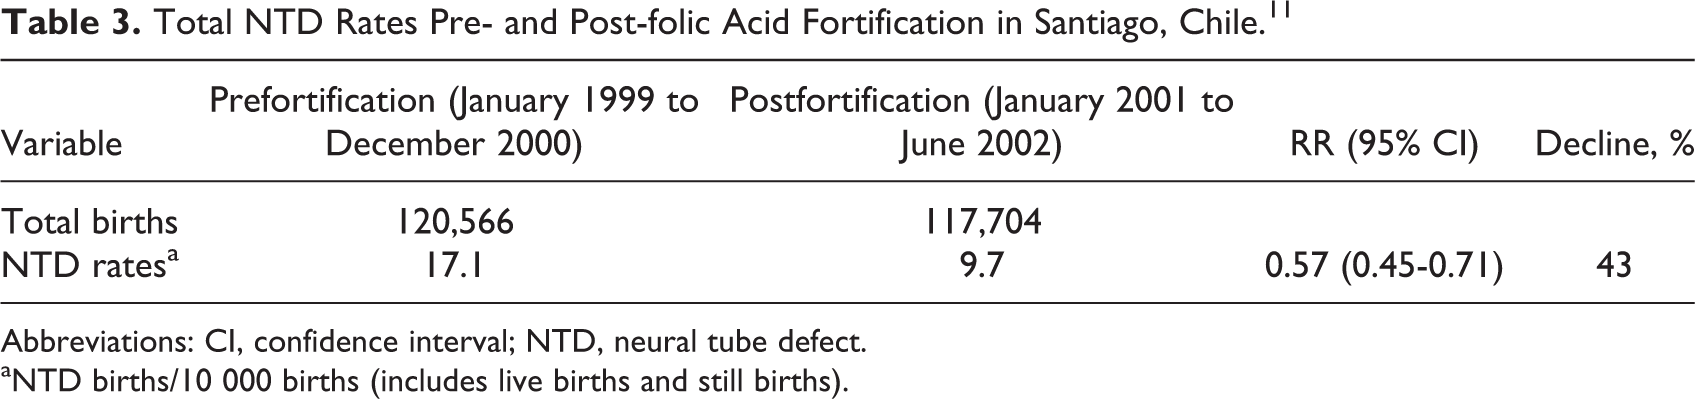
Abbreviations: CI, confidence interval; NTD, neural tube defect.
aNTD births/10 000 births (includes live births and still births).
An expost economic analysis of the intervention was conducted using 2001 international dollars (I$). 26 Total program costs were estimated at I$ 208 700. The costs of the intervention per NTD and infant death averted were I$ 1200 and 11 000, respectively, while the cost per DALY averted was I$ 89, equivalent to 0.8% GDP per capita. After taking into account the averted costs of care but not the emotional cost to families and unpaid care by families, fortification resulted in net cost savings of I $ 2.3 million. This makes the program very cost effective, since averted costs exceeded program costs by a ratio of 11.8:1.
Recent Developments
Some studies have raised concern with regard to potential adverse effects of the fortification of wheat flour with folic acid. Results from the 2009-2010 Chilean National Health Survey showed that 49% of people aged ≥65 years (n = 1043) had high levels of serum folate (>29 µg/L [80th percentile of the distribution]). 27 As a result of these concerns, the Ministry of Health convened a meeting in 2008 with representatives from industry, the National Public Health Institute, and INTA to address the issue of a potential excessive intake of folate in some segments of the population. Several modifications were suggested and approved, which included lowering the range of fortification of folic acid from 2.0 to 2.4 mg/kg to 1.8 to 2.0 mg/kg and increasing the concentrations of riboflavin and niacin.
Discussion
The 3 programs with public health impact that we selected shared the Latin American context described earlier. But what else did they have in common? Recall Juan Aguilar explaining the success of the vitamin A fortification of sugar in Guatemala in three words: “Arroyave at INCAP” (personal communication, Juan Aguilar). He was stressing that it was the pairing of a champion of fortification with a research institution that made all the difference. In Chile, it was Eva Hertrampf and colleagues at INTA; in Costa Rica, it was Luis Tacsan-Chen and colleagues in a technical unit at the Ministry of Health with technical support from researchers at INCIENSA.
Industry buy-in and willing participation was essential in all cases. Sugar had never been fortified anywhere in the world before Arroyave tried in Guatemala. This was new to the sugar industry and gaining their cooperation was not easy. The program began with little support from an industry that fiercely resisted it. The sugar industry was successful in closing the program 2 years later, despite strong and widely disseminated evidence of beneficial impact. Oscar Pineda, also from INCAP, was able to revive the program in a few years, in part because he sought good relations and cooperation from industry. Programs in Costa Rica and Chile had wheat flour as a major vehicle, and this industry was more open to fortification. Costa Rica’s approach also proved wise, adopting a strategy of persuasion and not imposition, facilitated by dialogue through the National Commission on Micronutrients. In Guatemala, such a commission also played a critical role in solving problems between government and industry, along with INCAP, efforts that led to the reestablishment of the program. Other important partners supporting fortification have been civil society and the national press, particularly in the case of Guatemala.
Another common feature was that the programs were designed well. The nutrient needs were identified first and then the programs were designed to address these needs. The choices of vehicles were excellent in that they were consumed by the target population: sugar for vitamin A in Guatemala, a basket of foods for several nutrients but particularly for iron in Costa Rica, and wheat flour for NTD prevention in Chile. There was careful selection of stable and bioavailable fortificants; in the case of sugar and vitamin A, it had never been done anywhere, and in Costa Rica it was a matter of switching to better fortificants. Another common feature was that fortification levels were based on patterns of consumption and set at levels that would lead to important reductions in nutrient gaps. There were also good monitoring and quality control systems.
We selected 3 programs that had significant public health impact. Since they were all national programs, the designs were by necessity pre/post, without the use of controls. While this design is not robust by itself, all three programs were able to document a program impact pathway (Figure 2) and thus considerably enhance the strength of their claims of impact. It demonstrated a potential to benefit in all 3 cases, and strong advocacy led to the passing of appropriate legislation. Bioavailable fortificants were added to vehicles that were consumed by the needy, and the foods were fortified at appropriate levels and compliance was monitored and enforced. In all 3 evaluations, it was possible to establish that the fortified foods made a meaningful contribution to requirements to have impact on nutritional outcomes.
The Home Fortification Technical Advisory Group has written a manual outlining the steps necessary to planning whether an intervention is needed, selecting the appropriate intervention, designing the program, planning its implementation, implementing it well, and best practices for monitoring and evaluation. 28 The information obtained through monitoring and evaluation is then used to update and identify new problems, in effect, creating what the Advisory Group calls a “program cycle” 28 Costa Rica and Chile used monitoring and other information to improve the programs. The use of better iron fortificants in the program in Costa Rica in response to new scientific developments and the modification of the content of water-soluble vitamins in the premix in Chile as a response to concerns about adverse effects are examples of the “program cycle.” The failure to have altered the vitamin A content in sugar in response to greater levels of sugar consumption shows that this approach was not followed in Guatemala. The manual, developed for multiple micronutrient powders, is generalizable to food fortification and is recommended for program planners.
Strengths and Limitations
Our work has strengths and limitations. We started with 3 programs that we knew had public health impact and examined all available monitoring and evaluation results as well as historical information gleamed through publications and reports as well as provided by interviews of key informants from the region and the three countries of emphasis: Guatemala, Costa Rica, and Chile. From the published information, we were able to show that all 3 programs had information along a program impact pathway, providing a model for good practices in monitoring and evaluation. The contextual and historical information, including anecdotes, provided by the key informants, enrich the published literature and allow for a more comprehensive overview of the features of these successful programs.
The study has important limitations. There was no formal comparison group of unsuccessful programs, and this limits the ability to state that the identified components of the programs were the reasons for their success. However, the regional and country experts had deep knowledge of the many programs functioning in the region that were not successful, and undoubtedly, their observations considered this. In addition, another potential limitation is that some of the statements made by the experts may be taken as opinions rather than facts. For example, several expressed independently that food fortification finds fertile ground in Latin America because the region has centralized, developed food industries. When several experts well acquainted with the region repeat this, we become confident that this is true.
Conclusions
There are several important lessons from the 3 programs we examined for fortification programs in the region and elsewhere: Institutional research capacity in the country or region and champions of fortification are features of these successful programs. To have impact one must design for it, programs need to use vehicles that are consumed by the needy and add bioavailable fortificants at adequate content levels in order to fill dietary gaps and reduce micronutrient deficiencies. Private/public partnerships (industry, government, academia, and civil society) were common features of these successful programs and were possibly key for sustainability. The importance of monitoring and quality control and the use of this information for corrective actions cannot be overstated. The impact evaluation plan must be specified prior to the initiation of the program, including a baseline/end line and data collection along the program impact pathway to inform needed improvements to the program and strengthen causal inferences about impact.
Footnotes
Acknowledgments
We are grateful to the informants for providing valuable contextual information about fortification programs in Latin America and for their comments and suggestions about this manuscript. We are also thankful for the financial support for this research from the Global Alliance for Improved Nutrition (GAIN).
Declaration of Conflicting Interests
The author(s) declared no potential conflicts of interest with respect to the research, authorship, and/or publication of this article.
Funding
The author(s) received no financial support for the research, authorship, and/or publication of this article.