
Abstract
Background:
Policy makers aiming to reduce micronutrient deficiencies (MNDs) and their health effects must choose among alternative definitions of impact when evaluating cost-effectiveness.
Objective:
Estimate the cost-effectiveness of a mandatory wheat flour fortification program for reducing cases of MNDs (iron, zinc, folate, vitamin B12), anemia and neural tube defects (NTDs) averted, and disability-adjusted life years (DALYs) averted in urban Cameroon.
Methods:
A 13-year predictive model was developed, including a 3-year start-up period and 10 years of program activity. Costs were estimated using historical program budgets. Effects were calculated based on observed changes in prevalence of MND and anemia 1 year postfortification and predicted reductions in NTDs based on NTD burden and wheat flour intake. Total DALYs averted were estimated for anemia and NTDs.
Results:
The program cost ∼$2.4 million over 13 years and averted an estimated ∼95 000 cases of maternal anemia and ∼83 500 cases of iron deficiency among children after 1 year. Cost/case-year averted for MNDs ranged from $0.50 for low plasma folate to $3.30 for iron deficiency and was $2.20 for maternal anemia. The program was predicted to avert 1600 cases of NTDs over 10 years at ∼$1500 per case averted. Estimated cost/DALY averted was $50 for NTDs and $115 for anemia.
Conclusions:
In Cameroon, cost-effectiveness of wheat flour fortification varied by the measure of impact employed, but was classified as “very cost-effective” for all outcomes using World Health Organization criteria. Policy makers and their advisors must determine how best to use information on program costs and benefits to inform their decisions.
Introduction
Although micronutrient deficiencies (MND) affect millions of people around the world, women and children in low- and middle-income countries disproportionately bear this burden. 1 Iron deficiency is estimated to be the leading contributor of anemia worldwide, 2 zinc and vitamin A deficiencies increase the risk and severity of morbidity among young children, 1 and vitamin B12 deficiency impairs neurological development. Additionally, maternal folate insufficiency around the time of conception increases the risk of infants being born with neural tube defects (NTDs). Strategies such as food fortification, supplementation, and promotion of naturally nutrient-rich foods have been implemented worldwide to address this problem. 3 To select an appropriate MND control strategy for a given country, decision makers with limited resources must not only examine the potential effectiveness of each intervention, but weigh its cost-effectiveness in comparison to alternative micronutrient interventions, as well as in comparison to other priority nutrition and health interventions.
Fortification is consistently reported to be a highly cost-effective intervention, with estimates as low as pennies per person reached per year by fortified products. 4 -6 However, reliance on this indicator alone may fail to capture the potential health impact of a program. That is, it is possible that an individual reached by fortified foods did not have inadequate intake prior to fortification; conversely, someone with inadequate intake may not consume sufficient quantities of the fortified food to achieve adequate micronutrient intake. Thus, when the desired outcome is to reduce MND and associated health consequences, cost-effectiveness analysis (CEA) should endeavor to use metrics that more accurately reflect the health benefits of the program. Ideally, the estimated benefits would come from rigorous, population-based effectiveness studies. Where this information is unavailable (often the case, particularly for new intervention programs), analyses can be based on predicted rather than observed effects on health outcomes, with predictions often made in the absence of detailed data on the coverage of fortified foods and fortification levels achieved. On the other side of CEA calculations, program costs are often estimated in the absence of actual program budgets. Thus, studying post hoc cost-effectiveness using actual impacts and costs is useful to confirm the cost-effectiveness of an intervention.
Cameroon is one of few countries with nationally representative information on dietary intake and prefortification prevalence of MND, 7 data on prevalence of MND and anemia postfortification, 8 and documentation of program costs. 9 Specifically, multiple MNDs were observed among women and young children in a national survey in 2009, including anemia prevalence among women of reproductive age (WRA) of 46.7%. 7 While data on the prevalence of NTDs are limited in geographic scope, available data suggest that the prevalence of NTDs in Cameroon from 1997 to 2006 was 4 times that of the United States at 1.99/1000 cases per year. 10,11 A marked improvement in the micronutrient status among WRA and children in urban Cameroon was observed after mandatory wheat flour fortification was implemented in 2011. 8 Although we are not aware of postfortification data on NTD prevalence, a significant decrease in the number of these cases has been predicted. 11
The objective of our analysis was to calculate the cost-effectiveness of mandatory wheat flour fortification with iron, folic acid, zinc, and vitamin B12 for reducing MNDs, anemia, and NTDs in urban Cameroon. We used data on wheat flour intake and observed changes in MND and anemia prevalence, as well as predicted reductions in NTD prevalence to develop a 13-year predictive model to evaluate the cost per case of MND, anemia, or NTD averted. We also estimated disability-adjusted life years (DALY) of anemia and NTDs averted by wheat flour fortification, and cost per DALY averted, and compared each of these measures of the cost-effectiveness to the cost per individual reached by the program. Note that we refer to “cases” of MND throughout the article for simplicity, but we recognize that biomarkers such as plasma folate reflect recent intake or “exposure” and not necessarily “deficiency” and that these measures (particularly plasma folate, vitamin B12, and zinc) are not intended for individual diagnosis but instead should be used for population assessment. Acknowledging these limitations, we used this approach to quantify the population-level effects of the fortification program.
Methods
We estimated the costs and nutritional benefits of a mandatory wheat flour fortification program in the 2 major urban areas in Cameroon (Yaoundé and Douala) over a period of 13 years, from 2009 to 2021. Wheat flour was mandated to include iron (60 mg/kg, as ferrous fumarate), zinc (95 mg/kg as zinc oxide), vitamin B12 (0.04 mg/kg), and folic acid (5 mg/kg) based on the World Health Organization (WHO) standards. 12 Introduction of fortified wheat flour in Cameroon occurred in 2011 after a 3-year process of planning and implementation. 9 The chosen 13-year time frame includes 3 years of implementation preparation, during which start-up costs were incurred but fortified products were not yet available in the market, and 10 years of projected benefits and continued program costs thereafter.
The benefits of wheat flour fortification included in our analysis are expressed as person-years of reach of wheat flour fortification, case-years of MND and anemia averted, NTDs averted, and DALYs averted due to reductions in NTD and anemia for 2 target groups: WRA and preschool children. Estimates of wheat flour reach were derived from a 2009 national dietary intake survey and applied to the target populations in Yaoundé and Douala to estimate the number of women and preschool children reached. 7 For MND and anemia, the prefortification and postfortification prevalences of each outcome were measured in Yaoundé and Douala in 2009 and 2012, 8 and the difference in prevalence, where statistically significantly different from zero, was applied to the target population. Population data were obtained from the Lives Saved Tool (LiST). 13 The predicted proportion of NTD cases averted by flour fortification with folic acid was estimated using data on dietary intake of wheat flour and prefortification NTD birth prevalence. 11 The specific methods used to estimate intervention program costs and benefits are described below.
Costs
Cost data for the wheat flour fortification program in Cameroon were gathered from Helen Keller International – Cameroon budget documents, as described previously. 9 Start-up and recurring costs were estimated as annual country-wide totals for wheat flour fortification over the 13-year period (2009-2021). Costs began in 2009 with the baseline survey to assess the need for fortification (by measuring micronutrient status and dietary intake) and additional start-up costs accrued from 2009 to 2011 before flour fortification was fully implemented in 2011, after which recurring costs were incurred for program implementation, monitoring, and evaluation. Costs were divided into 12 categories: Start-up costs include the baseline survey, industrial assessment, revision of standards, equipment for industry, equipment for the national lab, press conference before the launch, launching ceremony, and training of partners and stakeholders; recurring costs include micronutrient premix, monitoring and evaluation, supervision costs, and other indirect costs.
To match costs to the geographic area for which we had benefit estimates, we applied a spatial weight of 31.7% to country-wide costs to define program costs for Yaoundé and Douala. This spatial weight was based on the total consumption of wheat flour products in Yaoundé and Douala relative to other regions observed in the fortification baseline survey. 7,9 We chose to allocate costs based on consumption rather than population or square kilometers per geographical area because the vitamin/mineral premix accounts for the largest portion (almost 80%) of the total cost of the flour fortification program and is purchased in proportion to the amount of wheat flour to be fortified, and the populations in Yaoundé and Douala consume a disproportionate amounts of wheat flour relative to their population sizes. Thus, we judged this weighting approach to be the most appropriate way to “scale” national program costs to Yaoundé and Douala.
Reach of Wheat Flour
Results of the 2009 national survey of dietary intake in Cameroon were used for estimates of the reach of wheat flour in Yaoundé and Douala. Reach was defined as the proportion of WRA or preschool children with reported consumption of wheat flour-containing products (bread, fried dough, etc) in the previous 7 days. These proportions were then applied to the urban population estimates generated by the LiST (as described below) to calculate the number of person-years reached by wheat flour over time.
Micronutrient Deficiencies and Anemia
We calculated the cases of MND and anemia averted annually using results from previous studies that collected data on MND prevalence in Yaoundé and in Douala 2 years prior (baseline/prefortification in 2009) and 1 year after (postfortification in 2012) introduction of the wheat flour fortification program 8 (Table 1).
Prevalence of Anemia and Micronutrient Deficiencies Among Women and Children 2 Years Prior to and 1 Year After Introduction of Fortified Wheat Flour in Cameroon.a
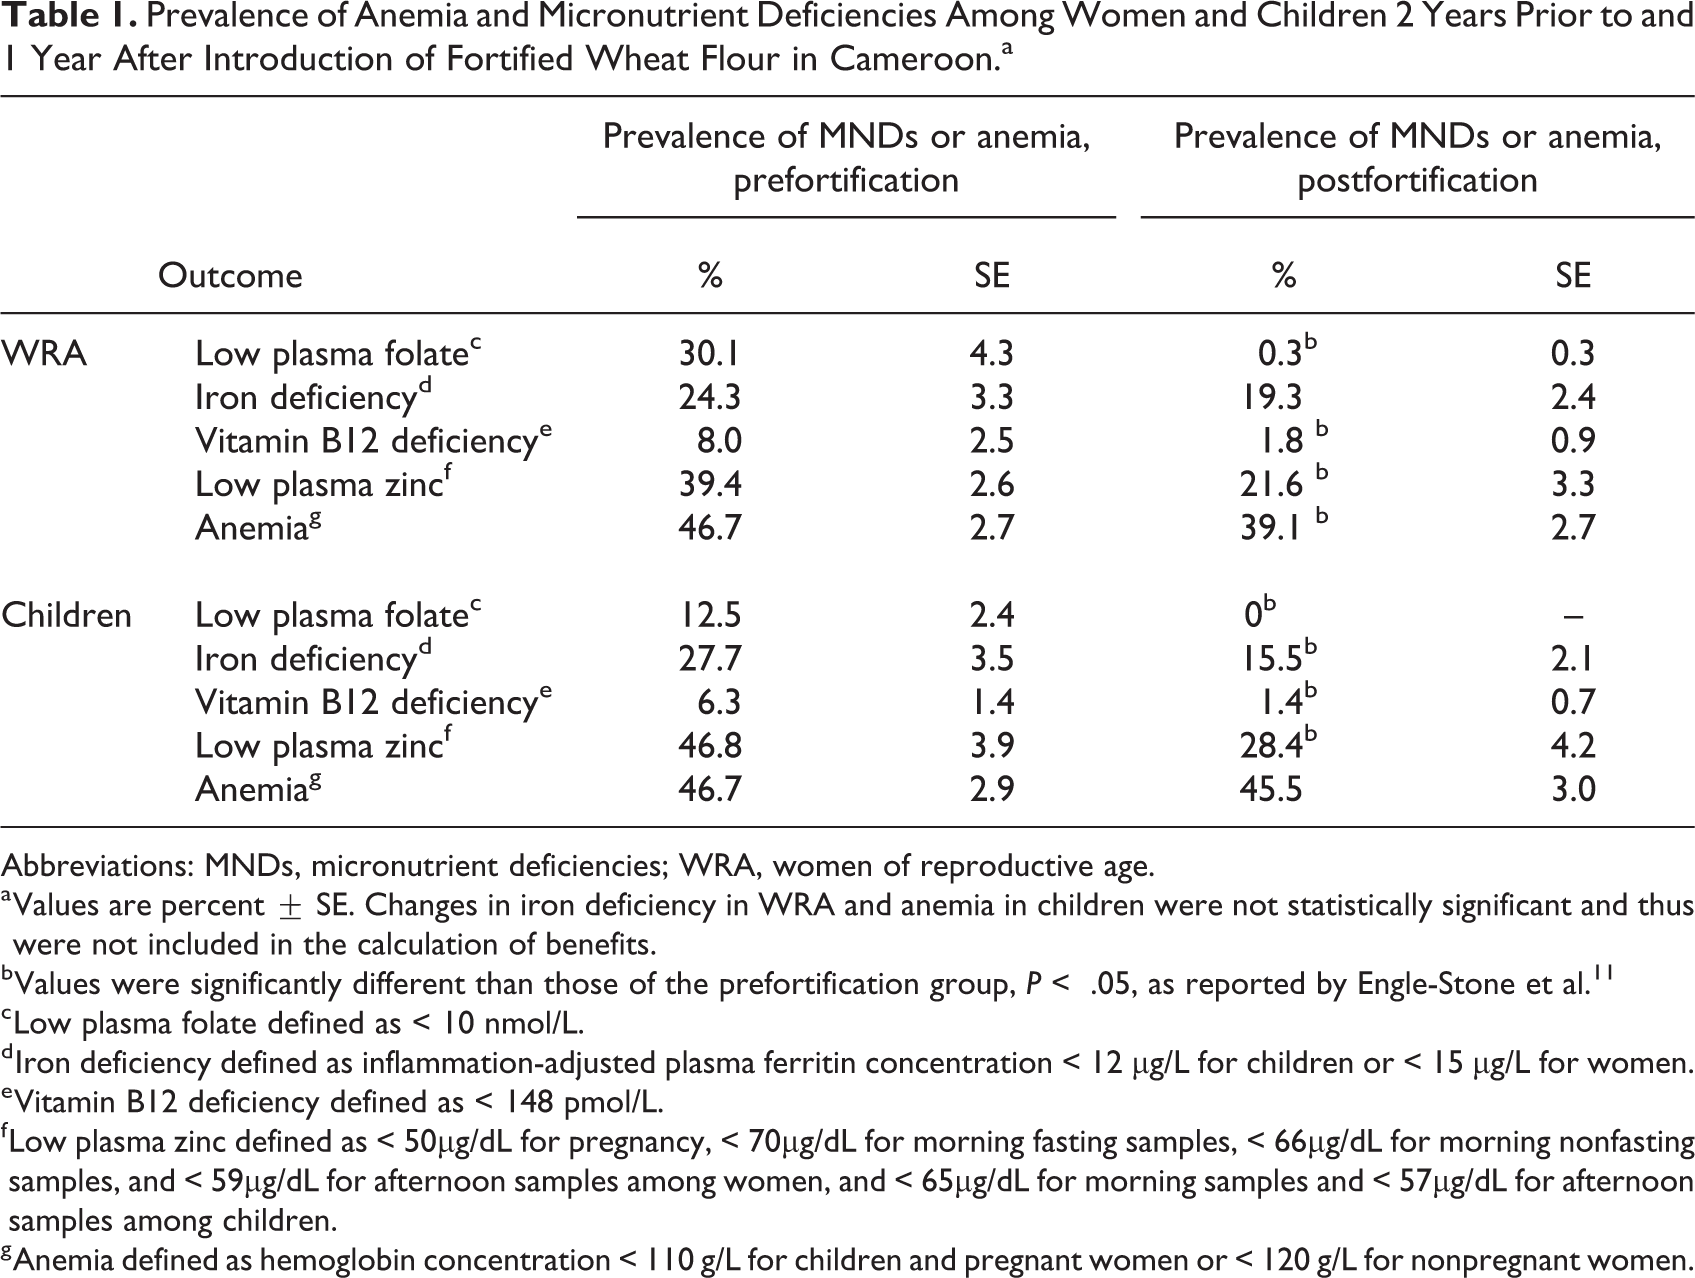
Abbreviations: MNDs, micronutrient deficiencies; WRA, women of reproductive age.
a Values are percent ± SE. Changes in iron deficiency in WRA and anemia in children were not statistically significant and thus were not included in the calculation of benefits.
b Values were significantly different than those of the prefortification group, P < .05, as reported by Engle-Stone et al. 11
c Low plasma folate defined as < 10 nmol/L.
d Iron deficiency defined as inflammation-adjusted plasma ferritin concentration < 12 µg/L for children or < 15 µg/L for women.
e Vitamin B12 deficiency defined as < 148 pmol/L.
f Low plasma zinc defined as < 50µg/dL for pregnancy, < 70µg/dL for morning fasting samples, < 66µg/dL for morning nonfasting samples, and < 59µg/dL for afternoon samples among women, and < 65µg/dL for morning samples and < 57µg/dL for afternoon samples among children.
g Anemia defined as hemoglobin concentration < 110 g/L for children and pregnant women or < 120 g/L for nonpregnant women.
For our modeling, the baseline prevalence of each outcome in 2009 was applied to each year before 2011, when fortified products were introduced. The magnitude of decrease in the postfortification prevalence (observed in 2012) was assumed to have been sustained thereafter. The outcomes included in this analysis include low plasma folate (defined as < 10 nmol/L), iron deficiency (inflammation-adjusted plasma ferritin concentration < 12 µg/L for children or < 15 µg/L for women), low plasma zinc (children: < 65 µg/dL for morning samples and < 57 µg/dL for afternoon samples; women: < 50 µg/dL for pregnant women, < 70 µg/dL for morning fasted samples, < 66 µg/dL for morning nonfasted samples, and < 59 µg/dL for afternoon samples), vitamin B12 deficiency (< 148 pmol/L), and anemia (hemoglobin concentration < 110 g/L for children and pregnant women; < 120 g/L for nonpregnant women). 8 Outcomes that were not significantly different between pre- and postfortification surveys (ie, P > .05) were not included in our analysis. For example, no statistically significant difference was observed for anemia prevalence among children, so we did not model benefits of anemia reduction among children.
Differences in prevalence of each outcome before and after flour fortification in Yaoundé and Douala were translated to number of case-years averted—and further to cost per case-year averted—by utilizing population data from the LiST extracted for the MINIMOD project. 9,13 Population estimates for WRA and children (age 6-59 months) for 2011 to 2021 were extrapolated back to 2009 for this analysis. We note that applying the cost for the full program (ie, multiple micronutrient fortification) as the numerator for each MND overestimates the cost (and thus underestimates cost-effectiveness) for that individual nutrient since the same platform actually delivers several nutrients (ie, iron, zinc, folic acid, and vitamin B12) and the amounts of all nutrients added are reflected in the premix cost. The estimates generated for cost per MND averted can be interpreted as the cost-effectiveness of the program for addressing deficiency of a single micronutrient.
Neural Tube Defect Prevalence
To our knowledge, there has not been a study to assess postfortification NTD prevalence in Cameroon. Thus, we used predictions for postfortification NTD reduction using the “Expanded LiST Model,” as described by Luo et al. 11 This predictive model accounts for the following factors: (1) annual live births and stillbirths; (2) prefortification NTD birth prevalence; (3) effective coverage of wheat flour fortification (proportion of WRA who achieve adequate folate intake due to wheat flour fortification), estimated using national dietary intake data; 7 and (4) effectiveness of fortification or supplementation for reducing NTD birth prevalence (ie, 62%, derived from meta-analyses and applied to the proportion of the population effectively covered). 11,14
We obtained estimates of annual live births in Yaoundé and Douala, Cameroon, from LiST. 13 Prefortification (1997-2006) NTD-affected live birth prevalence was determined to be 1.99 per 1000 live births in a retrospective study in selected urban areas in Cameroon. 10 Prefortification NTD stillbirth prevalence in Cameroon was unavailable and was thus estimated by applying the proportion of NTD stillbirths to NTD live births reported for sub-Saharan Africa. 15 Using this information, the predictive model estimated for Yaoundé and Douala (1) the number of NTD cases (calculated as prevalence of NTD live and still births times the number of NTD live births) and (2) the percentage of NTD cases averted (calculated as effective coverage times effectiveness) for the 10-year postfortification period. 11 Finally, we combined these estimates with total program costs for Yaoundé and Douala to calculate dollars per case of NTD averted.
The nutritional impact of fortification relies on whether the food vehicle is fortified at the target fortification levels. However, the interim evaluation study in 2012 found that the folic acid content in wheat flour was at 75% of the target fortification level (5 mg/kg), 8 and more recent data suggested that the folic acid fortification level was less than 50% of the target level. 16 Thus, to produce a more conservative estimate, we assumed for calculation of predicted NTD cases averted that wheat flour was fortified at 50% of the target level. Wheat flour fortification levels of 25%, 75%, and 100% of the target folic acid levels were also applied as a separate sensitivity analysis to estimate DALYs averted due to NTD reductions. For each scenario, we modeled effective coverage of wheat flour fortification with different levels of folic acid (eg, 25% of target, 50% of target) and used the resulting effective coverage values to model NTDs averted, as described in Luo et al. 11
Disability-Adjusted Life Years: Neural Tube Defects
Annual years of life lost (YLLs) and years lived with disability (YLDs) averted from NTDs in Yaoundé and Douala were calculated using the method described by Fox-Rushby and Hanson (with parameters K = 1, r = 0.03, and β = .04). 17 Stillbirths were assumed to represent death at age zero, where YLD = 0 and YLL = DALY. NTD-affected live births averted were broken down by NTD subtype to account for different disability weights for each subtype. Proportions of spina bifida, anencephaly, and encephalocele among NTDs averted were estimated from regional prevalence data in sub-Saharan Africa. 15 Disability weights for spina bifida and anencephaly were obtained from the Global Burden of Disease study. 18 Disability weight for encephalocele was unavailable but assumed to be equal to that for spina bifida. Given that years of disability are relatively low in these conditions due to the high case fatality rate, this assumption is unlikely to greatly influence the final estimate of DALYs.
To determine the duration of disability and life expectancy for live births, regional prevalence rates in sub-Saharan Africa were used to estimate the percentage of live birth NTDs that resulted in death under the age of 5 versus death over the age of 5 for each subtype. 15 These proportions were applied to the number of NTD live births averted in our study. We conducted a sensitivity analysis to calculate low, medium, and high estimates for deaths under age 5 and deaths over age 5. The low estimate assumed death under age 5 to occur at 5 years and death over age 5 to occur at 58 years (the average life expectancy in Cameroon for the general population). 19 The midpoint estimate assumed death under age 5 to occur at 2.5 years, and death over age 5 to occur at 26.5 years. Finally, the high estimate assumed death under age 5 to occur just after birth and death over age 5 to occur at 5 years. Both YLLs and YLDs from each subtype of NTD were ultimately combined to achieve an NTD total. Low, medium, and high estimates of DALYs were calculated for each year and, respectively, summed to generate total DALYs over the 10-year postfortification duration.
Disability-Adjusted Life Years: Anemia
Disability-adjusted life years for anemia were calculated as described above for NTDs, with the major difference being that we expressed anemia DALYs per case-year rather than per case (ie, duration of disability as 1 year), as the diagnosis is considered to represent a short-term condition, rather than a permanent condition. Given that anemia may occur or resolve at any age among WRA, the age weighting factor was set to zero. Anemia was not considered a direct cause of death in this analysis, therefore YLL = 0 and YLD = DALY.
Proportions of mild, moderate, and severe anemia were obtained from data collected in 2009 in Yaoundé and Douala. 7 Mild cases comprised 53.8% of cases, moderate cases comprised 42.9%, and 3.3% of cases were severe. Reanalysis of data from the 2012 survey suggested a shift toward a greater proportion of cases of mild anemia 8 ; however, for simplicity, cases of anemia averted were assumed to follow the same distribution of severity as observed in 2009. Disability weights for each class of severity of anemia were obtained from the Global Burden of Disease estimates. 18 Total YLDs were calculated annually (K = 0, r = 0.03, β = 0) and combined over the 13-year time frame to generate total DALYs from anemia averted.
Discounting
Total costs; total population reached; total cases of MNDs, anemia, or NTDs averted; and total DALYs averted were each discounted at 0%, 3%, and 6% as a sensitivity analysis. Discounted cost per case and cost per DALY averted were generated by matching costs and benefits with the same discount rate (ie, 6% cost/DALY is generated from 6% discounted costs and 6% discounted DALYs). The DALYs for NTDs and anemia were also discounted at a 3% rate within each year. 17
Results
The combined population of Yaoundé and Douala, Cameroon, in 2012 was 4 909 950, including 1 252 245 WRA and 538 901 children aged 6 to 59 months. The total estimated cost of the fortification program for Yaoundé and Douala over 13 years was $2 439 000 (Table 2). The cost of the flour premix alone comprised the largest portion of the total costs (77.9%), which is comparable to the percentage of total costs of flour fortification estimated for other programs. In all, 82.3% of the total costs were for ongoing costs such as annual micronutrient premix costs and routine monitoring and evaluation that happen every 3 to 5 years. The remaining 17.7% of total costs were start-up costs for monitoring/evaluation, supervision, and indirect costs of office rent and other materials.
Share of Total Fortification Program Costs Applied to Yaoundé and Douala for Start-Up and Implementation of Wheat Flour Fortification.a
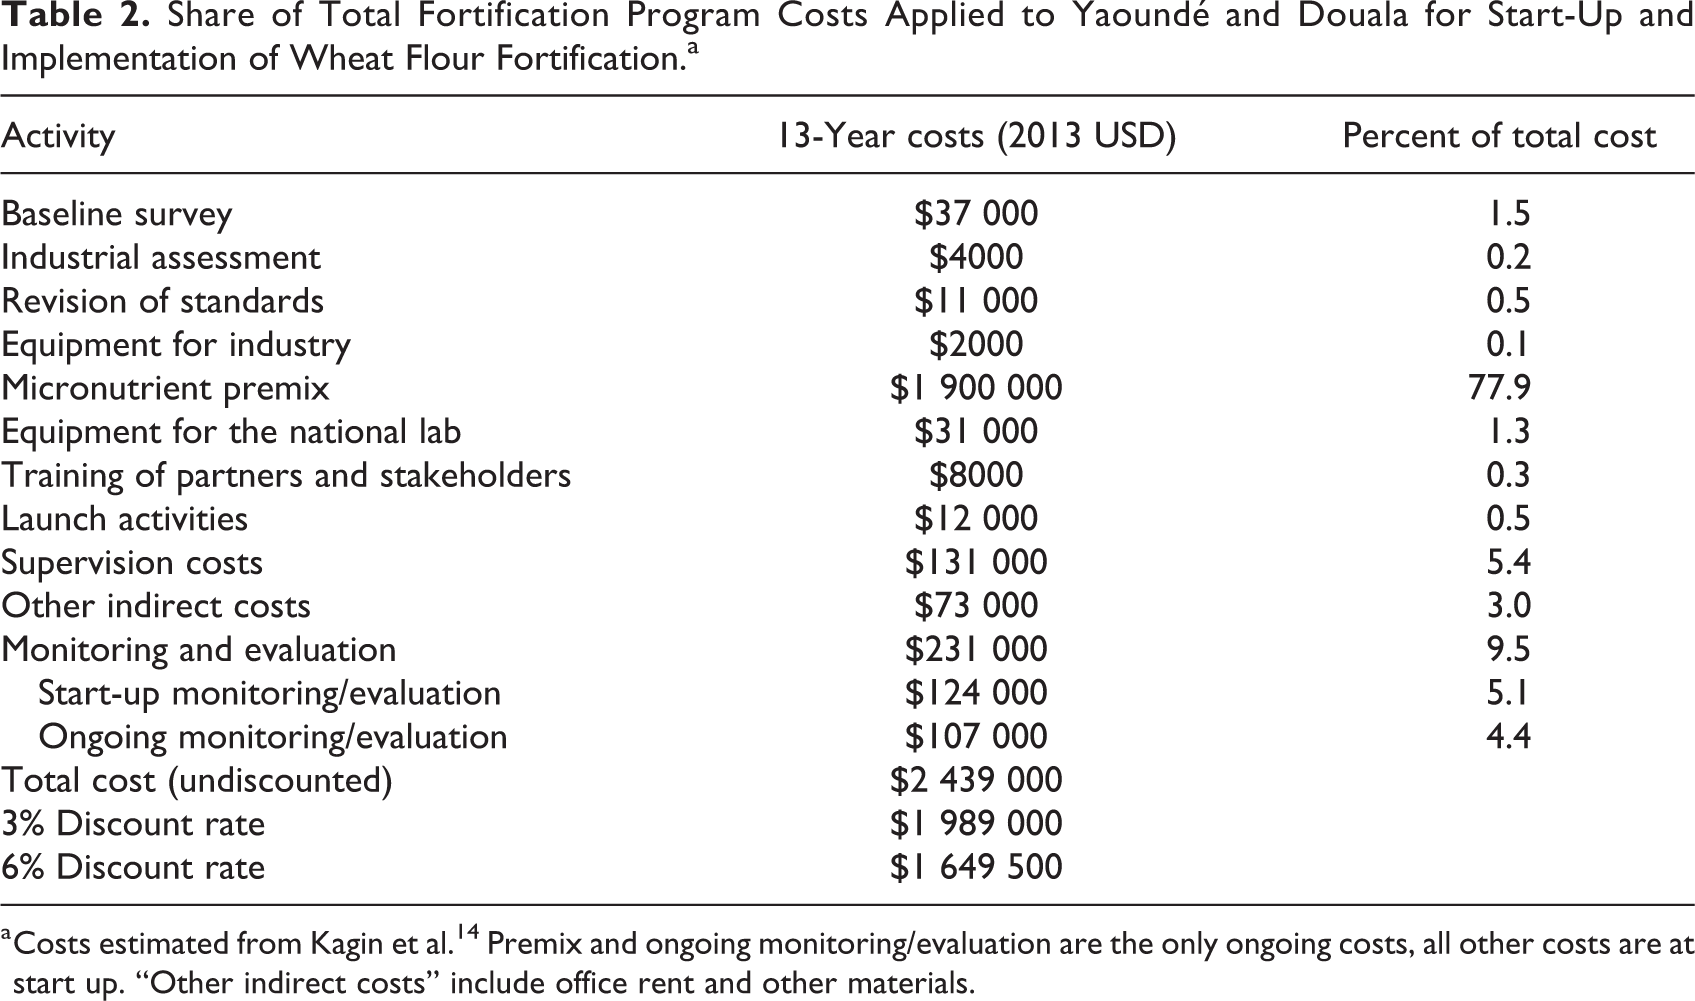
a Costs estimated from Kagin et al. 14 Premix and ongoing monitoring/evaluation are the only ongoing costs, all other costs are at start up. “Other indirect costs” include office rent and other materials.
Approximately 98% of WRA reported consuming wheat flour in the previous 7 days; based on this estimate, 1.75 million WRA and preschool children would be reached by wheat flour during the first year of the program (Table 3). In the first year of implementation, the wheat flour fortification program was also estimated to have averted more than 95 000 cases of anemia among WRA, based on the observed reduction in anemia prevalence from 46.7% to 39.1%, and 83 000 cases of iron deficiency among children (Table 4). In addition, there were large predicted reductions in the number of WRA and children with low plasma folate (440 000), vitamin B12 deficiency (100 000), and low plasma zinc (320 000). Assuming a sustained impact of the fortification program, we predicted that over 1 million case-years of anemia among WRA would be averted over the subsequent 10 years of program implementation.
Proportion and Number of Women and Preschool Children Reached by Wheat Flour Fortification in Cameroon.a
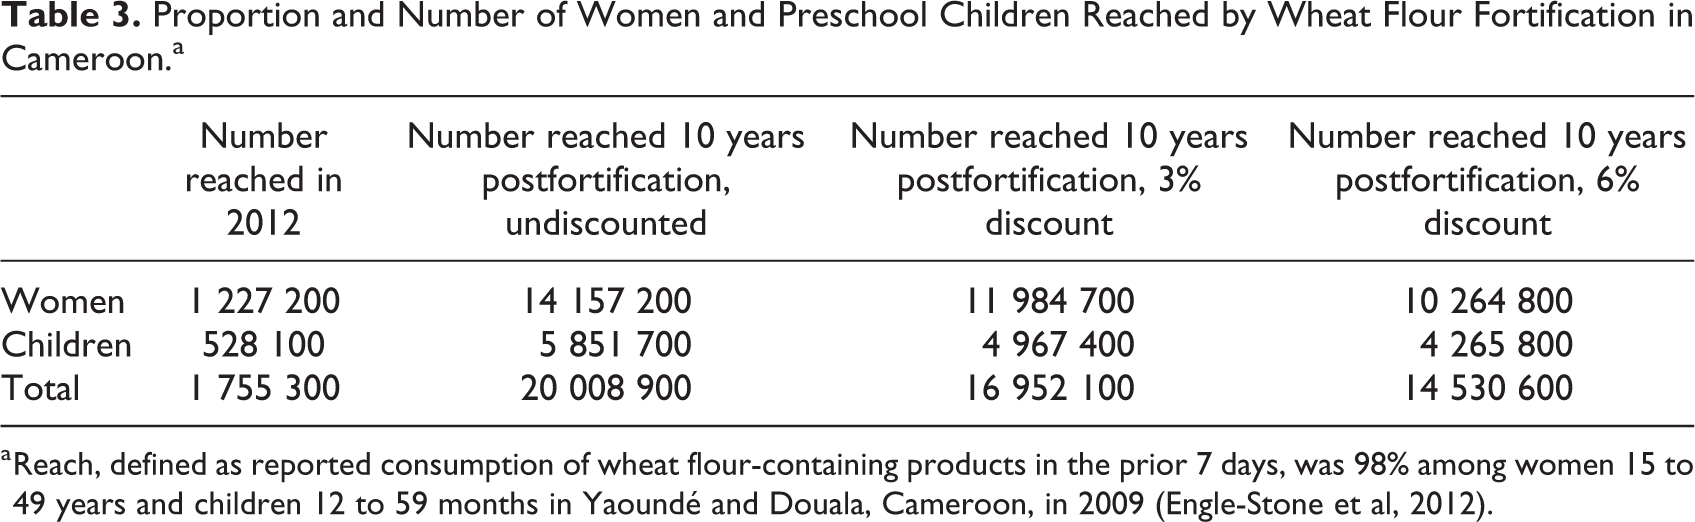
a Reach, defined as reported consumption of wheat flour-containing products in the prior 7 days, was 98% among women 15 to 49 years and children 12 to 59 months in Yaoundé and Douala, Cameroon, in 2009 (Engle-Stone et al, 2012).
Cases of Anemia and Micronutrient Deficiencies Averted in 2012 (Year 1) and Total Case-Years of Anemia and Micronutrient Deficiencies Averted 10 Years Postfortification.
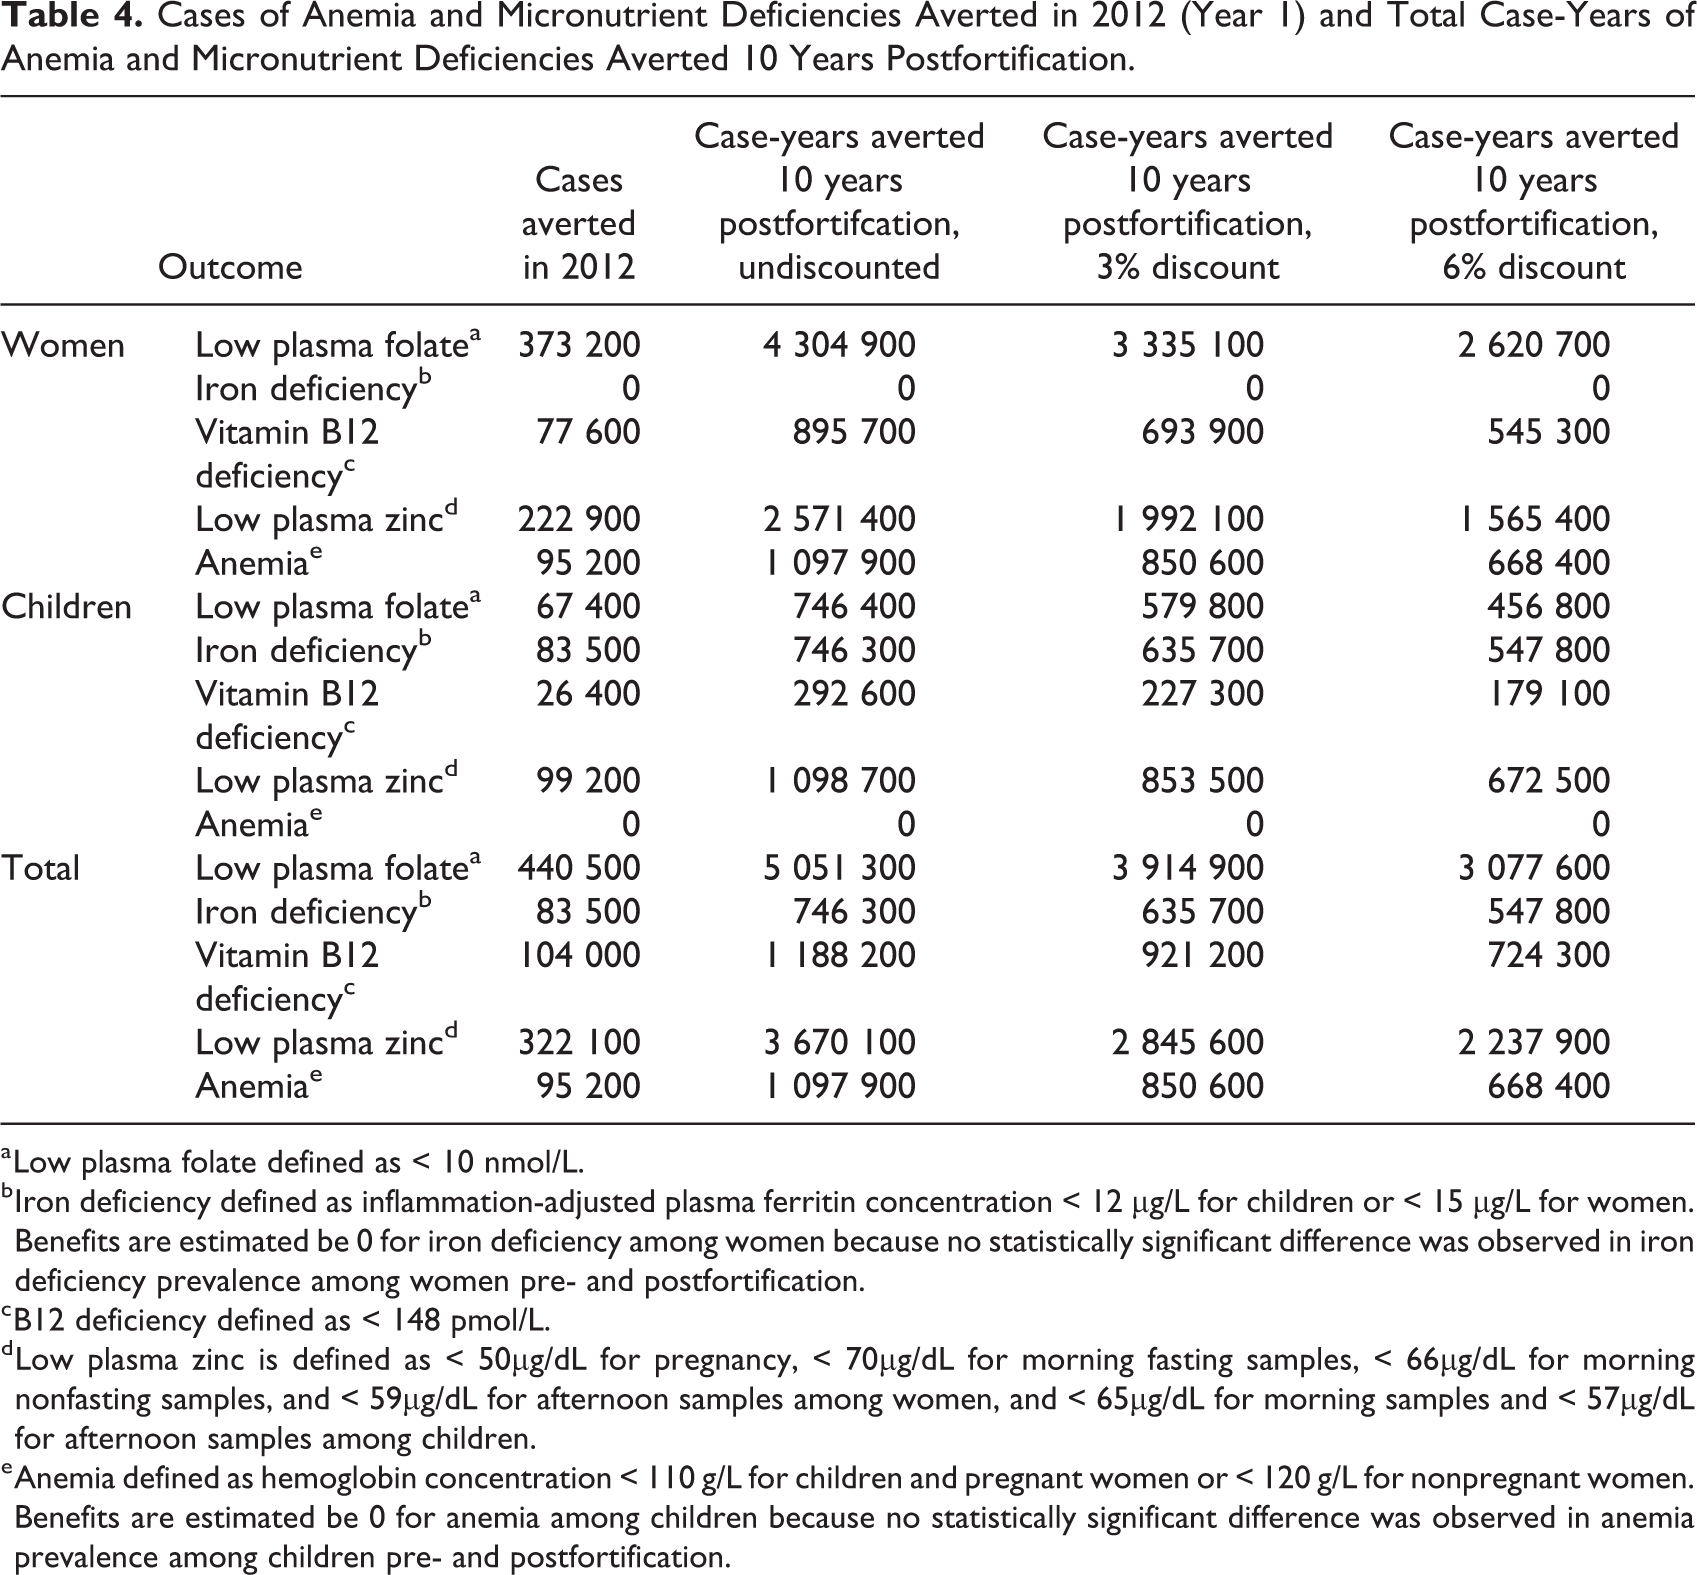
a Low plasma folate defined as < 10 nmol/L.
b Iron deficiency defined as inflammation-adjusted plasma ferritin concentration < 12 µg/L for children or < 15 µg/L for women. Benefits are estimated be 0 for iron deficiency among women because no statistically significant difference was observed in iron deficiency prevalence among women pre- and postfortification.
c B12 deficiency defined as < 148 pmol/L.
d Low plasma zinc is defined as < 50µg/dL for pregnancy, < 70µg/dL for morning fasting samples, < 66µg/dL for morning nonfasting samples, and < 59µg/dL for afternoon samples among women, and < 65µg/dL for morning samples and < 57µg/dL for afternoon samples among children.
e Anemia defined as hemoglobin concentration < 110 g/L for children and pregnant women or < 120 g/L for nonpregnant women. Benefits are estimated be 0 for anemia among children because no statistically significant difference was observed in anemia prevalence among children pre- and postfortification.
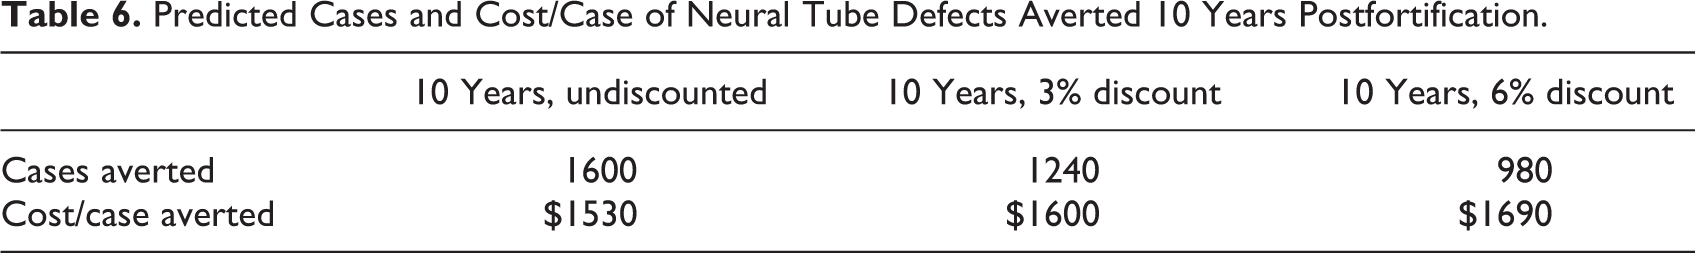
Over 10 years, the program was predicted to cost $0.12 total per woman or child reached (Table 5). The cost per case-year of MND averted is also presented in Table 5; total program cost are applied to each nutrient, attributing the cost to implement a program to that nutrient alone. Low plasma folate averted was predicted to be the most cost-effective outcome for WRA and children combined ($0.49/case-year) and iron deficiency averted was the least cost-effective ($3.27/case-year). In addition, the program was predicted to avert 1600 NTD cases over 10 years, costing $1530 each (Table 6). This corresponds to 49 310 DALYs of NTD averted with a range of 48 500 to 50 040 DALYs based on optimistic and conservative estimations of life expectancy and duration of disability, as described in “Methods” section (Table 7). Each DALY averted due to NTDs was estimated to cost $49.50 ($48.70-$50.30, depending on the assumptions used in calculating DALYs). An additional 21 310 DALYs are predicted to have been averted from anemia among WRA, costing $114.50 per DALY (Table 7). In total, an estimated 70 620 (69 810-71 350) DALYs were averted from anemia and NTDs combined, at an average cost of $34.50 ($34.20-$34.90) per DALY.
Cost Per Individual Reached and Cost Per Case-Year of Micronutrient Deficiencies and Anemia Averted 10 Years Postfortification, in USD (2013).
a Both costs and benefits are discounted.
b Low plasma folate defined as < 10 nmol/L.
c Iron deficiency defined as inflammation-adjusted plasma ferritin concentration < 12 µg/L for children or < 15 µg/L for women.
d Changes in iron deficiency among women and anemia among children were nonsignificant and not included in the analysis.
e B12 deficiency defined as < 148 pmol/L.
f Low plasma zinc is defined as < 50µg/dL for pregnancy, < 70µg/dL for morning fasting samples, < 66µg/dL for morning nonfasting samples, and < 59µg/dL for afternoon samples among women, and < 65µg/dL for morning samples and < 57µg/dL for afternoon samples among children.
g Anemia defined as hemoglobin concentration < 110 g/L for children and pregnant women or < 120 g/L for nonpregnant women.
Predicted Cases and Cost/Case of Neural Tube Defects Averted 10 Years Postfortification.
Years of Life Lost, Years Lived With Disability, Total Disability-Adjusted Life Years, and Cost per Disability-Adjusted Life Year Averted for Wheat Flour Fortification With Iron and Folic Acid in Cameroon.a
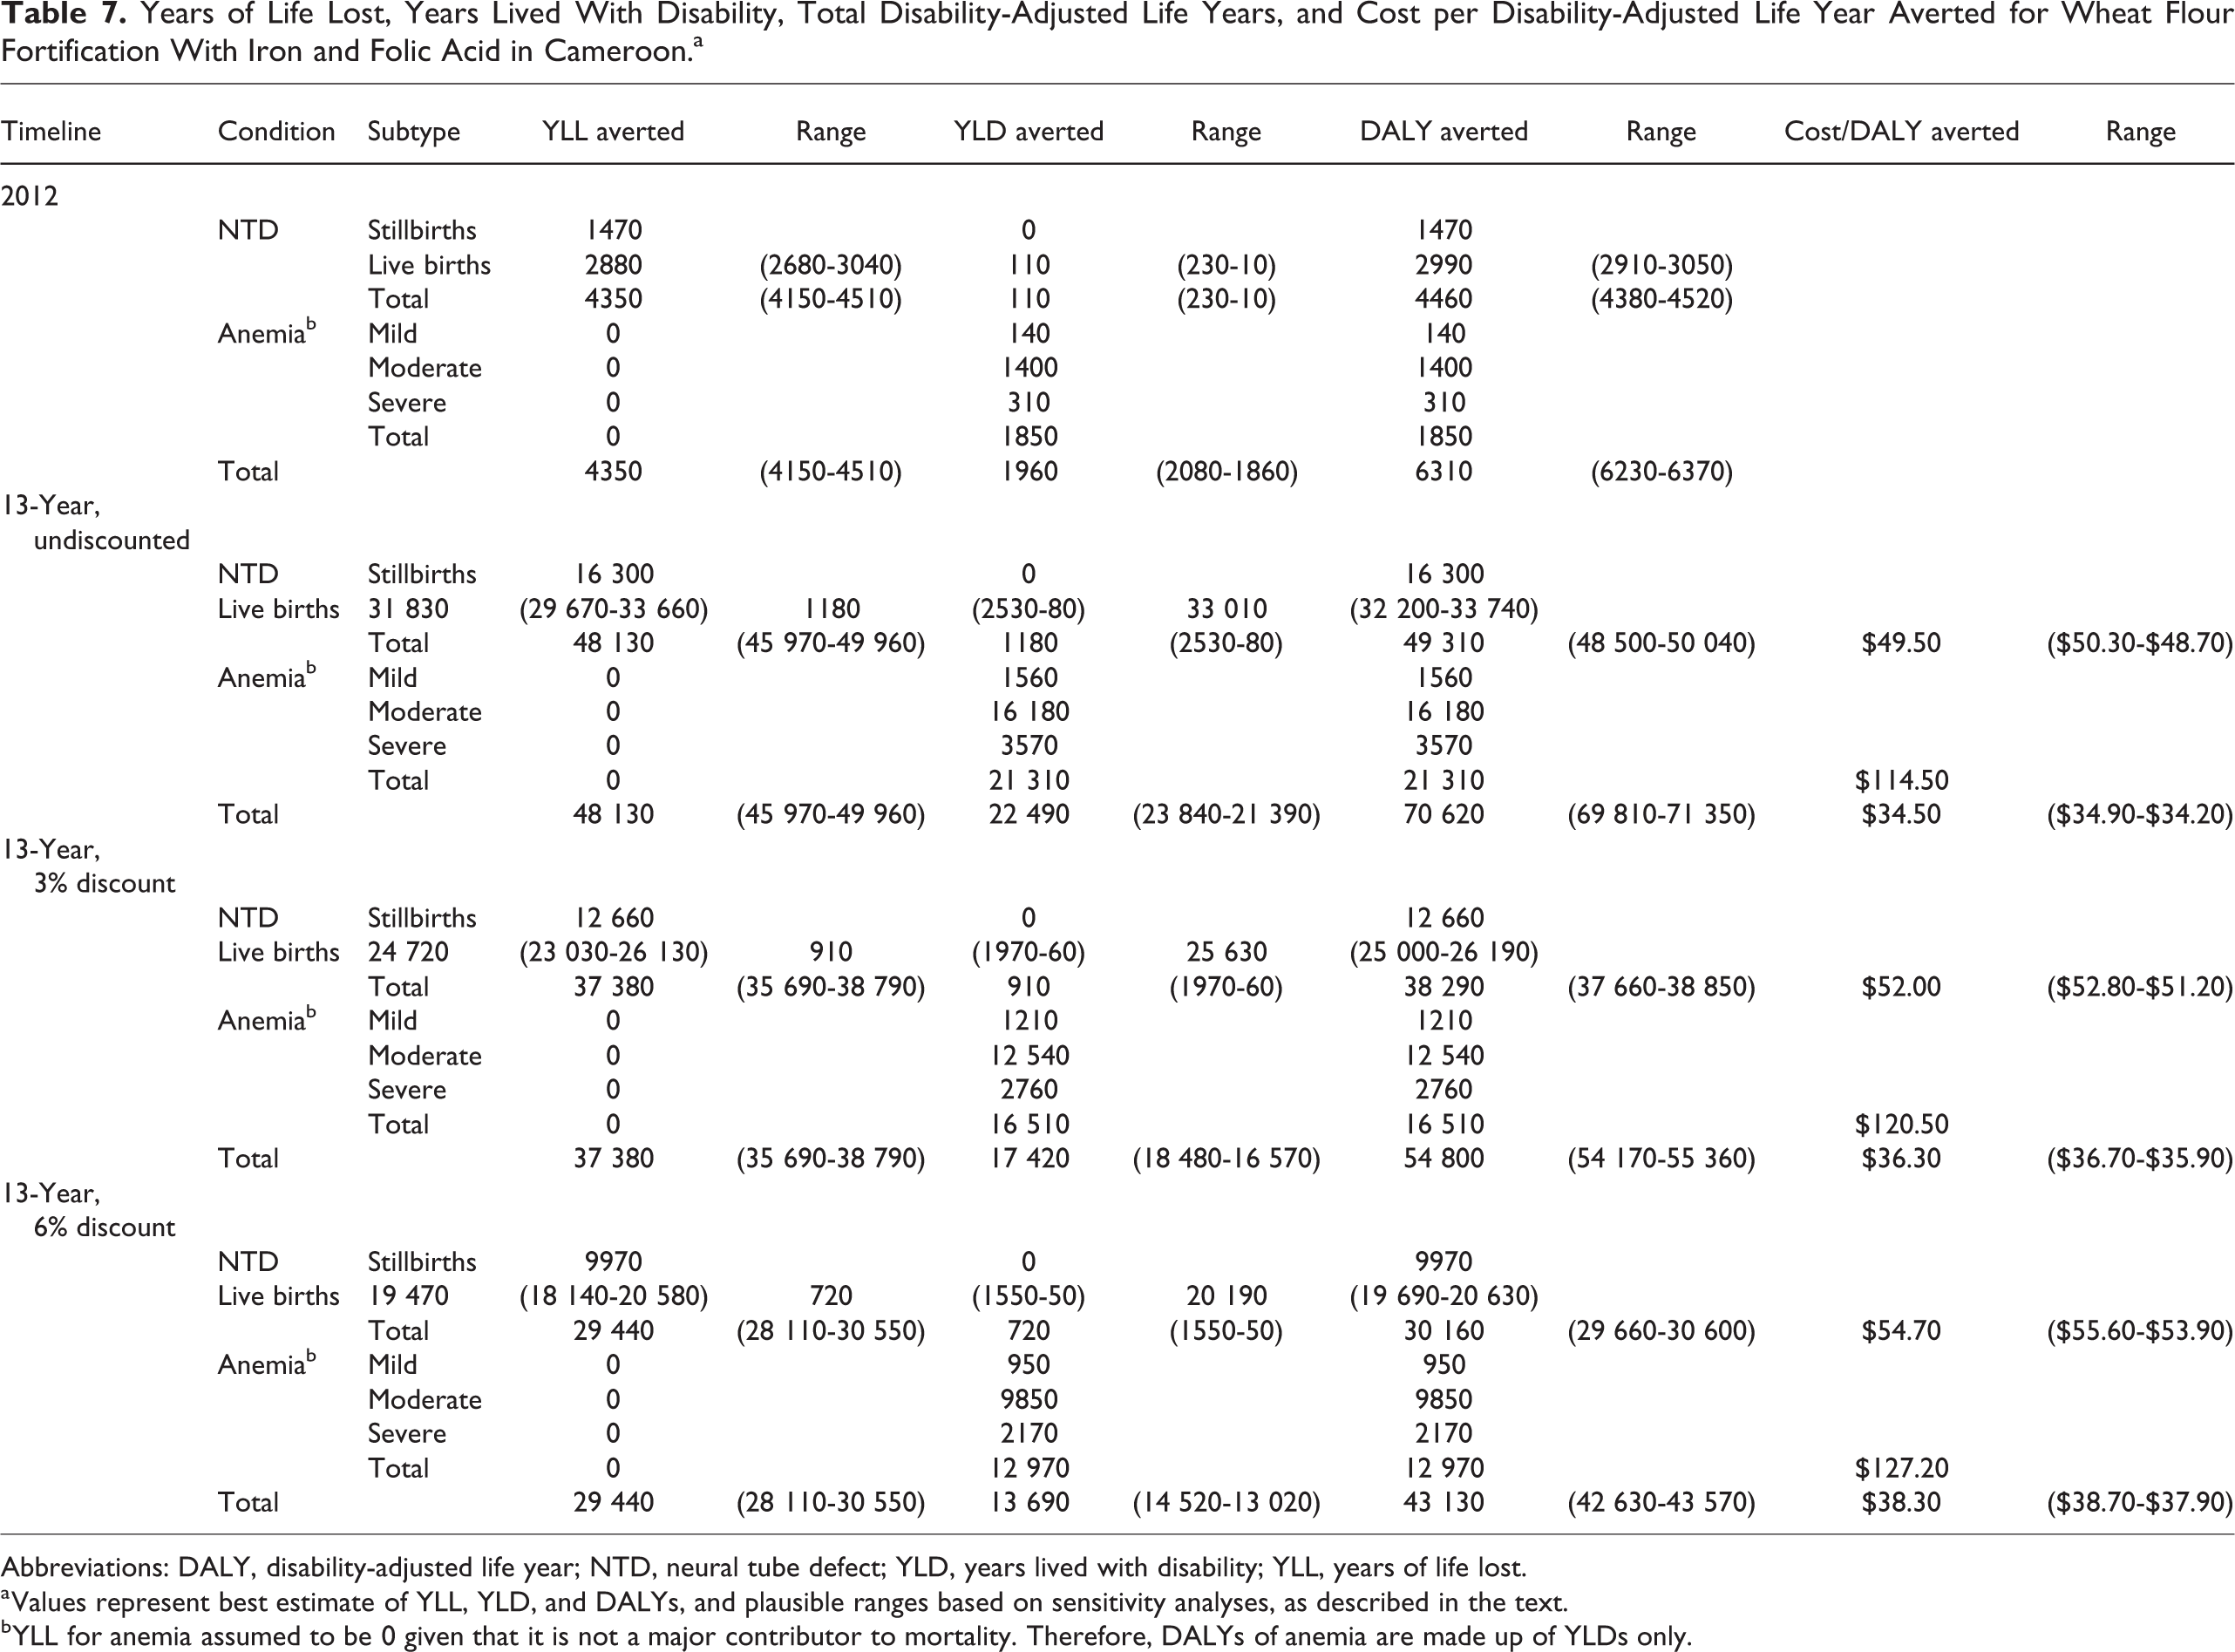
Abbreviations: DALY, disability-adjusted life year; NTD, neural tube defect; YLD, years lived with disability; YLL, years of life lost.
a Values represent best estimate of YLL, YLD, and DALYs, and plausible ranges based on sensitivity analyses, as described in the text.
b YLL for anemia assumed to be 0 given that it is not a major contributor to mortality. Therefore, DALYs of anemia are made up of YLDs only.
If all wheat flour were fortified at 100% of target levels throughout the modeled time period, instead of 50% of the target levels, an estimated 55 050 DALYs from NTD would be averted at a cost of $44.30/DALY assuming that program costs remained the same (Table 8). In contrast, wheat flour fortified at only 25% of target levels would avert 36 700 DALYs ($66.50/DALY).
Cases, DALYs, and Cost/DALY of NTDs Averted Assuming Wheat Flour Fortification With Folic Acid at Varying Proportions of the Target Concentration.a
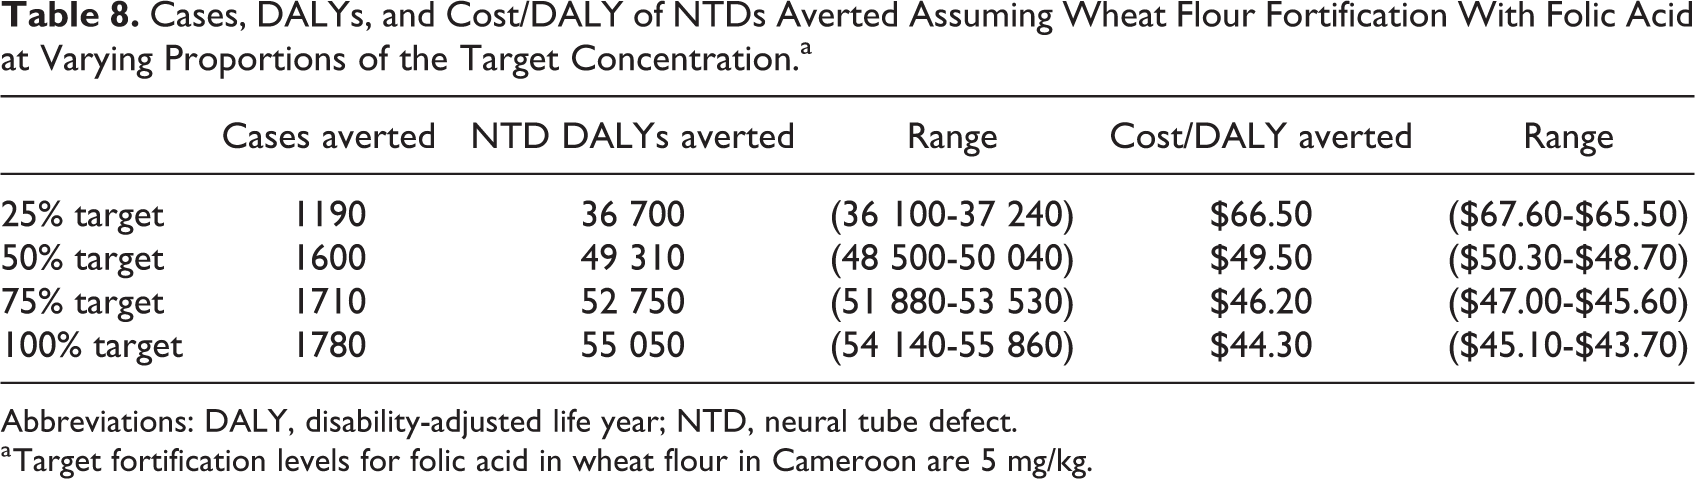
Abbreviations: DALY, disability-adjusted life year; NTD, neural tube defect.
a Target fortification levels for folic acid in wheat flour in Cameroon are 5 mg/kg.
Discussion
We predicted the effects and cost-effectiveness of wheat flour fortification in Cameroon for reducing MND and disabilities due to anemia and NTDs over a 13-year period, including 3 years of program start-up and 10 years of program implementation. While the program was estimated to cost $0.12 per woman or child reached, the cost-effectiveness for achieving other outcomes differed substantially: The cost per MND averted ranged from $0.48 to $3.27 per case-year averted, depending on the nutrient and target group (WRA or child). In addition, reduction in anemia cases among women was estimated to cost $2.22 per case averted, the cost per case of NTD averted was estimated at $1530 per case averted, and the cost for reducing DALYs from anemia and NTDs was $114.50/DALY averted and $49.50/DALY averted, respectively. Despite methodological differences among studies, as described below, our analysis is consistent with other literature suggesting that industrial food fortification is cost-effective relative to other nutrition and health interventions. 4 -6,20 In addition, the estimates of cost per MND case-year and DALY averted are substantially less than the GNI per capita of Cameroon ($3640 in 2017), meeting criteria for a “very cost-effective” intervention as defined by the WHO. 21 Moreover, they are below the standard threshold of $150/DALY averted (∼$220 current value) suggested by the World Bank. 22 Since nearly one-fifth of program costs were at start-up, we anticipate the cost–benefit will become increasingly favorable with each year, if the estimated program impacts are sustained.
Our estimate of cost per person reached is consistent with prior estimates of $0.01 for folic acid fortification, $0.20 for vitamin A supplementation, and $0.10 to $0.12 for iron fortification. 6 However, this study and prior work also showed that the cost-effectiveness estimates for a given intervention program are different when alternative outcome measures are examined; in some cases, the ranking of cost-effectiveness among programs changed as the “definition of success” changed. 9 This finding is expected, as only a subset of those reached would be expected to experience deficiency that is resolved by food fortification and indicates that policy makers and their advisors must consider the ultimate goals of the program in deciding which outcome is most appropriate for their situation and hence which “definition of success” is most appropriate for a CEA.
Because few CEA of food fortification present estimates of cost per case of MND averted, it is difficult to compare our results with others. However, other studies have presented CEAs using outcomes meant to capture the health impact of micronutrient interventions. 23,24 One analysis estimated that the hypothetical cost per case of scurvy averted can range widely from $158 to $1200, depending on the target population. 23 This high cost is not surprising considering the rare occurrence of scurvy, and low number of vitamin C–deficient beneficiaries that would be served by vitamin C fortification. In addition, antenatal micronutrient supplementation in low- and middle-income countries was estimated to cost $39 to $85 per case of adverse pregnancy outcome averted. 24 Though imperfect comparisons, our results suggest that large-scale fortification is a cost-effective means for reducing MND and associated health effects.
Disability-adjusted life years are widely accepted as a measure of disease burden that can be used to compare and prioritize across health interventions. Our estimate of $114.50/DALY averted for anemia is slightly greater than that reported in other studies of large-scale food fortification. For example, a study in China reported that iron fortification cost $66/DALY averted and iron supplementation cost $179/DALY for an observed reduction of iron deficiency. 25 A study in Tanzania showed that iron supplementation was highly cost-effective in preventing severe anemia at $21/DALY averted. 26 Other literature suggests that micronutrient interventions generally cost $50 to $100/DALY averted 20 and thus are considered “very cost-effective” according to the WHO definition. 21 The higher cost per DALY averted in this analysis could be because our predictions rely on observed changes after implementation of wheat flour fortification, whereas studies that apply effect sizes from controlled efficacy trials may result in optimistic predictions of the impact of a large-scale program. In practice, cost-effectiveness may also differ between urban and rural areas, or by other subnational designations that are associated with the reach, effective coverage, or levels of compliance of fortified foods. We note that the somewhat low compliance rates observed for folic acid concentrations also apply to the other nutrients included in wheat flour (∼75% of target 8 ), so greater compliance might have been expected to yield greater impacts on micronutrient status and possibly anemia prevalence. As a result, because the cost estimates were based on the cost of the target amounts of premix, our results may slightly underestimate the cost-effectiveness of fortification at target levels. Importantly, the model assumes that the same effects on micronutrient status are sustained over time, so ensuring program compliance is critical to realize the predicted benefits.
Given the low birth prevalence of NTD in comparison with conditions such as anemia, the cost to avert one case is relatively high at $1530. However, the heavy burden associated with each case of NTD results in a low cost per DALY averted ($49.50/DALY). Our result is comparable to that of an ex poste study in Chile that reported $89/DALY of NTD averted in a similar fortification program. 27 Estimates for a hypothetical folic acid fortification program in Zambia, based on data from South Africa, indicated a cost of $14.90/DALY averted; however, sensitivity analyses included an estimate of $46.86/DALY, which is similar to our results. 5 The lower hypothetical cost per DALY averted of Zambia can be explained by several variables. First, their methods apply data from South Africa — where significant reduction in NTD prevalence has been documented — to Zambia, where folic acid fortification is not mandated, which could overestimate the impact of the program if fortification compliance is below targets (as we assumed in this analysis for Cameroon). Second, the analysis for Zambia assumed that all NTD cases result in immediate death, which would result in a greater number of DALYs per case averted, compared to our method, which considered cases of survival below and beyond 5 years.
Strengths of our analysis in comparison to other CEA calculations include the availability of data on observed changes in MND and anemia prevalence after food fortification, detailed dietary intake data to predict the change in NTD prevalence, and program budgets to inform cost predictions. However, there are also several limitations, including those related to the data inputs. As with any modeling exercise, there are numerous sources of uncertainty; thus, the point estimates calculated here should be interpreted with caution. Although statistical CIs were available for some modeling inputs (such as MND prevalence or reach); for others, notably program costs, only single estimates are available so we could not calculate true CIs for the cost-effectiveness estimates. Where possible, however, we included sensitivity analyses to assess the extent to which certain assumptions were likely to affect the conclusions.
We limited the geographic scope of our analysis to 2 major urban areas of Yaoundé and Douala, consistent with availability of information on MND before and after fortification. However, industrial food fortification is typically implemented at the national level, so we needed to apply assumptions to estimate the cost of regional program from national cost data. While this is not a realistic situation since fortification programs are rarely regional in scope, since the cost of micronutrient pre-mix made up nearly 80% of total program costs, we considered that dividing total national costs based on regional wheat flour consumption was appropriate to generate cost-effectiveness estimates for the urban region studied.
Additionally, the estimates of change in micronutrient status come from pre-post cross-sectional surveys, so one cannot be certain that the observed changes were attributable to the fortification program. In particular, we assumed that the change in anemia prevalence among women was attributable to the nutrients provided by wheat flour (primarily iron, but theoretically also vitamin B12 and folic acid), recognizing that anemia has numerous causes, including malaria in this setting. However, plausibility analyses of the data suggest that it was reasonable to conclude that the observed changes were attributable. 8 For example, frequency of wheat flour consumption was associated with plasma vitamin B12 concentrations among both WRA and children after fortification was in place, but this association was not observed 1 year earlier, prior to initiation of wheat flour fortification with vitamin B12. We are not aware of other large-scale interventions or policies that were implemented around the same time frame and would have influenced micronutrient status or anemia prevalence; nevertheless, there remains the possibility that other interventions or secular changes in dietary patterns may have contributed to the observed differences.
An additional limitation is that data on erythrocyte folate concentration were not available, which would enhance the estimation of NTD risk. Instead, we relied on predictions of the number of NTD cases averted using an expanded version of the LiST model analysis, as described by Luo and colleagues. 11 This method has the advantage of using detailed dietary intake analyses to determine the proportion of the population affected, but a limitation is that it applies a fixed percent reduction in NTDs based on meta-analysis of existing studies and does not take into account estimation of “folic acid-preventable” NTDs. 11,28 The conclusions of a review of NTD predictive models suggested that this is a reasonable choice for settings in which data on erythrocyte folate concentrations are not available. 11 Thus, we applied our best estimate using the limited data available, but further studies must be done to validate these findings.
In calculating DALYs for anemia, we assumed that the change in anemia prevalence among women was attributable to the micronutrients provided by the fortification program (as noted above), and, further, the distribution of severity of anemia cases averted is proportional to the distribution of severity of anemia cases in the population. With this approach, estimation of DALYs does not take into account improvement in the severity of anemia. For example, no DALYS would be averted if a moderate case becomes a mild case; this may have led to an underestimation of benefits. On the other hand, if only cases of mild anemia are averted by an iron intervention (eg, if severe anemia is mainly caused by infections such as malaria rather than iron deficiency), then this approach would overestimate the disability burden since the disability weight for mild anemia is much smaller than that for severe anemia (although severe anemia represented only 3% of cases).
Finally, the results of this study assume that the fortification program continues to be implemented as observed in 2012. However, more recent data suggest that the concentrations of micronutrients in wheat flour dropped from 75% to less than 50%, 16 which has implications for the effectiveness and cost-effectiveness of the program—even at a lower percentage of fortification, the result is a less cost-effective fortification program. To produce a conservative estimate, the NTD predictions used for our analysis assumed that flour was fortified at 50% of target fortification levels. However, if the coverage rate continues to decline, then the fortification program will become less cost-effective. This observation emphasizes the importance of quality of implementation of a fortification program, consistent with a recent review that concluded that continued interest and investment by governments are required to ensure sustained impact of efficient and cost-effective food fortification programs and that there is room for improvement in coverage and quality of delivery, as well as measuring progress of national programs. 29
Conclusion
This modeling analysis indicates that, according to thresholds suggested by WHO, wheat flour fortification in Cameroon is a very cost-effective means of reducing the disease burden of MNDs, anemia, and NTDs in the country. Based on observed changes 1 year into the program, the cost-effectiveness ranged from $0.12 per individual reached and from $0.49 to $3.27 per case-year of MND averted, depending on the micronutrient assessed. The program was also estimated to cost $48.70 to $50.30/DALY averted due to NTDs and $114.50/DALY averted due to anemia. Sustained monitoring and support to the program are needed to ensure that these benefits are maintained. Policy makers and their advisors should consider the costs, benefits, and co-benefits associated with micronutrient intervention programs in making their decisions.
Footnotes
Authors’ Note
AN, BW, HL, JK, SV, and RES designed the analysis; JK, AN, JGA, MN, and RES contributed to data acquisition; AN, BW, HL, and JK analyzed data; AN and BW drafted the article; all authors contributed to data interpretation and critically reviewed the manuscript.
Acknowledgments
The authors thank Kenneth Brown (UC Davis) and Ann Tarini (Independent Consultant) for helpful comments on preliminary results, Katherine Adams (UC Davis) for guidance on DALY calculations, and Adrienne Clermont and Victoria Chou (Johns Hopkins University) for assistance with population numbers from LiST.
Declaration of Conflicting Interests
The author(s) declared no potential conflicts of interest with respect to the research, authorship, and/or publication of this article.
Funding
The author(s) disclosed receipt of the following financial support for the research, authorship, and/or publication of this article: The analysis was supported by the Bill & Melinda Gates Foundation (#1170661) and the UC Davis Medical Student Research Fellowship (AN and BW).