
Abstract
Background:
Substantial evidence is emerging on the coexistence of double burden of malnutrition on adolescents of low-income countries, shaping the health challenges of the upcoming adult generation for the worst. Whether nutritional status markers of adolescents in the cash crop setting are on par with economic gains remains uncertain. Thus, we investigated the nutritional outcomes of adolescents and their determinants in coffee farming households.
Methods:
The survey was carried out in 3 top coffee-producing districts of Jimma Zone, Ethiopia. Five hundred fifty mothers/caregivers and their respective adolescents were selected using multistage random sampling. Anthropometric data were converted into height-for-age and body-mass-index-for-age Z scores using WHO Anthroplus software and analyzed by SPSS for windows.
Results:
Prevalence of thinness, stunting, and overweight/obesity were 11.6%, 15.6%, and 7.1%, respectively. The odds of stunting among adolescents in households in the lowest wealth tertile was nearly 6-fold higher compared to the highest tertile (adjusted odds ratio [AOR] = 5.6 [2.6-12]). Conversely, the odds of overweight/obesity was higher among adolescents in the households in the middle wealth tertile (AOR = 2.72 [1.08-6.86]) compared to the highest tertile. Adolescents living in households with low-dependent age-groups were more than twice likely to be overweight/obese (AOR = 2.58 [1.06-6.24]).
Conclusion:
The current study revealed the presence of substantial dual burden of malnutrition. In such a setting, it is critical to draw a fine line and trade-off for eliminating morbidity and mortality of undernutrition, without triggering the risk of overweight/obesity.
Introduction
Although adolescents are future adults, they are the most neglected segment of the population in health nutrition programs of developing countries. 1 These are the subset of children whose age ranges from 10 to 19 years. 2 Adolescents in sub-Saharan Africa make up the greatest proportion of the population (23%), which is about twice that of industrialized countries. 3 In Ethiopia, adolescents constitute a quarter of the total population. 4 According to the World Health Organization (WHO), interest in adolescents’ health is relatively recent, and a focus on their nutrition is even more recent. 1 Conversely, the rate of growth during adolescence is the second fastest, preceded only by growth that occurs in the first 1000 days of life, implying the need for direct nutrition intervention for this age-group. 1,5 Adolescence is not only a time for tremendous growth but also a time of considerable risk, though this is often ignored from the care continuum of childhood as well as adulthood. 1,6
Optimal nutrition during adolescence is a prerequisite for proper physical, mental, and social development. 7 On the other hand, nutritional deficiencies induce reductive adaptation that plays against the attainment of maximal growth potential. 1,5,7 More specifically, suboptimal nutrition during adolescence results in delayed pubertal development, delayed sexual maturation, and slower linear growth. 7 -9 During the growth spurt years of adolescence, growing boys can achieve a linear growth of 9.5 cm/year while girls 8.3 cm per year. 10 They also experience a significant increase in weight, which is estimated as nearly half of one’s adult body weight. This rapid growth can be taken as a window of opportunity compensating for early childhood growth failure. 11 It is a time when the backlog of early childhood undernutrition is redeemed to break intergenerational consequences of malnutrition. There is substantial evidence of occurrence of catch-up growth in adolescents which is adopted in affluent settings. 12 The real question regarding catch-up growth during adolescence is not about the possibility, rather it is about the extent to which it happens, 11,12 which reaffirms the need for strengthening nutrition interventions in this age-group.
Despite economic disadvantages in sub-Saharan Africa, considerable evidence is emerging on the coexistence of contrasting extremes of malnutrition among adolescents. 13 -16 The existing stressed health-care system due to infectious diseases is further challenged by both under- and overnutrition, a novel public health encounter called “dual burden” of malnutrition. 14 -16 It is imperative to strike a balance between eliminating morbidity and mortality of undernutrition among adolescents on one hand and avoiding the emergence of overweight and obesity on the other. Looking at specific forms of undernutrition, stunting in Africa remains pervasively unchanged, and projections for 2020 suggest that the situation will not be improved substantially. 17 Rather, there is an indication that childhood obesity is on the rise in Africa. According to WHO, the estimated prevalence of childhood overweight and obesity in Africa was 8.5% in 2010 and is expected to reach 12.7% in 2020. 18 Although there is lack of comprehensive data on the prevalence of overweight/obesity among adolescents in Africa, some reports show that the current prevalence ranges from 0.6% to 20%. 19,20
Although Ethiopia succeeded in reducing child mortality through the era of the Millennium Development Goal, it is now facing an emerging dual burden of malnutrition. The country does not have well-documented adolescent anthropometry survey data. The only available adolescent baseline survey of 2009 covers adolescent girls aged 13 to 19 years. In this report, 23% of adolescent girls were stunted, and 14% had a low body mass index (BMI) for age. 21 Studies on adolescence nutrition and its context-specific predictors in a cash crop farming setting of Ethiopia are not available so far. Pocket studies in the general population showed a prevalence of thinness among adolescents, ranging from 19.7% to 83%, 22 -26 stunting of 16% to 28.5%, 22 -24 and overweight or obesity of 2.0% to 16.7%. 26 -30 Gender, age, residence, and educational status of the adolescent as well as their parents, age of the child, household wealth index, and family size were the most commonly reported socioeconomic determinants in the above studies. 22 -30
Nutritional outcomes of adolescents within the cash cropping households may not be in the same pace and direction with economic gains. 31 -35 In the developing countries’ context, answers to classic inquiries, surrounding whether cash crop livelihood leads to better nutrition or not remains unanswered. 34 -36 Consequently, we formulate 2 contrasting hypotheses while conducting this study. First, since cash crop (coffee) is not edible and food is accessed through cash, adolescents could be at risk of undernutrition as cash is usually handled by adult males. Conversely, cash crop could be an opportunity for adolescents to generate their own income, which may enable them to have access to commercialized processed foods, leading to overweight and or obesity. Thus, this study documented the dual burden of malnutrition and its socioeconomic determinants among adolescents of coffee farming households in the southwest of Ethiopia.
Methods and Materials
Study Setting and Design
A community-based cross-sectional study was carried out among randomly selected coffee-producing districts (“woredas”) of Jimma Zone in the southwestern Ethiopia. The study settings (Mana, Gomma, and Limu kosa) were selected to represent 30% of dominantly coffee-producing farming woredas. Jimma Zone, which is believed to be the birthplace of coffee, is contributing the major share the export of coffee arabica, in Ethiopia. 37 Organic coffee of Jimma Zone is the backbone of foreign exchange of the country, contributing about 4.2% of the total world coffee production, sustaining 15 million Ethiopians in its economic chain. 38 The zone covers a total area of 15 569 km 2 and has a reliable good rain ranging from 1200 to 2800 mm per annum. Coffee farming is the most favored and the dominant form of livelihood in the zone, which has suitable agroecological setting rated the lowest drought risk in the country. 39
Sample Size and Sampling Procedure
The sample size was calculated using the WHO Epi info Version 7, Centers for Disease Control and Prevention, Atlanta, USA open-source sample size calculator, assuming a prevalence of adolescent stunting to be 23%, 21 a design effect of 2, and a margin of error of 0.05. After adjusting for 5% of nonresponse rate, and a sample of 572 was estimated to give us a power of 80. Being an adolescent member of a permanently registered resident farming household of the woredas was the inclusion criteria, while adolescents with severe acute malnutrition, severe illness with clinical complications warranting hospital referral, and presence of obvious congenital abnormalities that had impaired feeding or physical growth measurements were excluded. Multistage-stratified sampling was used to collect data from respondents across Jimma Zone. First, 3 of the 9 top coffee-producing woredas of Jimma zone (Mana, Gomma, and Limukossa) were randomly selected. Then the woredas were stratified into urban and rural residences. One-third of villages (Gots) in rural and Kebeles of semi-urban settings were randomly selected to serve as a sampling frame. Then the number of households were allocated for selected Gots and Kebeles based on population proportion to size allocation method using the central statistics agency report of 2007. 38 Finally, households were visited randomly based on their sampling interval calculated for each Got and Kebele to access the adolescents and their household. In case a household doesn’t have an adolescent, the next house was considered. In the event where more than 1 adolescent was found in a house, the youngest was taken.
Data Collection and Procedure
A structured questionnaire was used for face-to-face interview of mothers/caregivers and adolescents to collect data on sociodemographic characteristics, household assets and utilities, adolescent characteristics, and food security and related questions. Pretesting of the questionnaire was conducted on 5% of the study households involving all trained data collectors. After the pretest, necessary modifications were made to the questionnaire based on gaps identified. The actual data were collected by trained nurses, while anthropometry was measured by 3 trained graduate nutrition students. Ethical clearance was obtained from the ethical clearance committee of College of Health Sciences, Jimma University. Respective government and health institutions and local administrators were asked permission of entry using an official letter from Jimma University. Detailed description of the study to Kebele and “Got” leaders and households were provided, which aimed at sensitizing and mobilizing the local population on the aims and objectives of the study. Separate informed verbal and written consent were obtained from each study participant before data collection. In case of adolescents, a verbal assent of the adolescent was obtained in front of parents.
Measurement and Analysis
Household Food Insecurity Access Scale (HFIAS) version 3 was used to measure food insecurity, a tool that has been developed by Food and Agriculture Organization of the United Nations and Food and Nutrition Technical Assistance. 40 Adolescent food insecurity was measured using a 4-item scale adapted by selecting 4 items from the 9-item household food security scale that apply to adolescents’ personal experiences as described elsewhere. 9 Height and weight measurements were taken in duplicate using calibrated equipment and standardized techniques. Height was measured in the standing position to the nearest 0.1 cm using a stable stadiometer with movable headpiece (Seca, Germany). Weight was measured using weighing scales (Seca, Germany) to the nearest 10 g with light clothing. Anthropometric measurements were converted to height-for-age Z score (HAZ) and BMI-for-age Z score (BAZ) using WHO Anthroplus software version 2.3, World Health Organization, Avenue Appia, Geneva, Switzerland. The outcome variables were defined based on the indices of HAZ and BAZ, both compared to The World Health Organization Child Growth references population. 41 Accordingly, adolescents with HAZs less than −2 standard deviations (SDs) below the median were defined as stunted, those with BMI-for-height z scores less than −2 SDs below the median were considered as thin. We also considered severe anthropometric failure, defined as less than −3 SDs below the median scores. Adolescents with BAZs of less than −3 SDs below the median for their age and gender were considered as severely thin, while those with HAZs less than −3 SDs below the median were defined as being severely stunted. Conversely, the burden of overnutrition was measured with BAZ value above 1. We preferred merging overweight and obesity (overweight/obesity) to enhance our level of pragmatism in public health action recommendations. Wealth index was generated using principal components analysis; where the scores for the 25 selected groups of assets and utilities (which were used in earlier demographic surveys of Ethiopia) translated into latent factors and the first factor that explained most of the variation was used to group study households into wealth tertiles.
Data were entered into EpiData version 3.1, The EpiData Association, Odense, Denmark to control skip patterns and allow double entry and then exported to SPSS for windows version 21 for cleaning and analyses. To isolate the independent effects of potential predictors, sociodemographic variables that could have direct causal link, biological determinants, and those with significant association in the bivariate analysis were selected for multivariable logistic regression. Accordingly, household head educational status, spouse education, family size, dependency ratio, wealth index, sex of household head, age of the adolescent, adolescent access to food outside home, adolescent food security, and household food security were selected for multivariable logistic regression for stunting using enter method. Furthermore, to identify the determinants of double burden of malnutrition, a multinomial logistic analysis were employed on the above factors against the 3 outcomes of BAZ: thinness, overweight/obesity, and optimal nutritional status. For the purpose of enhancing accuracy to the sample estimates, we employed bootstrap statistics based on 2000 bootstrap samples. The results were presented in odds ratios and 95% confidence intervals. All tests were 2-sided and a P value < .05 was used to declare statistical significance.
Results
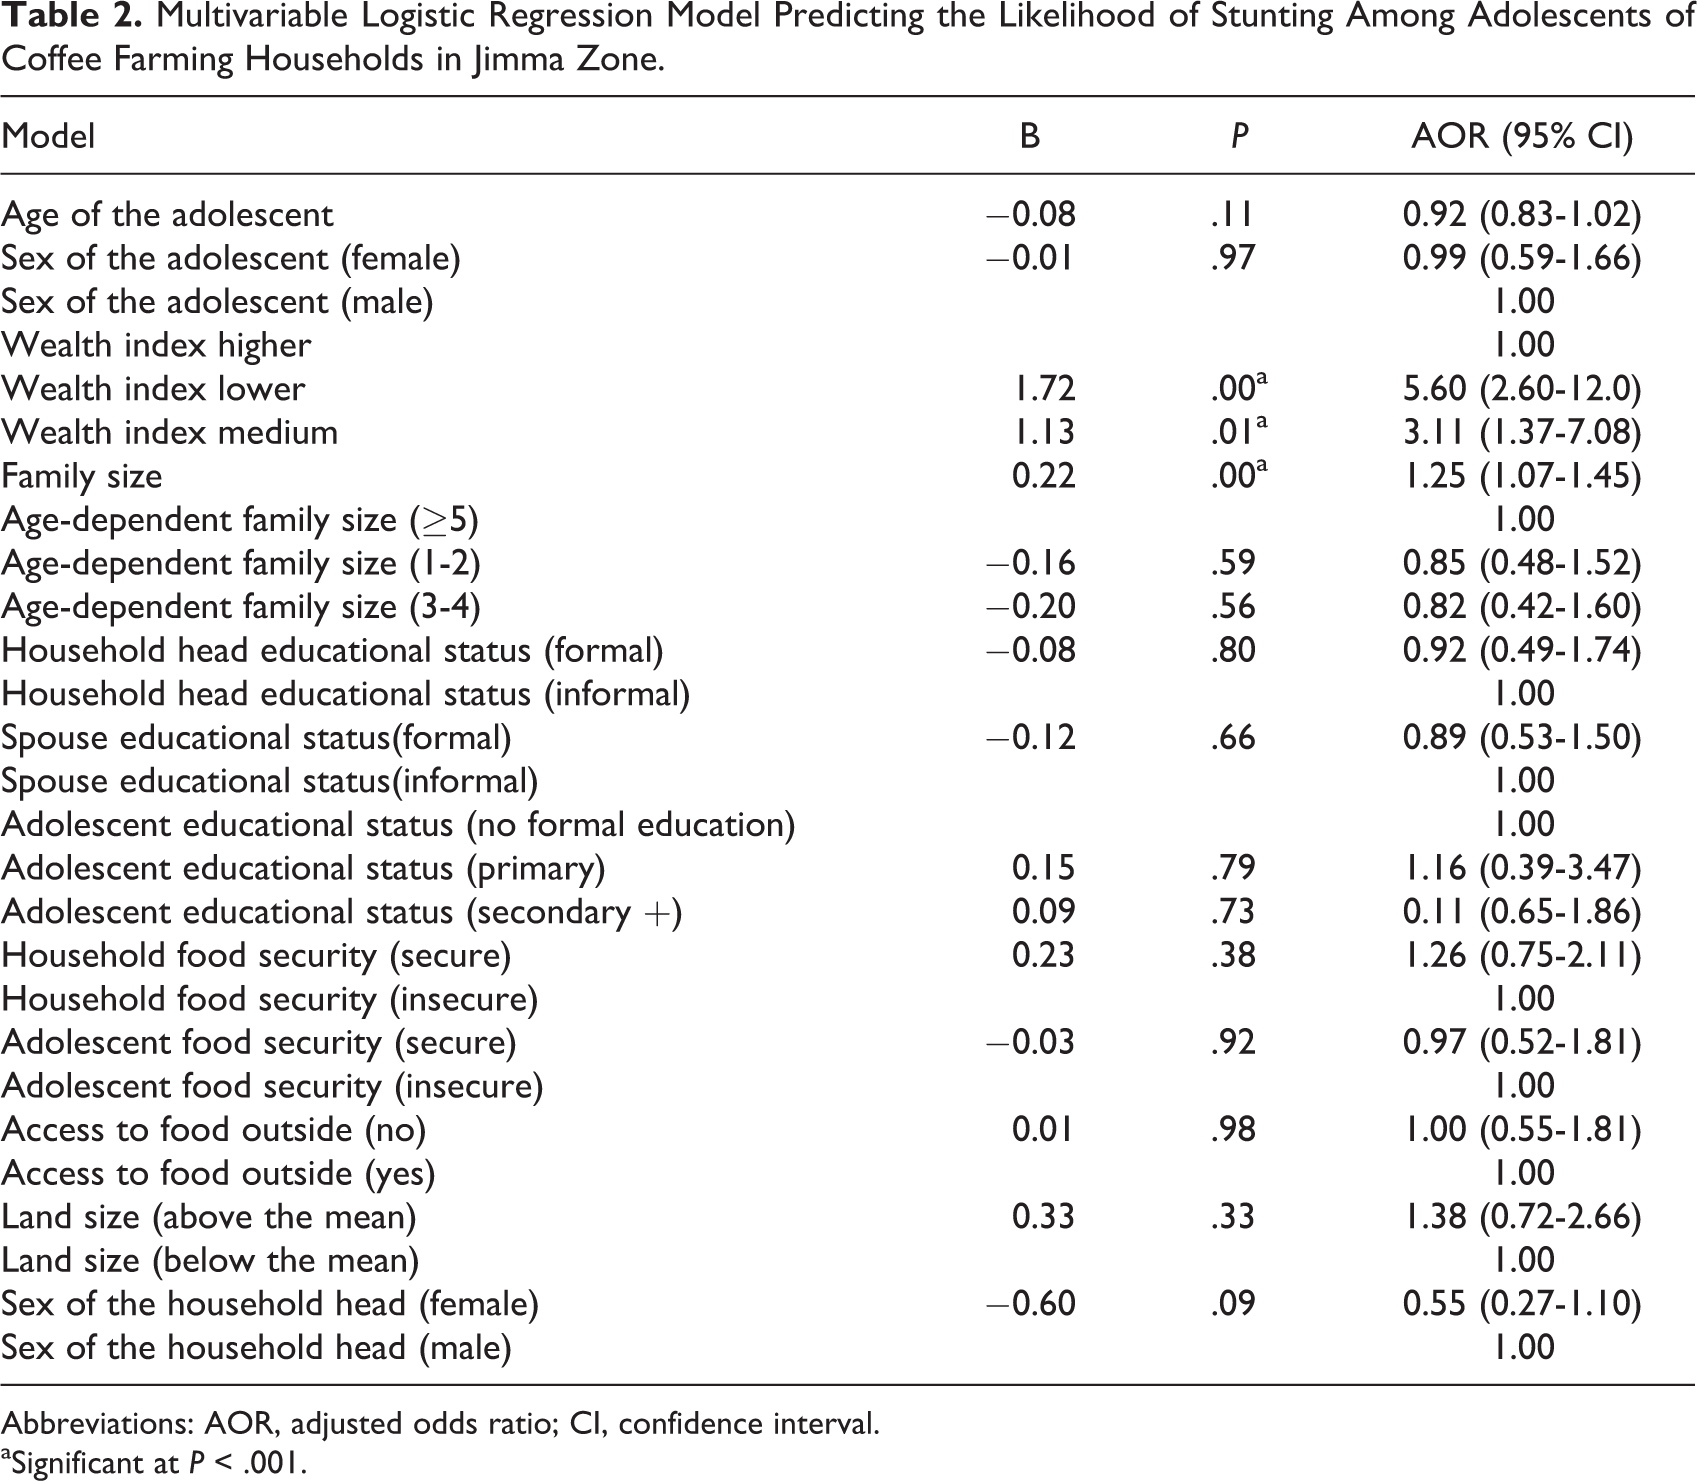
A total of 550 households were included in this study, with a response rate of 96%. Majority (85.3%) of the respondents were residents of rural area; while the rest were in semi-urban setting. The mean (SD) family size of respondents was 5.9 (1.65) persons. The median age of children was 13 years. The sex distribution of the adolescents was 1.3:1 (female to males). The mean (SD) age of mothers was 33 (8.85) years. A quarter of the households (24.7%) had few age-dependent (1-2) members; while the largest proportion (45.5%) had medium (2-4) age-dependent members. Most (90.2%) of the mothers were married, the rest widowed or divorced. Oromo was the predominant ethnic group (72%) followed by Dawro (13.3%), while the rest were other ethnic minorities in the area (14.7%). Regarding educational status, 59.5% of the mothers had formal education. Larger proportion (41.5%) of the households was in the lowest wealth tertile; while comparable proportions were found in upper and middle tertile. More than half (57.6%) of adolescents were food insecure, likewise two-thirds of households (66.3%) were food insecure. The mean (SD) farm land size owned by the family were 0.4(0.5) hectares, while most (81.1%) own less than the mean (Table 1).
Sociodemographic Characteristics of the Adolescents and Their Household Categorized by Nutrition Status, Jimma Zone.
aPearson’s chi-square test.
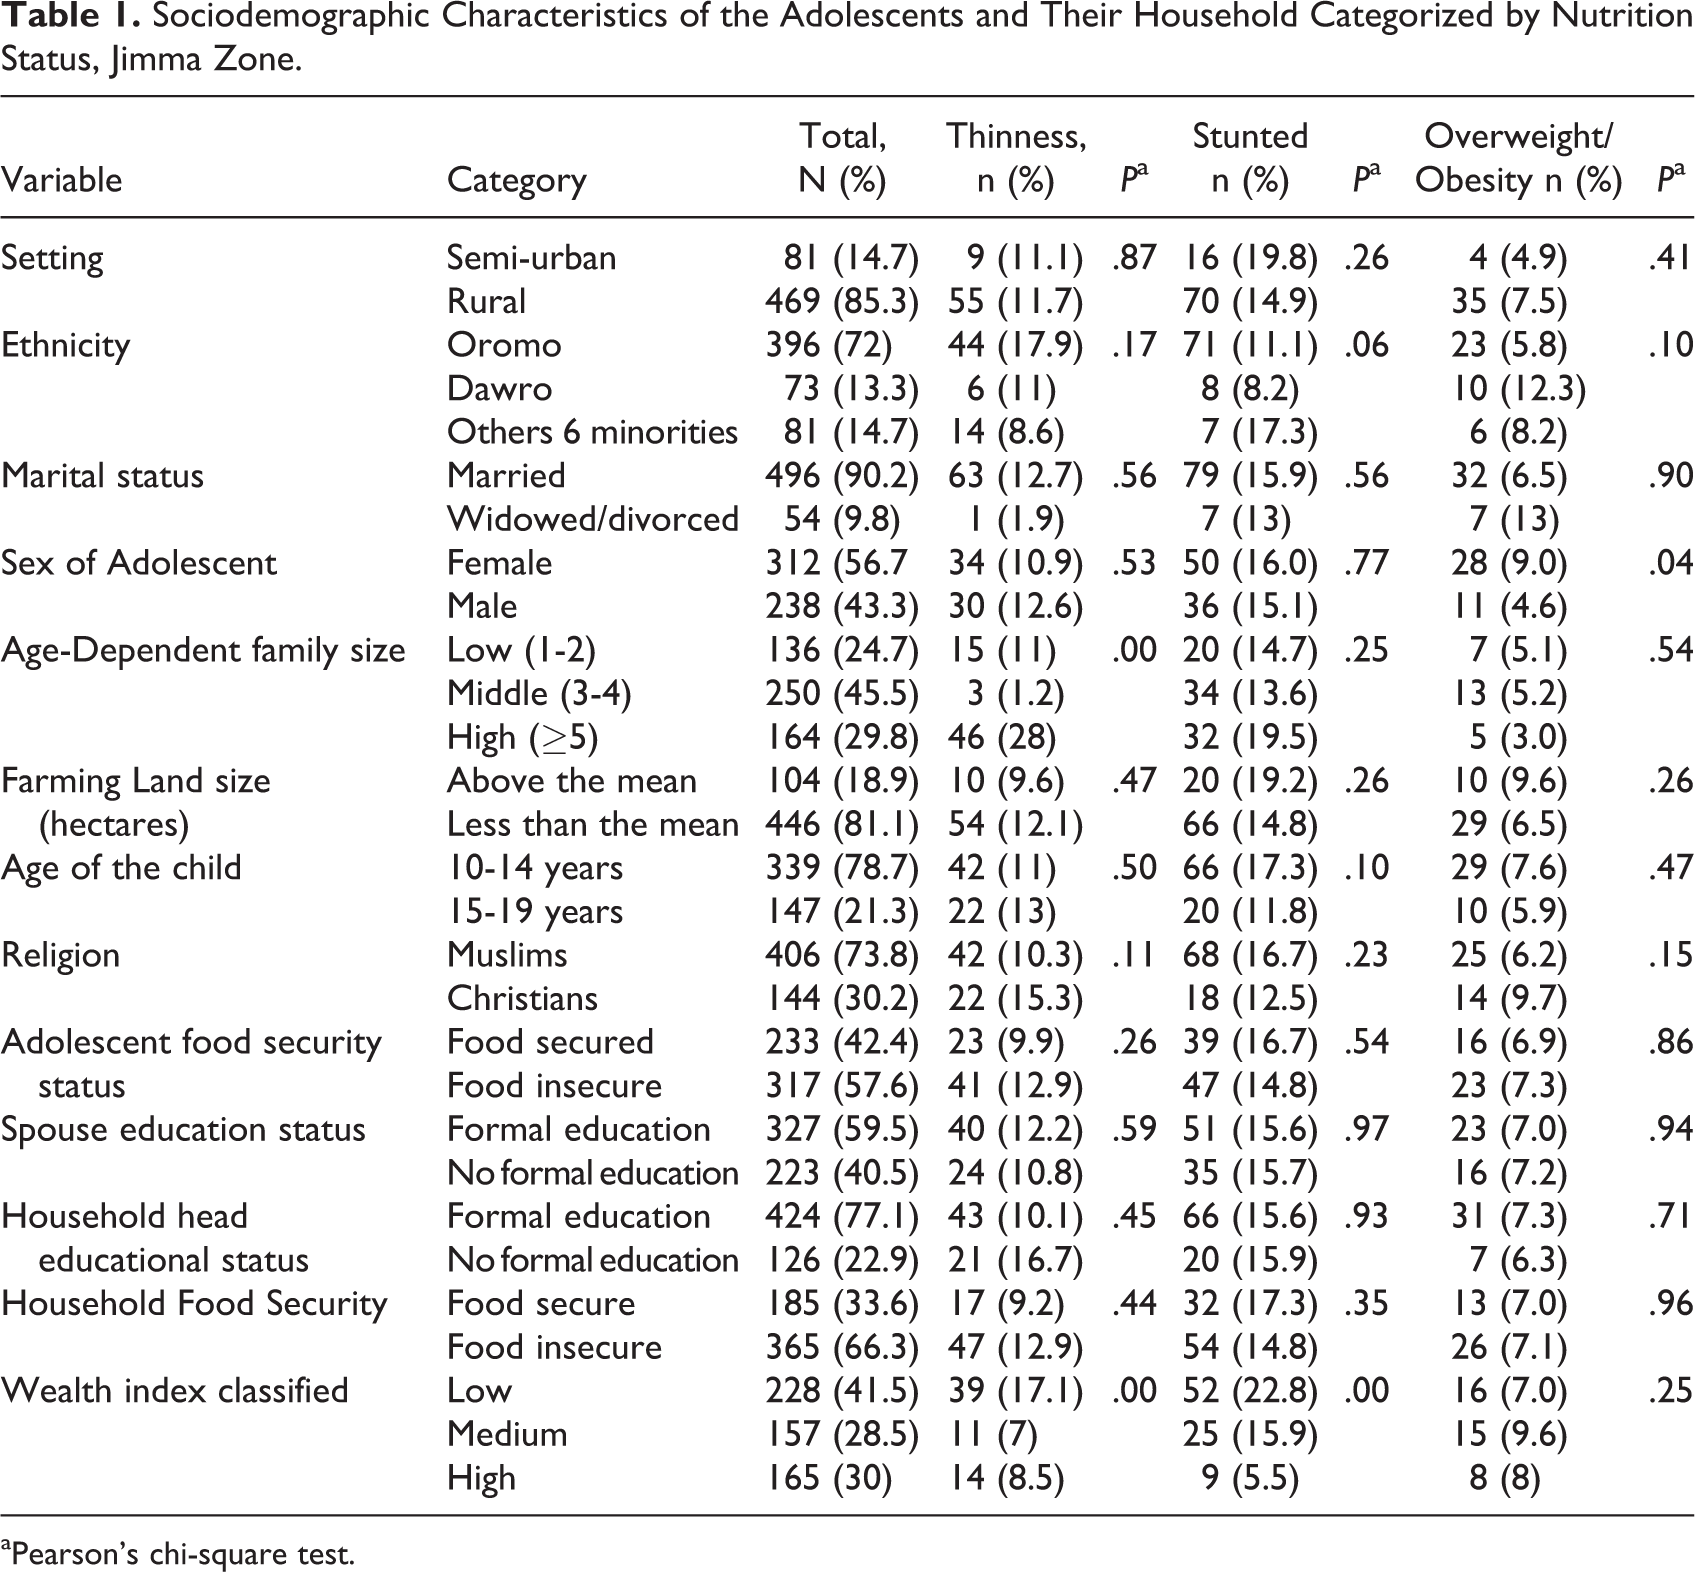
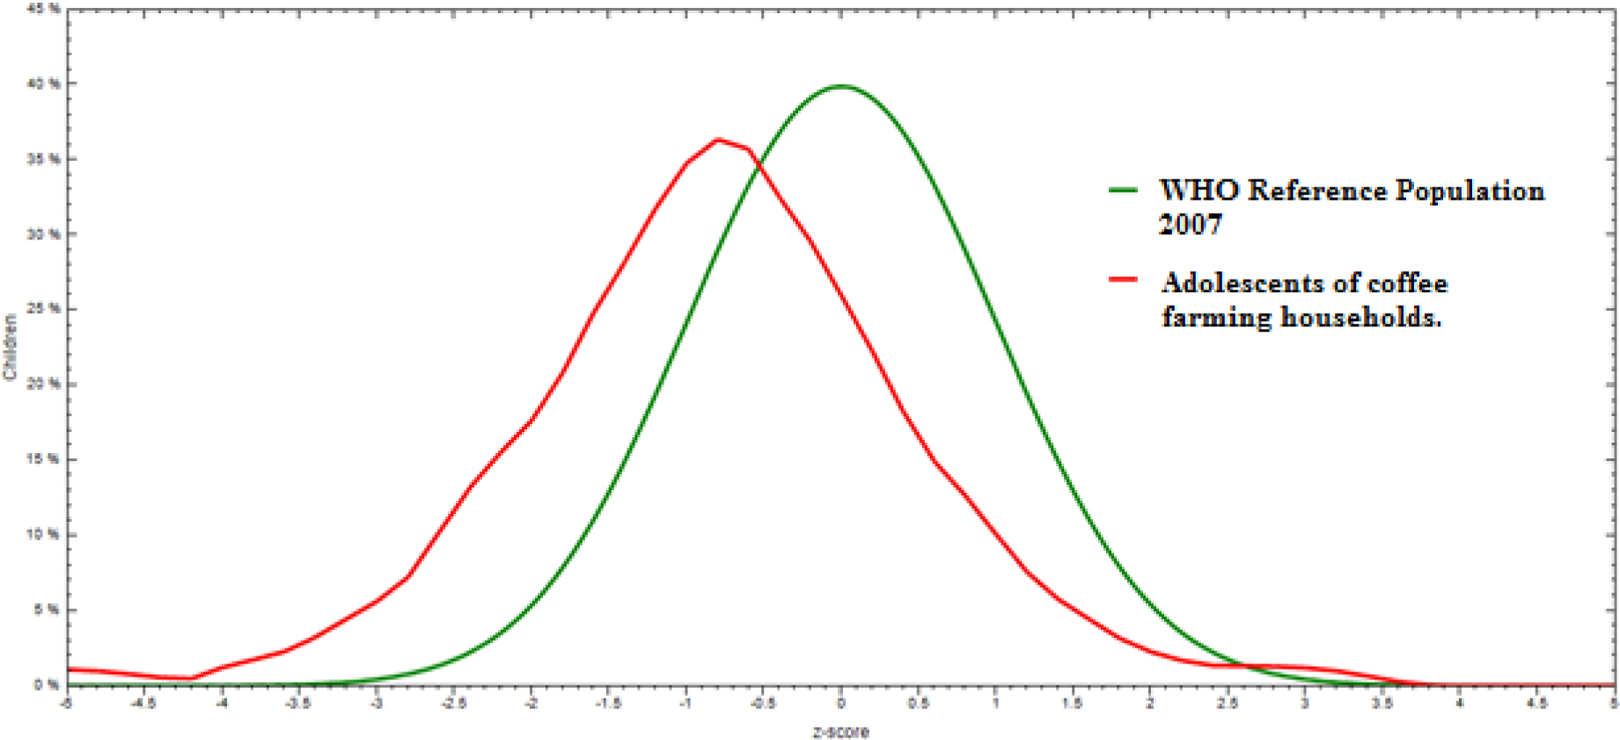
Regarding nutritional status, the mean (SD) scores of HAZ and BAZ were negative, −0.79 (1.25) and −0.77 (1.08), respectively. Prevalence of stunting was 15.6%, of which severe form was 3.5%. The proportion of thinness was 11.6%, of which 1.8% was severely thin. The prevalence of overweight and or obesity (overweight/obesity) was 7.1%. In general, the comparisons between nutritional status of the study participants and the WHO reference population distribution showed skewness of the former to the negative Z scores (Figures 1–2).
Comparisons HAZ of the study participants with Z score of WHO reference population, Jimma, Ethiopia. HAZ indicates height-for-age z score; WHO, World Health Organization.
Comparisons BAZ of the study participants with Z score of WHO reference population, Jimma, Ethiopia. BAZ indicates BMI-for-age z score; WHO, World Health Organization.
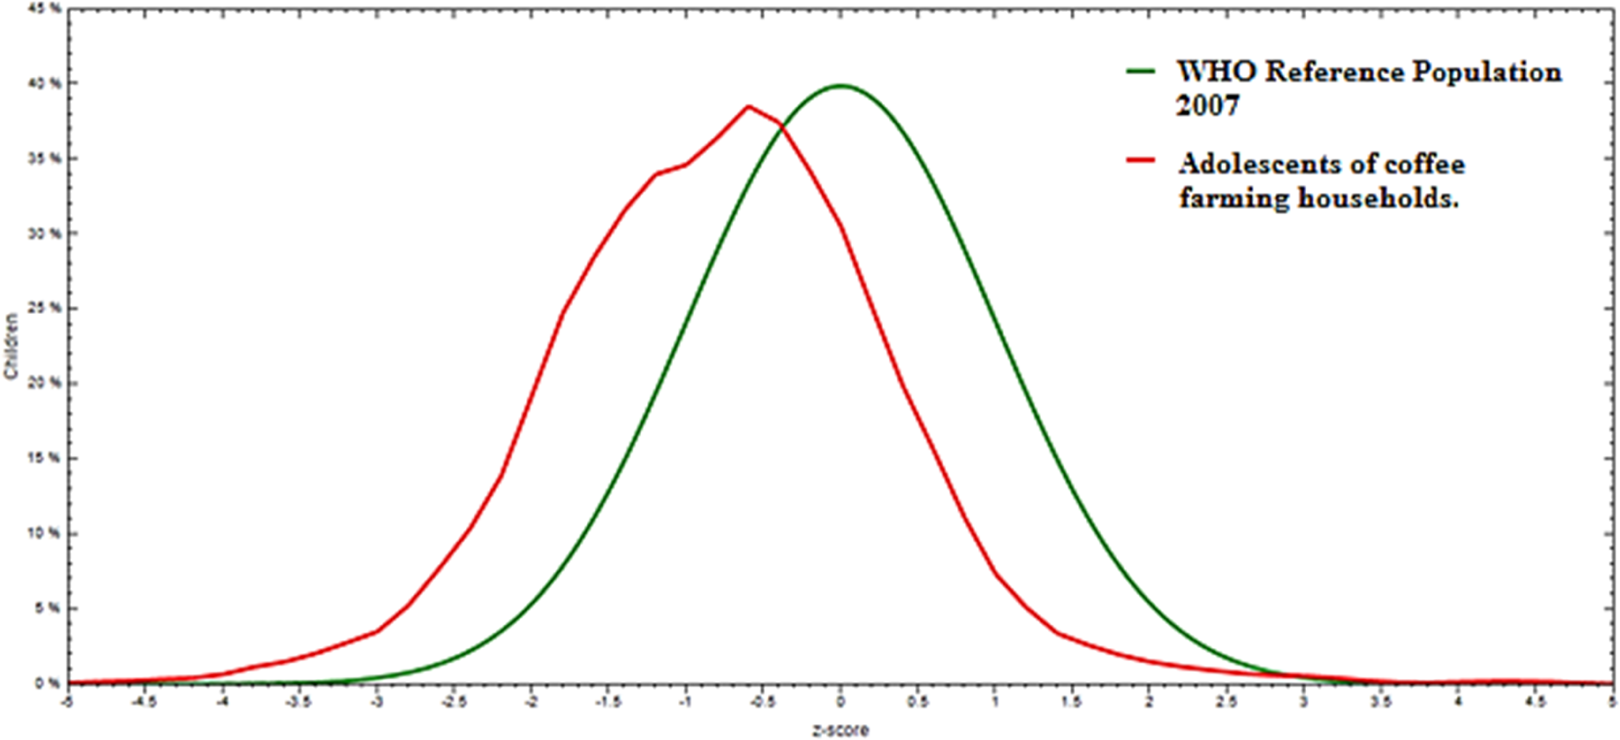
On multivariable binary logistic regression analyses, the odds of stunting among adolescents in households with the lowest wealth tertile were nearly 6-fold (AOR = 5.60 [95%CI: 2.60-12.0]). Similarly, adolescents of households in middle wealth tertile were 3 times more likely to have stunting compared to those in the highest wealth tertile (AOR = 3.11, AOR= [95%CI: 1.42-7.28]). Family size was also a predictor for stunting, such that for an increase in 1 additional family member, the likelihood of stunting increased by 20% (Table 2).
Multivariable Logistic Regression Model Predicting the Likelihood of Stunting Among Adolescents of Coffee Farming Households in Jimma Zone.
Abbreviations: AOR, adjusted odds ratio; CI, confidence interval.
aSignificant at P < .001.
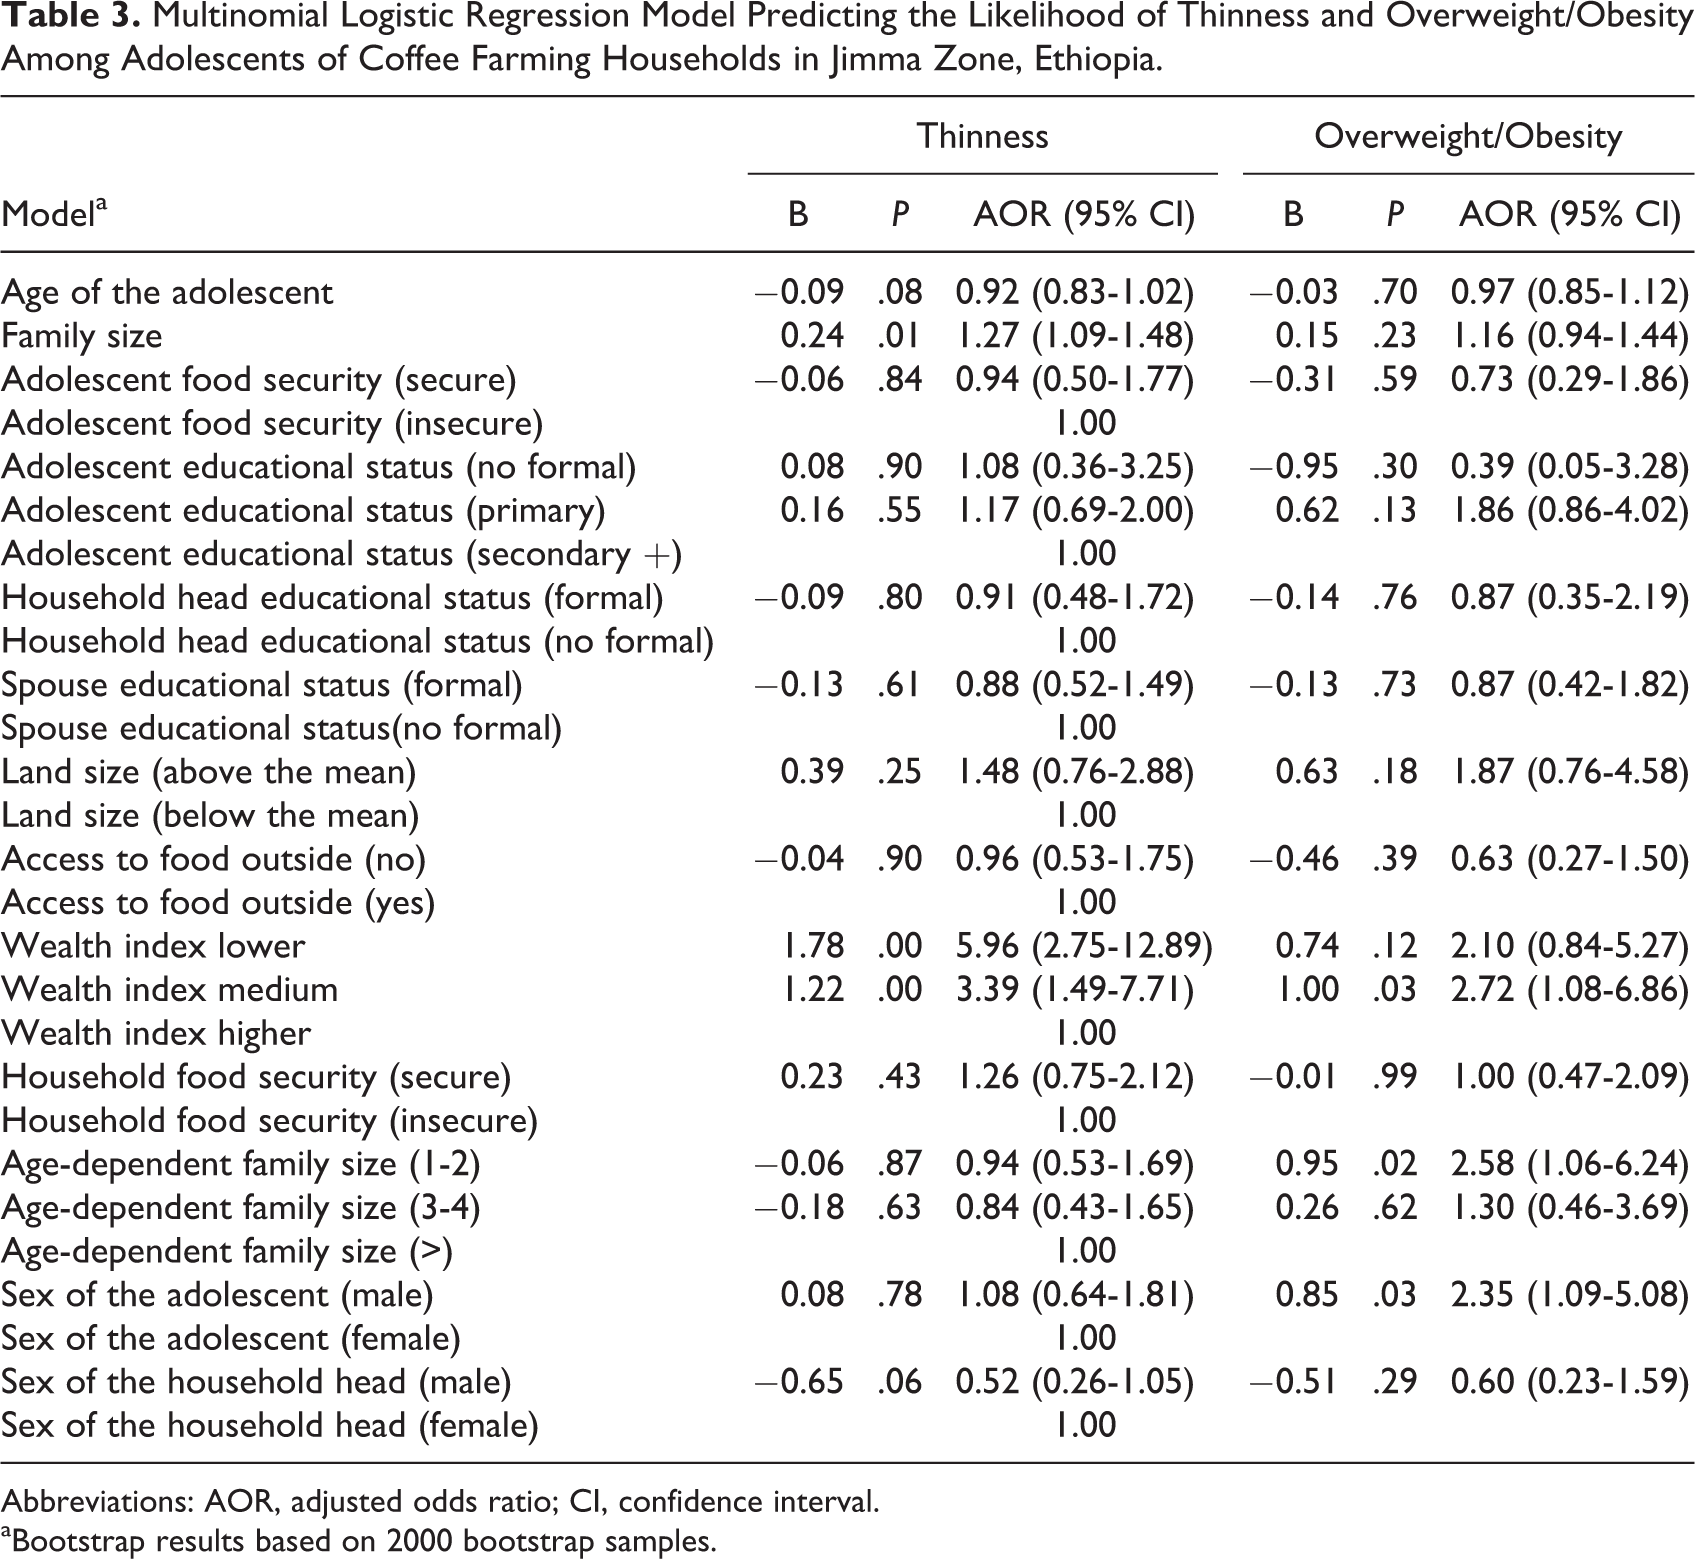
On multivariable multinomial logistic regression, after adjusting for socioeconomic characteristics and food security status of the adolescent and their households, adolescents of households with the lowest wealth tertile were nearly 6 times more likely to have thinness AOR =5.96(95%CI: 2.75-12.89)], while the corresponding odd for middle tertile was more than 3 times higher AOR = 3.39(95%CI: 1.49, 7.71)] compared to adolescents of households with highest wealth tertile. On the contrary, the odds of overweight/obesity was nearly 3 times higher for adolescents of households in the middle wealth tertile compared to adolescents living in households with highest wealth tertile (AOR = 2.72 [95%CI:1.08-6.86]). Similarly, adolescents living in households with few age-dependent family members (1-2) were more than twice as likely to have overweight/obesity compared to those living in households with a high number of (≥5) age-dependent members (AOR = 2.58 [95%CI:1.06-6.24]). Furthermore, it was also found that for every 1 additional family member increment, the likelihood of stunting increased by 27% (Table 3).
Multinomial Logistic Regression Model Predicting the Likelihood of Thinness and Overweight/Obesity Among Adolescents of Coffee Farming Households in Jimma Zone, Ethiopia.
Abbreviations: AOR, adjusted odds ratio; CI, confidence interval.
aBootstrap results based on 2000 bootstrap samples.
Discussion
Our results demonstrated a significant level of suboptimal nutritional status of adolescents in the study setting. The prevalence of thinness, stunting, and overweight/obesity were 11.6%, 15.6%, and 7.1%, respectively. The current prevalence of thinness and stunting is lower compared to many studies done in the country 22 -26 as well as in Africa: Tanzania (21%), Kenya (15.6%) and Nigeria (24.2%). 42 -44 More specifically, the stunting prevalence was much lower than what was documented in many studies in Ethiopia. 22 -24 Contrarily the present prevalence of thinness and stunting was higher compared to reports from the capital of the country, Addis Ababa, a disparity mirroring the economic gradient. 27 Moreover, compared to the curve of the WHO (2007) reference population, the median peak of the current study was skewed to negative z-score values, indicating prevalent undernutrition in the study area. 41 Our findings on thinness and stunting also corroborate the general nutritional status of adolescence period, which is, a lower prevalence of undernutrition compared to preadolescent age-groups. 42,45
The study also demonstrated that this alarming prevalence of overweight/obesity (7.1%) signals the presence of dual burden of suboptimal nutrition in the setting. This prevalence of overnutrition is the highest reported from suburban to rural part of the country. It was higher compared to reports from northern (2%) and central part of Ethiopia (4.3%) 26,42 but lower compared to the studies done in the major cities of the country, Addis Ababa (13%), Bahrdar (16.7%), and Hawasa (15.6%), 29-30,44 reflecting existing socioeconomic disparity. Nonetheless, the current prevalence of overweight/obesity is disturbing, given that data for this study are generated from semi-urban and rural settings where all children walk to school on foot. The results imply that the risk of chronic illness on the future adults is vivid, considering such high-prevalence overweight/obesity at younger age-group of farming population. In rural farming households, traditionally adolescents are charged with many tasks including animal welfare and firewood collection, tasks which are calorie intensive. Thus, the implication of the prevalence should be considered beyond the proportion. The magnitude of overweight/obesity in adolescence, along with the fact that adolescents are quarter of Ethiopian population indicates the need for serious attention in considering this segment of the population in the programs and strategies that cater to preventing the upsurge noncommunicable diseases in the next generation of adults. This compounded with huge backlog of stunting during earlier lives that these adolescents had passed through will fuel the problem further.
Notable hierarchical differences in prevalence of stunting and thinness were observed across the wealth tertiles in the present study. Adolescents in the households with the lowest wealth tertile showed the highest odds of stunting and thinness compared to adolescents living in households of higher wealth tertile. Similarly, adolescents of households with the middle wealth tertile showed higher (but lesser odds than the lower wealth tertile) stunting and thinness compared to adolescents living in households of higher wealth tertile. A fairly similar finding was observed in demographic health surveys done for lower age-groups and other studies among adolescents. 4,21,42,46 Our findings corroborate the reports of Lancet Series 2013 on maternal and child undernutrition, stating living standards as an influential factor for physical growth of adolescence. 47 It is also consistent with a cross-comparative study done on children from 4 low- and middle-income countries to assess short-term and long-term associations between household wealth and physical growth, showing a lower malnutrition among less poor households compared to poor and very poor households. 48 However, contrary to the findings of studies done in other parts of Africa and Asia, the current study found 3fold obesity for adolescents of households with middle wealth tertile compared to those in higher wealth tertile. 49 -51 The possible explanation could be faster dietary transition at which this group assumes than the richest ones.
The present study also found a positive association between family size and undernutrition (thinness and stunting). Larger family size may put children at higher risk for malnutrition, mainly due to the imbalance between members’ demand and available food resources. A similar finding was observed in majority of studies done in developing world. 25,41,42,45,52 -54 Supporting the above finding, adolescents of household with low age-dependent groups (1-2) were found more than twice as likely to fall in the category of overweight/obesity. Lower dependency ratios in the household most likely improve the caring potential of parents and the attention they could provide for older children. Furthermore, a reduction in the nonproductive household members can decrease the dependency burden on the productive members of the household, helping adolescents to acquire excess benefit of generated cash income. Consequently, the adolescent could get better care leading to a higher weight. Although not significant in our model, rise in age-dependency burden can make adolescents at risk of thinness. This is evidenced by an earlier study of Hadley et al 55 who showed adolescents in households with the highest dependency ratios 1.3 kg lighter, 0.67 cm smaller Middle upper arm circumference(MUAC), and a BMI of 0.59 lower compared to youths in the lowest dependency ratio households in Jimma town.
Mirroring the developing world gender strata related to obesity, male adolescents of this study were found to have more odds of overweight/obesity than their counterparts. 56 However, earlier studies in non–cash crop setting of Ethiopia reported that female gender is at risk of obesity compared to male. 29-30 The demographic health surveys for lower age-group also reported male gender to be at risk of thinness compared to females. 42,45 The difference might be due to higher-income opportunity that male adolescents could have compared to females in cash crop setting, 31 -34 which could expose them to processed and commercialized obesogenic foods.
Contrary to the classic relationship in many studies, 9,23,48 we found no association of education with suboptimal nutrition of any form. However, quality basic education and schooling can positively influence nutrition either through enhancing positive dietary behavior or by improving economic opportunity. Adolescents who enrolled in education can get more information about nutrition and exercise. However, studies in Tanzania and Nigeria reported adolescents enrolled in school were more likely to be malnourished, 57,58 which is an inverse relationship. The possible explanation for our atypical finding could be the nature of the study setting, where nonenrolled adolescents possibly spend their time engaged in labor and economic activities earning money to feed themselves, confounding the possible association in a different way. Nevertheless, the implication of education is critically important considering multiple causation of undernutrition.
In the current study, both household and adolescent food security did not show any association with adolescent nutritional status. Unlike reports of many studies, the present study didn’t show a positive association between age and undernutrition. 9,55,59–60 Looking at the seasonality of the relationships between predictors and the different forms of malnutrition would have added further information. However, due to the cross-sectional nature of the data, these analyses could not be done. In the current study, the dual burden of malnutrition showed much of its roots in economic factors. Considering this peculiarity, we hypothesize possible existence of similar burden among adolescents of low-income countries, more specifically in cash crop setting. Despite the independence of the occurrence of under- and overnutrition, existing poverty in lower-income country may not be resilient enough to prevent the complex causation of both forms of suboptimal nutrition.
Conclusion
The current study revealed the presence of substantial dual burden of malnutrition in the midst of the success story of the country in achieving the millennium development goals related to reduction in child mortality. Predictors isolated for both thinness and overweight/obesity were related to economy or resources. The economic prosperity in the setting should be exploited for decreasing the prevalent thinness and stunting but not for inducing dietary transitions that could generate overnutrition. Future nutrition intervention programs in such setting should consider both dimensions of malnutrition. It is critical to draw a fine line and trade-off for eliminating morbidity and mortality of undernutrition without triggering the risk of overweight and obesity among adolescents in the coffee farming communities. Furthermore, we recommend longitudinal studies that employ policy-level analysis, besides assessing sociocultural, economic, and nutritional challenges overtime among adolescents in cash crop setting of the country.
Footnotes
Authors’ Note
All the stated authors (KH, GG, and TB) are involved in the study from the inception to design, acquisition of data, analysis and interpretation, and drafting of the manuscript. All authors read and approved the final manuscript.
Acknowledgments
We would like to extend our deepest gratitude to Jimma University for financing this study. Our appreciation goes to the data collectors and supervisors. Lastly, our special thanks also go to children’s mothers who participated in the study.
Declaration of Conflicting Interests
The author(s) declared no potential conflicts of interest with respect to the research, authorship, and/or publication of this article.
Funding
The author(s) received no financial support for the research, authorship, and/or publication of this article.