
Abstract
Background:
Micronutrient deficiencies are still highly prevalent in countries undergoing the nutrition transition, but nationally representative data documenting their burden in children are exceedingly rare.
Objective:
To examine the distribution and recent trends in micronutrient status biomarkers of Colombian children.
Methods:
We compared the distributions of plasma ferritin, serum zinc, and vitamin A in Colombian children between 2005 and 2010 using 2 cross-sectional, nationally representative surveys overall and by categories of sociodemographic variables. Analysis for ferritin included boys and nonpregnant girls aged 1 to 17 years. Analyses for zinc and vitamin A included children aged 1 to 4 years.
Results:
The mean 2010 to 2005 differences in ferritin, zinc, and vitamin A were 2.5 µg/L (95% confidence interval [CI]: 1.3 to 3.7), −34.9 µg/dL (95% CI: −39.6 to −30.2), and −11.5 µg/dL (95% CI: −12.3 to −10.7), respectively, after adjusting for sociodemographic characteristics. These differences varied significantly by region of residence. In 2010, region of residence was a significant correlate for all 3 micronutrients. Other important correlates included age and maternal education for ferritin and body mass index-for-age Z score, maternal education, wealth index, food insecurity, and urbanicity for vitamin A.
Conclusions:
Plasma ferritin was slightly higher in 2010 than in 2005, whereas serum zinc and vitamin A were substantially lower in 2010. In the absence of obvious causal explanations, it is uncertain whether this decline represents a worsening of micronutrient status in Colombian children or an artifact due to systematic laboratory or data management errors incurred in the surveys.
Introduction
Many low- and middle-income countries are experiencing a nutrition transition as they undergo economic development. 1 While the incidence of noncommunicable diseases is increasing in these countries, micronutrient deficiencies are still important contributors to the overall disease burden. 2 Children are especially susceptible to deficiencies of micronutrients, including iron, zinc, and vitamin A. 3 -5 Iron deficiency in children is associated with deficits in cognitive and behavioral function later in life, 6 zinc deficiency is related to linear growth retardation and elevated risk of some infections, 7,8 and vitamin A deficiency is associated with xerophthalmia and increased risk of mortality from measles and diarrhea. 9
The prevalence of micronutrient deficiencies in countries from Latin America has not been well documented. The overall prevalence of iron, zinc, and vitamin A deficiencies in this region was estimated at 34%, 46%, and 50%, respectively, at the beginning of the past decade. 10,11 However, there has been a lack of nationally representative data, as well as a lack of agreement on the indicators used to determine iron, zinc, and vitamin A status.
The aim of this study was to estimate the change in iron, zinc, and vitamin A status biomarkers in Colombian children between 2005 and 2010, using data from the 2 most recent nationally representative nutrition surveys. We also aimed to identify the sociodemographic correlates of these indicators in the last available survey of 2010.
Methods
Study Population
The Colombian National Nutrition Surveys (ENSIN) were conducted in 2005 and 2010 by the Colombian Institute of Family Welfare (Instituto Colombiano de Bienestar Familiar). Details on each survey have been published elsewhere. 12,13 In brief, participants were selected to represent 99% of the country’s population using a multistage stratified sampling scheme. All municipalities from the 32 departments in the country were grouped into strata based on similar geographic and sociodemographic characteristics. One municipality was randomly chosen from each stratum, with probability proportional to the population size. Clusters of about 10 households each were then randomly chosen from within these strata and household members were invited to participate. The 2005 survey included 17 740 households representing 1920 clusters from 209 strata. In the 2010 survey, 50 670 households were included, representing 4987 clusters from 258 strata.
The research was conducted in accordance with guidelines laid down by the Declaration of Helsinki. Consent for participation in the surveys was obtained by the Colombian Institute of Family Welfare prior to enrollment. The Health Sciences and Behavioral Sciences institutional review board at the University of Michigan determined that analyses of these de-identified data were exempt from review.
Data Sources
In both surveys, trained personnel administered questionnaires to the head of the household to obtain information on demographic characteristics, measures of food insecurity, and wealth. Anthropometric measurements were obtained in all household members with the use of standardized techniques and calibrated instruments. Height was measured with the use of a height board (Shorr Productions LLC, Olney, Maryland) in 2005 and with a stadiometer (Diseños Flores S.R.L., Lima, Peru) in 2010, to the nearest millimeter. Weight was measured on SECA Alpha model (Seca, Hanover, MD) 770 scales in 2005 and on SECA 872 scales in 2010, to the nearest 100 g.
In a random subsample of participants, blood was collected by venipuncture of the antecubital vein. One sample was collected in an EDTA tube for separation of plasma and another in a metal-free polypropylene tube without anticoagulant for separation of serum. All samples were stored in liquid nitrogen until processing at the National Institute of Health of Colombia. Plasma ferritin was quantified in children 1 to 17 years old, using competitive chemiluminescent immunoassay on an ADVIA Centaur analyzer (Siemens Healthcare Diagnostics, Inc, Tarrytown, New York). Plasma C-reactive protein (CRP) was quantified by turbidimetry on an ACS-180 analyzer (Siemens Healthcare Diagnostics, Inc). Serum zinc and vitamin A were quantified in children 1 to 4 years old, using the method of absorption spectrophotometry (Shimadzu atomic AA6300; Shimadzu Corporation, Columbia, Maryland) and high-performance liquid chromatography (Waters 600 System; Waters Corporation, Milford, Massachusetts, USA), respectively.
Definition of Outcomes and Covariates
The outcomes of interest were plasma ferritin (µg/L), serum zinc (µg/dL), and vitamin A (µg/dL) concentrations. Iron deficiency was defined as plasma ferritin concentration <12 µg/L in children ≤5 years old, <15 µg/L in children >5 years old, and <30 µg/L when CRP was >10 mg/L, irrespective of age. 3 Zinc deficiency was defined as serum concentration <65 µg/dL. 5 Vitamin A deficiency was defined as serum concentration <20 µg/dL. 14
The primary correlate was year of survey (2005 or 2010). In addition, we considered sociodemographic variables as correlates of each micronutrient status indicator in the most recent survey of 2010. These correlates included sex, age, height- and body mass index (BMI)-for-age Z scores, maternal height, BMI and education, wealth index, food insecurity in the household, urbanicity, and region of residence. Height- and BMI-for-age Z scores were estimated using the World Health Organization (WHO) Child Growth Standards for children <5 years old 15 and the WHO Growth Reference for children 5 to 19 years old. 16 Wealth was measured using an index designed for the international Demographic and Health Surveys. 17 This wealth index is constructed for each survey year from principal component analysis of a number of household assets, including type of flooring, number of bedrooms, type of toilet, and mode of transportation. The distribution of these variables is first standardized for the population and Z scores for each variable are assigned to each household. Principal component analysis is then performed using the standardized variables; the first factor identified is used to define the wealth index as a continuous variable. A higher index represents more wealth. Each person is assigned the wealth index of his or her household. The continuous wealth index was categorized into quintiles according to its distribution among all survey participants, accounting for the complex survey design. Food security status was measured using a modified version of the Community Childhood Hunger Identification Project, 18 which has been previously adapted for and validated in a Colombian population. 19 There are 12 questions addressed to the head of the household regarding food insecurity experienced within the past 30 days due to lack of money for food. In 2010, additional questions were added to the survey; however, for comparability between years, we used only the questions and scale from 2005 to calculate food security for both survey years. Response options for each question—no, seldom, sometimes, or always—were assigned codes 0, 1, 2, or 3, respectively. Codes were added through all responses and the sum was categorized into a 4-level variable: food secure (sum = 0), mild food insecurity (sum = 1-12), moderate food insecurity (sum = 13-24), or severe food insecurity (sum ≥ 25). Urbanicity was categorized as living in urban settlements, in small villages or rural areas around a small town, or in rural dispersed areas distant from the nearest town.
Statistical Analysis
For the analyses of ferritin, we included boys and nonpregnant girls 1 to 17 years old who had nonmissing data on plasma ferritin and CRP (n = 10 110 in 2005 and n = 14 559 in 2010). For the analyses of zinc, we included children 1 to 4 years old who had nonmissing data on serum zinc (n = 3855 in 2005 and n = 4279 in 2010). For the analyses of vitamin A, we included children 1 to 4 years old who had nonmissing data on serum vitamin A and plasma CRP (n = 3932 in 2005 and n = 3844 in 2010).
All analyses were conducted with the use of the complex survey design routines of Stata statistical software package version 13. We first compared the distributions of ferritin, zinc, and vitamin A, using prevalence of deficiency by year. Next, we compared weighted means of each nutrient indicator by year, overall, and within categories of sociodemographic predictors with the use of linear regression. For nominal correlates, we used type 3 tests. For ordinal correlates, we used tests for linear trend by including in the model a variable representing ordinal categories of the correlate as a continuous predictor. Next, we estimated the mean difference of each micronutrient indicator between 2010 and 2005 overall and by levels of sociodemographic variables with the use of multivariable linear regression models. To determine whether these differences differed significantly between levels of sociodemographic predictors, we tested cross-product (interaction) terms between an indicator variable for year and the categories of each predictor with the use of adjusted Wald tests.
Finally, we examined the correlates of micronutrient status indicators in the latest survey (2010). We estimated adjusted mean differences of each micronutrient indicator by levels of sociodemographic predictors with the use of multivariable linear regression models. In these models, adjustment variables included sex, age, height- and BMI-for-age Z scores, maternal height, BMI and education, wealth index, food insecurity in the household, urbanicity, and region of residence, categorized according to Supplemental Table 1. Models for ferritin and vitamin A were also adjusted for CRP concentration.
Results
Ferritin
Mean ferritin concentration in 2005 and 2010 was 34.1 (standard error [SE]: 0.4) µg/L and 37.2 (SE: 0.4) µg/L, respectively (Supplemental Table 1). The prevalence of iron deficiency for the same years was 9.5% (SE: 0.4%) and 10.8% (SE: 0.4%; P = .01). After adjusting for sociodemographic characteristics, mean ferritin was 2.5 µg/L higher in 2010 than in 2005 (P < .001; Figure 1). The between-year difference only varied significantly by region (P = .01); whereas concentrations were higher in 2010 than in 2005 in the Atlantic, Eastern, and Central regions, there were no significant differences in the Pacific region, Bogota, or the National Territories.
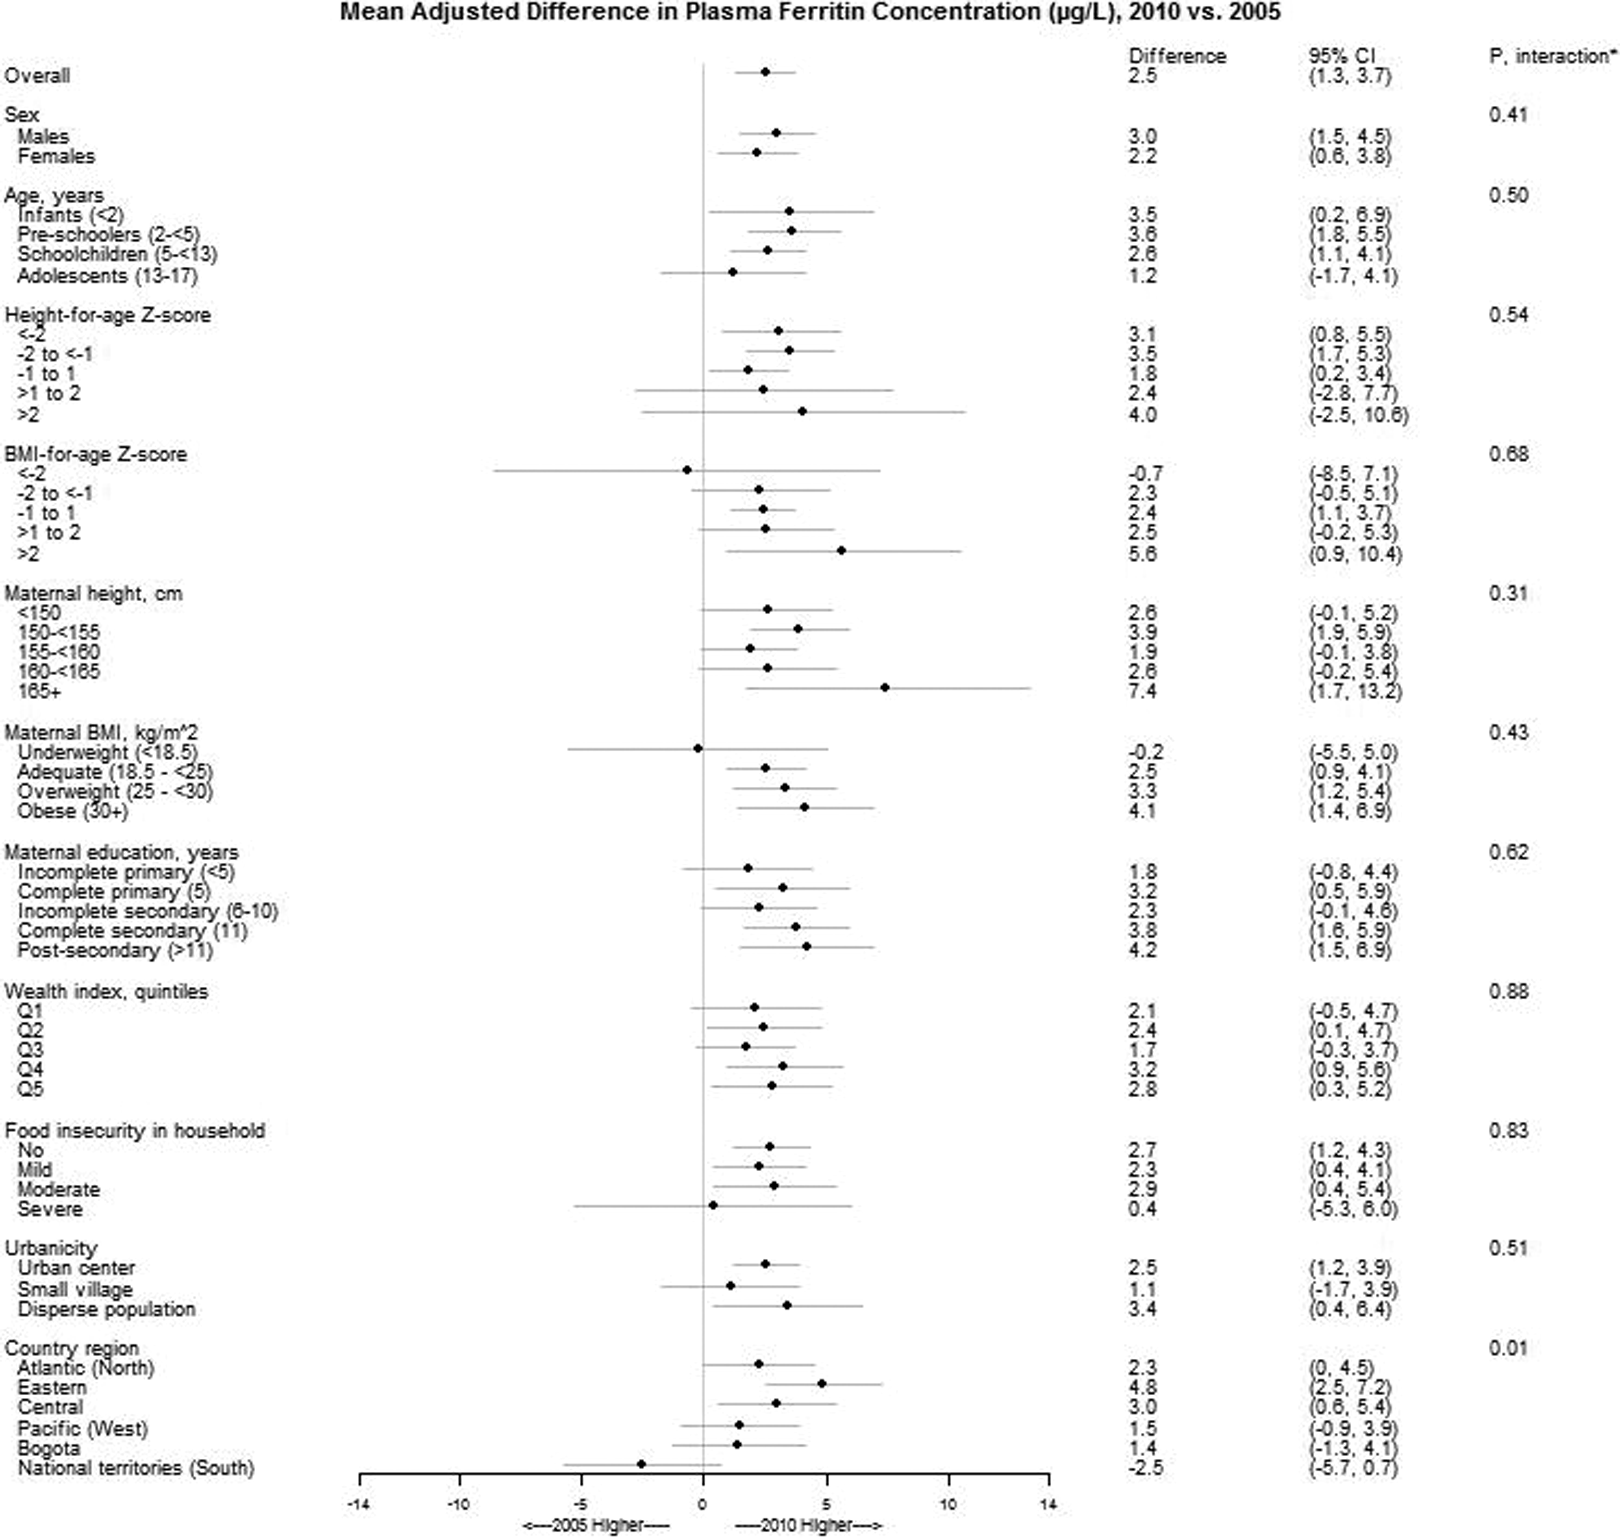
Mean differences (95% confidence interval) in plasma ferritin concentrations of Colombian children between 2010 and 2005 by levels of sociodemographic characteristics. Estimates are from linear regression models with ferritin concentration as the outcome and predictors that included indicator variables for sex, age, height- and BMI-for-age Z scores, wealth index, food security, urbanicity, and country region. An interaction term with survey year was also included in the model for each predictor separately, in order to estimate the mean difference between 2010 and 2005 within levels of the predictor. All models incorporated the complex survey design variables. *From adjusted Wald tests for the interaction term between survey year and the corresponding variable. BMI, body mass index.
In 2010, every year of age was associated with an adjusted 0.2 µg/L higher ferritin concentration (95% confidence interval [CI]: 0.1-0.4; P = .003; Table 1). Every year of maternal education was associated with an adjusted 0.2 µg/L lower ferritin concentration (95% CI: −0.4 to 0; P = .04). Living in the Pacific region was associated with an adjusted 4.4 µg/L lower ferritin level compared with living in the Central region (P = .001).
Adjusted Mean Differences (95% Confidence Intervals)a of Micronutrient Status Indicators in Colombian Children According to Sociodemographic Characteristics, 2010.
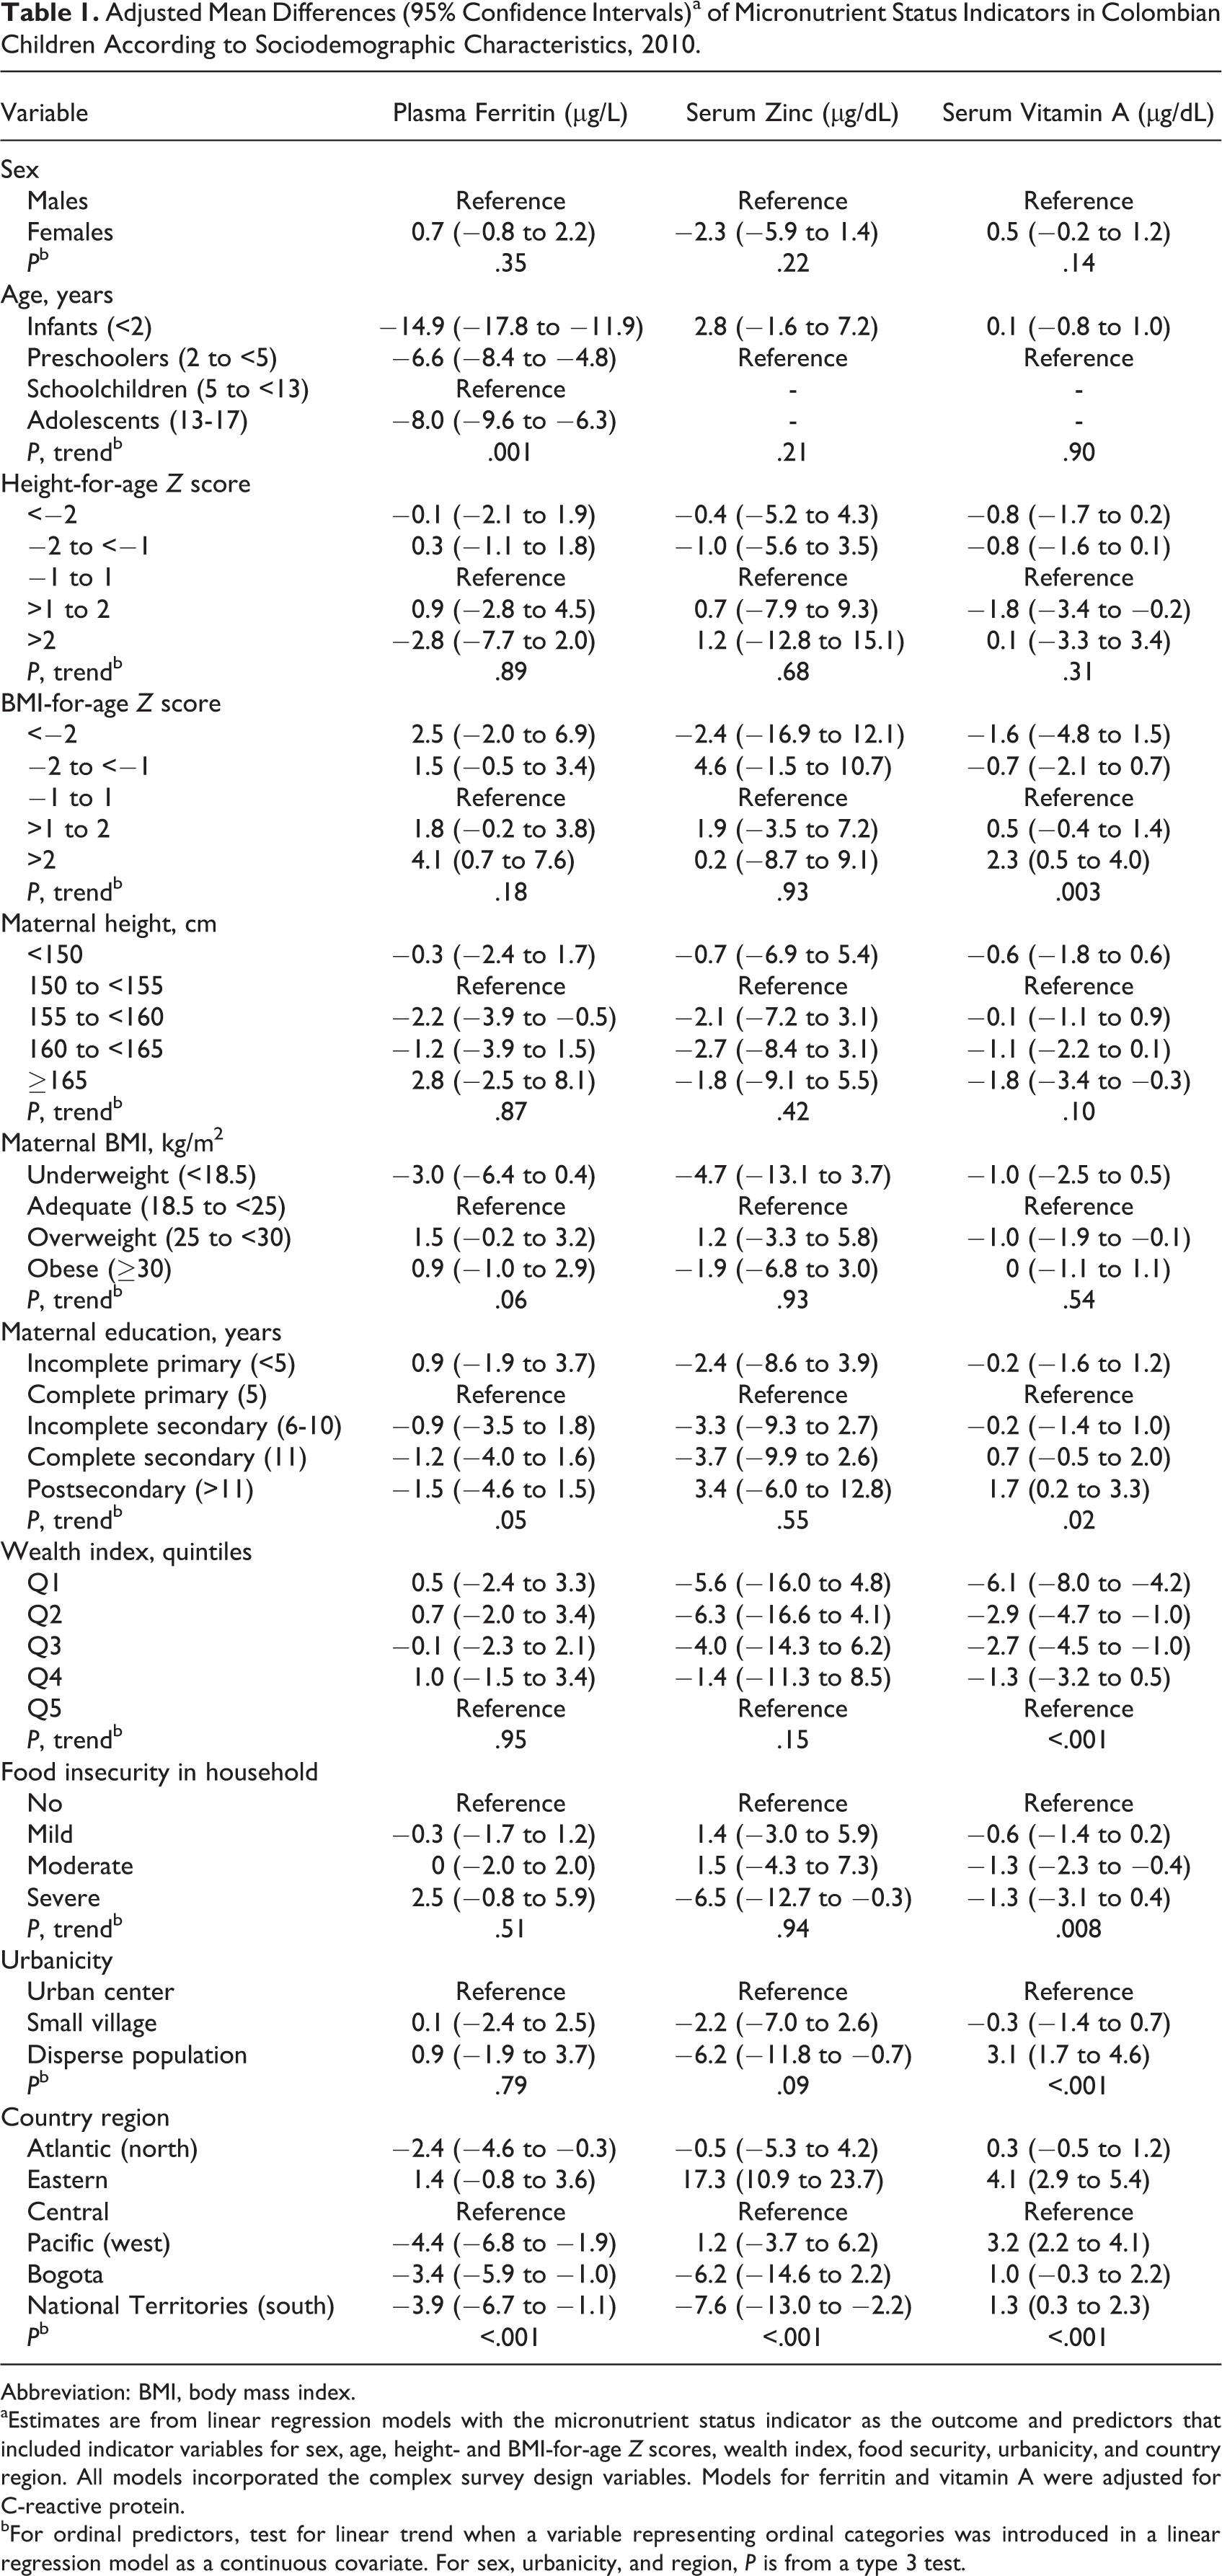
Abbreviation: BMI, body mass index.
aEstimates are from linear regression models with the micronutrient status indicator as the outcome and predictors that included indicator variables for sex, age, height- and BMI-for-age Z scores, wealth index, food security, urbanicity, and country region. All models incorporated the complex survey design variables. Models for ferritin and vitamin A were adjusted for C-reactive protein.
bFor ordinal predictors, test for linear trend when a variable representing ordinal categories was introduced in a linear regression model as a continuous covariate. For sex, urbanicity, and region, P is from a type 3 test.
Zinc
Mean zinc concentration in 2005 and 2010 was 112.9 µg/dL (SE: 2.1 µg/dL) and 78.5 µg/dL (SE: 0.9 µg/dL), respectively (Supplemental Table 1). The prevalence of zinc deficiency for the same years was 26.0% (SE: 1.3%) and 43.3% (SE: 1.0%; P < .001). After adjusting for sociodemographic characteristics, zinc concentration was 34.9 µg/dL lower in 2010 than in 2005 (P < .001; Figure 2). The between-year difference varied significantly by region (P < .001); the largest 2010 versus 2005 difference was seen in the National Territories (−67.1 µg/dL, P < .001), and the smallest occurred in the Pacific region (−11.9 µg/dL, P = .03).
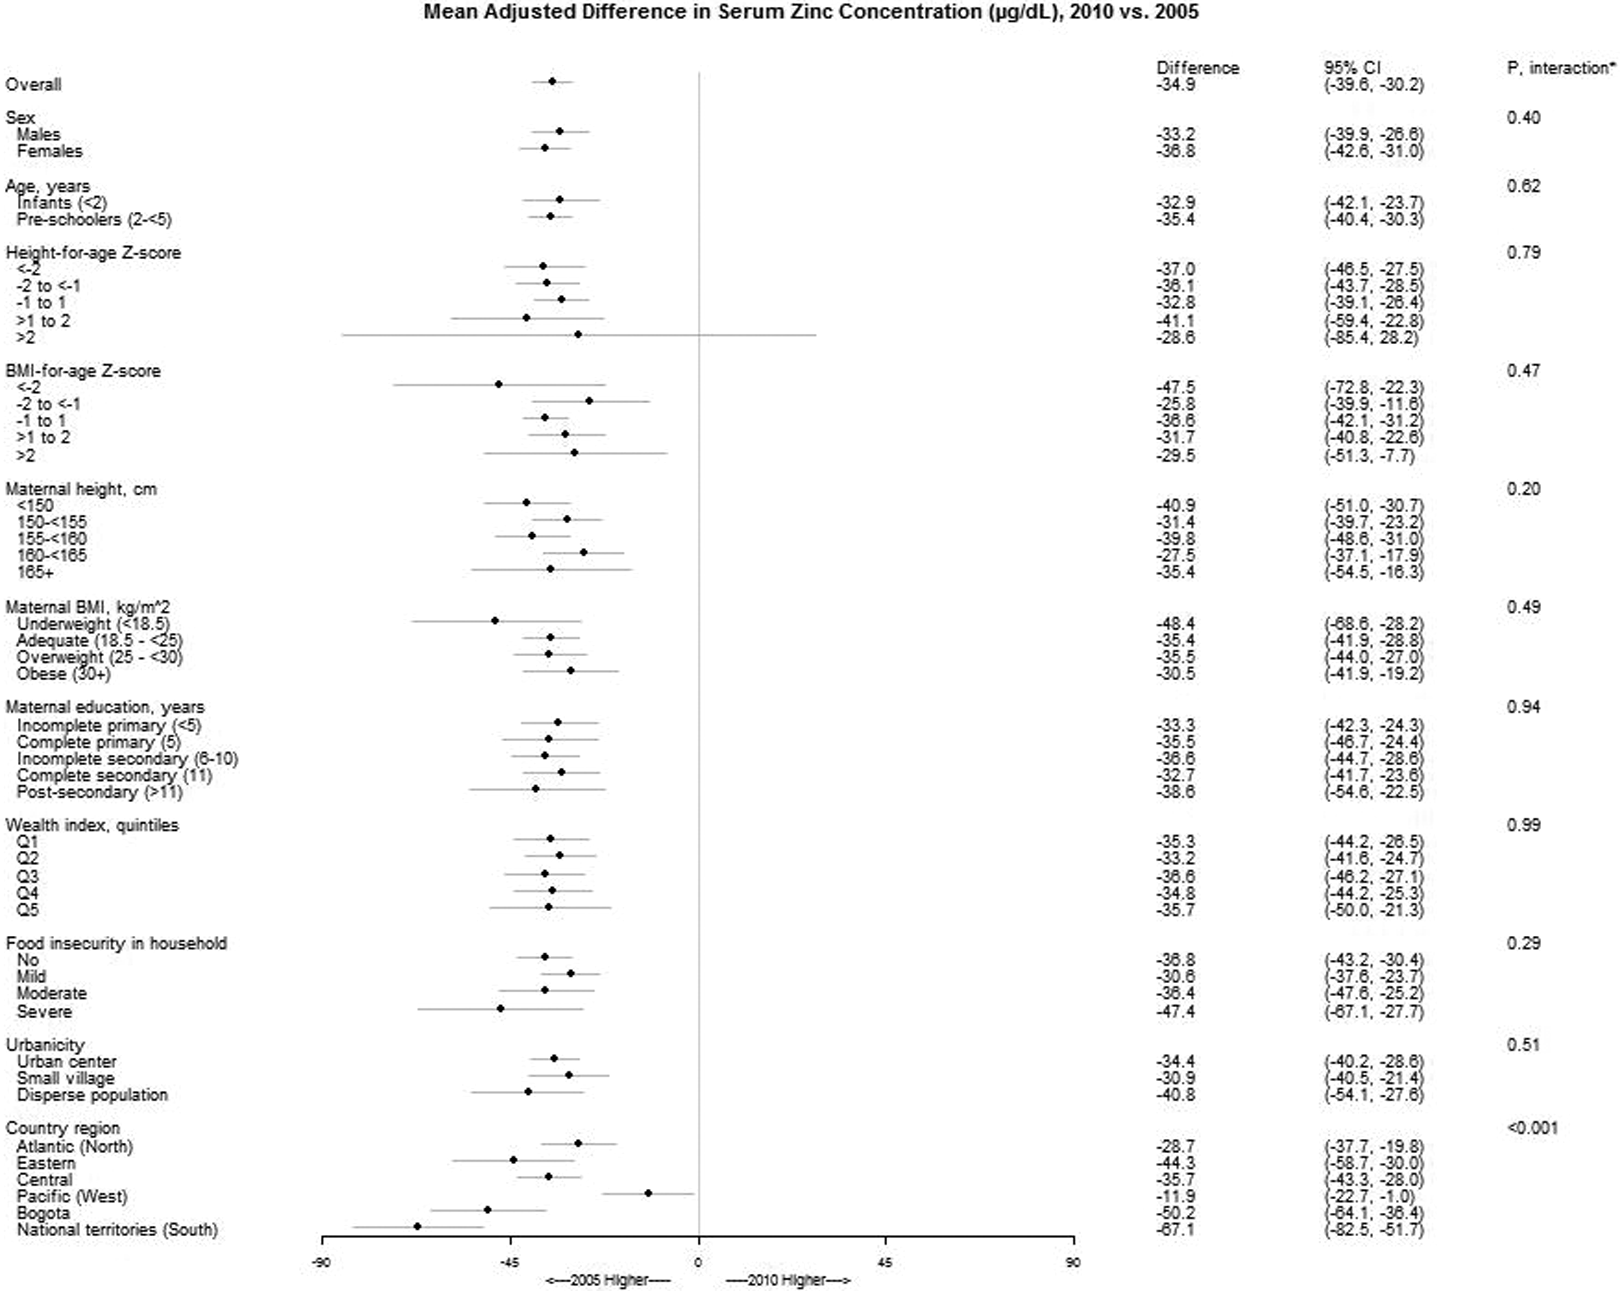
Mean differences (95% CI) in serum zinc concentrations of Colombian children (age 1-4 years) between 2010 and 2005 by levels of sociodemographic characteristics. Estimates are from linear regression models with zinc concentration as the outcome and predictors that included indicator variables for sex, age, height- and BMI-for-age Z-scores, wealth index, food security, urbanicity, and country region. An interaction term with survey year was also included in the model for each predictor separately, in order to estimate the mean difference between 2010 and 2005 within levels of the predictor. All models incorporated the complex survey design variables. *From adjusted Wald tests for the interaction term between survey year and the corresponding variable.
In 2010, living in the National Territories was related to an adjusted 7.6 µg/dL lower zinc level compared with living in the Central region (P = .006; Table 1).
Vitamin A
Mean vitamin A concentration in 2005 and 2010 was 38.5 µg/dL (SE: 0.4 µg/dL) and 26.3 µg/dL (SE: 0.2 µg/dL), respectively (Supplemental Table 1). The prevalence of vitamin A deficiency (serum retinol <20 µg/dL) for the same years was 6.1% (SE: 0.6%) and 24.3% (SE: 0.9%; P < .001). After adjusting for sociodemographic characteristics, mean vitamin A concentration was 11.5 µg/dL lower in 2010 than in 2005 (P < .001; Figure 3). The between-year difference varied significantly by maternal education (P = .007), wealth index (P = .008), and region (P < .001). According to education level, the 2010 versus 2005 difference was largest in children whose mothers had postsecondary education (−13.8 µg/dL, P < .001) and smallest when mothers had incomplete primary education (−9.6 µg/dL, P < .001). The difference was largest in children from households in the highest quintile of wealth (−14.9 µg/dL, P < .001) compared with other quintiles and in the Central region (−15.0 µg/dL, P < .001) than in other areas.
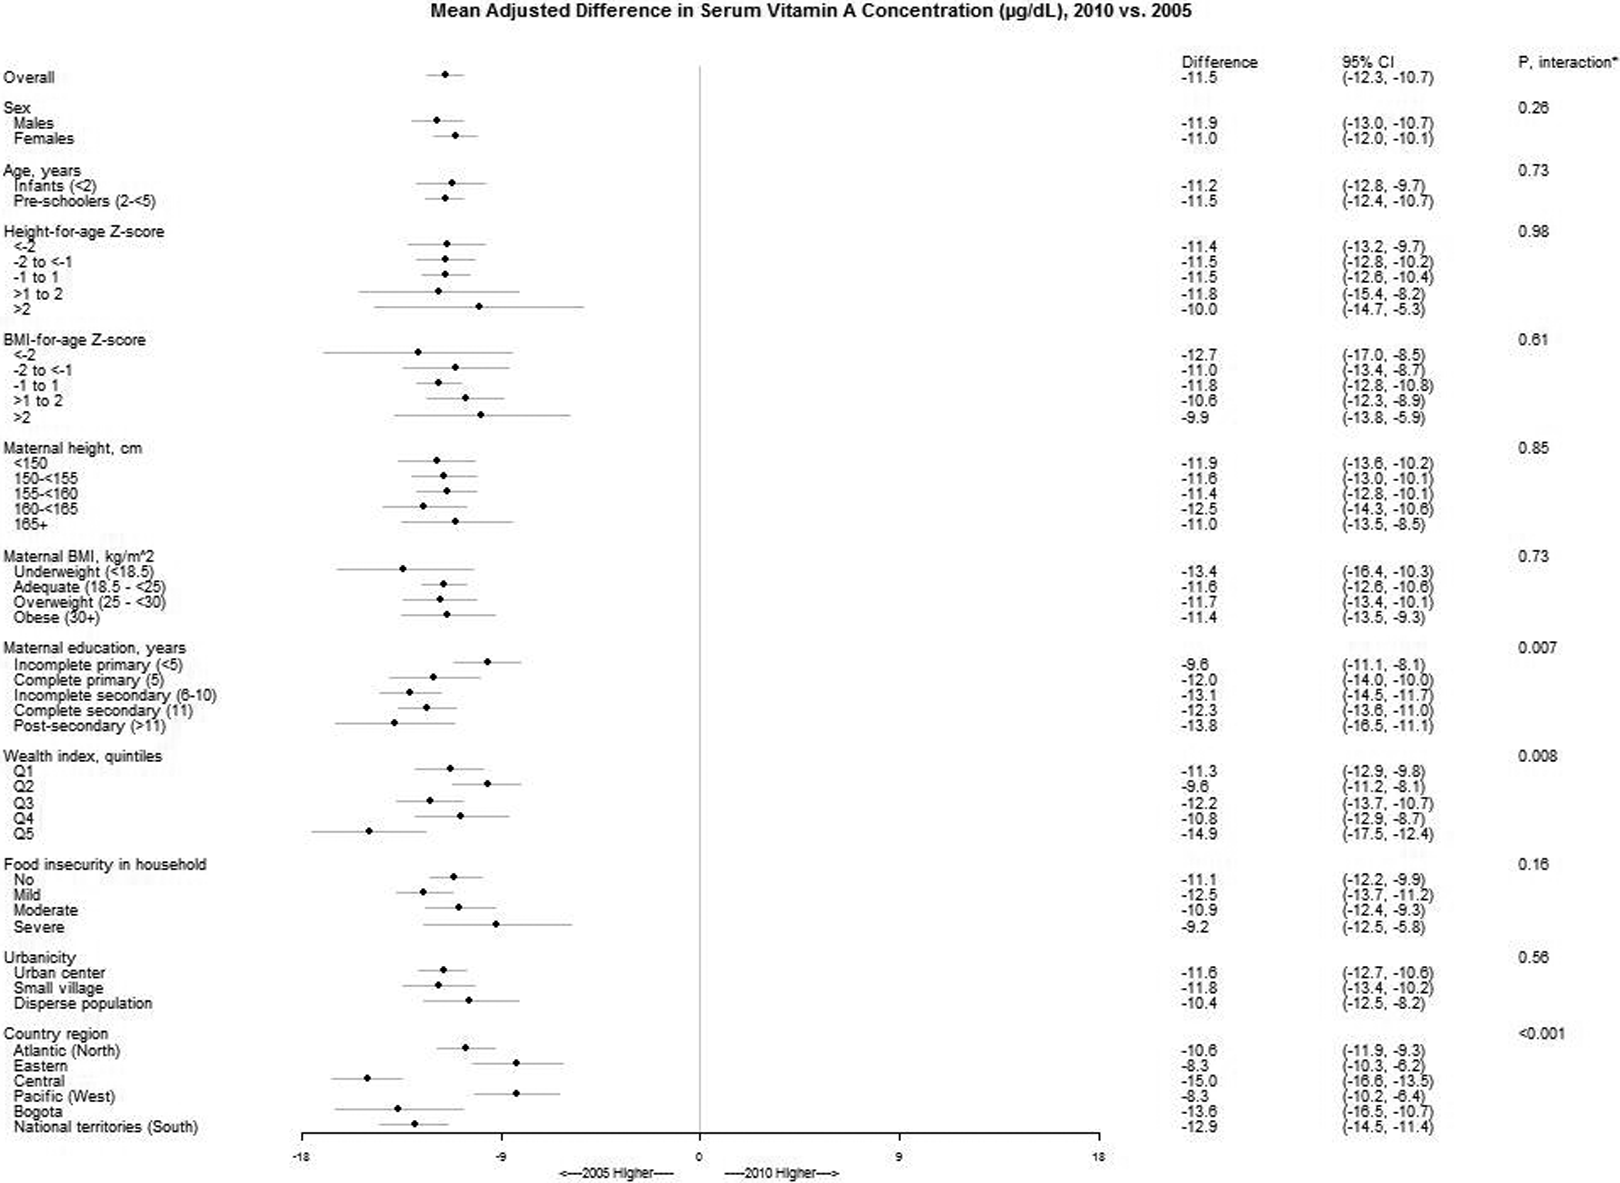
Mean differences (95% CI) in serum vitamin A concentrations of Colombian children (age 1-4 years) between 2010 and 2005 by levels of sociodemographic characteristics. Estimates are from linear regression models with retinol concentration as the outcome and predictors that included indicator variables for sex, age, height- and BMI-for-age Z-scores, wealth index, food security, urbanicity, and country region. An interaction term with survey year was also included in the model for each predictor separately, in order to estimate the mean difference between 2010 and 2005 within levels of the predictor. All models incorporated the complex survey design variables. *From adjusted Wald tests for the interaction term between survey year and the corresponding variable.
In 2010, 1 unit higher BMI-for-age Z score was related to 0.6 µg/dL higher vitamin A level (95% CI: 0.2-1.0; P = .001; Table 1). Every year of maternal education was associated with an adjusted 0.1 µg/dL higher retinol concentration (95% CI: 0-0.3; P = .02). Children in households at the lowest quintile of wealth had an adjusted 6.1 µg/dL lower serum retinol than did children in the highest quintile (P < .001). Children from households with moderate or severe food insecurity had an adjusted 1.3 µg/dL lower serum vitamin A than did children from food-secure households (P = .008 and P = .13, respectively). Vitamin A concentration was significantly higher in children from disperse populations compared with those from urban areas (P < .001) and in children from the Eastern region compared with those from the Central region (P < .001; Table 1).
Discussion
From 2005 to 2010, there was a modest increase in mean plasma ferritin concentration among Colombian children 1 to 17 years old and a substantial decline in serum zinc and vitamin A concentrations among children 1 to 4 years old. These trends varied significantly by region of residence, after adjusting for sociodemographic characteristics. Vitamin A concentration also changed to a different extent by maternal education and wealth index.
Ferritin
The prevalence of iron deficiency in 2010 was 1.3% in excess of that in 2005, despite the mean increase between the years. This is explained by the existence of a higher proportion of children at the lower end of the ferritin concentration distribution in 2010 compared with 2005. Ferritin concentrations increased in most regions but decreased in the National Territories; this decrease could be driving the small increase in iron deficiency prevalence at the national level.
Infants are especially susceptible to iron deficiency, due to accelerated growth in early life and low availability of iron in the diet. 20 -22 In 2010, mean ferritin concentrations were lower in infants compared with older children. The prevalence of iron deficiency in that group (21.4%) is slightly lower than that among Mexican infants in 2012 (24.9%). 23 Yet, the mean increase in ferritin between 2005 and 2010 had been more pronounced in infants than in older children. This may have corresponded to a preferential targeting of infants for inclusion into complementary feeding, iron supplementation during pregnancy, or other programs 24,25 ; however, there are no data available to support that view. New complementary feeding guidelines emphasizing meat as a source of iron may have a beneficial effect on iron status of infants in this population. 26
In 2010, children’s ferritin concentration was inversely associated with maternal education level, after adjusting for sociodemographic characteristics. This is in contrast with previous studies showing that iron deficiency tends to be more common in children from lower socioeconomic status (SES) families compared with those from higher SES backgrounds. 27 In a study of school-aged children from Bogota, Colombia, maternal education was not associated with ferritin concentrations, but the number of households assets, another SES indicator, was positively related to plasma ferritin. 28 It is possible that maternal education in this population is not strongly correlated with wealth, nor does it represent the same mechanisms through which indicators of wealth are related to children’s iron status. For example, limited intake of animal food sources due to poverty might have an effect on children’s iron status regardless of the education level of the mother. We also found that mean ferritin concentration in the Pacific region was lower compared with that in other regions. The Pacific region is a setting with high malaria transmission, 29 which not only impairs iron metabolism and erythropoiesis but also limits the use of iron supplements. 30
Zinc
The prevalence of zinc deficiency in 2010 was substantially higher than in 2005, corresponding to the decline in mean zinc concentrations. This is not consistent with a decrease in inadequate zinc intake that was reported for the Latin American region during a comparable period. 31
There is no evidence to support a causal explanation for the marked decrease in serum zinc levels at the national level between 2005 and 2010. Hence, it is important to consider possible noncausal mechanisms. In a study representative of public school children from Bogota, mean zinc concentration in 2006 was 140 µg/dL. 32 Although this value is not directly comparable with the means found among children <5 years of age in the national surveys, it is much closer to the mean in 2005 (124 µg/dL) than in 2010 (74 µg/dL) for children in Bogota. Thus, systematic measurement error may have affected the survey values for 2010. The specific sources of error could be related to faulty laboratory procedures or data management.
If systematic error was nondifferential with respect to the correlates studied, the comparison of between-year differences across categories of sociodemographic factors can be made validly. This comparison suggests that zinc concentration in the National Territories decreased the most compared with other regions. Potential explanations include low access to animal food sources and increased demand due to high incidence of intestinal infections in this region. 33
Vitamin A
The prevalence of vitamin A deficiency in 2010 was higher than that in 2005, corresponding to the substantial decline in mean vitamin A concentrations between the years. Similar to the findings on zinc, this decline on vitamin A concentrations is not consistent with a reported decrease in vitamin A deficiency in Latin America during a comparable period. 9
There is no evidence for a causal explanation of a nationwide decline in serum retinol between the survey years. Assuming that the difference was due to systematic error in 1 of the surveys and that this error was nondifferential with respect to the correlates studied, the apparent decline was more pronounced in children from wealthier than poorer families or who had higher maternal education level compared with lower education level. This differential decline between the poorer and better-off families could be explained if programs with the potential to improve vitamin A status were implemented between 2005 and 2010 differentially among poorer families. A program of cash transfers to Colombia’s poorest families established in 2002 has resulted in increased expenditure on food, 34 but it is not known whether this may have resulted also in improved micronutrient status. Alternatively, systematic measurement error may have affected SES groups differentially during each survey year.
In 2010, vitamin A concentrations were positively associated with SES indicators, after adjusting for demographic characteristics. This is consistent with results from a study of school children in Bogota, 28 probably because families with higher SES have better access to vitamin A–rich foods, health-care services, and hygiene. We also found that vitamin A concentration was positively associated with BMI-for-age Z score, after adjusting for sociodemographic characteristics, consistent with results from the Bogota study of school children. 28 This result needs to be interpreted with caution, given the cross-sectional nature of the studies, which prevents the making of causal inference. The potential role of vitamin A on the development of adiposity needs to be examined in longitudinal investigations.
A major strength of the current study is that it assessed differences in mean concentrations of plasma ferritin, serum zinc, and vitamin A from nationally representative samples of children. This type of assessment had not been done in this region. The examination of trends in micronutrient status biomarkers may be particularly helpful to policy makers considering that it is not prone to recall bias and other errors typical of intake surveys. One limitation of the study was that children with missing data on ferritin, zinc, vitamin A, or CRP concentration were excluded from the analyses. If having missing data was associated with survey year and micronutrient status, the results could be affected by selection bias. It is also noteworthy that laboratory or data management errors could be potential explanations for the observed substantial declines in zinc and vitamin A concentrations from 2005 to 2010, since there are not obvious reasons that could otherwise explain them. Lack of publicly available, detailed documentation of the quality assurance processes in each survey, including laboratory standard controls used, and their comparability, prevents further inference on potential explanations to the findings. Of note, the unexplained declines occurred in the micronutrient biomarkers (zinc and vitamin A) that were measured in serum samples of a smaller group of younger children but not in plasma ferritin levels, which were measured in a larger group including older children.
In summary, ferritin concentration among Colombian children increased by 2.5 µg/L from 2005 to 2010. The change in this iron status indicator varied substantially by region. Special monitoring is needed in the National Territories. There are no obvious causal explanations to the large apparent decreases in blood levels of zinc and vitamin A. It is not possible to rule out that they are due to systematic error. New assessment of these micronutrient biomarkers at the next national nutrition survey is urgently required.
Footnotes
Authors’ Note
W.L. performed the statistical analyses, wrote the initial draft of the manuscript, and had primary responsibility for the final content. O.F.H. procured the data and participated in study design and data interpretation. E.V. formulated the study question and contributed to data analyses and interpretation. All authors confirm upon submission that the manuscript is an original work and has not been submitted for publication elsewhere. All authors have read and approved the final version of the manuscript. The Colombian National Nutrition Surveys were conducted by the Colombian Institute of Family Welfare and the National Institute of Health of Colombia with support from the Colombian Ministry of Health and Social Protection. Funding sources did not play any role on the design, conduct, analyses, or interpretation of the study.
Declaration of Conflicting Interests
The author(s) declared no potential conflicts of interest with respect to the research, authorship, and/or publication of this article.
Funding
The author(s) received no financial support for the research, authorship, and/or publication of this article.
References
Supplementary Material
Please find the following supplemental material available below.
For Open Access articles published under a Creative Commons License, all supplemental material carries the same license as the article it is associated with.
For non-Open Access articles published, all supplemental material carries a non-exclusive license, and permission requests for re-use of supplemental material or any part of supplemental material shall be sent directly to the copyright owner as specified in the copyright notice associated with the article.