
Abstract
Objective:
To develop a new bioelectrical impedance analysis (BIA) model for analyzing body composition by using isotope dilution, magnetic resonance imaging (MRI), and dual-energy X-ray absorptiometry (DEXA) as the reference methods in young healthy Chinese populations.
Methods:
Thirty healthy participants were enrolled. Their body composition was analyzed using BIA and 3 reference methods. We established a model that uniformed data from 3 references methods (isotope, MRI, and DEXA) into 1 formula. This model was further validated with 209 participants.
Results:
The following BIA body composition adjustment model was developed:
Conclusions:
The accuracy of BIA measurement on body composition and protein mass is significantly improved by our work.
Keywords
Introduction
Examination of human body composition includes the measurement of total body weight (BW), fat mass (FM), fat-free mass, and total body water (TBW), which are crucial parameters in nutritional evaluation, disease diagnosis, and intervention assessment. An abnormality in any of the aforementioned parameters may be associated with certain chronic diseases (chronic kidney disease, metabolic syndrome, metabolic syndrome, etc). 1 -4 Although malnutrition is a growing problem, obesity is becoming another major public health crisis in developed and developing countries, particularly China. 4 -6 According to an authoritative report, obesity affected 128 million Chinese people in 2009; the number is increasing by 38% annually, thus making it a major public health crisis in China. Meanwhile, numerous studies have reported that sarcopenia and obesity typically coexist, particularly in aging populations. 7,8
Thus, an easy applicable body composition evaluation tool is required by both clinical practitioners and researchers. The tool should provide accuracy and be easily applicable and cost effective for diagnosing and managing obesity and aging-related diseases.
In addition, the body composition measurement can be applied for many public health or clinical purposes, such as to evaluate longevity 9 and to predict survival in some critical illnesses and malignancies, particularly cardiovascular diseases. 10 The BW, TBW, and FM are correlated and dynamic under both normal and abnormal metabolic conditions. 11 -14
Bioelectrical impedance analysis (BIA) has been widely used to measure body composition and body fluid in large-scale studies because of its safety, cost-effectiveness, convenience, and easy applicability. 13,14 Over the past years, a few studies have reported modified BIA methods 15 -19 ; however, the results were not satisfactory. For instance, it was reported that direct BIA measurements and using established equations did not meet validation criteria required for predicting TBW among South Asian women. 20 Enormous attempts have been made to obtain an accurate measurement of muscle mass. Also, interest is growing in investigating the change in the protein mass in diseases such as obesity. 21,22 Therefore, a method that can be used to measure the protein mass change in patients with obesity would be helpful for physicians, dietitians, and other healthcare professionals. Such a method may provide data to inform individualized interventions advice for patients, in particular. This novel method, which does not use additional tests, could be applied to evaluate protein mass.
By using isotope dilution, magnetic resonance imaging (MRI), and dual-energy X-ray absorptiometry (DEXA) as the reference methods, this study aimed to establish a reliable prediction model of BIA to analyze body composition, such as the protein mass, of the Chinese population. We also developed a new method to quantify protein mass; the method was based on the correlation between BW, TBW, FM, and bone mass (BM).
Methods
Participants
We enrolled 30 healthy participants from Peking Union Medical College and Tsinghua University meeting the following criteria: (1) healthy and aged 21 to 25 years; (2) body mass index (BMI) in the reference range of 18.50 to 23.90; (3) normal physical examination results; (4) no water–electrolyte disturbance or dyslipidemia, anemia, thyroid disorders, and menstrual disorders in female participants; (5) not a frequent user of cigarettes, alcohol, and diuretics; and (6) not pregnant and did not have a significant BW change in the past 3 months (±>5%). To further verify the accuracy and repeatability of the model we developed, an additional 209 young adults were enrolled in phase 2 study. The inclusion and exclusion criteria are basically same, except that we expanded the age range to 34 in phase 2. Informed consent was also obtained from each participant upon enrollment. This study was approved by the medical ethics committee of Peking Union Medical College Hospital (PUMCH), approval no S-557.
Examinations and Measurements
All conventional examinations were conducted in the clinical laboratory of PUMCH. The examinations included tests for assessing blood, urea, blood lipid profile, and high-sensitivity C-reactive protein, as well as the function of the liver, thyroid, and kidney. Electrocardiography was conducted in the medical examination center of PUMCH. Each participant underwent all examinations and tests within 7 days before undergoing the body component tests to avoid any significant fluctuation in the human body components. Furthermore, examinations and tests for female participants were performed on days when they were not menstruating, including 3 days before or 7 days after the menstrual cycle.
To ensure the conditions are stable for isotope and BIA tests, we conducted these tests in the autumn, when the temperature is moderate, and the participants were tested at room temperature. All participants were asked to drink and eat normally before the day of the test. All participants were tested in the morning before breakfast (after fasting overnight). The TBW was measured using the isotope dilution method. The participants were provided double-labeled water (DLW, 2H and 18O) after a 72-hour observation period; all participants were administered DLW (60 mg/kg) orally followed by 100 mL of distilled water. Urine was collected from the participants immediately before and 5 hours after the DLW administration. All urine samples were examined in the Stable Isotope Laboratory of Institute of Geology and Geophysics, Chinese Academy of Sciences. A stable isotope ratio mass spectrometer (Finnigan MAT 252; Thermo Fisher Scientific Inc, Waltham, Massachusetts, USA) was used for examining 2H and 18O. The measurement was following the procedure developed by International Atomic Energy Agency. 23
The TBW was measured through MRI using a 3.0-T MRI instrument (Discovery MR750w 3.0T; GE Co Ltd, Connecticut). All participants were lying supine for MRI test, and the time is around 25 to 30 minutes for each participant. The conditions of MRI scanning are as follows: time of repetition (TR) 1.7 milliseconds, time of echo (TE) 360 milliseconds, figle angle 12°, window: 48 cm × 48 cm, image resolution: 256 × 256, slicing: 10 mm). For calculating FM, software Amira 5.4.4 (Visage Imaging, Richmond, Australia) was used.
The BM was measured through DEXA by using a lunar apparatus (Prodigy; GE Co Ltd). The BIA was performed by measuring the resistance and reactance at frequencies of 5, 50, 100, 250, and 500 Hz by using a multiple frequency BIA instrument (BCA-2A; Tsinghua Tong Fang Co Ltd, Beijing, China) equipped with 8 electrodes (4 foot electrodes and 4 handheld electrodes). Participants stood motionless with bare feet placed on the electrodes and held hand electrodes while an alternating current (800 μA) was passed through the body. The octopolar resistance and reactance were measured between the right wrist and right ankle while the participants were supine. The impedance index (stature2/resistance; cm2/Ω) was calculated for each participant. The TBW, lean body mass (LBM), and FM were calculated using the manufacturer’s in-built prediction equations, which are based on previous study on body compositions of Chinese. 24 This study used fresh cadavers and revealed the coefficient between TBW and LBM is 0.732.
Statistics and Mathematical Modeling
Kolmogorov-Smirnov test was employed for testing the normality of the data. The Pearson test was used for the correlation analysis. To help the users, we established a model that uniformed data from 3 references methods (isotope, MRI, and DEXA) into 1 formula. Each reference method corresponds to an accurate result for 1 body composition component, and other body compositions can be calculated; thus, we expressed reckoned data and accurate data into 1 table. We used forward ordinary linear model (OLM) to establish adjustment equation. All statistical and modeling processes were performed using R (version 3.1.1) and operated in the computing platform in Metabolomics and Multidisciplinary Laboratory of Trauma Research of Sichuan Academy of Medical Sciences.
Results
Physical Examinations and Laboratory Tests
Physical examination and laboratory test results were within the reference range, indicating a healthy status of the participants (Table 1).
Results of the Physical Examinations and Laboratory Tests of Participants (Mean ± SD).
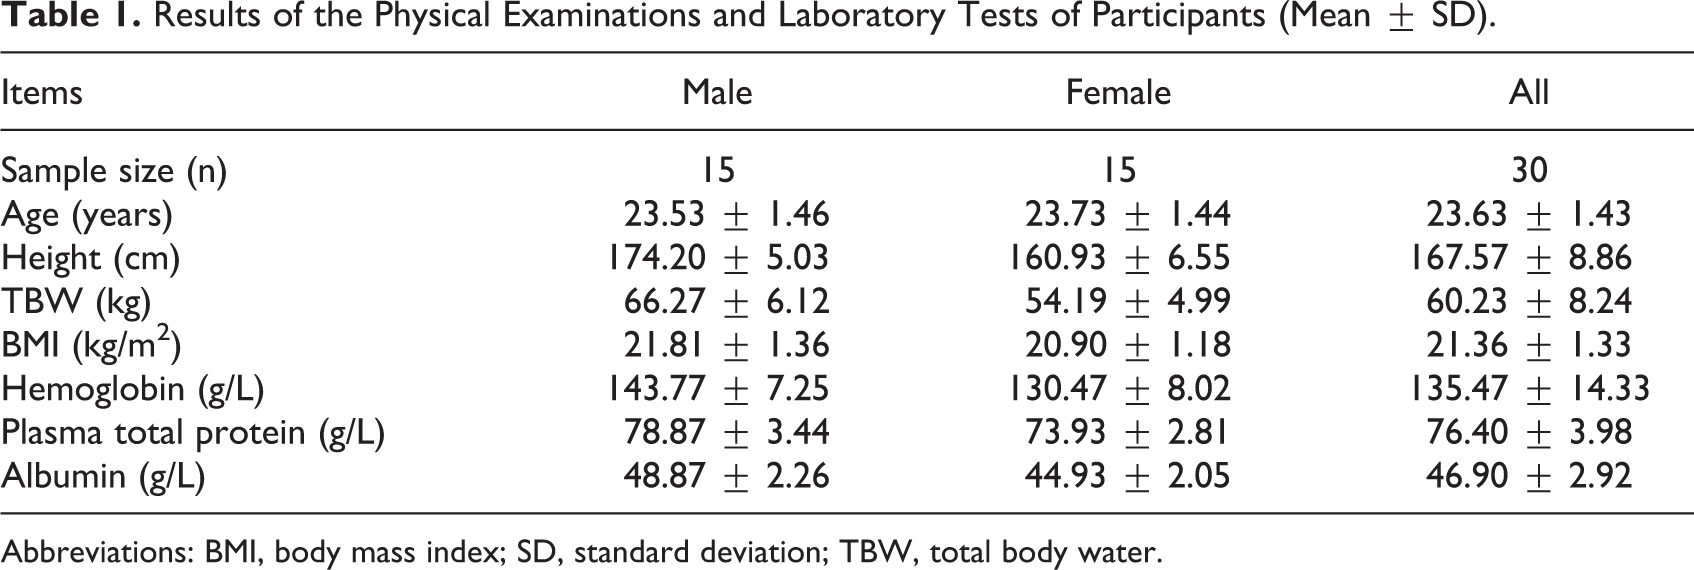
Abbreviations: BMI, body mass index; SD, standard deviation; TBW, total body water.
Total Body Water, FM, and BM Measured Using BIA and the Reference Methods
The TBW of all participants was first estimated using the isotope dilution method on the basis of 2H and 18O measurements. The prediction results from 2H measurement were extremely similar to those from 18O measurement (Figure 1A). The Pearson test showed that the correlation of the results was higher than 0.990. The linear regression equation between 18O and 2H was as follows: Y = 1.05X − 0.19, with R2 = .996 and 95% confidence interval (CI) of β (1.02-1.08), standard error [SE] = 1.30, P < .001; the difference in the TBW measurements was 1.44 ± 0.99 kg. Next, BIA was used to estimate TBW, and the results were compared with those of the 2H isotope dilution test; the TBW result obtained using BIA was significantly higher, with a Pearson correlation of .962 between the 2 sets of results. The linear regression plot was used (Figure 1B). Furthermore, results obtained using BIA were comparable with those obtained using the 2H isotope dilution test, and the regression equation was Y = 0.879X + 1.90, where X and Y represent the BIA and 2H isotope dilution test results, respectively, with R2 = .925 and 95% CI of β (0.782-0.976), SE = 2.41, P < 0.001.
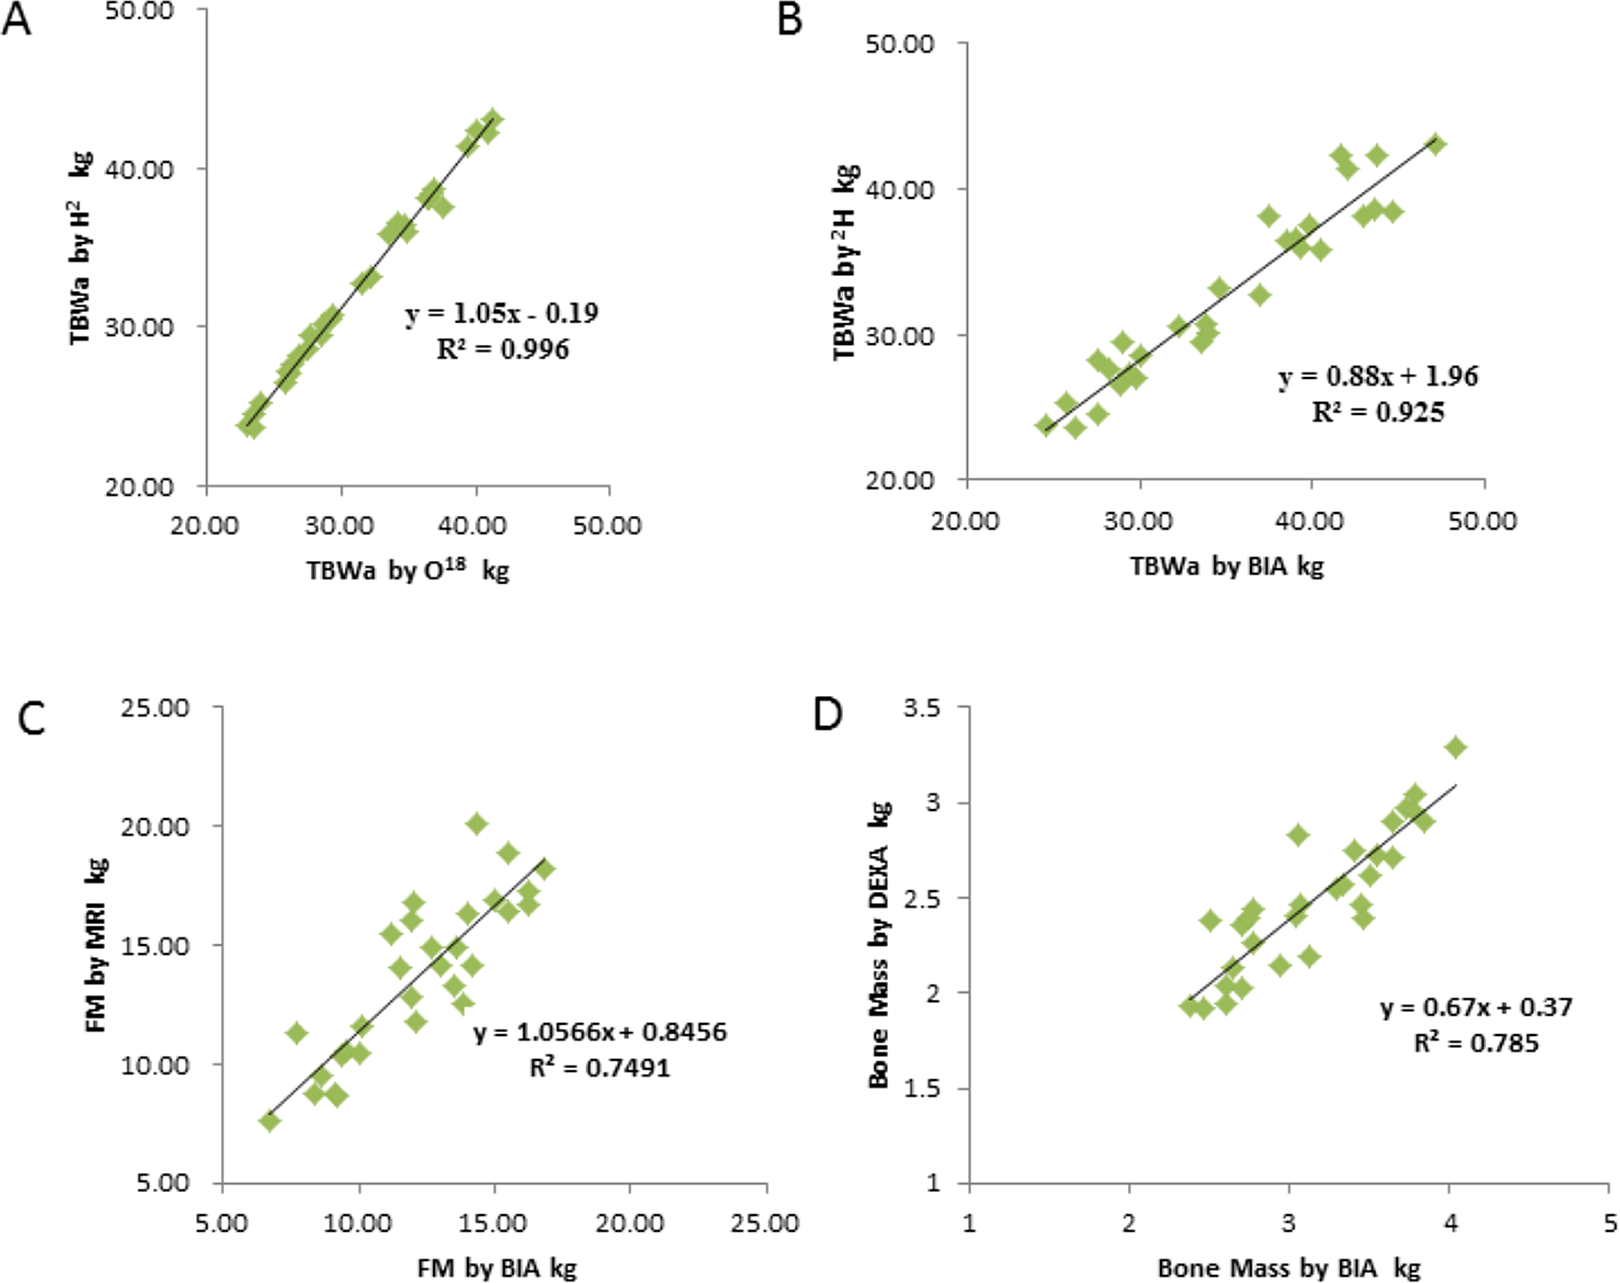
Correlation of body composition measurements obtained using bioelectrical impedance analysis (BIA) and reference methods. A, Correlation of total body water (TBW) measurements obtained after administering double-labeled water (DLW), based on H2 and O18 measurements. B, Correlation of TBW measurements obtained by using BIA and the H2 isotope dilution method. C, Correlation of fat mass (FM) measurements obtained using BIA and magnetic resonance imaging (MRI). D, Correlation of bone mass (BM) measurements obtained using BIA and dual-energy X-ray absorptiometry (DEXA).
The MRI and BIA were used to measure the FM of all participants, and their results were compared. The BIA yielded significantly lower FM values, with a Pearson correlation coefficient of .911. The linear regression of results of the FM from MRI and BIA is shown in Figure 1C. The regression equation was as follows: Y = 1.0566X + 0.8456, where X and Y represent the BIA and MRI results, respectively, with R2 = .75 and 95% CI of β (0.820-1.293), SE = 1.73, P < .001.
The BM of the participants was estimated using both DEXA and BIA. Compared with DEXA, the BM result obtained using BIA was significantly high, with a Pearson correlation coefficient of .886. The linear regression is shown in Figure 1D. The linear regression equation was as follows: Y = 0.67X + 0.37, where X and Y represent the BIA and DEXA results, respectively, with R2 = .785 and 95% CI of β (0.535-0.807), SE = 0.17, P < .001.
Development of a Uniform Adjustment Mathematic Model for BIA
On the basis of the aforementioned results, the following 3 linear regression equations were used to adjust the BIA results:


Testing using BIA is best when using 1 equation. To facilitate this, we used nonlinear local fitting algorithm and introduced 1 index variable k to combine 3 equations into 1 that presented hereafter.
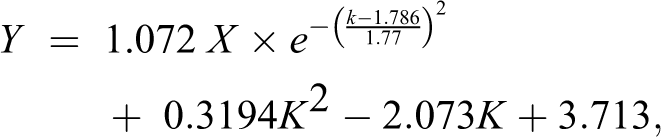
where X represents the impedance index; when K = 1, 2, and 3, Y represents TBW, FM, and BM, respectively. The accuracy was no less than 93.3% when the root mean square error (RMSE) was 1.96 kg.
Results of Accurate Data and Reckoned Data From Reference Methods and Equation for Protein Mass Prediction
Each reference method corresponds to an accurate result for 1 body composition component; therefore, we expressed accurate data from relevant reference method (isotope for TBW, MRI for FM, and DEXA for BM) and the reckoned data in 1 table (Table 2).
Results of Accurate Data and Reckoned Data From Reference Methods.
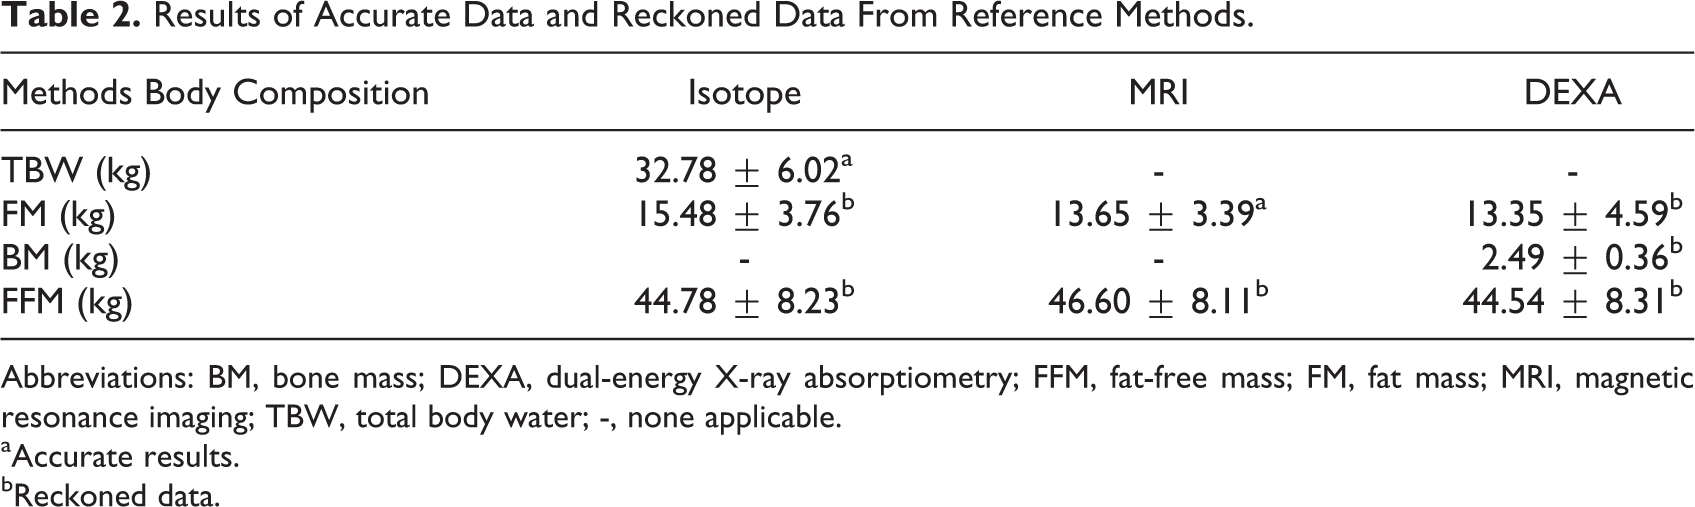
Abbreviations: BM, bone mass; DEXA, dual-energy X-ray absorptiometry; FFM, fat-free mass; FM, fat mass; MRI, magnetic resonance imaging; TBW, total body water; -, none applicable.
aAccurate results.
bReckoned data.
Thus, the weight in each column can be calculated, and the reckoned weight can be compared with the real weight by estimation.
After adjustment of BIA results using the 3 reference methods, the relative accurate value can be estimated for all the major body composition components, including protein mass.
The associations are as follows:


Therefore, we established a uniform model to calculate the protein concentrations:
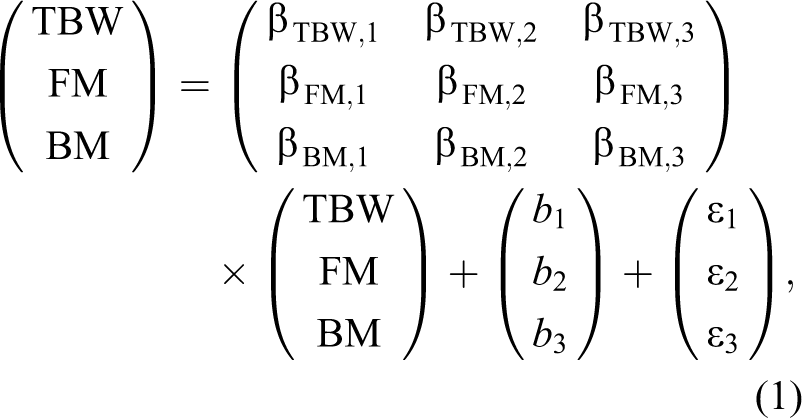
wherein β ij = regression coefficient, ∊ k = random error, and ∊ k ∼N(0, 1).
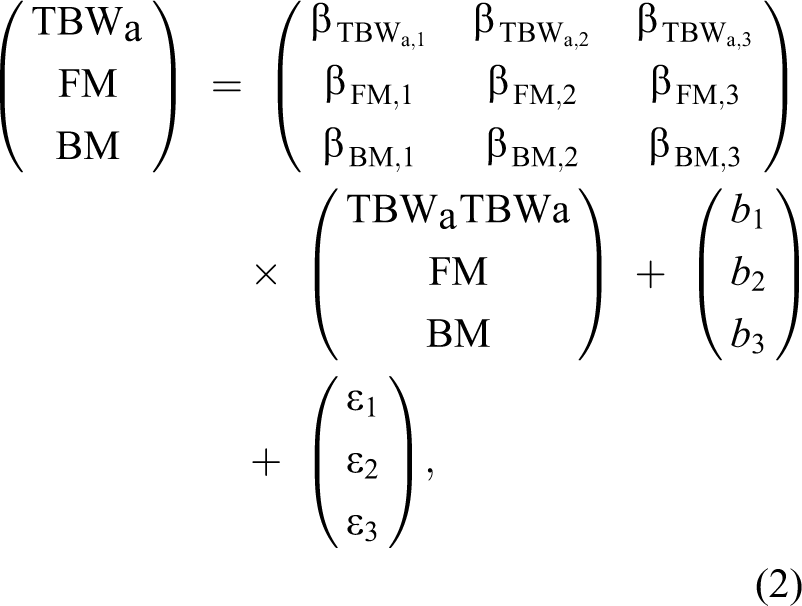
A forward stepwise OLM can be used to calculate βTBW, βFM, and βBM. The simulation results RTBW2 = 0.925, RFM2 = 0.855, and RBM2 = 0.785 were obtained. The modeling processes on the basis of the relevant equations of body compositions are as follows:
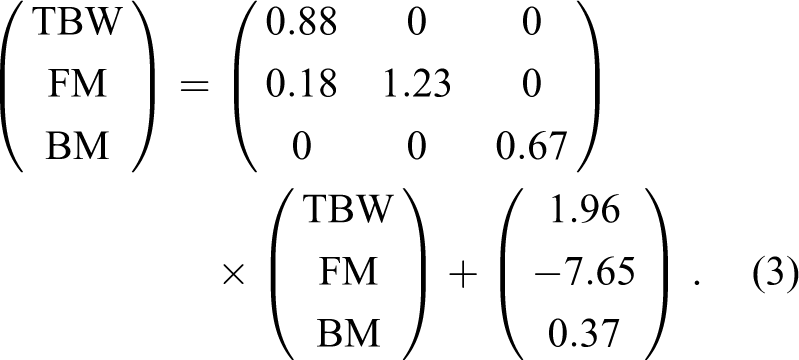


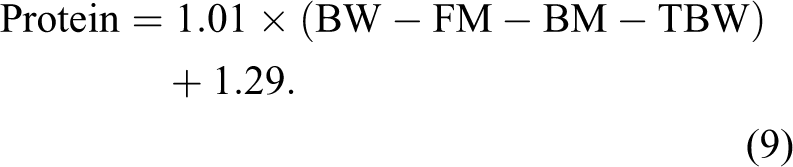
Proteins can be calculated using the following equation:

According to Equation (3),
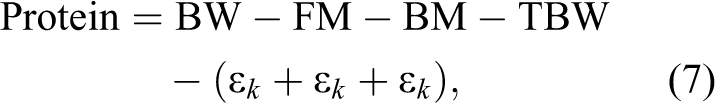
when ∊ = −(∊ k + ∊ k + ∊ k ), known as ∊ ∼ N(0, 3), we developed a regression model to calculate protein mass. When ∊ = −(∊ k + ∊ k + ∊ k ), known as ∊ ∼ N (0, 3), a linear regression equation can be obtained.
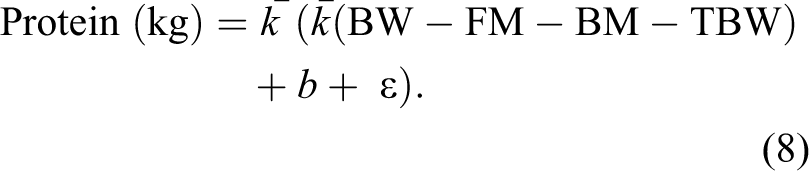
where
Verification of the Adjustment of the BIA Model in a Larger Sample Size (Phase 2 Study)
The average age of the participants (n = 209) was 27.61 ± 2.98 years, and their BMI was 22.22 ± 2.89 kg/m2. Of all participants, 107 were males with an average age of 27.27 ± 2.79 years, and their BMI was 23.22 ± 8.75 kg/m2. Moreover, 102 participants were females with an average age of 27.94 ± 3.13 years, and their BMI was 21.27 ± 2.89 kg/m2. Laboratory tests revealed that all parameters were in the reference range. Furthermore, FM measured through DEXA and BIA were 16.00 ± 6.00 kg and 15.32 ± 5.60 kg, respectively. By using DEXA as the reference and correlation R2 = .935 (P < .001), the linear equation was Y = X + 0.691 (R2 = .874, P < .001). The LBM measured through DEXA was 43.02 ± 8.34 kg and that measured by using BIA was 45.85 ± 8.81 kg. By using DEXA as the reference and R2 = .966, the linear equation was Y = 0.959X + 1.046 (R2 = .934). We used the universal adjustment equation developed in phase 1 to adjust the BIA results and compare them with the DEXA results. We used a model established in phase 1 to obtain the adjustment muscle mass by using BIA and observed an extremely favorable fit of the model: The muscle mass measured through DEXA was 42.05 ± 8.02 kg and that measured by using BIA was 44.97 ± 8.43 kg. By using DEXA as the reference and R2 = .9997, F-statistics = 759 700 and P < .001 (Figure 2).
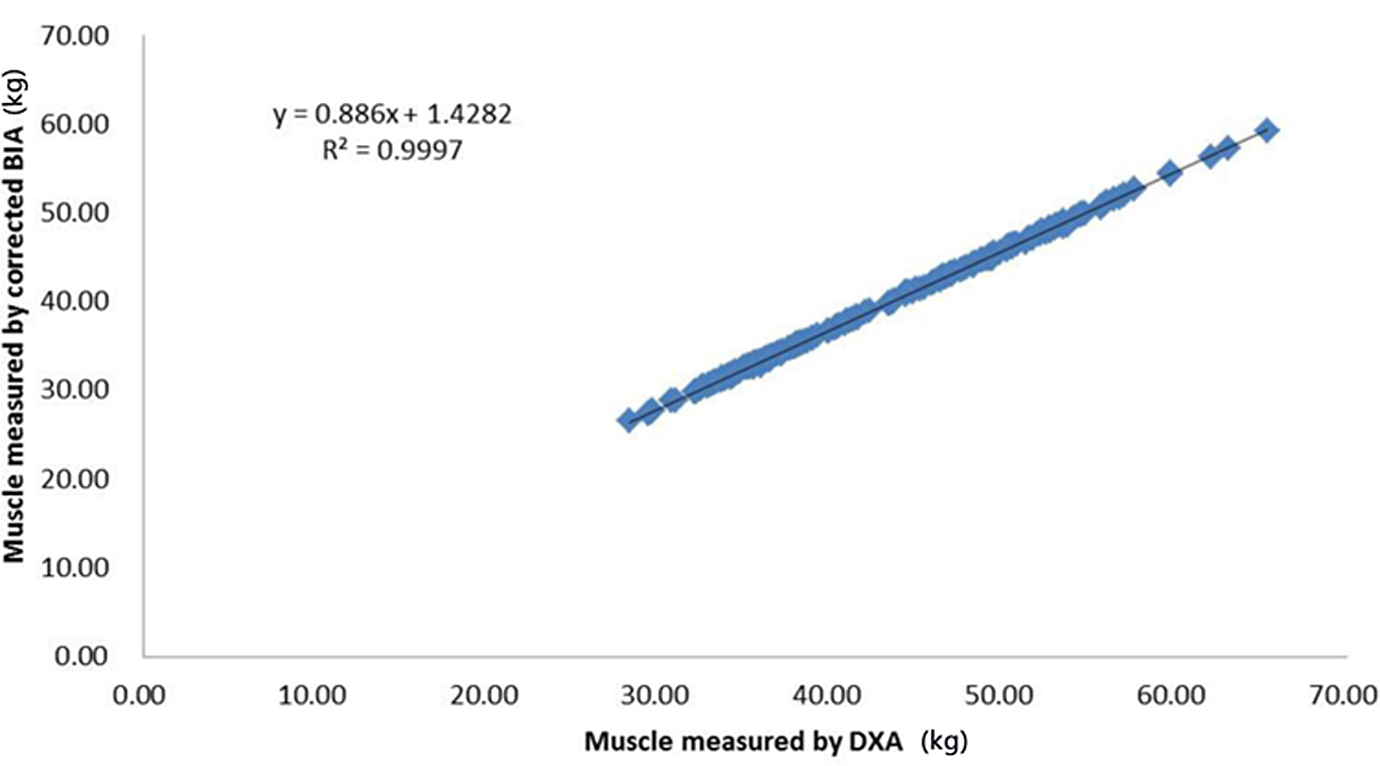
Correlation between dual-energy X-ray absorptiometry (DEXA) and the adjusted bioelectrical impedance analysis (BIA) on measurement of muscle mass.
We also calculated the RMSE between the adjusted BIA and DEXA by using the following formula:
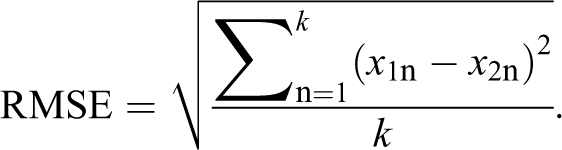
The RMSE value was 0.133, which indicates that the error between DEXA and the adjusted BIA using our model is acceptable. In brief, our model revealed no significant difference in the results of LBM measured using the adjusted BIA.
Furthermore, we used Equations (1) to (9) to calculate the protein mass of the 209 participants and obtained a protein mass of 10.70 ± 2.20 kg (95% CI, 6.3-15.0).
Discussion
This study demonstrated that multifrequent BIA is a reliable method for predicting the body composition of healthy young Chinese adults. The prediction equations developed in this study can also be used to accurately predict body composition and whole-body protein mass.
Recently, a few studies reported the use of specific reference methods to adjust BIA results. 15 -17 However, none of these studies successfully established a universal BIA prediction model for accurately measuring all 3 indicators (TBW, FM, and BM), because a specific reference method is only adequately accurate for predicting 1 specific component of body composition. We compared the BIA-based assay equation with 3 reference methods (isotope dilution, MRI, and DEXA) and demonstrated the accuracy of the BIA-based method for predicting TBW, FM, and BM. Our study revealed that the universal model is steady, indicating that the adjusted BIA method can be used as a method for determining muscle mass in large-scale population-based studies.
Protein constitutes a major part of the human body and is a functional component of muscle. Growing evidence reveal that protein synthesis is impaired in obesity and other disease conditions. 22 -27 The measurement of protein mass would be beneficial in the clinical evaluation and nutritional monitoring. Although many studies have attempted to investigate the mechanism underlying protein synthesis and decomposition in disease conditions, no study has reported a method that can provide a quantitative measurement of protein mass. Consequently, our study would enable physicians and health-care professionals to translate the knowledge from basic studies to clinical practice by developing a method based on BIA to calculate total protein mass.
This study has limitations. Our study was based on population groups, which only included healthy young Chinese adults. In addition, we attempted to establish an error-adjusting model based on comparison between BIA and reference methods, thus the parameters robustness may be affected by the sample size, which is small. Appropriate sample size relies on statistical distribution of prior data and our study is the very first to compare BIA and the 3 reference methods; there is yet not enough data to determine the correct sample. In the future study, we will make further effort to enroll more samples based on the current study.
In conclusion, the present work indicates that by using adjustment algorithm we developed, BIA is an easy, fast, and reliable method for determining body composition and protein mass.
Footnotes
Acknowledgments
The authors acknowledge Professor Sai-nan Zhu from Department of Statistics of Peking University, who assisted in using the conventional statistical methods; Professor Jin Peng from the Sichuan Academy of Medical Sciences, who assisted in mathematical modeling; Professors Feng Feng and Dr Bo Hou who helped in radiological image analysis; and Mr Lu He from the University of Waikato and Dr Charles Damien Lu of Los Angeles Mental Health Center who helped in reviewing and revising the manuscript.
Authors’ Note
W. Chen, H. Jiang and J-c. Yu conceived and designed the research. W. Chen, J-x. Yang, X. Y. Zhen, L-j. Feng collected the data. W. Chen, H. Jiang, J-x. Yang analyzed the data. H. Jiang, H. Yang contributed to mathematical modeling. W. Chen, H. Jiang, J-x. Yang, H. Yang, and J-c. Yu wrote the manuscript. W. Chen and J-c. Yu had primary responsibility for the final content of the manuscript. All authors revised and approved the final manuscript.
Declaration of Conflicting Interests
The author(s) declared no potential conflicts of interest with respect to the research, authorship, and/or publication of this article.
Funding
The author(s) disclosed receipt of the following financial support for the research, authorship, and/or publication of this article: This study was partially supported by the Department of Science and Technology of Sichuan Province (2015SZ0110 and 2014FZ0125, to JH).