
Abstract
Background:
Secular trends in height reported from developing countries are few and scarce.
Objective:
To assess secular trends in linear growth in boys and girls from birth to 18 years of life in rural households of India based on periodical cross-sectional surveys conducted over a period of 35 years.
Materials and Methods:
The present study uses data from baseline and final surveys of National Nutrition Monitoring Bureau from 1975 to 1979 (N = 6043) to 2012 to 2013 (N = 11 910) on anthropometry from birth to 18 years from 7 states in households of rural India.
Results:
The overall improvement in 18+ boys and girls was 3.1 and 1.0 cm, respectively, over a period of 35 years. The increments in height of 18+ were highest for both boys (7.4 cm) and girls (4.8 cm) in the state of Kerala followed by Tamil Nadu (boys, 7.3 cm and girls, 3.8 cm). Under-5 stunting rates reduced from 82% in the baseline survey to 45.7% in the final survey at 1.35% per year in the pooled states and was similar in both boys and girls. The recovery in stunting was highest in Tamil Nadu (1.63% per year) followed by Kerala (1.46% per year).
Conclusion:
The pattern of secular trends in height in rural India seen over 3 decades was strikingly similar to that of developed countries. The phenomenal improvement in linear growth in Kerala and Tamil Nadu in children younger than 5 years and adolescents suggests that growth potential for Indians is similar to that of developed countries.
Introduction
Stunting in developing countries represents a grave threat to the health and economic productivity of a nation. 1 That the recovery rates in stunting are gradual and not necessarily complete in one generation 2 implies the plastic nature of height. Secular trends in adult’s height in developed countries seen in the 19th and 20th century due to improvement in living conditions is a sufficient proof of the plasticity of height. 3,4 However, in India, despite good economic growth 5 over the past few decades, stunting is seen in nearly 1 in every 2 children younger than 5 years. 6 This has led some researchers to question the genetic nature of stunting in India. 7
Several small-scale studies in India have shown positive secular trends in height in the rich, where sons and daughters were taller than their fathers and mothers, respectively, but were not seen in the poor. 8,9 A cross-sectional study by us using the third National Family Health Survey (NFHS-3) has shown varied and modest secular trends in height in different states of India. 10 A positive and highest secular trend in height in Kerala and negative and lowest in Meghalaya in that study was linked to sociodemographics in those respective regions. 10
Cole, in his seminal paper on secular trends in growth, 11 has described the nature of secular trends and its striking similarity in the Dutch and Japanese population (a further proof of nongenetic nature of height), which provided us a link to secular trends in adult’s height and secular trends in child’s height at 2 years, the age by which most of the growth faltering takes place in India 2 and elsewhere. 12 However, most of the studies reported by Cole were conducted on data from developed countries.
There is little or scant data on secular trends in linear growth in developing countries like India based on periodical cross-sectional studies that may give us better picture of linear growth for the first 2 decades of life. Our interest, therefore, is to examine changes in linear growth for boys aged 0+ (less than 1 year) to 18+ (less than 19 years) from 35 years of National Nutrition Monitoring Bureau (NNMB) surveys in rural India and whether the pattern of linear growth is similar to that of developed countries.
Materials and Methods
The Indian Council of Medical Research established the NNMB in 1972 in 10 states, that is, Kerala, Tamil Nadu, Karnataka, Andhra Pradesh, Maharashtra, Gujarat, Madhya Pradesh, Orissa, West Bengal, and Uttar Pradesh. 13 The NNMB carried out repeat surveys in rural areas, by visiting the same villages at an interval of 10 years, to study the time trends in the diet and nutritional status of rural population. The baseline, 14 first, 15 and second repeat 16 surveys were carried out among households (HHs) of rural population during 1975 to 1979 (N = 6043 HHs), 1988 to 1990 (N = 6018 HHs), and 1996 to 1997 (N = 6551 HHs), respectively. The third repeat survey 17 was carried out recently in 2012 to 2013 (N = 11 910 HHs). The design of the surveys and the methodologies of the surveys were discussed elsewhere. 17 For the present study, tabulated data reported in the third repeat survey 17 for the first and last survey on anthropometry were used to assess increments in height and weight in boys and girls for the first 2 decades of life (0+ to 18+). 0+ indicates age group of 0 to 1 year and so on. The first 2 repeat surveys did not have data for the states of Uttar Pradesh, West Bengal, and Madhya Pradesh and therefore not used in the analysis.
Statistical Analysis
R Programming software version 3.0.1 was used for data analysis. R Macro using World Health Organization (WHO) growth standards was used to calculate height-for-age Z (HAZ) and body mass index Z (BMIZ) scores. For the purpose of calculating Z scores from reported height and weight, age was used as a midpoint of each age category (for 0+, 6 months as a midpoint between 0 and 1 year was used; for 18+, 222 months was used as the age). Total increment in growth was calculated by subtracting the measures of anthropometry (height, weight, HAZ, and BMIZ) of the first survey from the last survey. For calculating increment per decade, the total increment was divided by 35 years (nearest midpoint of both surveys, ie, 1977 and 2012). ggplot2 package version 1.0.0 and gridExtra package version 2.0.0 were used to create graphs. Loess curves with standard errors were plotted for each of the anthropometric index, with age stratified by sex to assess patterns in changes in growth over a period of time.
Results
Trends in Height and Weight From 0+ to 18+ (States Pooled)
Mean height and weight in the baseline survey and final survey across age groups are shown in Tables 1 to 4. Increments in height were highest in 12-year-old girls (19 mm per decade) and 15-year-old boys (21 mm per decade), but increments in height attained in 18 years old and 18 months old (1+) were much lower compared to increments in heights seen in early adolescence (Tables 1 and 2; Figure 1, pooled states). The increments at 18 years were 9 mm per decade in boys and 3 mm per decade in girls. This was closer to increments of height at 18 months (9 mm per decade in boys and 8 mm per decade in girls). As for weight, the highest improvement across ages was 1.8 and 1.2 kg in 15-year-old boys and 12-year-old girls, respectively (Tables 1 and 2).
Mean Height (cm) of Boys During the First Survey (1975-1979) and Change in Height for the Final Survey (2011-2012) in NNMB-Surveyed States in Rural India.
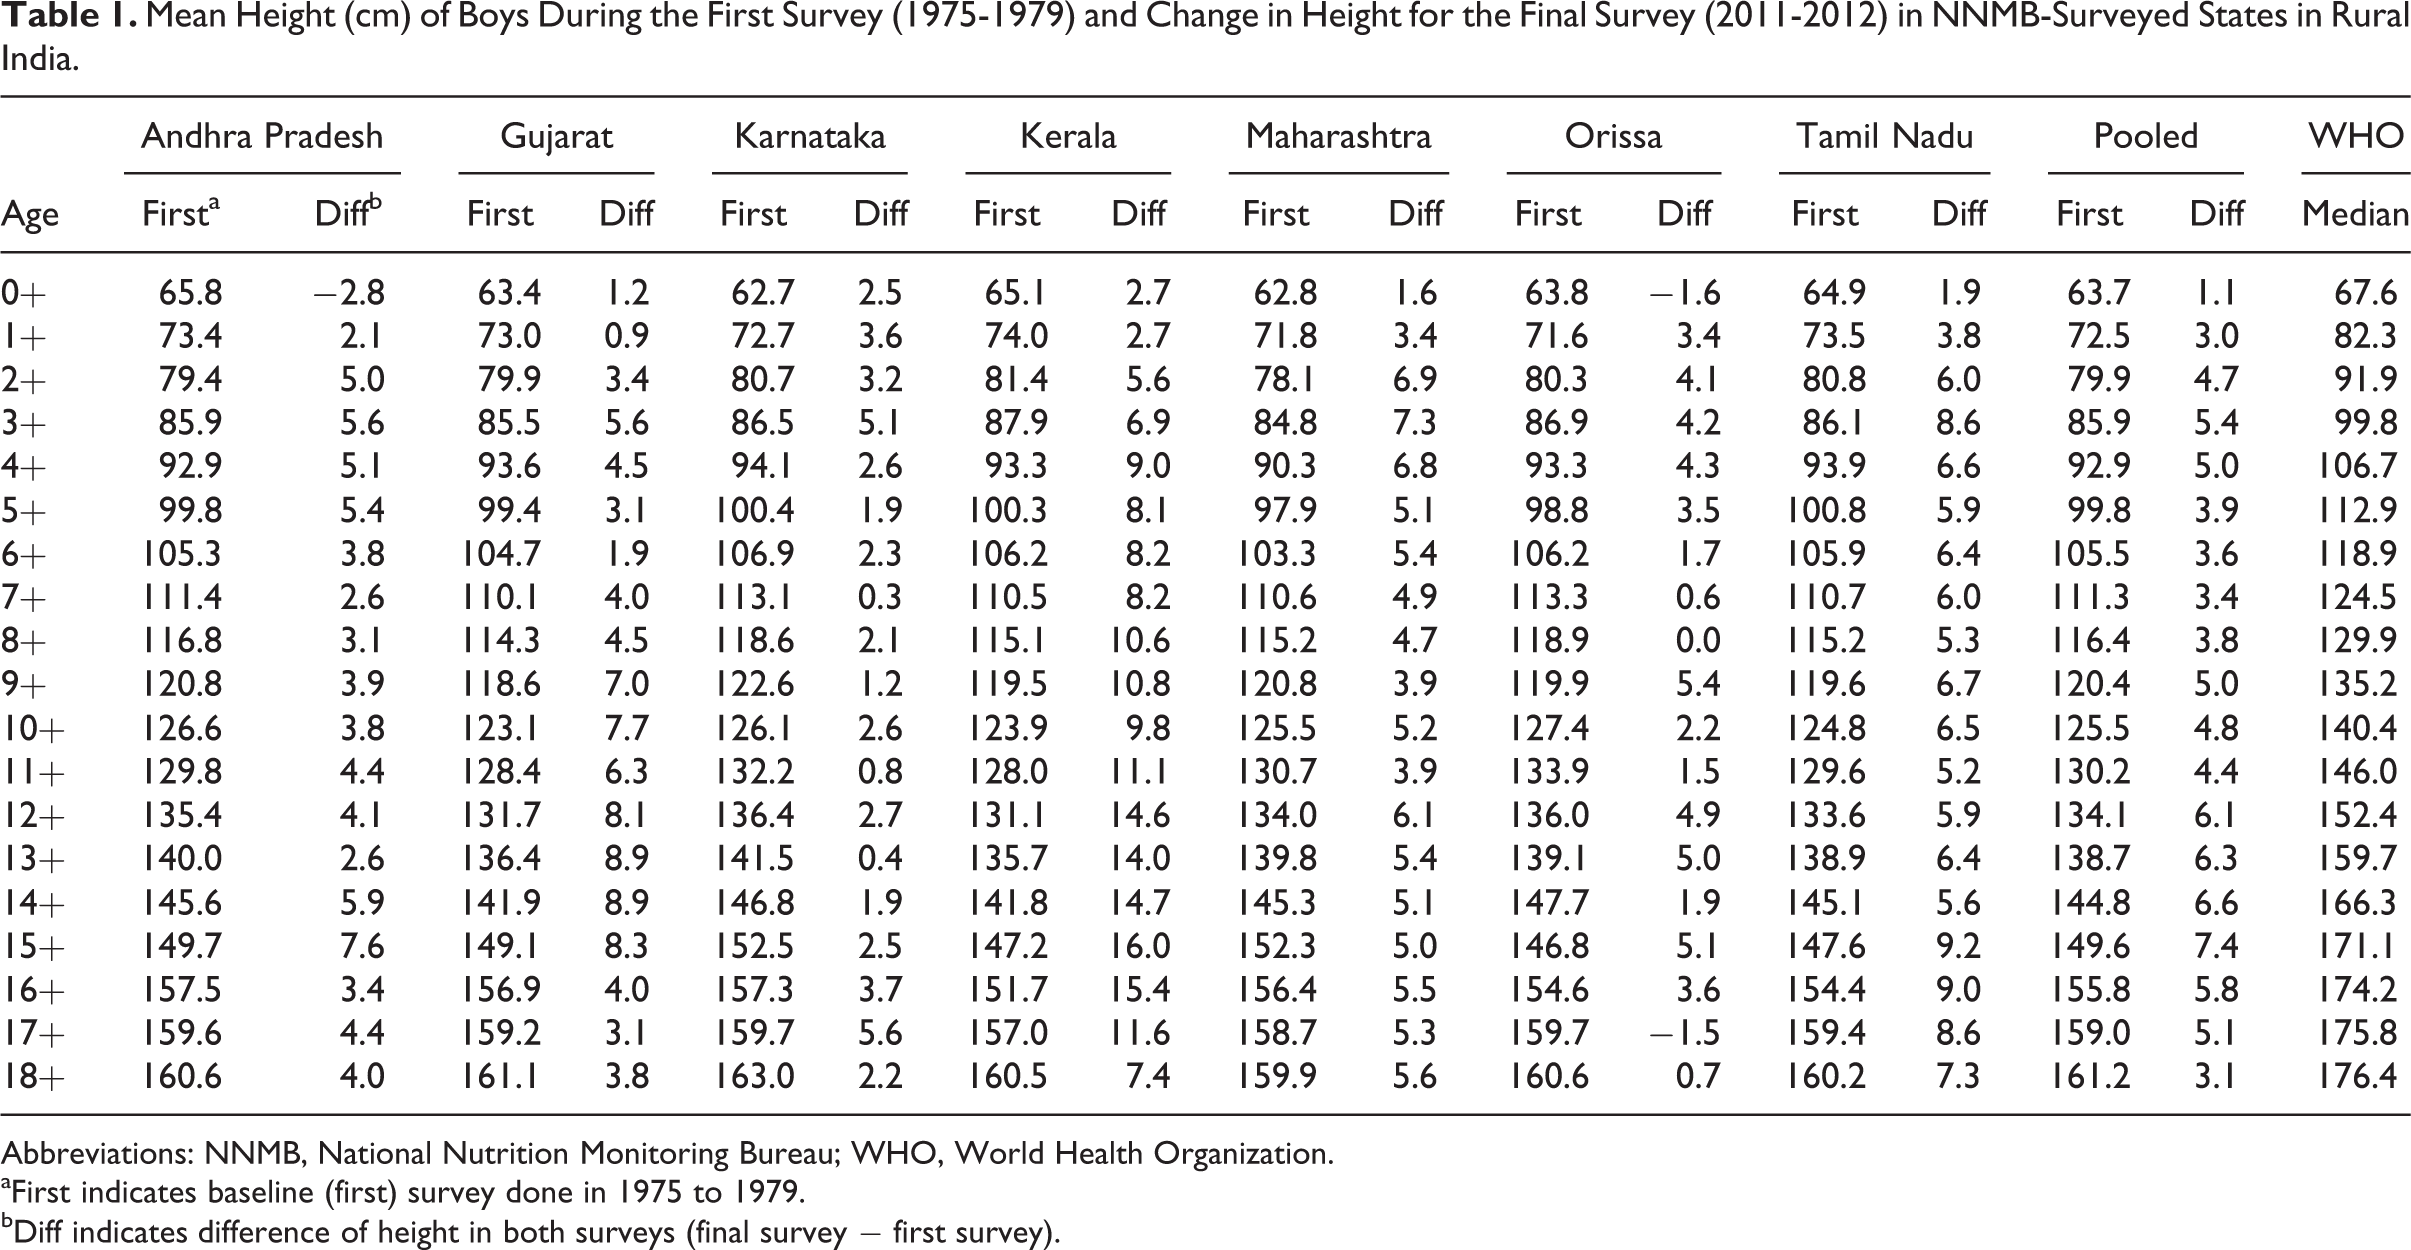
Abbreviations: NNMB, National Nutrition Monitoring Bureau; WHO, World Health Organization.
aFirst indicates baseline (first) survey done in 1975 to 1979.
bDiff indicates difference of height in both surveys (final survey − first survey).
Mean Height (cm) of Girls During the First Survey (1975-1979) and Change in Height for the Final Survey (2011-2012) in NNMB-Surveyed States in Rural India.

Abbreviations: NNMB, National Nutrition Monitoring Bureau; WHO, World Health Organization.
aFirst indicates baseline (first) survey done in 1975 to 1979.
bDiff indicates difference of height in both surveys (final survey − first survey).
Mean Weight (kg) of Boys During the First Survey (1975-1979) and Change in Weight for the Final Survey (2011-2012) in NNMB-Surveyed States in Rural India.
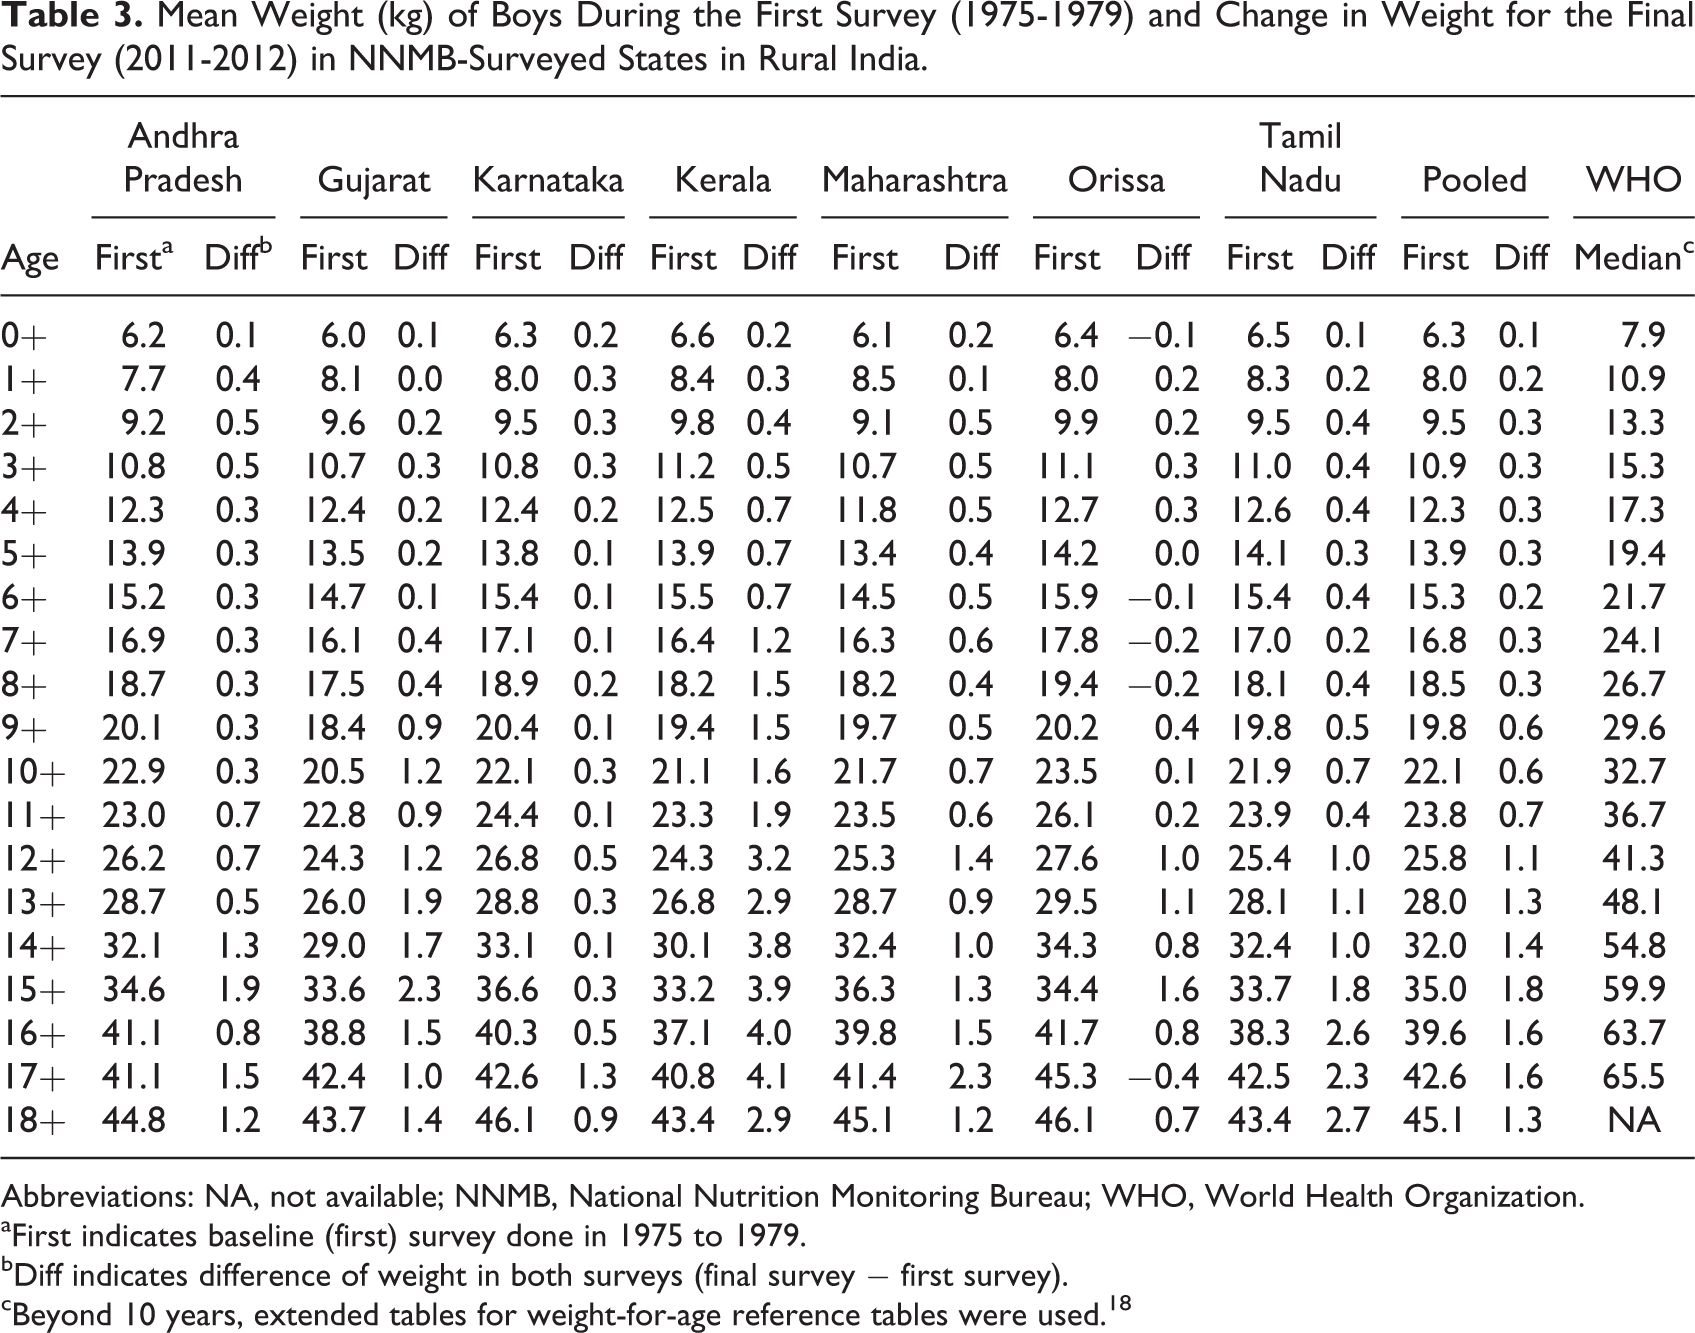
Abbreviations: NA, not available; NNMB, National Nutrition Monitoring Bureau; WHO, World Health Organization.
aFirst indicates baseline (first) survey done in 1975 to 1979.
bDiff indicates difference of weight in both surveys (final survey − first survey).
cBeyond 10 years, extended tables for weight-for-age reference tables were used. 18
Mean Weight (kg) of Girls During the First Survey (1975-1979) and Change in Weight for the Final Survey (2011-2012) in NNMB-Surveyed States in Rural India.
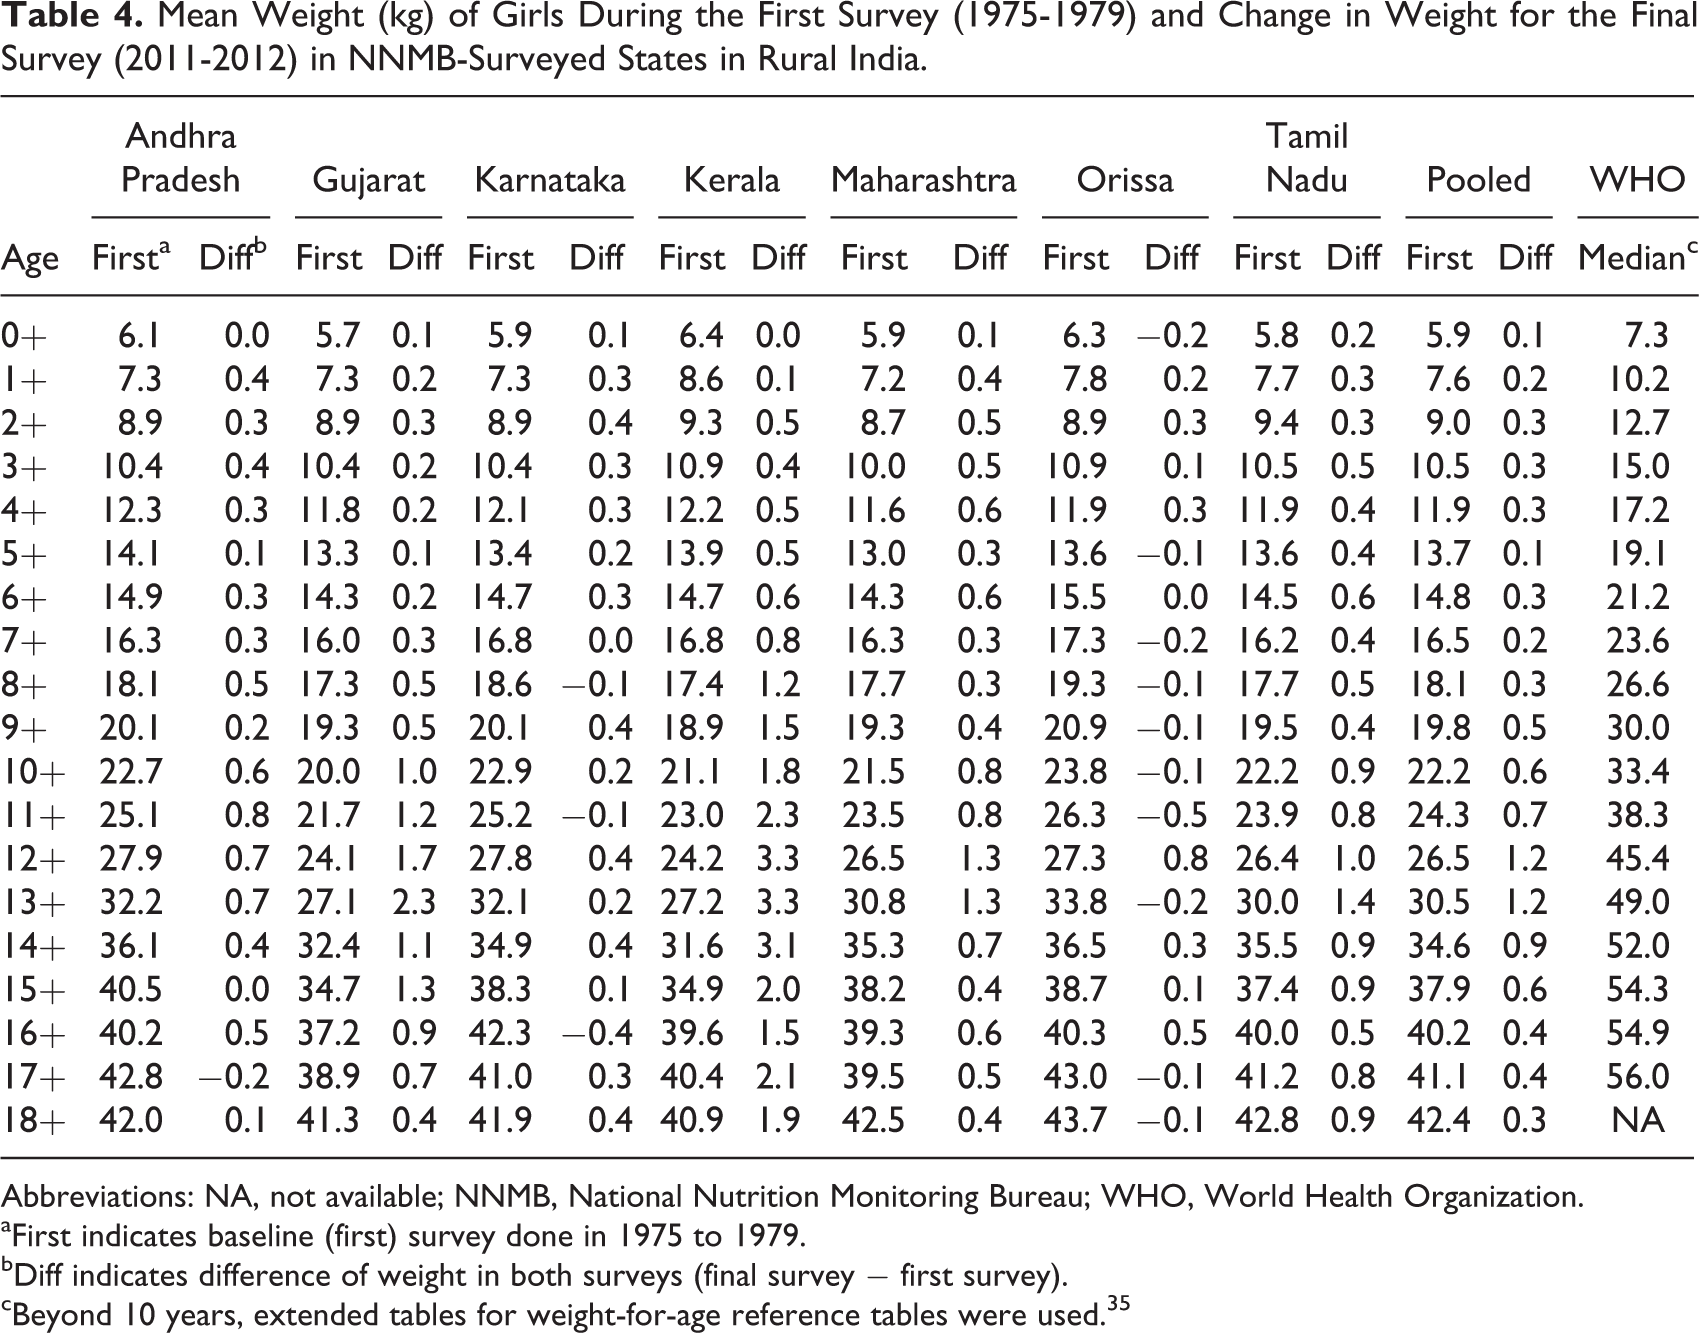
Abbreviations: NA, not available; NNMB, National Nutrition Monitoring Bureau; WHO, World Health Organization.
aFirst indicates baseline (first) survey done in 1975 to 1979.
bDiff indicates difference of weight in both surveys (final survey − first survey).
cBeyond 10 years, extended tables for weight-for-age reference tables were used. 35
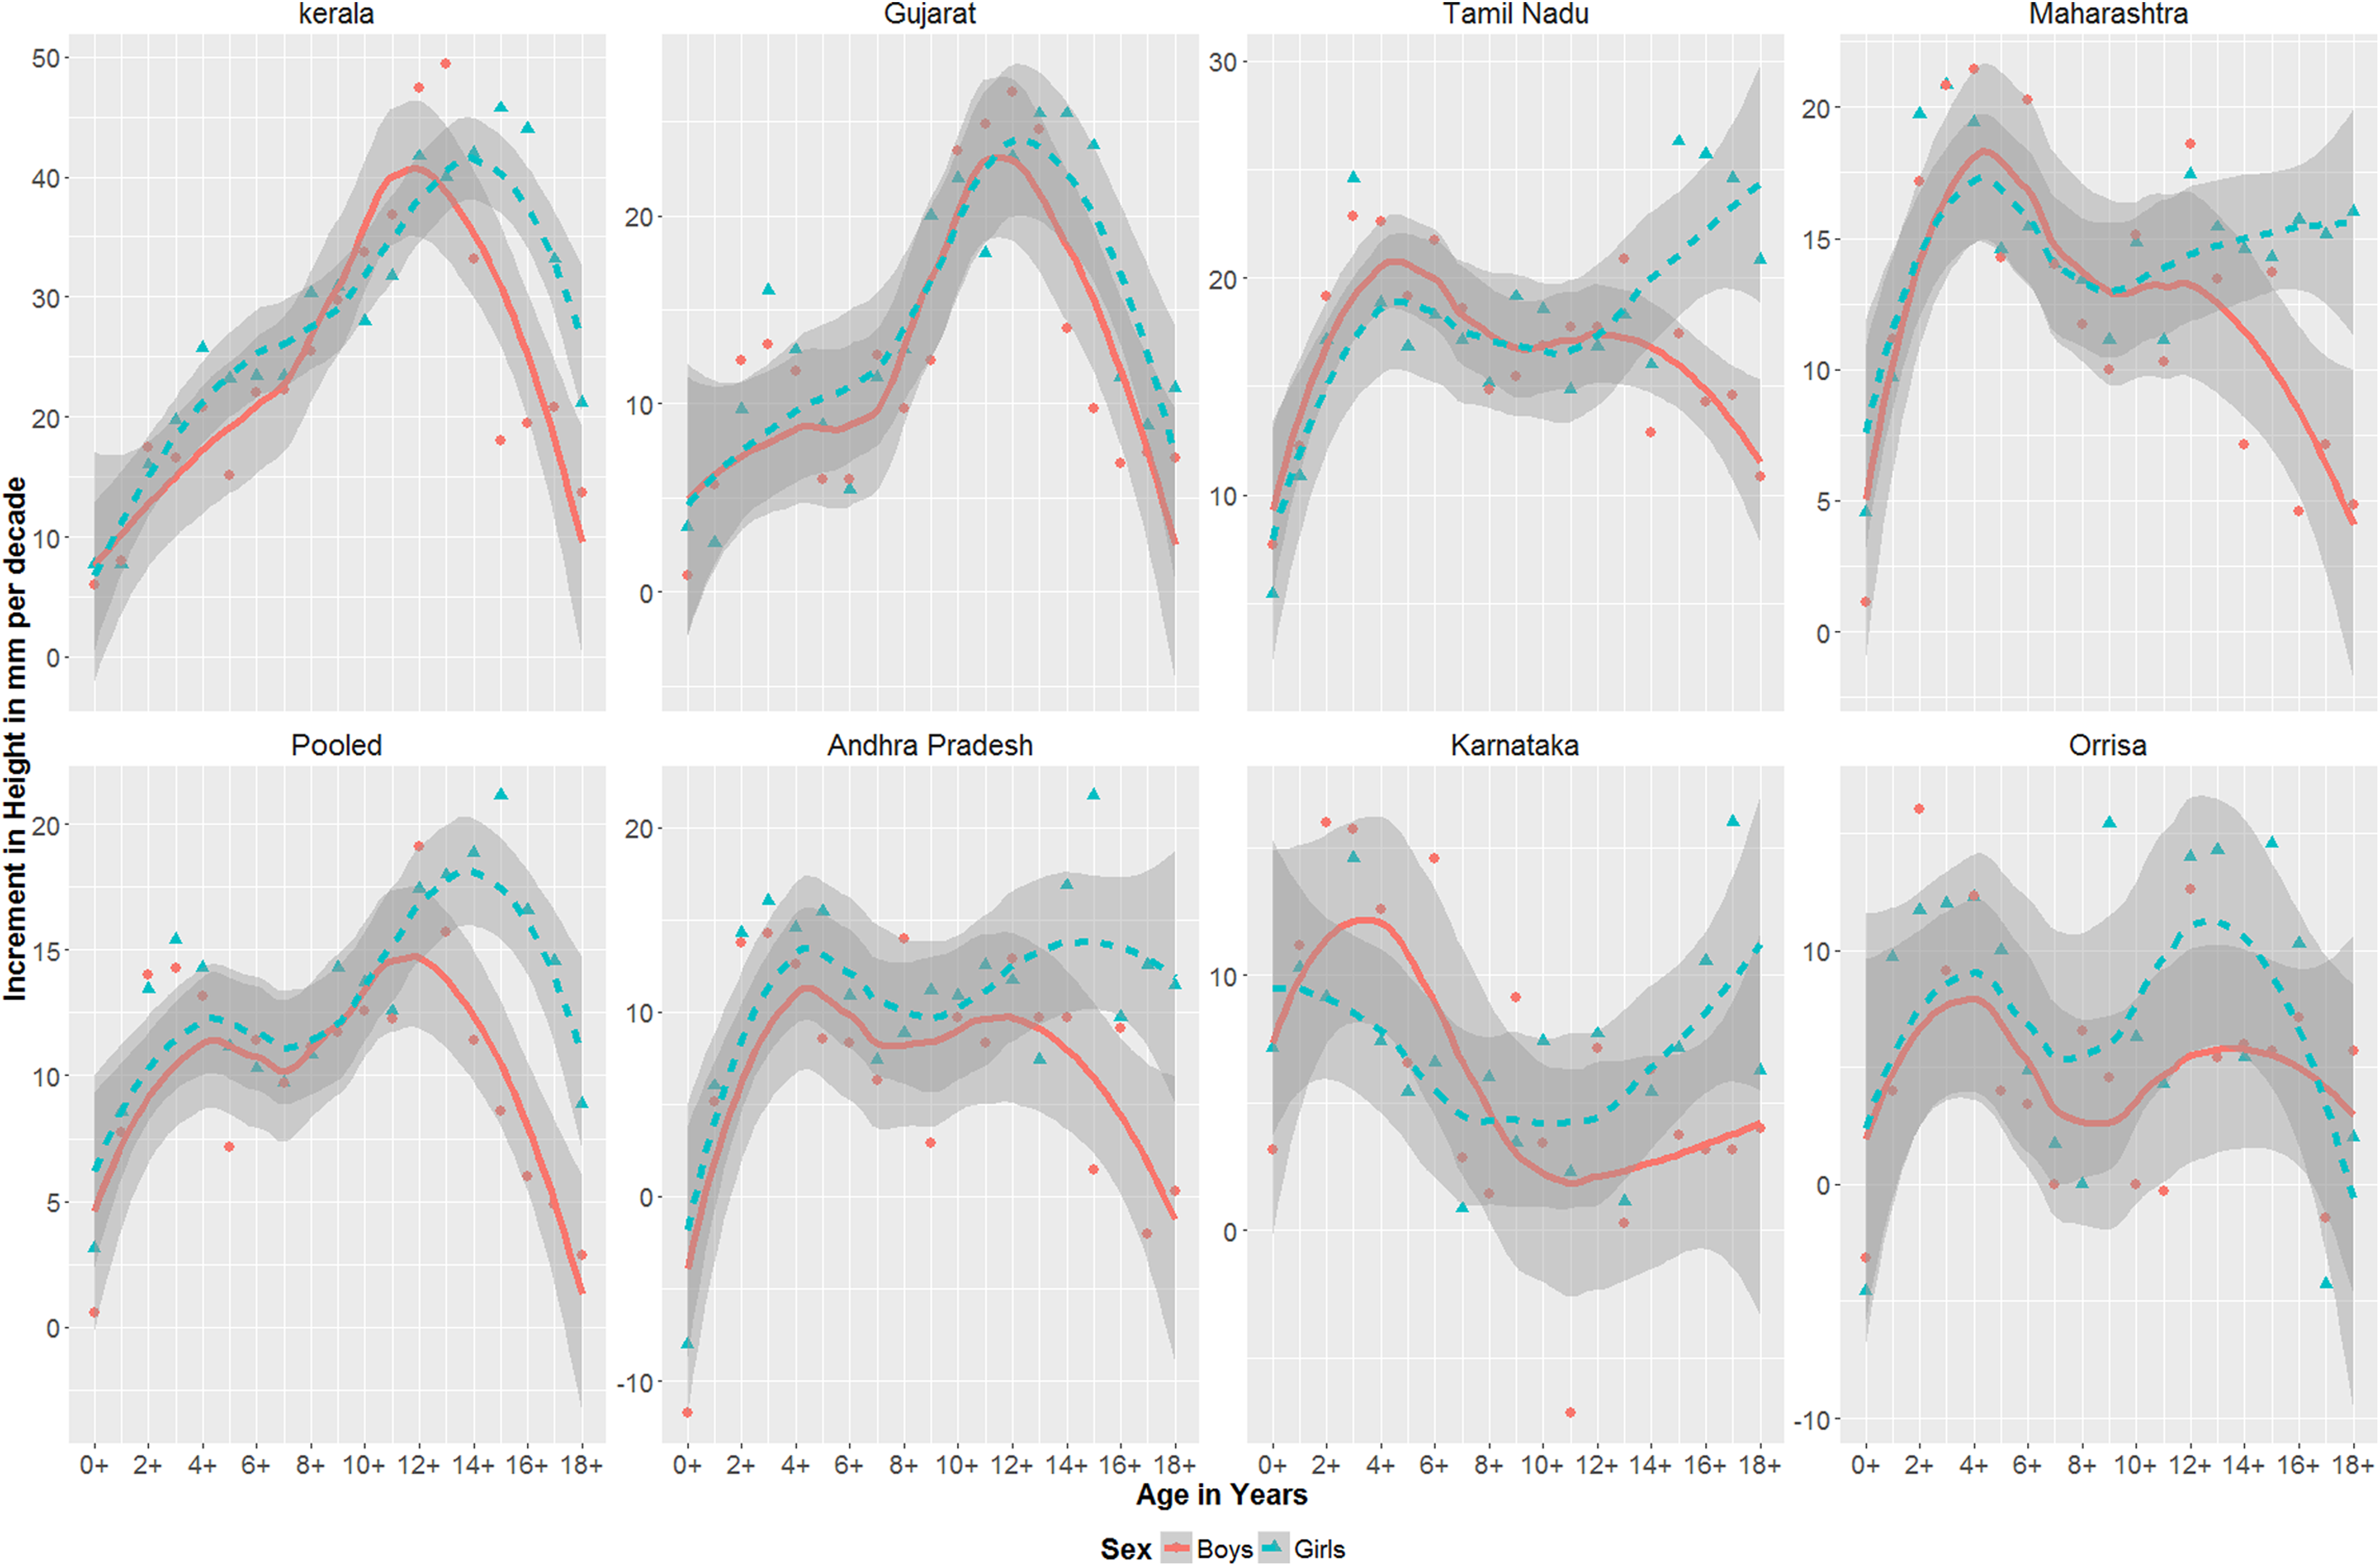
Loess curves with standard errors of increments in height (mm) in various states from birth to 18 years in rural India.
Compared to the WHO median, mean height of 18-year-old boys was 15.2 and 12.1 cm shorter in the first and last survey, respectively. For 18-year-old girls, this difference was 12.1 and 11.2 cm lesser in the first and last survey, respectively (Tables 1 and 2). Across age, the difference in height compared to the WHO median was highest in adolescent age group for both boys aged 14 and 15 years and girls aged 11 and 12 years in the pooled states. Similar to mean height, the difference in weights for both surveys compared to the WHO median was highest during adolescent age group at ∼15 years for boys and ∼12 years for girls (Tables 3 and 4).
Trends in Height and Weight From 0+ to 18+ Across States
Secular trends in increments in height are shown for each of the 7 states and the pooled states arranged in descending order (left to right) of maximum increments in height (Figure 1). On comparing data across the states in all age groups, secular trends in height were highest in the state of Kerala, with an increment of 46 mm per decade in 15-year-old boys and 49 mm per decade in 13-year-old girls from baseline to final survey. This was followed by Gujarat (25 mm in 14-year-old boys and 27 mm in 12-year-old girls per decade) and Tamil Nadu (26 mm per decade in 15-year-old boys and 23 mm per decade in 12-year-old girls). Secular trends in height were lowest in the state of Orissa (15 mm per decade in 9-year-old boys and 16 mm per decade in 2-year-old girls).
Similar to heights, increments in weight were highest in Kerala (4.1 and 3.1 kg per decade in 17-year-old boys and 12-year-old girls, respectively), followed by Tamil Nadu (2.7 and 1.4 kg per decade in 18-year-old boys and 13-year-old girls, respectively).
Trends in HAZ and BMIZ From 0+ to 18+ (States Pooled)
Growth faltering in HAZ score as expected was highest in the first 2 years (lowest HAZ scores were at 18 months) during both the surveys for boys and girls (Figure 2), followed by some degree of recovery in HAZ scores at later age (Figure 2). The overall increments in HAZ were similar in boys compared to girls across the age groups except during later age, where boys had better HAZ scores after 14 years (Figure 3, pooled states). For the pooled states, 18-month-old boys and girls improved at 0.31 and 0.26 Z score per decade, respectively.
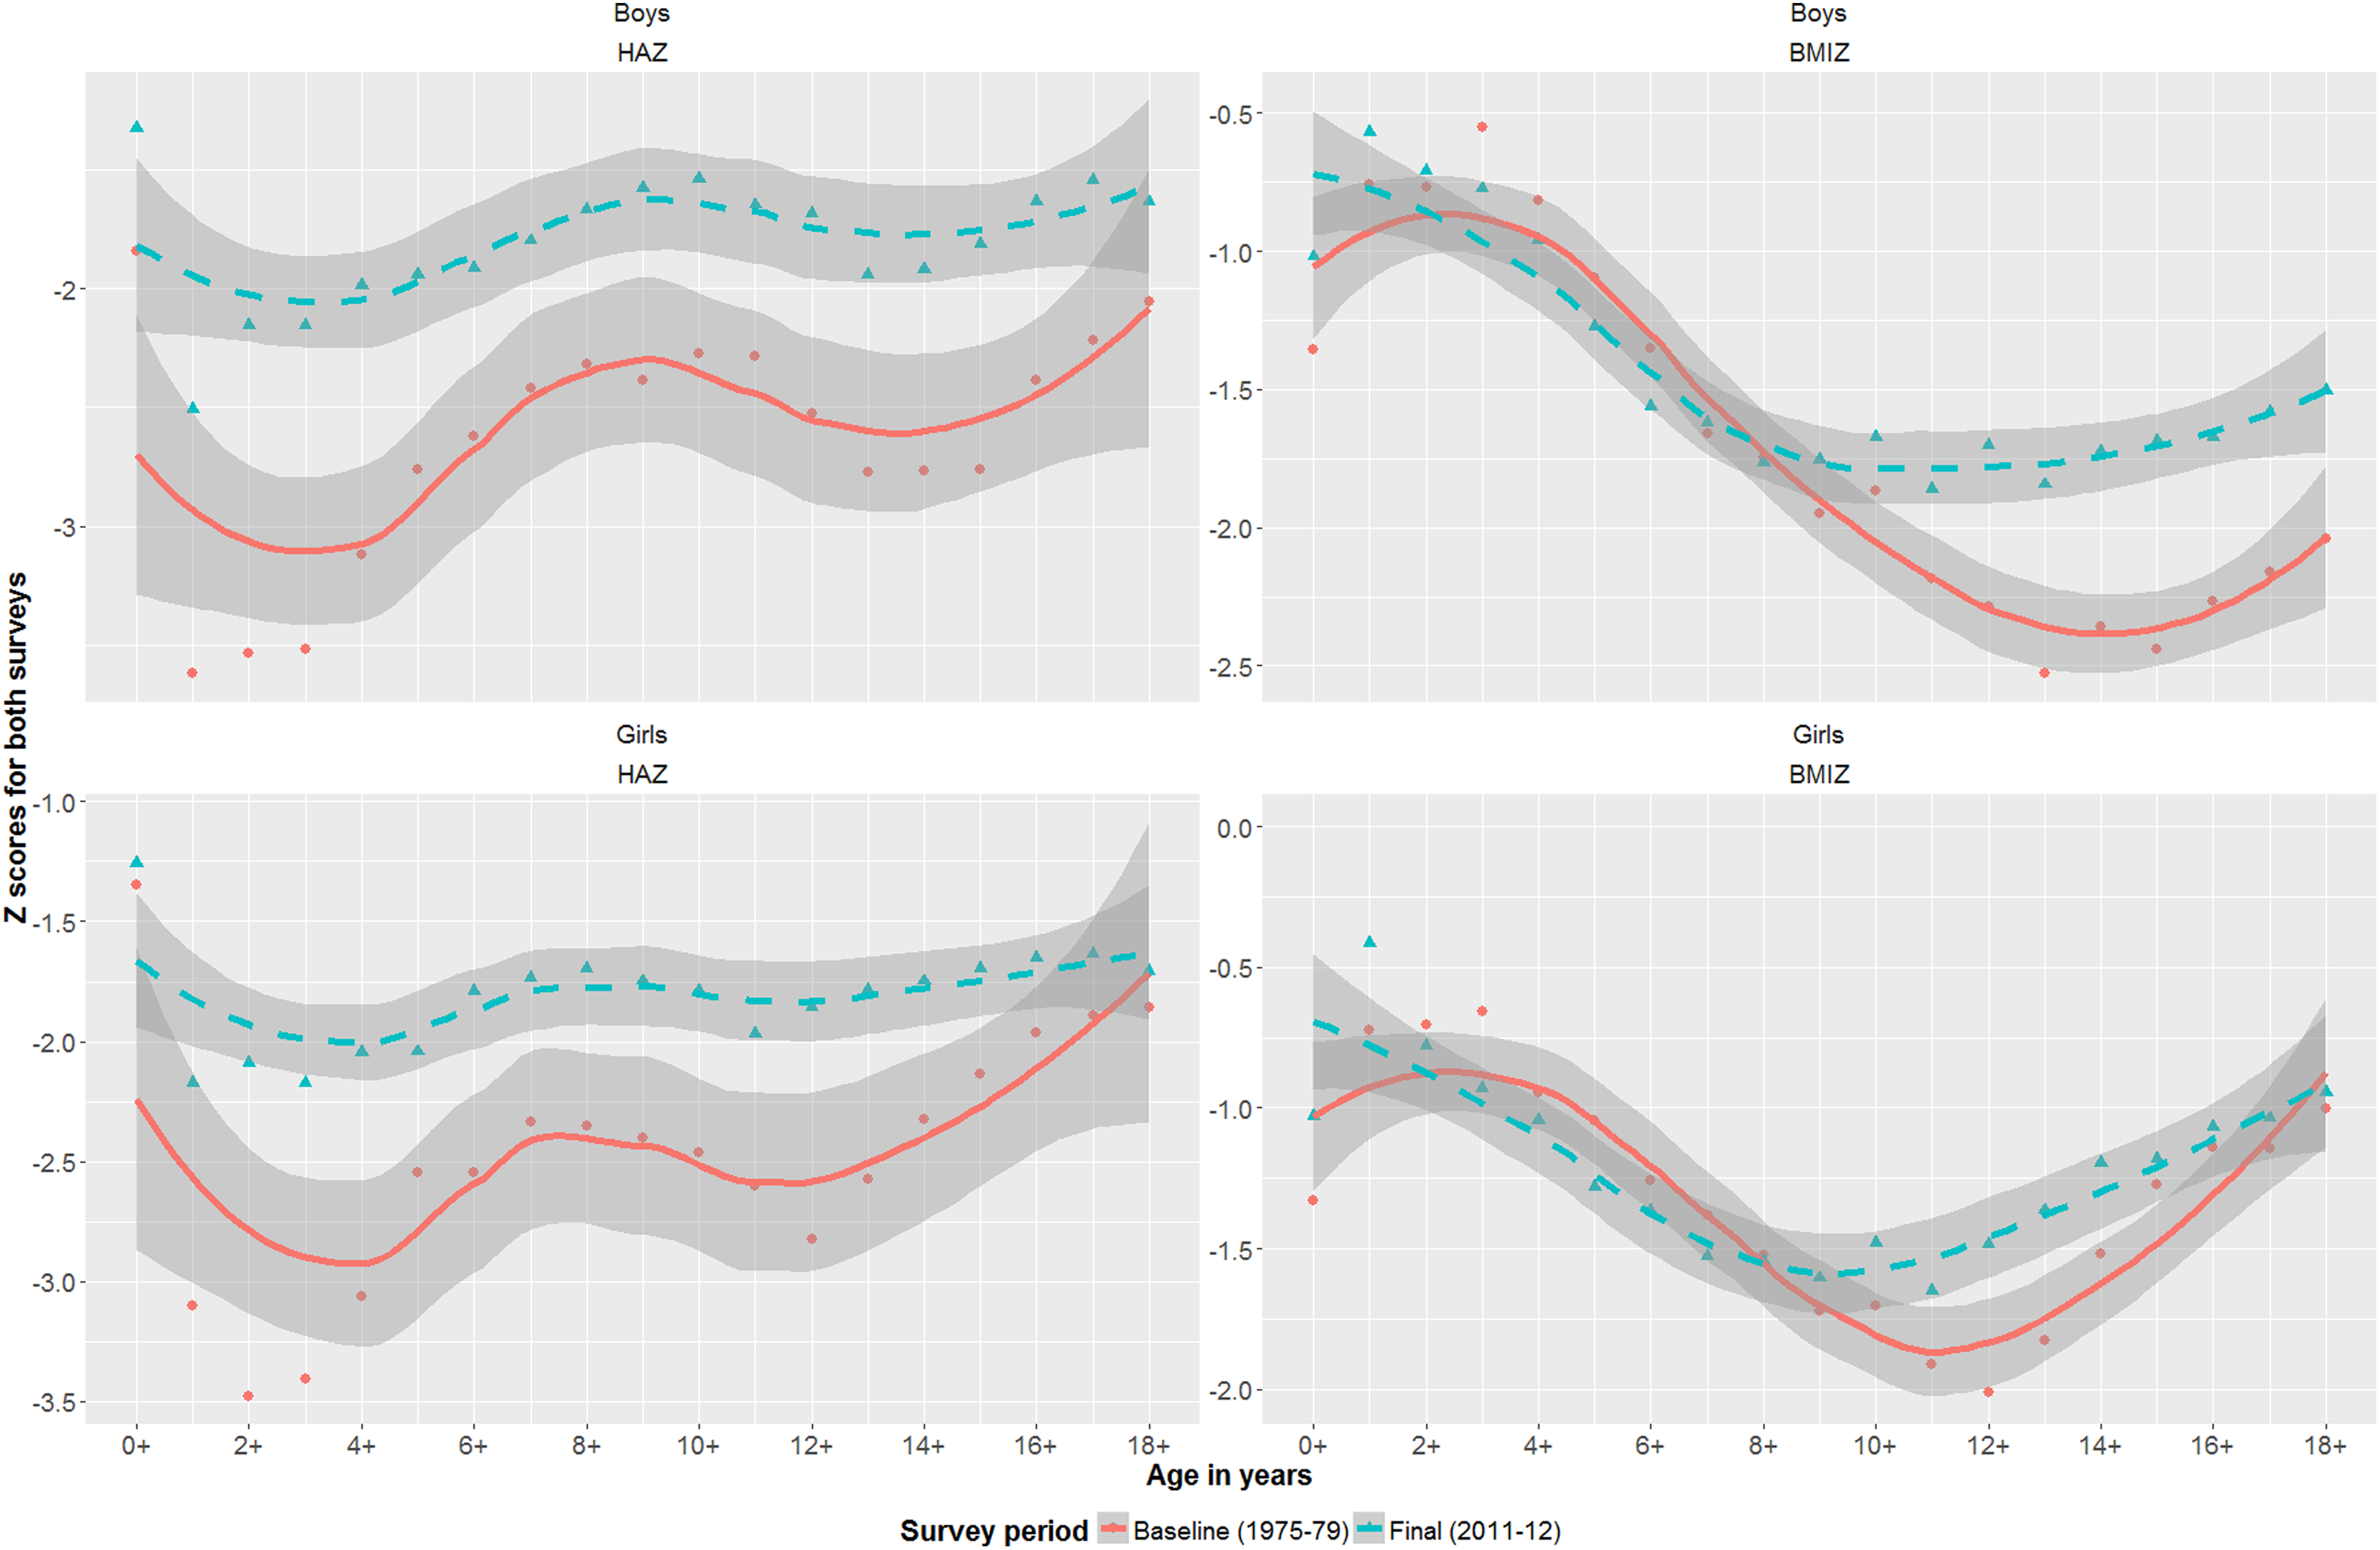
Loess curves with standard errors of height-for-age Z (HAZ) and body mass index for age Z (BMIZ) for boys and girls in pooled states from birth to 18 years.
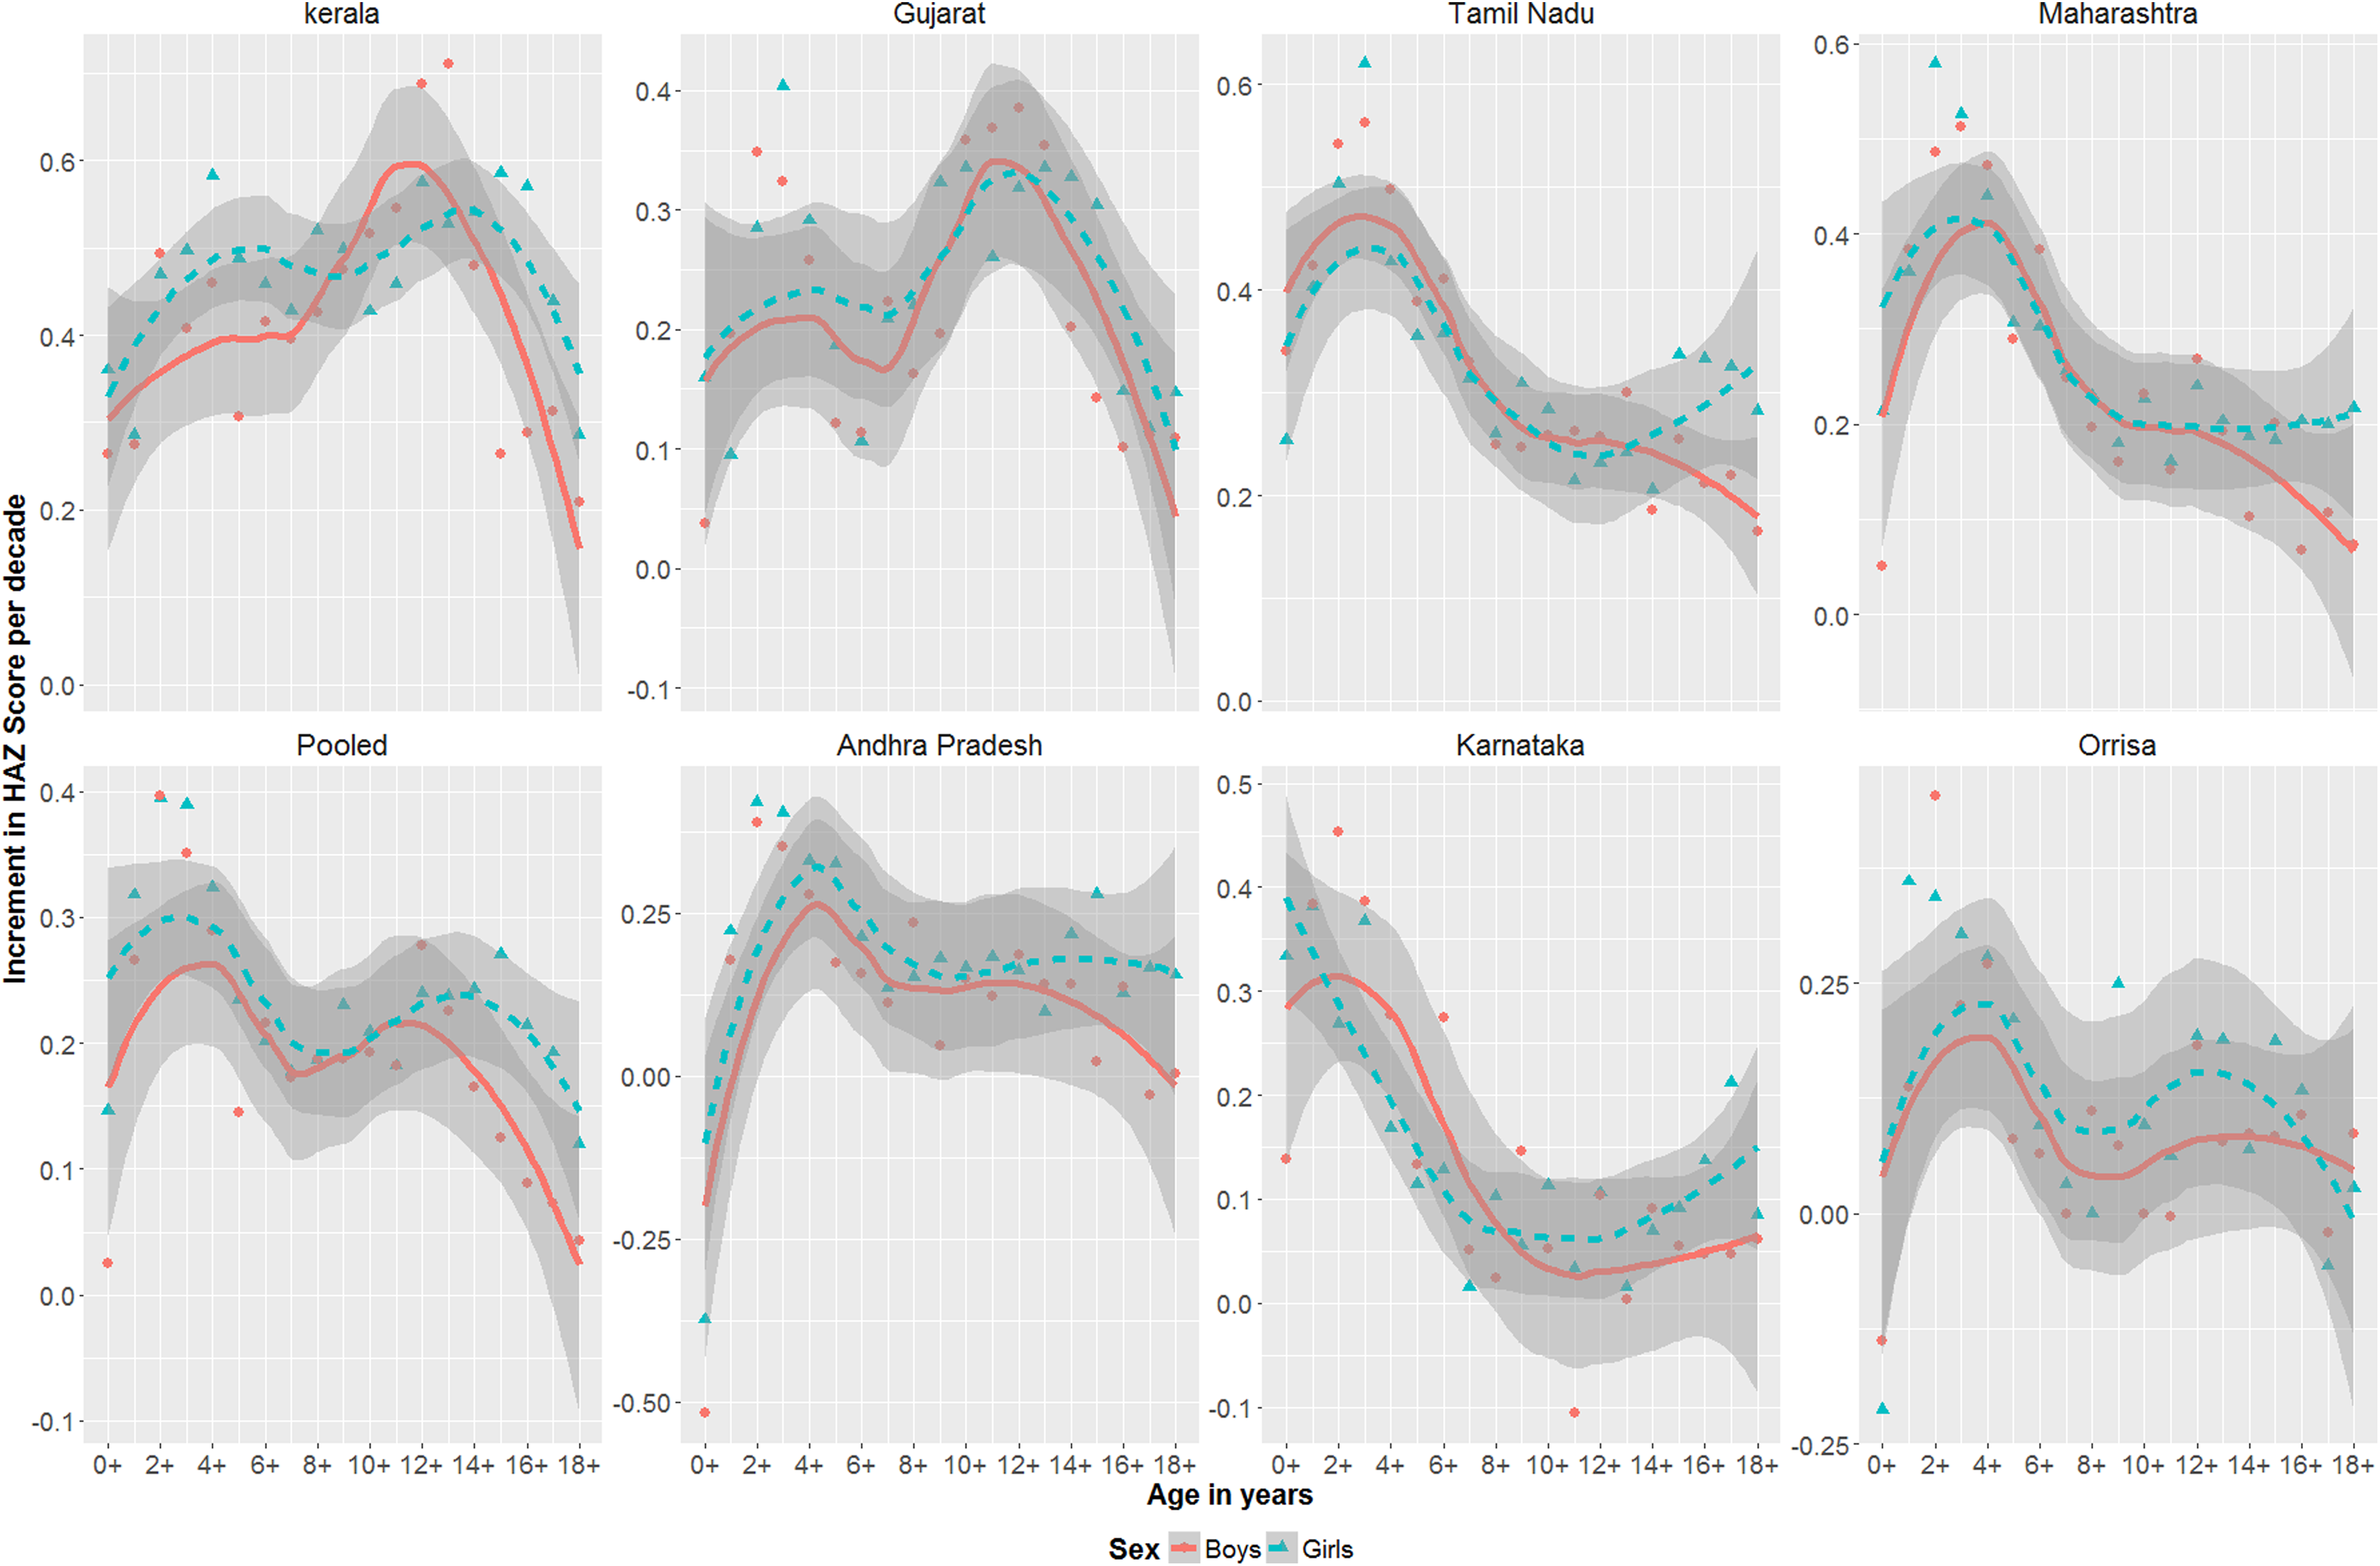
Loess curves with standard errors of increments in height-for-age Z (HAZ) scores from baseline to final survey in various states from birth to 18 years.
The overall improvement in BMIZ score for the pooled states was marginally higher for boys compared to girls, with the magnitude of difference being highest after 14 years of age (Figure 4, pooled states). Increments in BMIZ were in general highest in adolescent age group, contrary to increments in HAZ scores. Growth faltering in BMIZ score was a mirror image of faltering in HAZ score (Figure 2). Although there was an improvement in BMIZ scores in the first 2 years, there was a decrease in BMIZ score in the later age group (Figure 2).
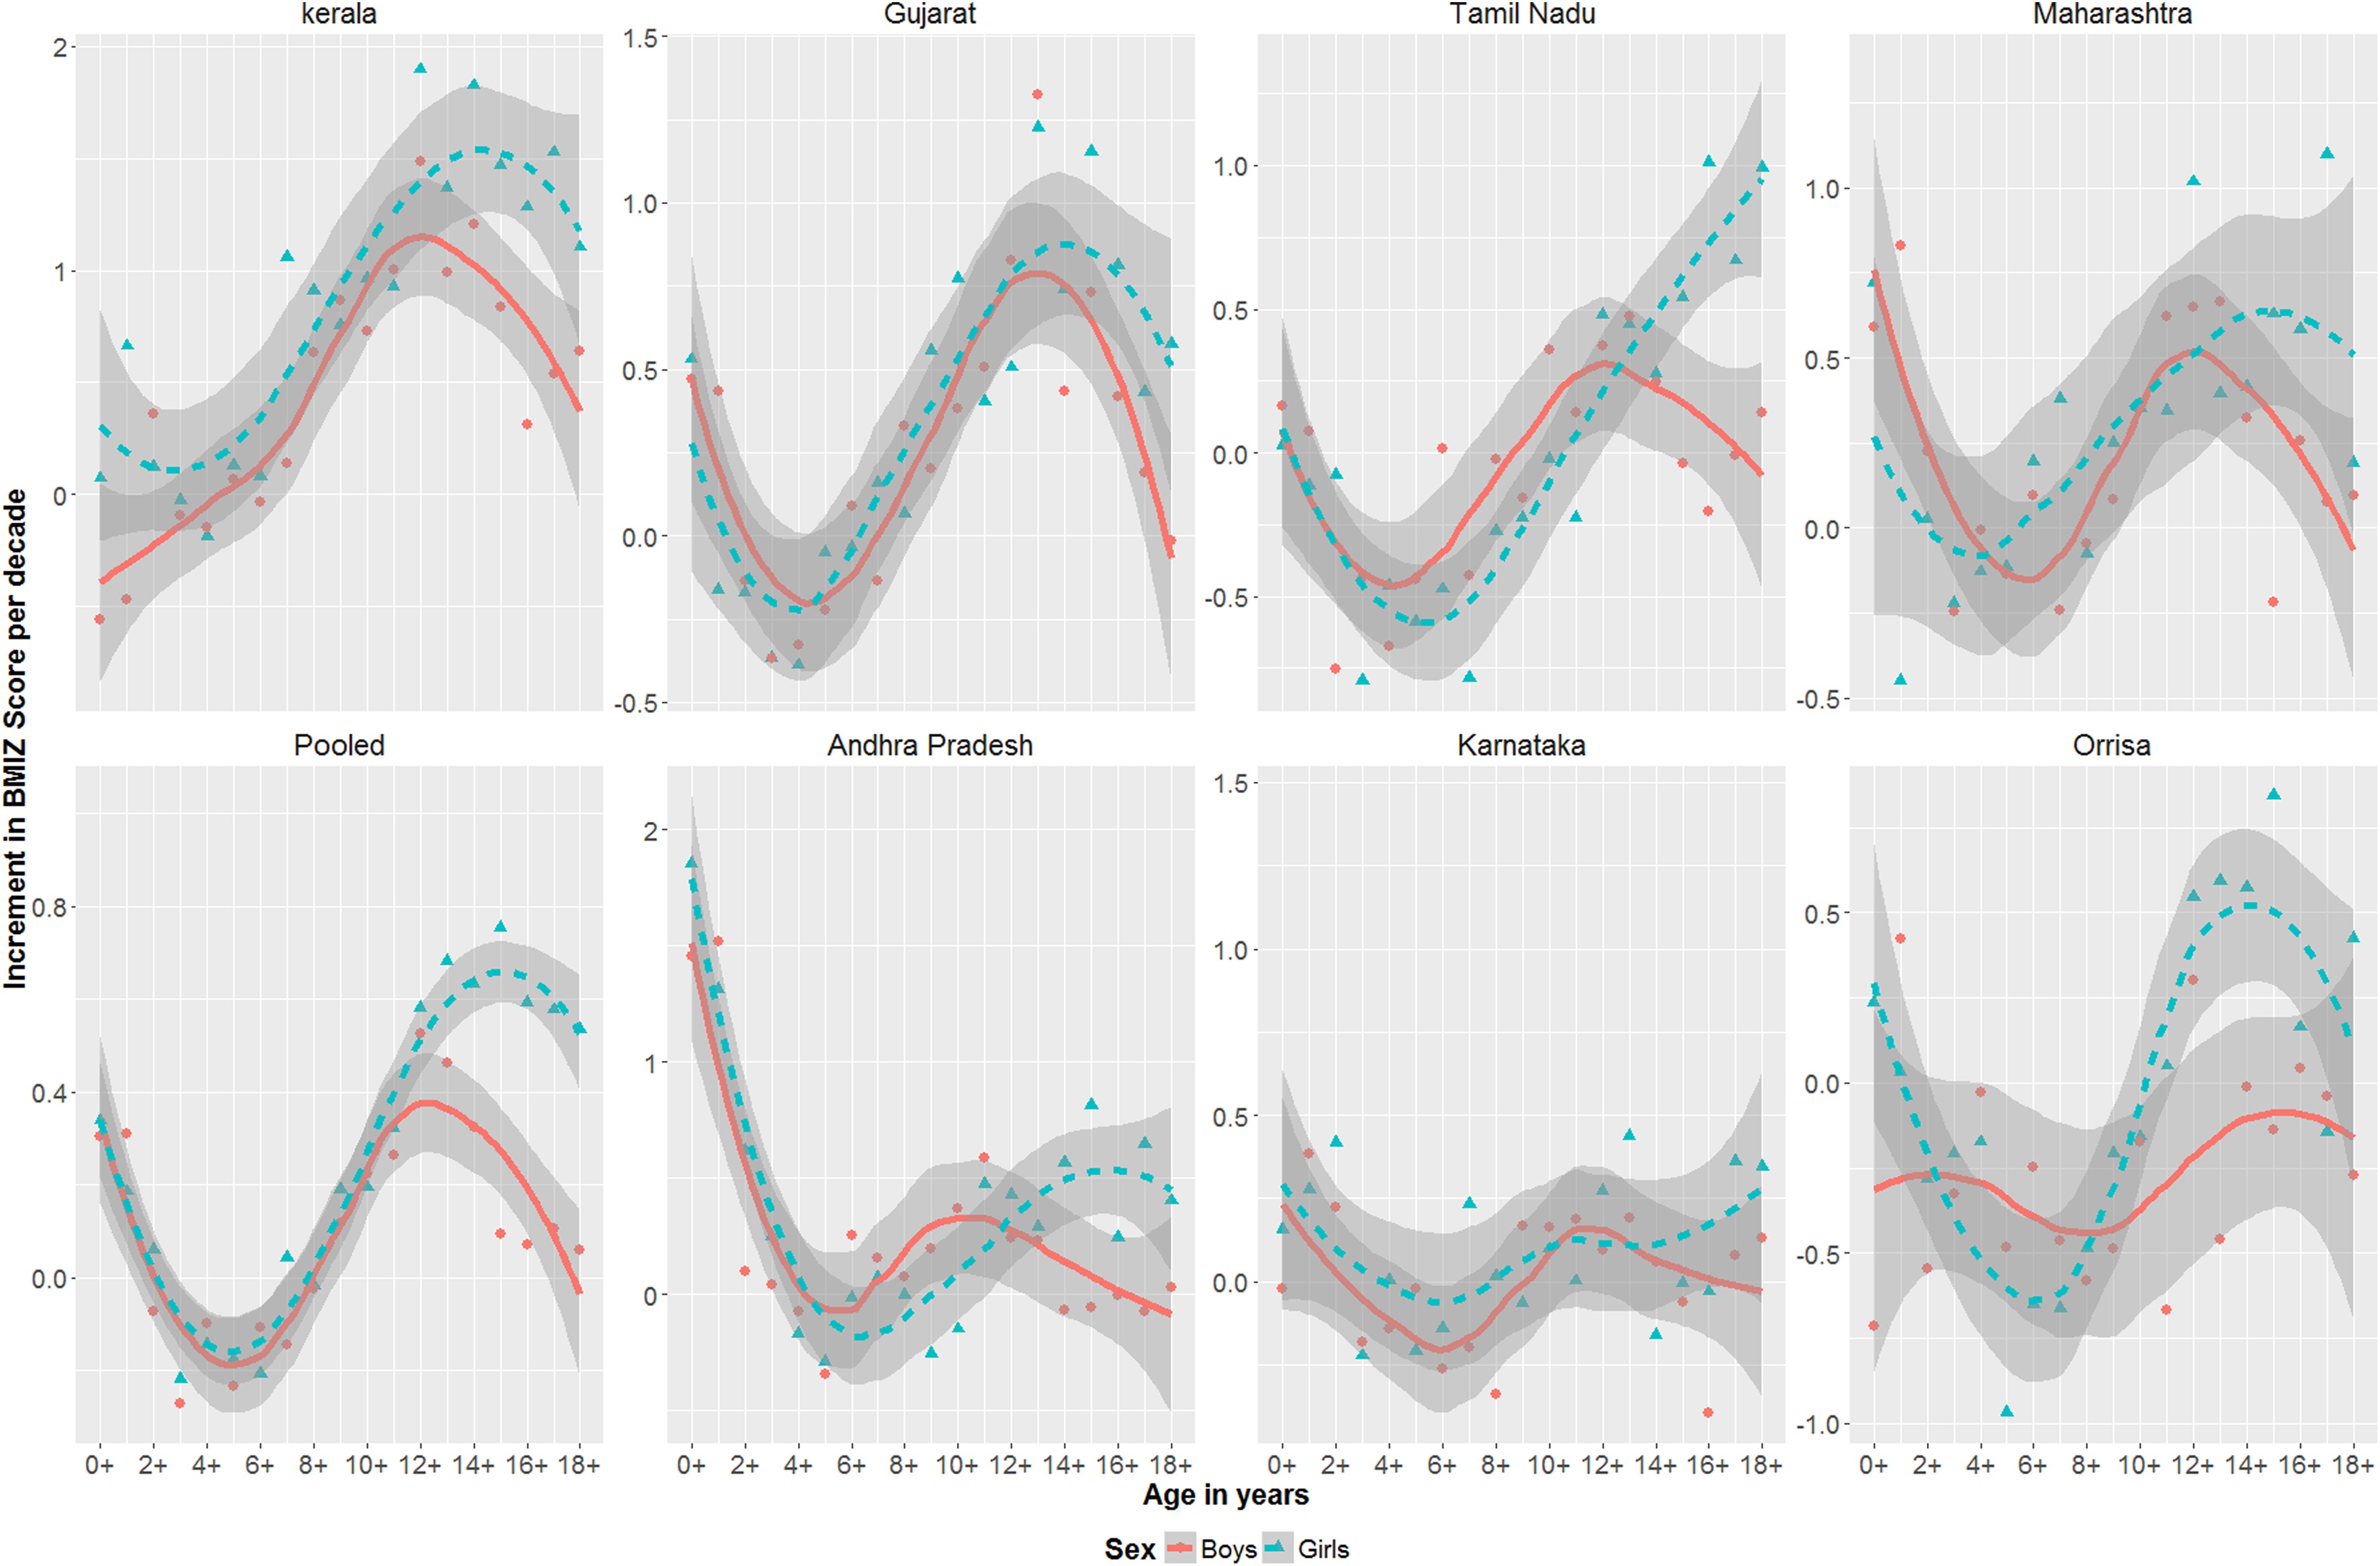
Loess curves of increments in body mass index for age Z (BMIZ) scores from baseline to final survey in various states from birth to 18 years.
Trends in HAZ and BMIZ Scores From 0+ to 18+ Across States
Increments in HAZ scores were in general highest in the first 2 to 3 years except for the states of Kerala and Gujarat, where the increments were highest in adolescent age group (Figure 3). The improvements in 18 months old were highest in Tamil Nadu (0.40 and 0.42 Z score per decade in both boys and girls) and for boys, surprisingly lowest in the state of Gujarat (0.09 Z score per decade in boys) and unsurprisingly lowest for girls in Orissa (0.13 Z score per decade). As for BMIZ scores, improvements were highest in Kerala, followed by Andhra Pradesh and Gujarat and were lowest in Orissa (Figure 4).
Improvement in Under-5 Stunting
The overall stunting in the final survey was at 45.7% in the pooled states and ranged from 24.6% (Tamil Nadu) to 60% (Gujarat). Under-5 stunting rates reduced from 82% in the baseline survey at 1.35% per year in the pooled states and was similar in both boys and girls (Table 5). The recovery in stunting was highest in Tamil Nadu (1.63% per year), followed by Kerala (1.46% per year). The recovery was lowest in the state of Gujarat (0.66% per year) and Orissa (0.70% per year).
Stunting and Rates of Reduction Per Year From First Survey (1975-1979) to Final Survey (2011-2012) in all the States in Boys and Girls.
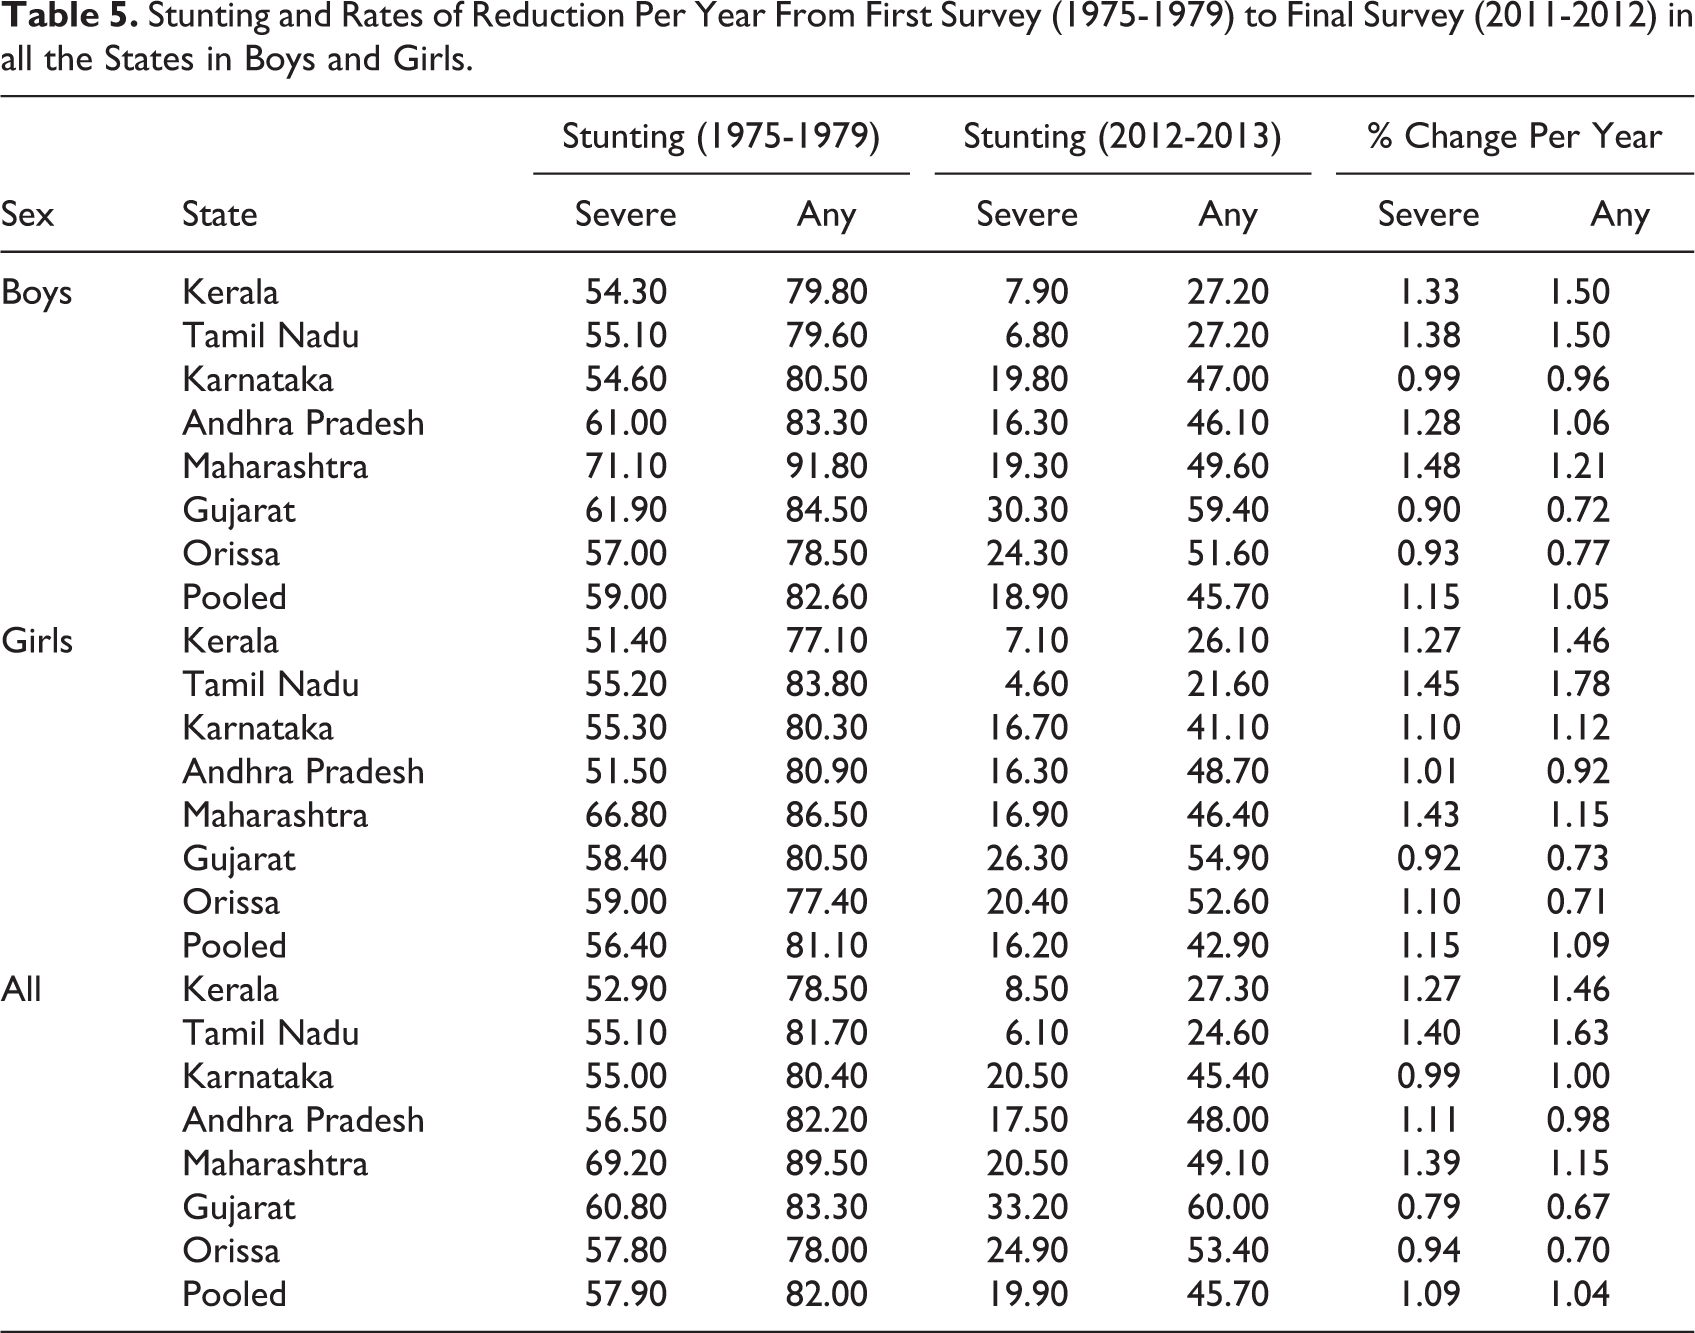
The reduction in severe stunting was much higher than reduction in moderate stunting in all the states; in fact, the prevalence of moderate stunting in pooled states increased marginally from 24.1% in the baseline survey to 25.8% in the final survey. The reduction in severe stunting was highest in Tamil Nadu (1.40% per year) followed by Maharashtra (1.39% per year) and lowest in Gujarat (0.79% per year) followed by Orissa (0.94% per year).
Discussion
Although secular trends in height reported from developed countries (except Japan) in the late and early part of 19th and 20th century were based on slave and conscript data, 11 data on developing countries are few and scarce. 19 The current large-scale study from a developing country (N = 6043 for baseline survey and N = 11910 for final survey) showed that secular trends in height in rural India are strikingly similar to that of developed countries. The findings of the study suggest that even in developing country like India with a wide diversity in height, 10 when the environment is conducive to growth, 3,20,21 the growth potential is similar to that of well-to-do populations. 22
Changes in Linear Growth
The increments in height in pooled states in rural India in 18+ years old were 9 mm per decade for boys and 3 mm per decade for girls. This is lower than the reported literature of 10 to 30 mm per decade in developed countries. 11 However, in the states of Kerala (21 and 14 mm) and Tamil Nadu (21 and 11 mm), the increments per decade were similar to that of developed countries for boys and girls, respectively. It is interesting to note that the pattern of increments in height in pooled states reported in this study is similar to the reported literature from developed countries, despite a high prevalence 23 (47%) of small for gestational age babies. This suggests that changes in linear growth may be independent of birth weight as reported by Cole. 11 There were noticeable differences in patterns of increments in linear growth in different states. There were also differences in height and HAZ increments within the states across age groups.
The increments in height in 18+ year-old boys in all states combined were same as that of 1+ month-old boys, which is similar to that reported in Japan. 24 However, this was not similar for girls, where the increments of 1+ were much higher than 18+ girls, which is in contrast to what has been reported in Japan. This is suggestive of poor nutrition in late adolescence for girls in India (NFHS-3). In our study, the maximum increment age in years for height was ∼12 for girls and ∼15 for boys, similar to previous studies, 25 and thereafter increments in height reduced by 2- to 3-fold by the age of 18 years suggesting earlier maturation in growth. Demographic health surveys (DHS) in developing countries periodically measure heights of children aged less than 5 years and heights of women aged 15 and above but do not measure heights of adolescent girls aged less than 15 years, where peak increments in height are noticed. It would be useful if DHS measures heights of all children from birth to 18 years, as it gives us a more holistic picture of secular trends in developing countries. Further, the magnitude of deficits in height of adolescent population in rural India needs further attention in this age group as the focus of interventions so far has mainly emphasized the first 1000 days of life. 26,27
Reduction in Under-5 Stunting
Globally, 28 childhood stunting decreased from 39.7% in 1990 to 26.7% in 2010 at a rate of 0.65% per year, with Asian countries showing a dramatic decrease from 49% in 1990 to 28% in 2010 at a rate of 1.05% per year. The recovery in stunting in pooled states was similar (1.04% per year) to Asian countries. A phenomenal reduction in stunting from 82% to 25% at a rate of 1.63% per year seen in Tamil Nadu and Kerala (1.46% per year) reiterates similar potential for growth to that of developed countries. 22 This is higher than the success stories in Brazil 29 where stunting reduced from 34% in 1986 to 6% in 2006 at a rate of 1.41% per year and 27% to 16% in Mexico 30 over the period 1988 to 2006 at rate of 0.61% per year. Another interesting observation made in the study was the magnitude of reduction in under-5 stunting was similar to that of reduction in stunting (HAZ) in younger than 18 years old in most of the states. However, surprisingly, recovery in stunting (HAZ) in children younger than 5 years was lowest in Gujarat despite having impressive secular trends in adolescent heights, the reason for which is unclear and needs further research.
Gender Differences
Studies have shown gender disparity as a reason for high prevalence of malnutrition in India, which is also one for the reasons for the “Asian enigma.” 31 The prevalence of under-5 stunting, as well as the rates of reduction in under-5 stunting, was similar in both boys and girls or if not marginally better in girls. The findings are similar to the last published NFHS-3 in India. 6 Although the absolute increments in height and weight were higher in boys compared to girls, increments in HAZ and BMIZ scores were similar in boys and girls except for later ages (14+ onwards), wherein the boys had better growth. The differences in HAZ and BMIZ scores in girls in later ages suggest gender disparity as adult women of south Asian countries have poorer nutritional status than men compared to other developing countries. 32
Catch-Up Growth in Height and HAZ
Studies on recovery in stunting after the first 2 years of growth (presence or absence of catch-up growth) have shown conflicting evidence. 33,34 However, a recent study using longitudinal data from 5 countries has shown that substantial height catch-up after 2 years can occur even in the absence of any interventions. 35 We believe that catch-up growth can occur after 2 years for 2 reasons. The increments in height seen in adolescent age group in most states were much higher than children below 2 years. Further, the HAZ scores of adolescents were higher than children younger than 5 years during both the surveys after early growth faltering.
Weight and BMIZ
Improvements in BMIZ were highest where the deficits were more during the baseline survey across all age groups, which was similar to improvement in HAZ scores. However, contrary to improvement in HAZ scores, improvements in BMIZ were highest during adolescent age group. Despite rapid economic development in India, there exists alarming differences in weights compared to the WHO median across all age groups and sex in rural India. Although changes in linear growth tend to happen over generations, the same cannot be said for changes in weight. A deficit in weights to the tune of 23.1 and 17.7 kg in 15+ boys and 12+ girls compared to the WHO median during the latest survey should be a serious cause of concern for health workers and policy makers.
Limitations and Strengths of the Study
The focus of the study has been restricted to changes in linear growth and their patterns in rural India, and the multiple factors that may have affected the growth were not analyzed due to inadequate data. However, this is the first large-scale study using data from a well-designed survey from a developing country to assess secular trends from 0+ to 18+ years. As the duration of the study was more than 3 decades, the magnitude of improvement was clear enough to assess patterns in increments in anthropometry, especially linear growth, which is the primary strength of the study.
Conclusion
Despite regional variations in secular trends in linear growth, the pattern of secular trends in height in rural India seen over 3 decades was strikingly similar to that of developed countries. Although overall secular trends in linear growth were modest, impressive secular trends in adolescent heights and reduction in under-5 stunting seen in Kerala and Tamil Nadu (southern states) were similar to that of developed countries and success stories of other developing countries such as Brazil and Mexico.
Footnotes
Acknowledgments
The authors thank the Director, National Institute of Nutrition, Hyderabad, India, for his constant support and encouragement.
Declaration of Conflicting Interests
The author(s) declared no potential conflicts of interest with respect to the research, authorship, and/or publication of this article.
Funding
The author(s) received no financial support for the research, authorship, and/or publication of this article.