
Abstract
Background:
There is growing awareness that the necessary solutions for improving nutrition outcomes are multisectorial. As such, investments are increasingly directed toward “nutrition-sensitive” approaches that not only address an underlying or basic determinant of nutrition but also seek to achieve an explicit nutrition goal or outcome. Understanding how and where official development assistance (ODA) for nutrition is invested remains an important but complex challenge, as development projects components vary in their application to nutrition outcomes. Currently, no systematic method exists for tracking nutrition-sensitive ODA.
Objective:
To develop a methodology for classifying and tracking nutrition-sensitive ODA and to produce estimates of the amount of nutrition-sensitive aid received by countries with a high burden of undernutrition.
Methods:
We analyzed all financial flows reported to the Organization for Economic Co-Operation and Development’s Development Assistance Committee Creditor Reporting Service in 2010 to estimate these investments. We assessed the relationships between national stunting prevalence, stunting burden, under-5 mortality, and the amount of nutrition-specific and nutrition-sensitive ODA.
Results:
We estimate that, in 2010, a total of $379·4 million (M) US dollars (USD) was committed to nutrition-specific projects and programs of which 25 designated beneficiaries (countries and regions) accounted for nearly 85% ($320 M). A total of $1.79 billion (B) was committed to nutrition-sensitive spending, of which the top 25 countries/regions accounted for $1.4 B (82%). Nine categories of development activities accounted for 75% of nutrition-sensitive spending, led by Reproductive Health Care (30·4%), Food Aid/Food Security Programs (14·1%), Emergency Food Aid (13·2%), and Basic Health Care (5·0%). Multivariate linear regression models indicate that the amount of nutrition-sensitive (P = .001) and total nutrition ODA was significantly predicted by stunting prevalence (P = .001). The size of the total population of stunted children significantly predicted the amount of nutrition-specific ODA (P < .001).
Conclusion:
The recipient profile of nutrition-specific and nutrition-sensitive ODA is related but distinct. Nutrition indicators are associated with the level of nutrition-related ODA commitments to recipient countries. A reliable estimate of nutrition spending is critical for effective planning by both donors and recipients and key for success, as the global development community recommits to a new round of goals to address the interrelated causes of undernutrition in low-income countries.
Introduction
Improving nutrition may be the single most effective investment for saving child lives, with strong benefits to cost ratios that compete well with other investments in the global development agenda. 1 Effective interventions to reduce stunting and to promote healthy nutrition are well documented, and considerable progress has been made to improve the coordination of multisectorial efforts throughout the world, due to a series of technical conventions and the unprecedented Scaling Up Nutrition (SUN) movement. 2 Considerable progress toward achieving nutrition-related millennium development goals (MDGs) has been made, with noteworthy advances in key focal countries. Chief among these achievements is a decline in the number of under-5 deaths from 12 million in 1990 to 7.6 million in 2010. 3 Over 95% of child deaths occur in 75 countries and are almost all due to preventable causes for which effective interventions are available (WHO, 2015). As the deadline for the 2015 MDGs draws to a close, new global challenges have been set to achieve ambitious outcomes to improve nutrition and reduce mortality in poor countries. For example, the World Health Organization now aims to reduce by 40% the world’s 171 million stunted children by 2025. 4
With these nutrition-specific goals and outcomes in view, direct nutrition interventions need to be liaised with nutrition-sensitive development actions to leverage new approaches that can address these more distal nutrition risk factors: health, family planning, water and sanitation, agriculture, and social safety nets. 5-6
The development community has recently applied a categorical approach to nutrition spending, which broadly characterizes the level of nutrition determinants at which foreign aid is directed. “category one” aid refers to investments or support to countries for programs or projects that deliver a “proven set” of effective interventions that are directly aimed at reducing undernutrition. Nutrition-sensitive aid (“category two”) is that which is directed toward “interventions or programs that address the underlying determinants of fetal and child nutrition and development—food security, adequate caregiving resources at the maternal, household and community levels; and access to health services and a safe and hygienic environment—and that incorporates specific nutrition goals and actions.” 5(p537) Finally, “category three” spending addresses the remaining investments that contribute to nutrition outcomes with a wide range of activities with varying degrees of focus on nutrition outcomes. 6 Currently, only direct nutrition (“category one”) projects can be systematically tracked using the existing platform made possible by the Organization for Economic Co-Operation and Development’s Development Assistance Committee (OECD-DAC) reporting system for tracking official development assistance (ODA). These projects are coded with the primary purpose code of “12240” to designate their action as “Basic Nutrition.” Given the relatively recent definition and concept of “nutrition sensitive,” there is no currently agreed upon methodology for systematically classifying and thereby tracking nutrition-sensitive investments.
Thus, while substantial progress is needed to scale-up and successfully implement novel approaches to improving nutrition, it is critical to understand how and where resources to develop and sustain these interventions are being spent, including at the level of the underlying and basic platforms that support nutrition actions.
This study builds on the definition of nutrition-sensitive investments, programs, and interventions to produce a global estimate of resources that have been committed to improving nutrition through multisectorial approaches that address underlying and basic determinants of nutrition. We developed and applied a novel methodology that tracks donor commitments for nutrition-sensitive activity, globally and across development sectors, to understand the amount, location, and goals of nutrition-sensitive development. We also examine how national and regional indicators of undernutrition influence nutrition investments.
Methods
This method for classifying and tracking aid flows for global nutrition was developed by AidData, in collaboration with nutrition advisors at the Government of Canada Department of Foreign Affairs and Development (DFATD) and colleagues within the SUN donor network. We estimated 2 categories of global nutrition investments: nutrition specific and nutrition sensitive. Nutrition-specific funding includes projects with nutrition outcomes as a primary goal, while nutrition-sensitive funding includes projects with nonnutrition primary goals but that include nutrition activities in one or more components. Nutrition-sensitive funding is significantly more difficult to estimate through current global reporting mechanisms and as such is the focus of this methods section.
Data Source
We used the ODA flows that donors report to the Creditor Reporting System (CRS) of the OECD-DAC as our foundation. 7 The CRS is a financial transaction-level database with information on both commitment transactions (total resources intended over the life of a project) and disbursement transactions (actual transfer of resources). We opted to use commitment data, as it is more systematically reported. Donors may report 1 aid project as 1 or multiple commitment transactions, so 1 project may have multiple records. In addition to financial transaction amounts, records include descriptions and 1 sector code and purpose code to reflect the overarching goal of the project.
Classification of 2010 CRS Records for Nutrition Impact
We estimated 2 categories of spending, nutrition specific and nutrition sensitive, using commitment transactions reported to the CRS in 2010 (the most current year available at the time of analysis).
Category 1 Nutrition Specific
Category 1 nutrition-specific estimate: All financial commitments reported to the CRS in 2010 with purpose code “12240: Basic Nutrition” qualified as nutrition-specific funding.
Category 2 Nutrition Sensitive
Prior to the present analysis, all other systematic efforts to track nutrition aid relied solely on the purpose codes donors reported to the CRS database. 8 -10 Beyond the basic nutrition code, purpose codes cannot capture the nuance of complex development projects that span multiple sectors and include nutrition as only one of several components. Thus, such nutrition-sensitive spending estimates are simultaneously too inclusive, by assuming all components of every food security or emergency food aid project are nutrition sensitive, and too exclusive, by ignoring the handful of agriculture extension or social welfare projects with nutrition components.
Our method aims to capture these nuances by drawing on a purpose plus activity-coding scheme developed by AidData to add granularity to CRS data. 11 Trained analysts assign 1 overall purpose code and as many of AidData’s 544 activity codes as necessary to represent individual activities for every record. 12 The 544 activity codes cover all sectors and can be applied to project descriptions from sources other than the CRS, including lengthy project documents. We identified a subset of 92 activity codes to isolate nutrition-sensitive components of projects across all sectors and from these estimate nutrition-sensitive spending in 2010. (note 1)
Category 2 nutrition-sensitive estimate: We developed a novel approach that applies a 5-step process described in Figure 1 and in greater detail subsequently. First, we gathered a pool of potentially nutrition-sensitive project records using CRS purpose codes and a key word search. We applied AidData’s activity-coding scheme and used key words and a subset of 92 codes to determine the project’s level of nutrition sensitivity. Finally, we weighted commitment amounts to determine nutrition-sensitive spending by donor and recipient country or region.
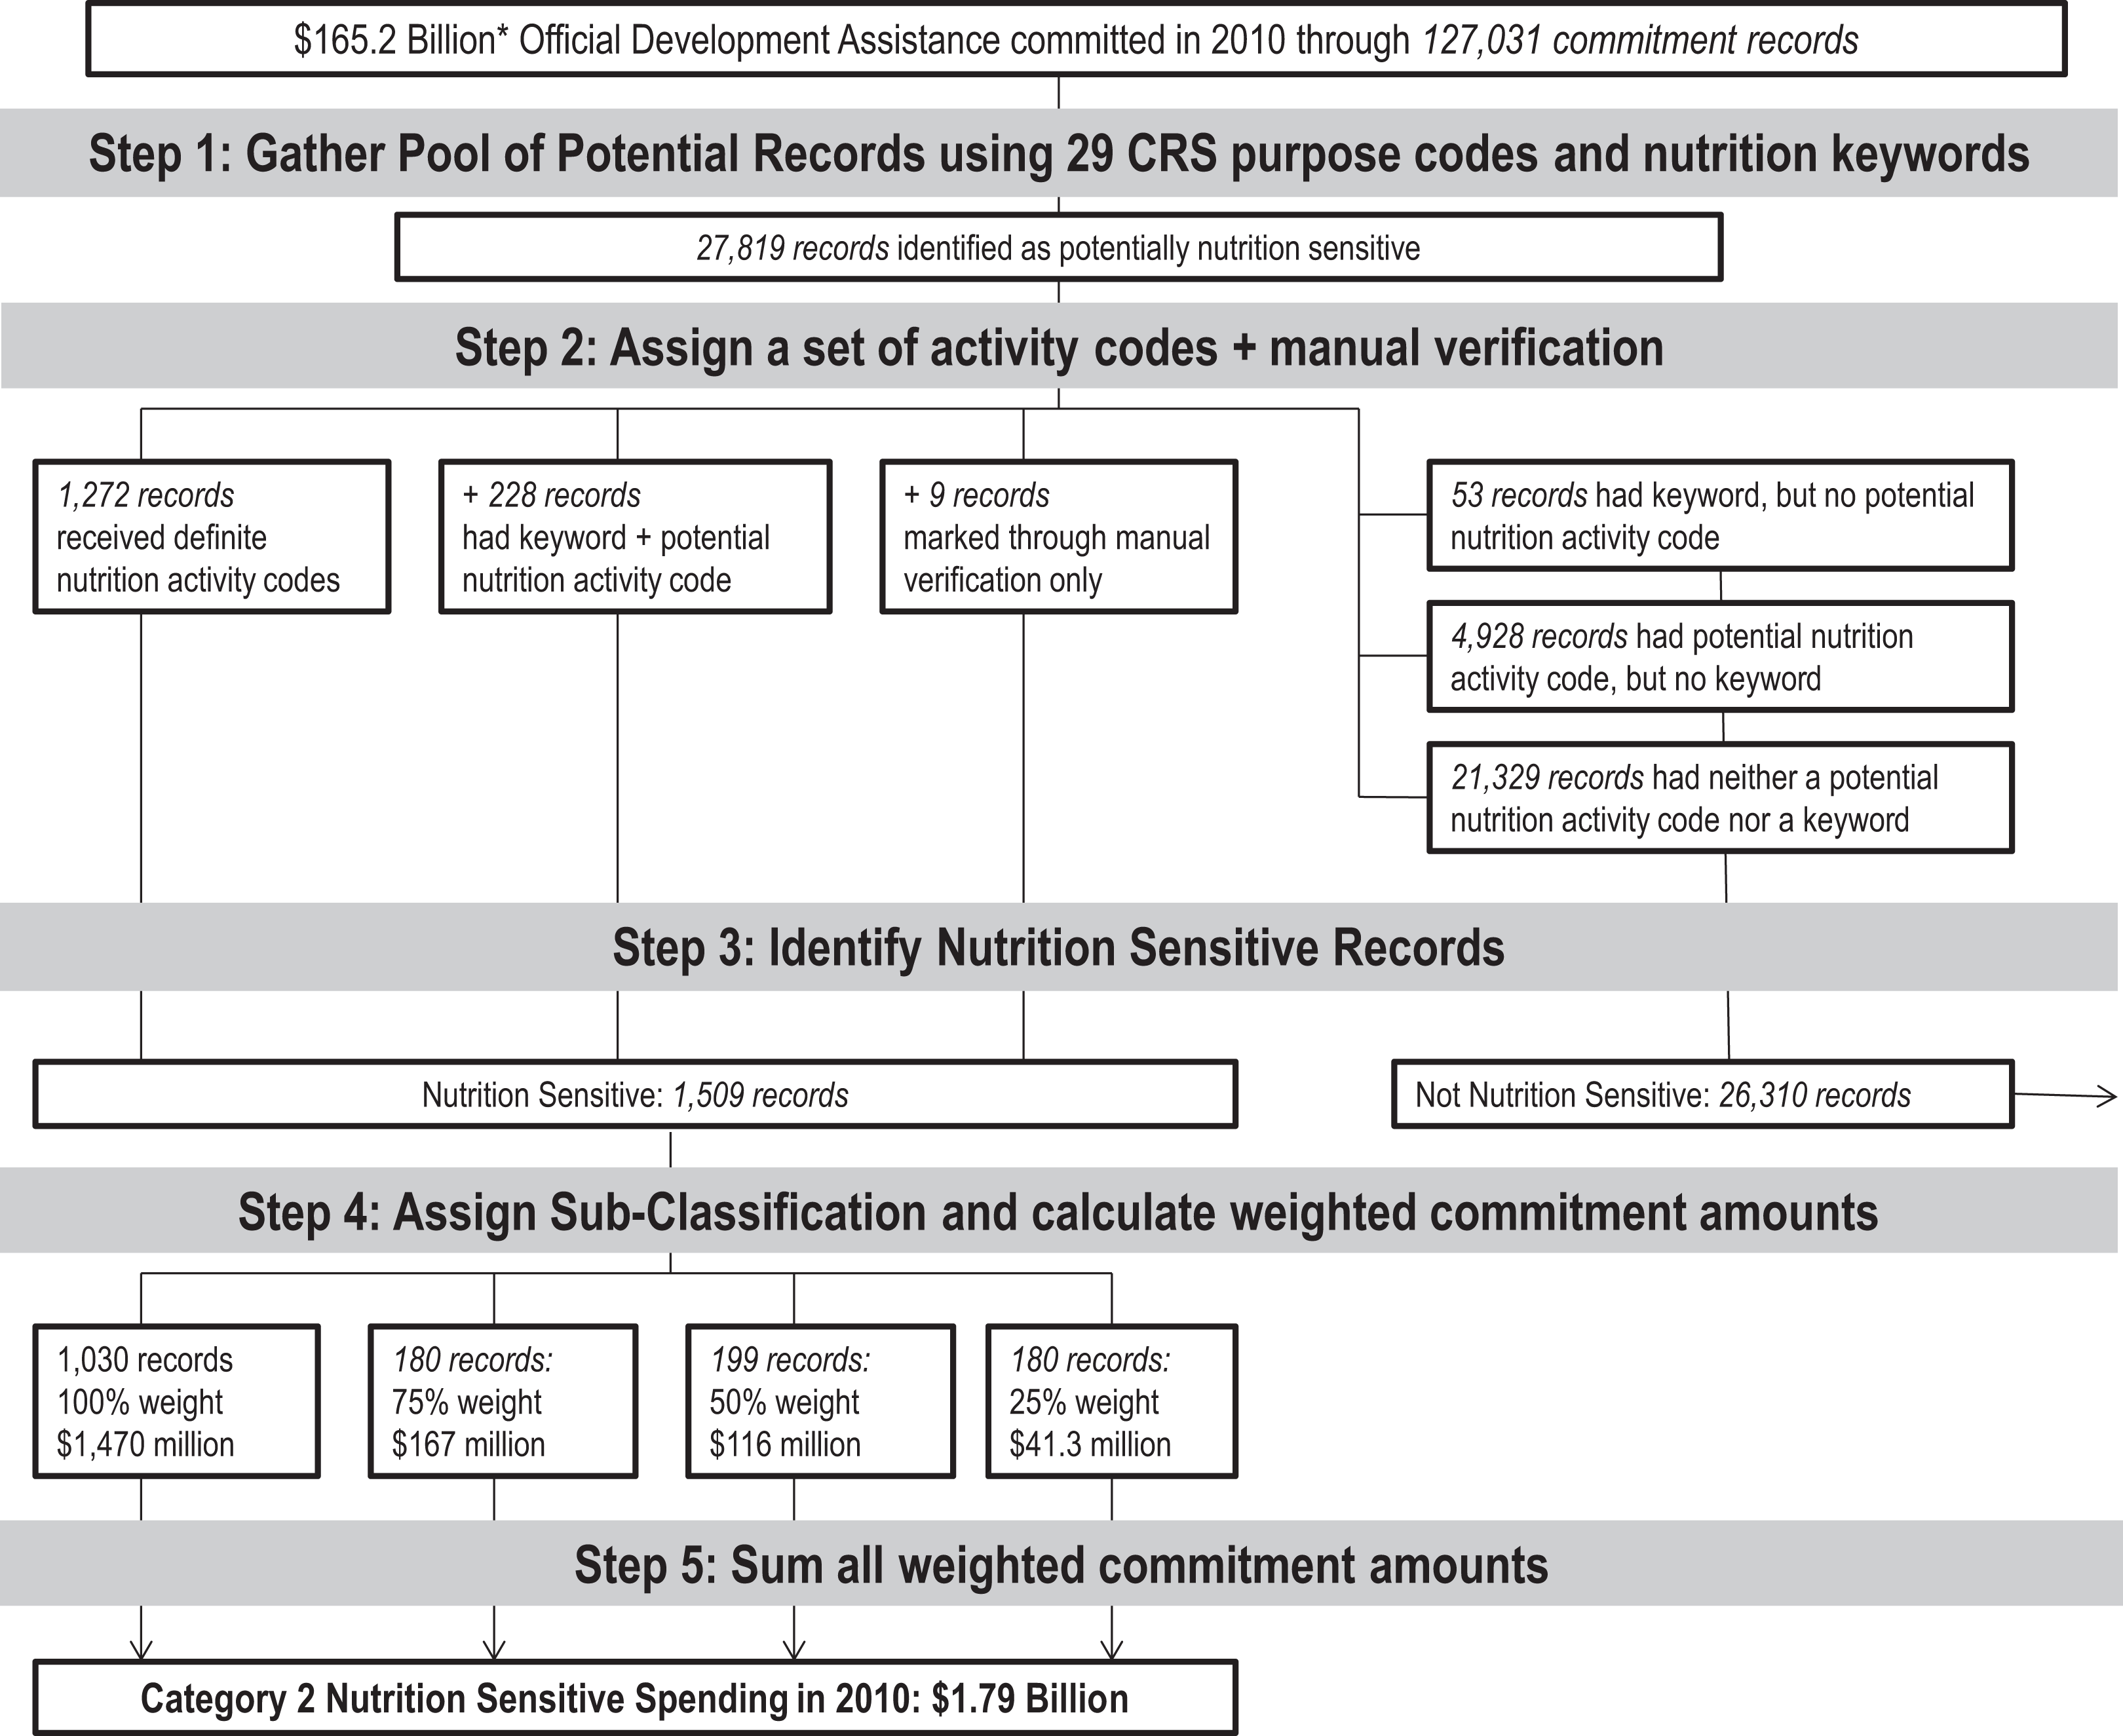
Identification of nutrition-sensitive commitments using Organization for Economic Co-Operation and Development (OECD) Creditor Reporting System (CRS) data and AidData’s activity coding scheme.
Category 2: Step 1. Gather the Pool of Potentially Nutrition-Sensitive Project Records
Donors committed $165.2 billion (B) of ODA through 127 031 total commitment transaction records in 2010. We used 29 purpose codes (Supplemental Table 1) and nutrition relevant key words (Supplemental Table 2) to filter out 27 819 potentially nutrition-sensitive project records. The list of relevant purpose codes and key words was based on the updated version of the UNICEF framework of maternal and child undernutrition, published in the 2008 Lancet series and further informed through consultations with the Government of Canada’s Department of Foreign Affairs, Trade, and Development (DFATD). 13
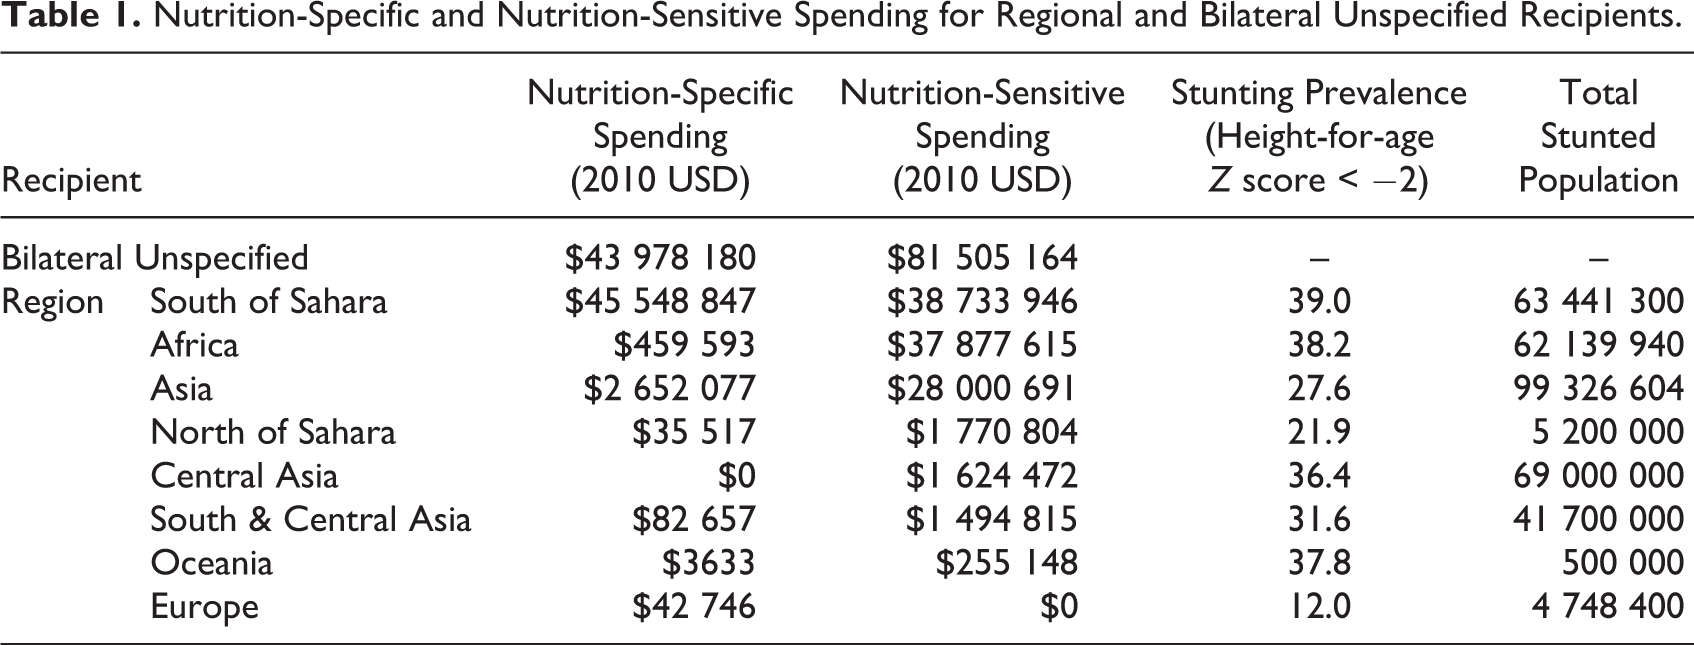
Nutrition-Specific and Nutrition-Sensitive Spending for Regional and Bilateral Unspecified Recipients.
Multivariate Regression Model of National Demographic Predictors of Nutrition-Specific Spending (n = 123 Countries).
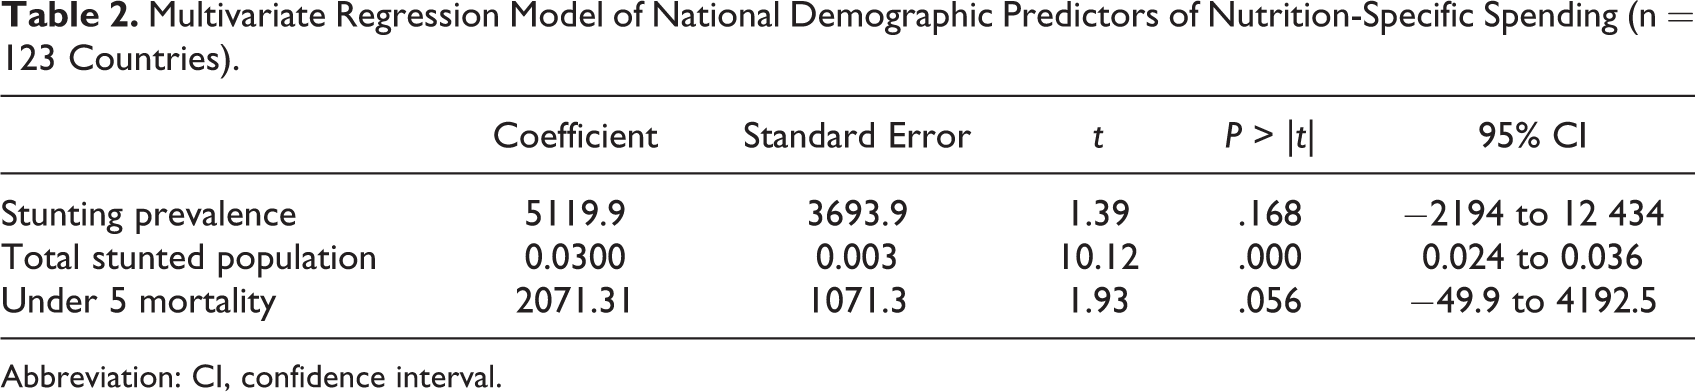
Abbreviation: CI, confidence interval.
Category 2: Step 2. Apply AidData’s Double-Blind and Arbitrated Activity Coding Scheme
AidData double-blind activity coded and arbitrated the full corpus of 27 819 potentially nutrition-sensitive records. Two coders assigned a set of activity codes to each record and a third settled any disputes in the 2 sets. Coders were trained to apply the most specific activity codes possible to comprehensively describe all project activities (not just those that seemed nutrition relevant) and to avoid applying activity codes based on extraneous contextual information.
Donors often report multiple records with identical descriptive information, which may be due to multiple financial transactions for 1 project or implementation in multiple countries. After detecting minor inconsistencies in some code assignments due to human coding variability, we undertook a final data quality assurance step to ensure that groups of matching transactions received an identical set of activity codes.
Category 2: Step 3. Identify Nutrition-Sensitive Records Using Activity Codes
We analyzed each record’s assigned set of activity codes using 2 mechanisms to determine nutrition sensitivity. Many records qualified as nutrition sensitive through both mechanisms, though the numbers here portray them as mutually exclusive for clarity.
Definite Nutrition Codes (1272 records): Any project record that received at least 1 of the following 6 definite nutrition codes automatically qualified as nutrition sensitive: basic nutrition, direct feeding programs, monitoring of nutrition status, provision of nutrients, nutrition and food hygiene education, and household food security. Potential Nutrition Codes + Key word (228 additional records): Any project record that received at least 1 of 86 other activity codes (see Supplemental Table 3) qualified as nutrition sensitive only if a nutrition key word was also present in the descriptive information (see Supplemental Table 2).
Multivariate Regression Model of National Demographic Predictors of Nutrition-Sensitive Spending (n = 123 Countries).a
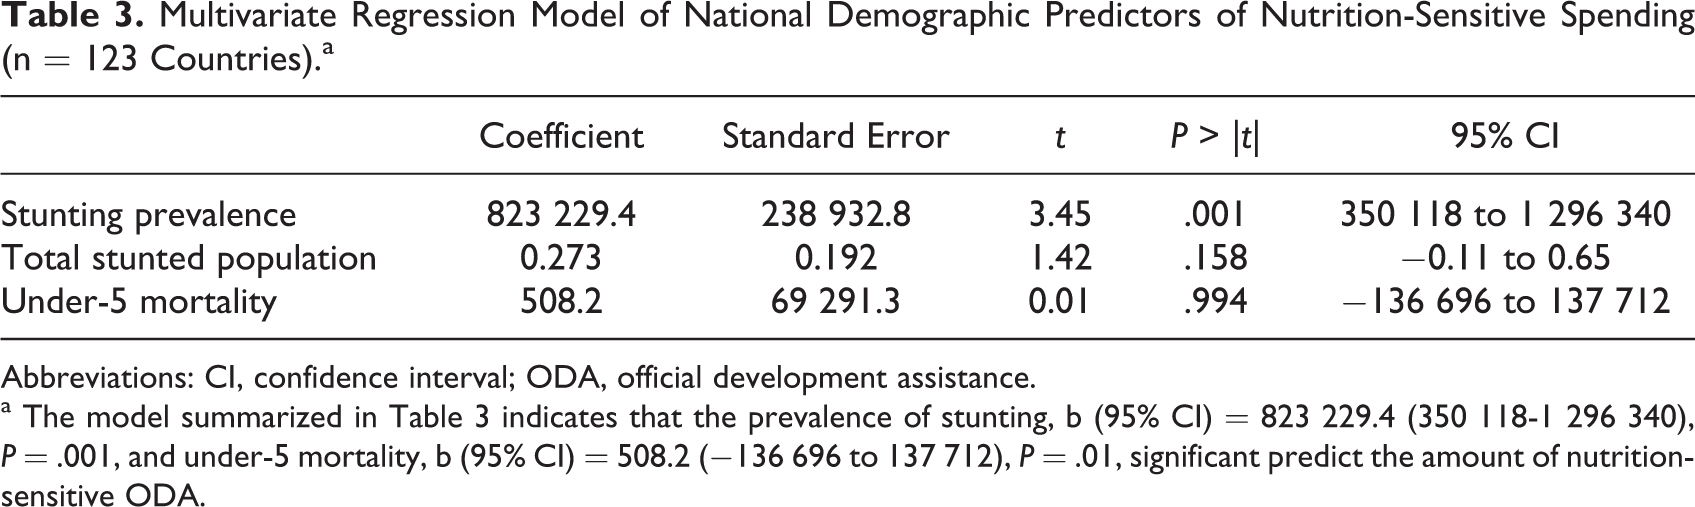
Abbreviations: CI, confidence interval; ODA, official development assistance.
a The model summarized in Table 3 indicates that the prevalence of stunting, b (95% CI) = 823 229.4 (350 118-1 296 340), P = .001, and under-5 mortality, b (95% CI) = 508.2 (−136 696 to 137 712), P = .01, significant predict the amount of nutrition-sensitive ODA.
A manual verification step also took place during coding. Coders immediately marked records as nutrition sensitive if they met one of the following criteria: (1) nutrition was the main or only stated objective or goal; (2) nutrition results or impact were explicit indicators of a project’s success; or (3) the project explicitly cites improved nutrition outcomes or a functional equivalent, such as reducing undernutrition or malnutrition. We aimed to verify that highly nutrition-sensitive transactions were not excluded during the activity code-based mechanisms. This step identified only 9 records that did not also qualify through either mechanism mentioned earlier.
This manual step was helpful in identifying a small number of highly nutrition-sensitive projects that would have otherwise gone undetected. Thus, our methodology highlights the trade-off between efficiency and precision. As reporting for nutrition projects improves and as the concept of nutrition sensitive interventions becomes more common, the need for such a labor-intensive step may grow smaller over time.
Category 2: Step 4. Assign Nutrition-Sensitive Subclassification and Calculate Weighted Commitment Amount
We identified 1509 project records with varying levels of nutrition sensitivity. We determined the proportion of (definite + potential) nutrition activity codes out of the record’s total number of codes as a measure of degree of nutrition sensitivity. Each proportion corresponded to a weight (100%, 75%, 50%, or 25%) that was multiplied by the record’s total commitment value to produce a “nutrition weighted” amount.
Category 2: Step 5. Sum All Weighted Commitment Amounts to Estimate Category 2 Nutrition-Sensitive Spending
The sum of all weighted commitment amounts from nutrition-sensitive project yielded an estimate of category 2 nutrition-sensitive spending.
Stunting Prevalence and Under-5 Mortality Estimates
We used 3 separate multivariate linear regression models to assess the relationship between national stunting prevalence, total stunting burden, and under-5 mortality rates and nutrition aid amounts. The 3 models examined the dependent variables of nutrition-specific ODA, nutrition-sensitive ODA, and total nutrition (nutrition sensitive plus nutrition specific) ODA, respectively. Individual country stunting prevalence and under-5 mortality rates estimates were taken from United Nations Data. 14 The pooled regional estimates of stunting and under-5 mortality were taken from the 2010 values in the most recent global stunting estimation. 15 Stunting prevalence was defined as the percentage of children under-5 with height-for-age Z scores 2 or more below the global reference median. Under-5 mortality rate was defined as the number of children who die before age 5 per 1000 live births. The regional prevalence for sub-Saharan Africa was estimated by deriving the mean of the 4 African subregion means, excluding North Africa (Eastern, Central, Southern, and Western). For each model, we hypothesized that greater levels of poor nutrition and health indicators (eg, higher stunting prevalence) would significantly predict the amount of nutrition-related ODA, since these indicators reflect chronic health conditions that would logically inform and drive nutrition-related ODA commitments.
Results
Category 1 Nutrition-Specific Spending
A total of 125 countries received ODA for nutrition in 2010. Categorized by region, 20 were located in the Middle East/North Africa, 48 in sub-Saharan Africa, 26 in Latin America/The Caribbean, 20 in South Asia, 11 in Europe/Central Asia, and 6 in East Asia/the Pacific.
Figures 2 and 3 present the top 50 country recipients for nutrition-sensitive (category 2) spending, over the prevalence of stunting (height-for-age Z score < −2). In order to compare nutrition-specific and nutrition-sensitive commitments between countries, the included countries are identical for both figures.
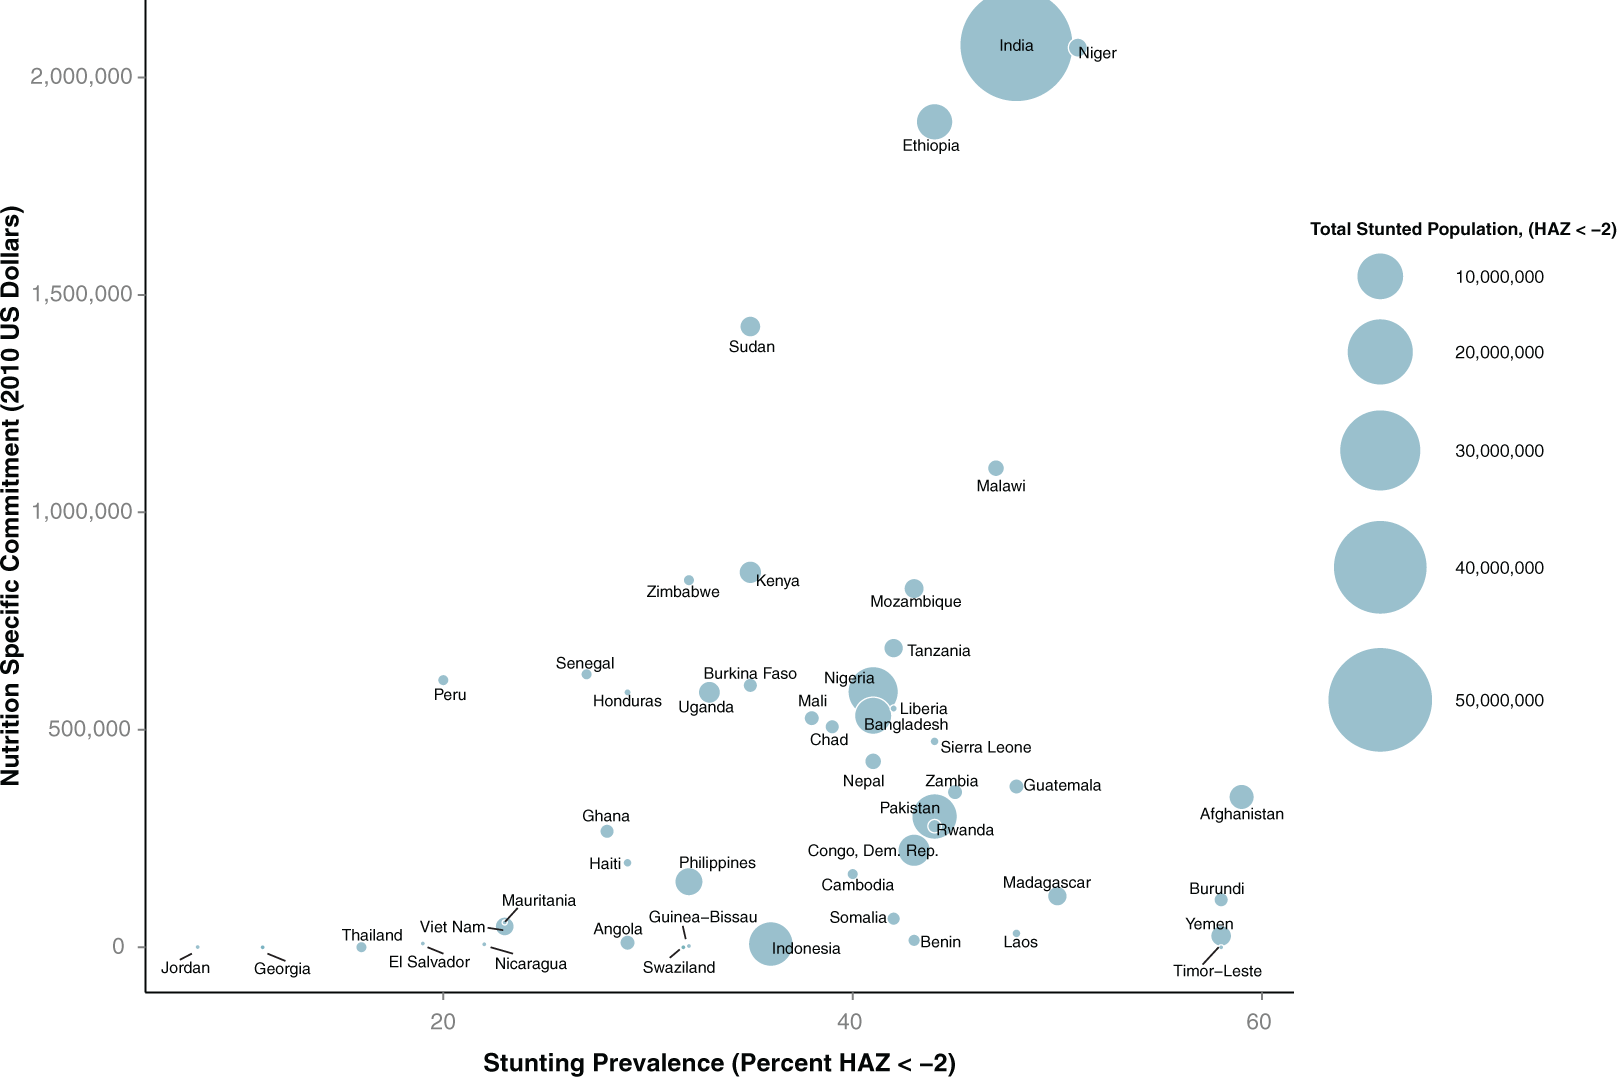
Category 1: Global totals of 2010 nutrition-specific spending by recipient country, stunting prevalence, and total stunted population. The size of each country plot represents the total number of stunted children, with benchmarks illustrated in the legend on the right of the figure. The 2 countries in parentheses had no nutrition-specific (category 1) commitments. Twelve of the top 50 country recipients for nutrition-sensitive official development assistance (ODA) were not in the top 50 recipients of nutrition-specific ODA. Including these countries in the figure displaced the following countries that ranked in the lower portion of category 1 commitments (in order of highest spending): Bolivia, Togo, Myanmar, Egypt, Djibouti, Brazil, Eritrea, Central African Republic, Cote d’Ivoire, Mayotte, South Africa, Ecuador, West Bank, and Gaza Strip. The countries that were not in category 1 top 50 but were included because they ranked in the top 50 of category 2 commitments (in order of highest spending) were Laos, Yemen, Benin, Angola, El Salvador, Indonesia, Nicaragua, Guinea-Bissau, Jordan, Thailand, Timor-Leste ($0), and Swaziland ($0).
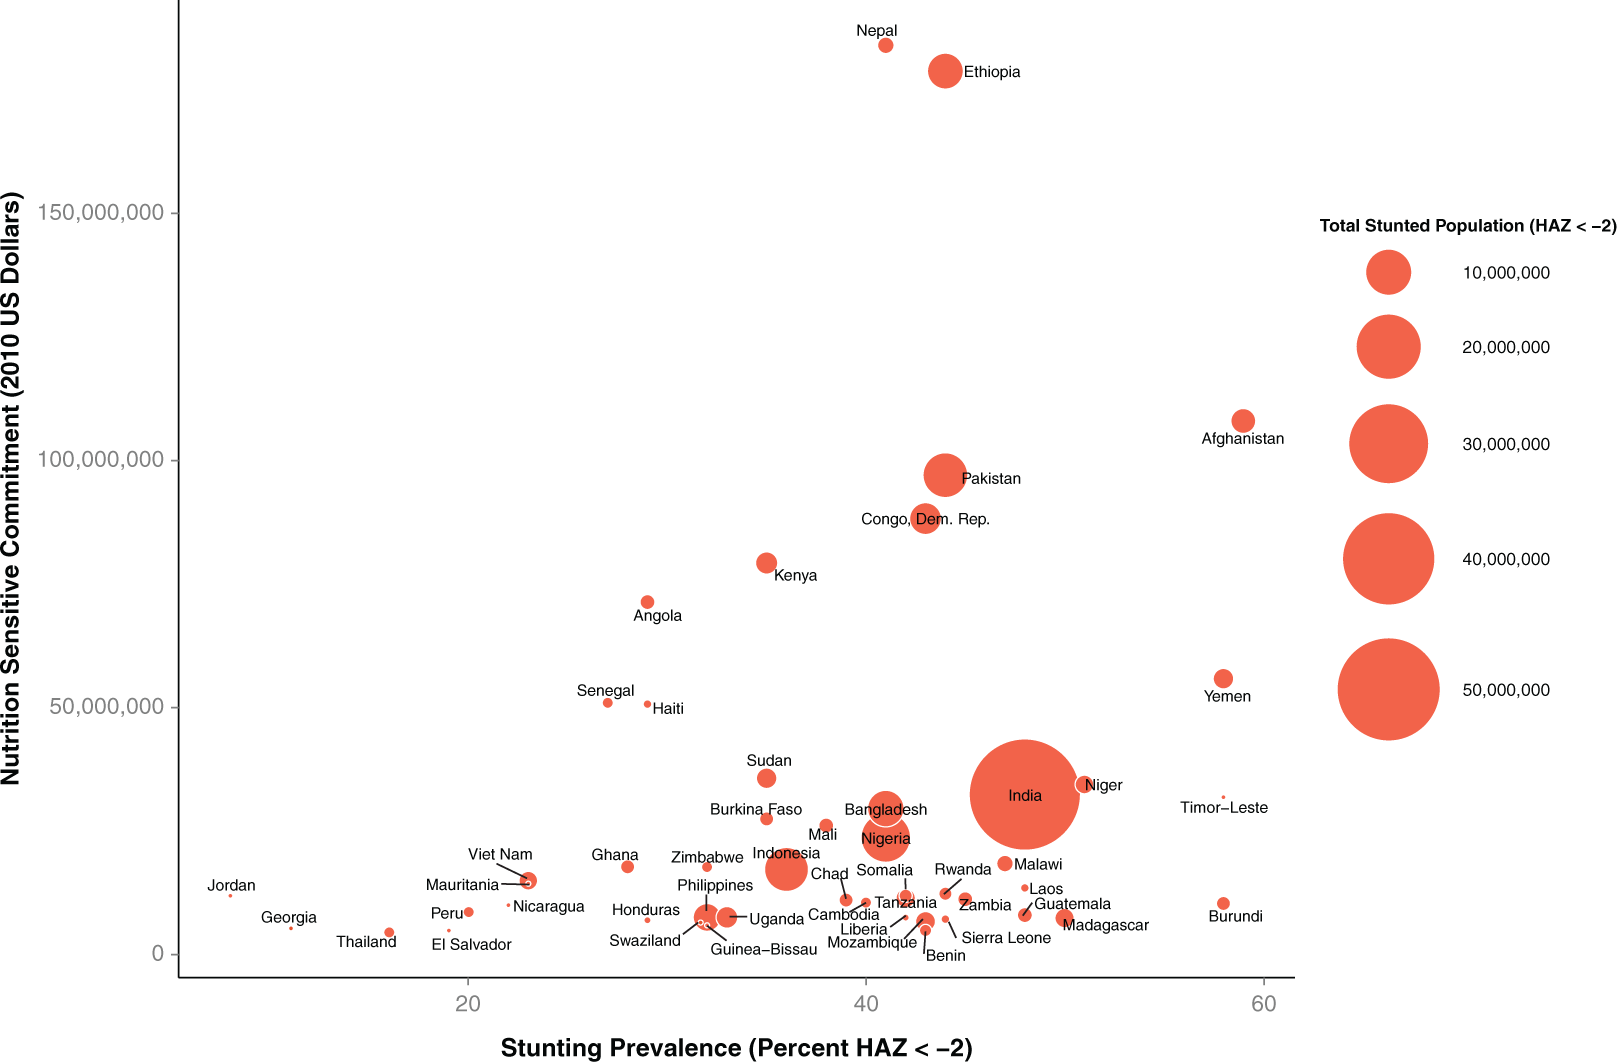
Category 2 : Global totals of 2010 nutrition-sensitive spending by recipient, stunting prevalence, and stunted population. The size of each country plot represents the total number of stunted children, with benchmarks illustrated in the legend on the right of the figure.
A total of $379.4 million (M) USD was committed to nutrition-specific projects and programs. Of this amount, 25 designated beneficiaries (countries and regions) accounted for nearly 85% ($320 M).
Figure 2 presents nutrition-specific ODA to countries, excluding regions and unspecified bilateral commitments, over national stunting prevalence. There was a modest correlation (r 2 = .327, P = .0002) of nutrition-specific spending and national stunting prevalence.
Category 2 Nutrition-Sensitive Spending
A total of $1.79 B was committed to nutrition-sensitive spending. Of this amount, the top 25 countries/regions accounted for $1.4 B (82%). Eighteen of the top 25 country recipients of nutrition-sensitive ODA had a total stunted population of over 1 M children. Nineteen of the top 25 recipients of nutrition-sensitive spending had under-5 child mortality rates of 70 deaths per 1000 live births or higher. Unlike nutrition-specific spending, Southeast Asian and Middle Eastern countries were leading recipients of nutrition-sensitive ODA: 6 of the top 25 country recipients of nutrition-sensitive commitments were from Southeast Asia, and 2 were from the Middle East (Afghanistan and Pakistan). Sixteen of the top 25 country recipients of nutrition-sensitive ODA were from sub-Saharan Africa. Figure 3 presents the top 50 recipient countries of nutrition-sensitive spending over the prevalence of stunting (height-for-age Z score < −2). There was a modest correlation (r 2 = .4061, P < .0001) of nutrition-sensitive spending and national stunting prevalence.
Table 1 summarizes the nutrition-specific and nutrition-sensitive ODA commitments that were specifically made at the regional (multicountry) level. For nutrition-specific ODA, the leading recipient was the sub-Saharan Africa region, which accounted for $45.5 M (12%). Commitments to unspecified bilateral recipients represented the second largest recipient of nutrition-specific spending ($44 M, 11%) and constituted a diverse mix of global projects that support more than 1 region (eg support for scientific institutions in multiple regions pursuing nutrition research). Commitments made to Asia at the regional level accounted for $25.5 M (6.4%) of nutrition-specific spending. Excluding regional-level commitments, 18 of the top 25 country recipients of nutrition specific aid were from sub-Saharan Africa. Twenty-one of the top 25 country recipients of nutrition specific aid had a stunting prevalence rate of over 30%, while 19 had an under 5 mortality rate of over 70 deaths per 1000 live births.
Unspecified bilateral nutrition-sensitive commitments accounted for $81.5 M or 2.7% of this spending category. Unlike nutrition-specific spending, regional nutrition-sensitive commitments were nearly equal for sub-Saharan Africa and Asia, where the stunting prevalence is also equivalent. The difference in nutrition-sensitive and nutrition-specific ODA was most apparent for regional commitments to Africa ($37.9 M vs 0.46 M) and Asia ($28.0 M vs $2.7 M). Notably, central Asia receives no regional ODA for nutrition specific purposes but $1.6 M for nutrition-sensitive ODA.
Predictors of Nutrition Spending
Tables 2 to 4 summarize the multivariate regression models that assess the relationship between national/regional nutrition and health indicators and nutrition spending for 123 recipients of nutrition-specific spending (excluding Samoa and Mayotte, where no anthropometric data are available). The model summarized in Table 2 indicates that the size of the total stunted population significantly predicts the nutrition-specific ODA, b (95% confidence interval [CI]) = 0.03 (0.02–0.036), P < .001. Under-5 mortality was marginally significant as a predictor of nutrition-specific ODA, b (95% CI) = 2071.3 (−49.9 to 4192.5), P < .001.
Multivariate Regression Model of National Demographic Predictors of Total Nutrition Spending (n = 123 Countries).a
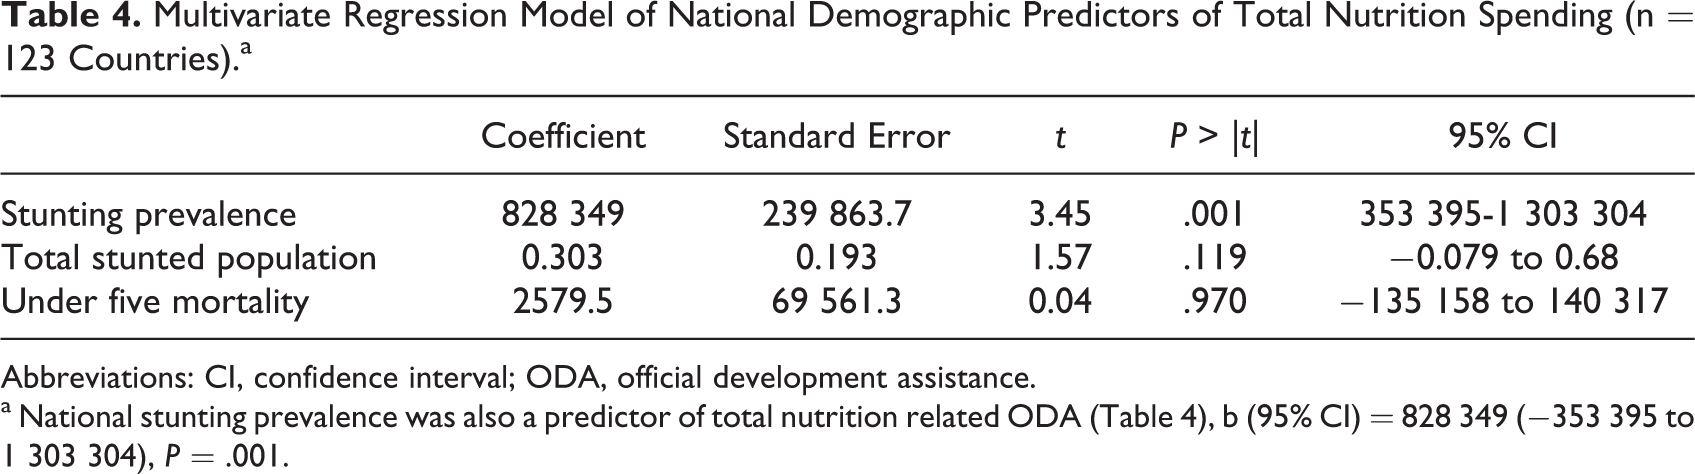
Abbreviations: CI, confidence interval; ODA, official development assistance.
a National stunting prevalence was also a predictor of total nutrition related ODA (Table 4), b (95% CI) = 828 349 (−353 395 to 1 303 304), P = .001.
Sectorial Allocation of Nutrition-Specific and Nutrition-Sensitive Spending
While we drew all nutrition-specific spending from one purpose code (CRS code 12240), nutrition-sensitive spending originated from more than 80 different donor-reported dominant purpose codes. Of these, only 9 purpose codes accounted for 75% of spending: Reproductive Health Care (30.4%), Food Aid/Food Security Programs (14.1%), Emergency Food Aid (13.2%), Basic Health Care (5%), Material Relief (3.2%), STD Control, Including HIV/AIDs (3%), Urban Development (2.8%), Agricultural Development (2.6%), and Agricultural Research (2.5%).
Nutrition-sensitive spending as a percentage of global totals is additionally illuminating. Reproductive health care captured the highest proportion of nutrition-sensitive spending, an amount that accounted for nearly half (47%) of the $1.16 B in total aid for reproductive health care in 2010. The amount of nutrition-sensitive spending on food aid and emergency food aid were similar, but while about 18% of all global food aid spending ($1.57 B) was classified as nutrition sensitive, only 0.15% of the much higher emergency food aid spending ($159 B) qualified. No water and sanitation purpose codes claimed a notable share of nutrition-sensitive spending, similarly reflected in the fact that only 0.3% of the $7.37 B spent in the entire water and sanitation sector was nutrition sensitive.
The SUN Movement and the research community have identified 3 categories of nutrition-sensitive interventions that seek to address the key determinants of adequate nutrition and development: increasing food availability, food accessibility, and food security; improving the care environment, including gender roles and women’s empowerment; and improving public health, water, and sanitation. 6,16,17 Calculations of donor spending in these areas required (1) initial identification of nutrition projects and (2) further subclassification, both of which are challenging due to the lack of detail in donor-reported information. Funding for reproductive health care, basic health care, and urban development (all major contributors to nutrition-sensitive spending) may include projects with components that simultaneously increase food availability, improve the care environment, and improve public health—and many projects that do none of that mentioned earlier. Thus, the use of a project’s single dominant purpose to complete this exercise both overestimates spending from certain sectors (eg basic health, food aid, water and sanitation) and completely ignores it in others (eg rural and urban development, agriculture, and social enterprises).
To calculate the amount of nutrition-sensitive spending allocated to these 2 key areas, we mapped each of the 92 codes that identified a potential nutrition activity to 1 of the 3 areas. The use of activity codes rather than dominant purpose allows 1 project to contribute funding to any or all 3 areas, but no double counting occurs. For each project record, all activity codes were assigned an equal proportion of the total commitment amount. For example, for a transaction with a total value of $1 M and 10 different activities, we assumed that each activity code received one-tenth of the total funding amount, or $100 000.
Figure 4 presents the sum of all funded nutrition activities mapped to each of the 3 categories and their share of the total funding. While other scholars apply these 3 categories to nutrition-sensitive funding, we found it useful to identify the distribution for both nutrition-specific and nutrition-sensitive spending. 6,16,17 The relative size of the 2 pie charts reflects the relative size of the 2 total spending amounts. Note that the total spending amount is less than the totals presented earlier in this section, as many nutrition projects also include activities that are not nutrition related and were not included in the total sum. As such, the relative share of funding in each of the 3 areas may be more significant than the actual amount. Further, since it is impossible to determine the actual amount committed to each of a project’s activities from reported information, we relied on a working assumption of equal allocation of funding across all activities.
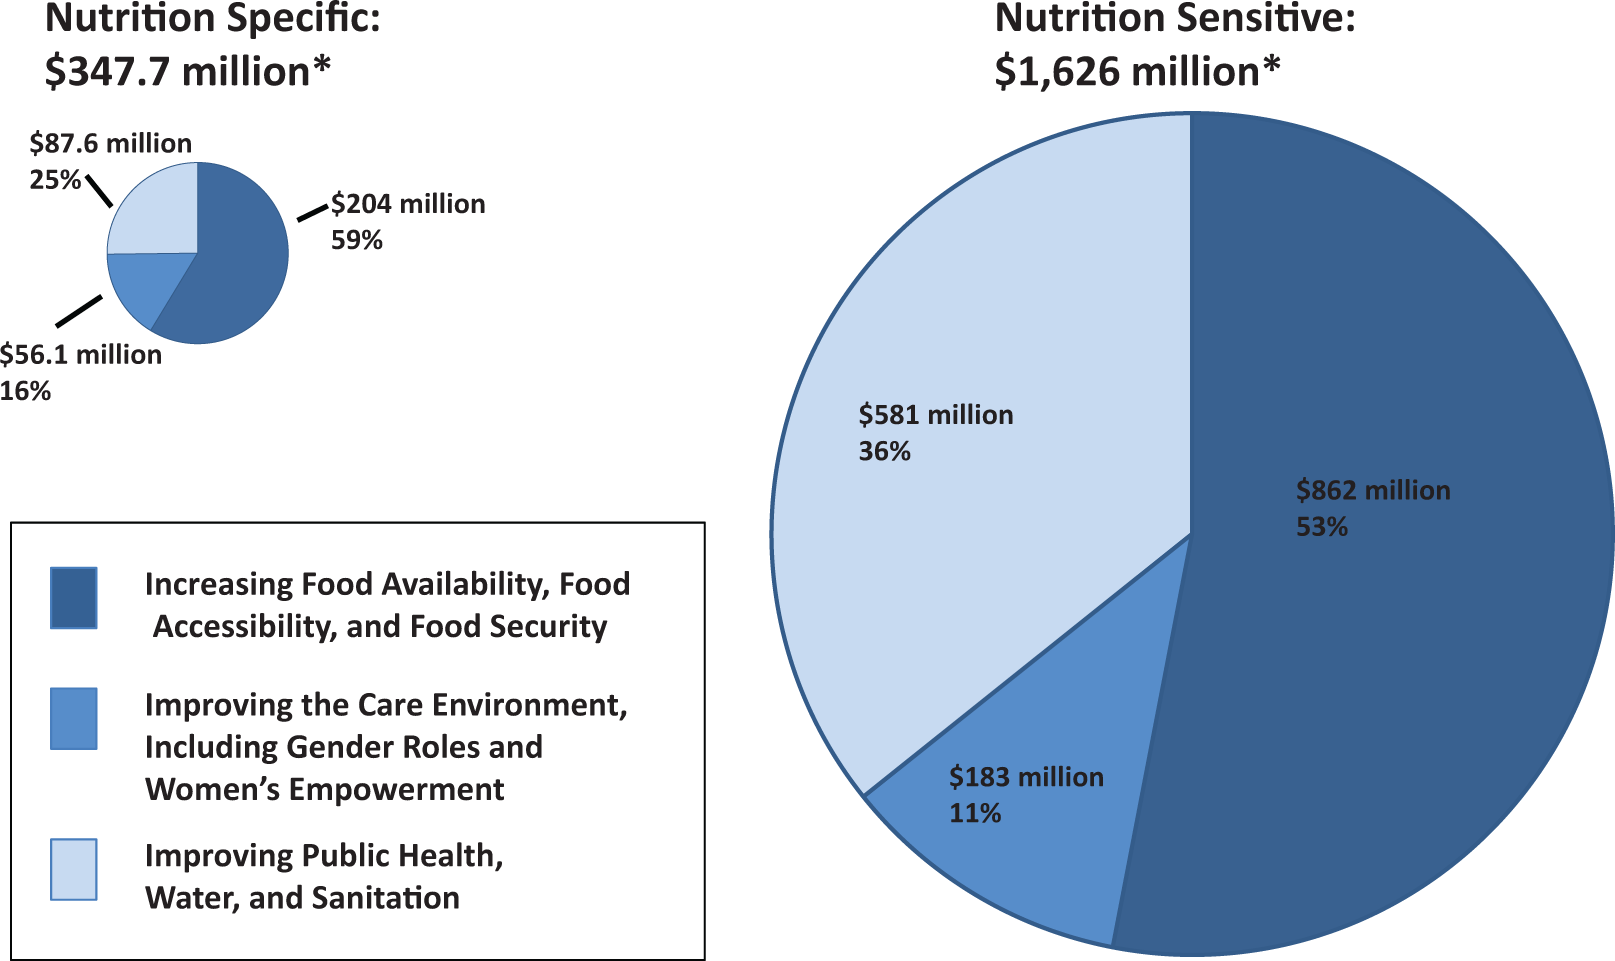
Share of nutrition-specific and -sensitive spending allocated to 3 key categories of underlying determinants of nutrition and development. Total spending differs from category 1 and category 2 overall estimates. See text for explanation.
Commitments directed toward food availability and security constituted the greatest proportion of spending by key focal area, accounting for over half of all nutrition-specific (59%) and nutrition-sensitive spending (53%) spending.
Funding to improve the care environment accounted for only 16% of nutrition-specific and 11% of nutrition-sensitive spending. While this relative distribution of resources is likely accurate in a broad sense, it is perhaps also a reflection of the difficulty in identifying donor activities that improve the care environment. Food aid and water and sanitation activities are often more discrete and measurable than efforts to address women’s empowerment or the household environment.
Discussion
Nutrition-sensitive interventions have great potential to accelerate progress in the reduction of maternal and child undernutrition. 6 It is clear that while the potential impact of nutrition-sensitive interventions may vary by approach, these interventions will be more effective at improving nutrition if measurable nutrition goals and outcomes are articulated from the outset. The recent promotion of this concept will undoubtedly affect the way large-scale development projects are conceived and reported, and therefore it is critical that the global development community can accurately measure and track spending to improve nutrition across these categories.
This study represents a first-of-its-kind effort to systematically classify and enumerate foreign aid flows for nutrition. Our findings, which rely on global spending data from 2010, indicate that, even before the publication of the 2013 Lancet Series on Maternal and Child, nutrition-sensitive international aid flows far exceeded nutrition-specific international aid flows. We hope that this work will provide a starting point for future discussions about how to define, classify, and track aid directed at improving nutrition outcomes.
Our results indicate the amount of nutrition-related spending is significantly predicted by the prevalence of stunting within countries and regions. The total burden of chronic undernutrition in countries and regions does not significantly predict nutrition aid amounts. Using visualizations and ranked comparisons, we identify the leading recipients of nutrition-specific and nutrition-sensitive aids.
It was interesting to note that in 2010 nutrition-specific spending was more closely related to the nutrition burden within counties and that nutrition-sensitive spending was more closely related to rate of undernutrition. This is particularly interesting, given that influential agenda-setting reports, such as the Lancet series on undernutrition and its precursors, estimate the total number of stunted children, total child mortality as well as rates by country and region. 13,18 Given that nutrition-sensitive spending patterns more likely represent broader development goals that address nutrition more indirectly that nutrition-sensitive spending was more closely related to rate of undernutrition be more driven by the population-specific rate of undernutrition. In either case, this finding highlights a pattern regarding the data types and data sources that may be informing donor commitments and the underlying evidence used to inform ODA planning, for nutrition specific and nutrition sensitive purposes.
Findings from this study are comparable to other estimates of nutrition-specific spending (also called direct nutrition). Findings from this study are comparable to other estimates of nutrition-specific programs to include projects, which had nutrition as the principal objective and projects mixing nutrition objectives with other objectives and estimated that between $185 M and $511 M per year was spent on nutrition between 2004 and 2007. 19 They concluded that $350 M a year was the most realistic estimate of funding for nutrition for this period. 19 Coppard and Zubairi examined both direct and indirect spending and estimated this figure to be $2 billion in 2009. 20 More recently, Action Contra La Faim applied an explicitly purpose code-based analysis to capture donor spending toward the 13 direct nutrition interventions using the CRS database between 2005 and 2009. The study reports, for example, that while $1.3 B was committed to “Food Aid/Food Security,” only $23 M was for nutrition. The authors estimate that, in 2009, $125 M was for direct nutrition interventions and $365 M (0.5% of total ODA) was given to indirect nutrition intervention. 8
Our methodology is limited in several ways, most of which relate to the current international system for tracking foreign aid for all purposes. First, donors vary widely in the amount of information provided to the CRS. Therefore, the classification process for nutrition-sensitive commitments favors donors and projects that provide more information. It is possible that donors with more specialized nutrition capacity will be better at reporting commitments in ways that favor nutrition-sensitive classification. It is also likely that these same donors are probably more engaged in nutrition-sensitive activities, given their stronger nutrition capacity. Second, some activities are easier to classify and more obviously relevant to nutrition goals and outcomes than others. This may introduce classification bias, whereby more obvious commitments are preferentially selected over others, even if both projects meet the definition of nutrition sensitive. Third, a large proportion of international aid for nutrition is committed at regional, multiregional, and global levels, which makes predictions of aid targeting less precise as the distribution of aid within regions will almost certainly be nonrandom. We cannot precisely understand aid allocation patterns when aid amounts are not disaggregated by country.
An additional limitation arises from our analytic approach. We operationalized a definition of “nutrition sensitive” that classified commitments within a subset of purpose codes and key words if they met activity code criteria. This approach attempted to provide a systematic means of capturing commitments that contained a nutrition goal or outcome and that addressed an underlying determinant of nutrition. This technique may overestimate nutrition-sensitive investments in sectors such as agriculture or food security, if nutrition is not an explicit focus of the intervention. While our methodology concludes that nutrition-sensitive approaches are a larger component of ODA than nutrition specific, the actual impact if this work may be weaker than for direct nutrition actions. To address this using the capabilities of the activity coding approach, we have further attempted to make a more accurate estimate of the level of “nutrition sensitivity” by weighting commitments based on the proportion of total activity codes that met specific nutrition-sensitive criteria.
Conclusion and Policy Implications
Tracking nutrition aid that is both specific to nutrition and sensitive to addressing the underlying determinants of nutrition is critical for achieving development goals. Each member country in the SUN movement has developed or will develop a “cost-based national plan” that itemizes necessary funds within strategic spending categories that are required over the next 5-year period to achieve national nutrition goals. Presently, no consistently applied global method exists to capture all of the nutrition-relevant aid that goes from donor countries to recipient countries. Nor is there a widely accepted standard for measuring nutrition relevant expenditure by developing country governments themselves. Our methodology provides a reliable process for estimating and comparing nutrition-related aid by different spending categories over time and between countries.
While a clear pattern between malnutrition burden and rates exists in poor countries, the global total spent on nutrition is far below the $11.8 estimated need to substantially address nutrition problems in the world’s poorest countries. 21 Even development efforts that are specifically focused on nutrition are largely fragmented, and coordination across the relevant sectors is poor. 22 Providing a reliable estimate of nutrition spending is therefore critical for future planning by recipient countries and future targeting by donors, as we aim toward the next set of global development goals to reduce the many interrelated causes of undernutrition in low-income countries.
Supplemental Material
Supplemental Material, sj-docx-1-fnb-10.1177_0379572115611785 - Building a Stronger System for Tracking Nutrition-Sensitive Spending: A Methodology and Estimate of Global Spending for Nutrition-Sensitive Foreign Aid
Supplemental Material, sj-docx-1-fnb-10.1177_0379572115611785 for Building a Stronger System for Tracking Nutrition-Sensitive Spending: A Methodology and Estimate of Global Spending for Nutrition-Sensitive Foreign Aid by Scott B. Ickes, Rachel B. Trichler and Bradley C. Parks in Food and Nutrition Bulletin
Footnotes
Acknowledgments
The authors wish to thank Taylor Hurst for her management of the data coding team at the College of William and Mary. We also thank Albert Decatur and Christian Peratsakis, for technical support on database development and management. We are indebted to Brian O’Donnell for substantial contributions to the initial methodology for this research. We thank our colleagues at the Government of Canada Department of Foreign Affairs, Trade, and Development (DFATD) Dr Erin McLean, Elizabeth King, Paula Betuzzi for their contributions to the development of the methodology. Patrizia Fracassi, Secretariat of the Scaling Up Nutrition Movement provided helpful guidance in the development of the methodology and analytic strategy.
Author Note
SI, RT, and BP developed the methodology and designed the study. RT collected and oversaw the coding of the study data. RT and SI analyzed the data, developed the tables and figures and wrote the manuscript. BP provided critical feedback on the manuscript. All authors have read and approved the final manuscript. SI and RT contributed equally to the manuscript. Our colleagues at the Government of Canada Department of Foreign Affairs, Trade, and Development (DFATD) Dr Erin McLean, Elizabeth King, Paula Betuzzi contributed to the development of the methodology for this study. The corresponding author had full access to all of the data in the study and had final responsibility to submit the manuscript for publication.
Declaration of Conflicting Interests
The author(s) declared no potential conflicts of interest with respect to the research, authorship, and/or publication of this article.
Funding
The author(s) disclosed receipt of the following financial support for the research, authorship, and/or publication of this article: Funding for this work was provided through the “Scaling Up Nutrition (SUN) Resource Tracking” grant from the Government of Canada’s Department of Foreign Affairs, Trade, and Development (formerly Canadian International Development Agency) to the AidData program at the College of William and Mary.
Note
References
Supplementary Material
Please find the following supplemental material available below.
For Open Access articles published under a Creative Commons License, all supplemental material carries the same license as the article it is associated with.
For non-Open Access articles published, all supplemental material carries a non-exclusive license, and permission requests for re-use of supplemental material or any part of supplemental material shall be sent directly to the copyright owner as specified in the copyright notice associated with the article.