
Abstract
Background:
Meals served at government-run day care centers must be nutritionally adequate to ensure good health and proper development of preschool-aged children. They can provide a controlled opportunity to complement the daily diet of children in vulnerable populations.
Objective:
To determine the nutrient adequacy and leading food sources of nutrients provided by the diet served in government-sponsored day care centers.
Methods:
Estimated daily energy and nutrient intakes of a theoretical 40-day day care center menu were calculated, and the nutrient adequacy was assessed. Nutrient densities and critical nutrient densities of the menu were computed to identify nutrient inadequacies. Furthermore, main sources of nutrients were identified, and energy and nutrient distributions were examined by meal time.
Results:
The menu provides approximately 90% of daily energy requirement and more than 100% of Recommended Nutrient Intakes (RNIs), with the exception of vitamin D and calcium. Sugar was the first leading source of energy, whereas milk was the first leading contributor of vitamin D.
Conclusion:
Within an environment of budgetary constraints, the Guatemalan government developed and advocated an exemplary menu offering for children in the vulnerable preschool period. We have demonstrated that, if prepared and served as planned, the items from the official, standard menu would supply most of the nutrients needed. High vitamin A intake related to the mandated national fortification program is a potential problem. From the analysis, it was found that vitamin D emerges as the most prominent candidate for a problem nutrient of deficient intake.
Introduction
The adequacy of nutrients and the healthful balance of foods and beverages are essential to the development and well-being of children. 1,2 Traditionally, meals for all members of the family were provided within the home, but out-of-home consumption is becoming more prevalent. 3,4 Several studies have illustrated that dietary choices made for or by young children in the home environment can have a low nutrient density, especially when foods and beverages are selected by young children themselves. In Cretan kindergarteners, 60% consumed sugar-sweetened beverages or commercial fruit juices on a daily basis, not within an institutional food context. The higher the volume of such beverages consumed, the lower were the intake of essential nutrients (vitamins A and E and calcium) and the consumption of alternative, more suitable drinks such as milk and yogurt. 5 In day cares centers in Santiago, Chile, energy intake in foods consumed within the center was proportional to the estimated energy density required for energy balance. It was at home in the evenings and weekends that the energy intake exceeded the estimated needs. 6 Similar findings were replicated in kindergarten children in Porto Alegre in southern Brazil. 7 If left to their own choices, preschoolers would not choose healthy and nutritious foods. Preferences among 250 Mexican day-care-attending preschoolers were for ice cream, potato chips, and lollipops, which are considered to be unhealthy by the authors. 8 Institutions where young children receive a significant proportion of their daily fare can offer an opportunity to provide centralized, optimized, and healthier diets. Menus in day care centers that embody principles of healthful food and beverage selection and adequate nutrient density would tend to thwart indulgence in the less desirable fare.
Day care center meal provision and nutrient offering in Guatemalan public facilities serving low-income families has been an interest of Center for Studies of Sensory Impairment, Aging and Metabolism (CeSSIAM) in several previous publications. 9 –11 Overall, we observed that nutrient density of the diet provided at the institutions was adequate and complemented the home diet well. 11 The detailed analysis of foods and beverages served at day care centers provided the basis for suggesting reforms at the specific centers and for understanding the generic challenges and opportunities across the system for low-income attendees in Guatemala City.
The Secretaria de Obras Sociales de la Esposa del Presidente (Secretariat of Beneficial Works of the First Lady [SOSEP]) of Guatemala is a governmental office that provides benefits for the low-income population. Included among its programs are community-based day care centers named “Hogares Comunitarios” (Community Homes). These facilities offer the great advantage for intake research insofar as meal service is based on a universal menu across the system. Simply matching food composition table data to portion sizes of the items prescribed would provide a theoretical tabulation of the nutrients offered within the program. We present here the result of an analysis to convert the SOSEP menu into quantitative macro- and micronutrients offering in the perspective of its contribution to meeting the prescribed daily recommendation of preschool children.
Materials and Methods
This article comprises the analysis of the nutritional contribution of foods and beverages offered in the meals provided in government-sponsored day care centers across Guatemala. Since no participants were involved, no ethical approval was sought.
The SOSEP Day Care Center Program
The SOSEP is a governmental office that coordinates and finances community-based day care centers across the nation. The SOSEP day care centers are operated with the assistance of community mothers in order to provide child care opportunities for children aged 2 to 7 years, from Monday through Friday. This system is a viable alternative to government-run centers and provides a nontraditional, low-cost strategy for child care in low-income settings. The children receive care, schooling from a certified teacher, and several daily meals.
Rotating Menu and Recipe Book
Among the components of the Hogares Comunitarios program are the meals served during the center day, namely, breakfast, midmorning snack, lunch, and midafternoon snack. The diet offered by the SOSEP day care centers is based on 8 detailed 5-day/week menus. These menus were designed by a group of nutritionists. The menus specify the elements and recipes for 160 repasts, which were served over 40 days within an 8-week period. The menus are repeated after 8 weeks, making it a rotating menu.
The detailed menus include portion sizes in household measures (eg, half a cup of cucumber salad), weight (eg, 4 ounces of chicken in sauce), or in both household measures and weight (eg, a single 6-ounce glass of Incaparina® gruel (Alimentos, SA, Santa Catarina Pinula, Guatemala)). Foods and beverages are usually specified, with the exception of the type of fruit served in the midmorning snack and a choice is given between serving bread or corn tortilla with breakfast and serving corn tortilla or corn tamale with lunch. The menus are accompanied by a detailed recipe book, which provides instructions for the purchasing of ingredients and preparing 81 recipes of the prescribed dishes. The recipes were designed to serve 10 children aged 2 to 7 years, although it is known that portion sizes will vary significantly within this age range.
The meals specified in the SOSEP menu are estimated to provide 80% of the daily energy needs, and the remaining 20% of foods and beverages are assumed to be provided by home dinners. The government provides the finances to purchase the items, and personnel of the individual day care centers prepare and serve the meals and snacks as specified in a formal menu and recipe book.
Energy and Nutrient Analysis
All foods and beverages prescribed in the menu were entered into an Excel worksheet. A different commonly eaten fruit was assumed to be eaten each day of the week, breakfast was accompanied by either corn tortilla or bread, and lunch by either corn tortillas or corn tamales, alternatively. Recipes were entered as separate ingredients. Portion sizes were converted from household measures into individual intake in grams. Standard portion sizes of commonly used household measures were previously determined. All recipe portions were divided by 10 to assess individual intake.
The energy and nutrient values of all foods and beverages were primarily derived from the US Department of Agriculture (USDA) National Nutrient Database for Standard Reference version 26. 12 Nutrient values of food items not listed in the USDA table, such as lime-treated corn tortillas and refried black beans, were taken from a food composition compiled specifically for Latin American foods. 13 Nutrition information not listed in the food databases or known to be different in Guatemala, such as vitamin A-fortified table sugar, was taken from product labels or from information supplied by the manufacturer. Estimated daily intake of energy, protein, carbohydrates, total sugar, fiber, fat (saturated fatty acids, monounsaturated fatty acids [MUFAs], and polyunsaturated fatty acids [PUFAs]), 12 vitamins (vitamins A, D, E, K, and C, thiamine, riboflavin, niacin, vitamin B6, pantothenic acid, folate, and vitamin B12), and 10 minerals (calcium, phosphorus, magnesium, iron, zinc, copper, manganese, selenium, sodium, and potassium) were computed by multiplying the portion size of each ingredient by the energy and nutrient content of each food in Excel.
Day-to-Day and Week-to-Week Variation in Energy and Nutrient Intakes
Day-to-day variation (over 40 days) and week-to-week variation (over 8 weeks) in energy and selected nutrients were assessed by calculating the coefficient of variation (CV). The CV is defined as the standard deviation (SD) divided by the mean intake.
Nutrient Adequacy of the Menus
Estimated daily energy and nutrient intakes were compared to age-specific World Health Organization (WHO) and Institute of Medicine (IOM) requirements and expressed as percentages of requirements met. Although 3-year-old children, and even a few 2-year-old children, attend the institutions, we have used intake recommendations that embrace children older than 48 months, aged 4 to 6 years 14 or 4 to 8 years 15 –19 for convenience and conciseness. A limitation in our design is that the SOSEP menu was not designed to cover total daily intake and is likely to cover approximately 80% of daily energy. However, we compared the estimated intakes to the 24-hour daily requirements. Any gaps found in the adequacy of the diet could therefore potentially be met with the additional foods and beverages served at home.
The WHO requirements were based on the following assumptions. The energy requirements for children attending the day care centers were based on the average WHO energy requirement for 4- to 5-year-old boys and girls which were calculated using the following formula: 77 × kg for boys and 74 × kg for girls. 20 The body weight at midpoint of age interval of the 2006 WHO growth standards was used, and this is 17.3 kg for boys and 16.9 kg for girls. 21 The safe level of protein intake for children was assumed to be 1.3 g/kg body weight. 22 Recommended Nutrient Intakes (RNI) for children aged 4 to 6 years were used as references for micronutrient intakes. 14 A bioavailability of 10% was assumed for iron, and moderate bioavailability was assumed for zinc.
Using the IOM system, the average of the estimated energy requirement for 4- to 5-year-old boys (1408 kcal) and girls (1325 kcal) was used as a reference. The assumed body weight is 17.3 kg for boys and 16.9 kg for girls. 23 For children aged 4 to 8 years, the dietary reference intakes (DRIs) were used for energy, carbohydrate, fiber, fat, fatty acids, and protein. 23 For children aged 4 to 8 years, the recommended dietary allowances (RDAs) were used as references for micronutrient intakes. 15 –19
Nutrient Density of the Menus
The diet of infant and young children is typically composed of a combination of breast milk and complementary feeding. As it is extremely difficult to quantify the intake of breast milk, Brown et al 24 used the concept of nutrient density of complementary foods to assess nutrient adequacy. Similarly, we applied a nutrient density perspective in our analysis. In this instance, we were unable to quantify food consumed later at home as evening meals and as such examined the nutrient density of the diet served in the institutional environment. The observed nutrient density of protein, carbohydrates, total sugar, fiber, fat (saturated fatty acids, MUFAs, PUFAs), 12 vitamins, and 10 minerals was calculated as the estimated nutrient intake divided by the energy provided and expressed per 100 kcal.
Critical Nutrient Density
The critical nutrient density concept can be used to evaluate the nutrient adequacy of the diet. The critical nutrient density is the quantity of nutrients per 100 kcal of the diet that would achieve the WHO or IOM nutrient requirements. The critical nutrient density was calculated as the RNI or RDA divided by the calculated energy requirement (assuming a reference population energy need of 1300 and 1366 kcal, respectively) and presented per 100 kcal. The median estimated nutrient densities of the observed diets were compared to the median critical densities to identify inadequate intakes.
Main Dietary Sources of Energy and Nutrients
A total of 112 discreet items were coded for the nutrient analysis from the day care menus. A time-honored conventional approach for examining the dietary origins of nutrients is to rank order the top 10 or 20 contributing sources. 10,11,25 –30 The main source of energy, macronutrients, and micronutrients of the offering of a 40-day SOSEP menu was computed. Furthermore, the 10 leading nutrient sources among 10 vitamins and minerals selected for the suspicion of being problematic in the Guatemalan diet are presented in descending order of percentage contribution to the total daily intake.
Main Dietary Sources of Energy and Nutrients
The percentage contribution of energy and nutrient offering of a 40-day SOSEP menu by meal time is presented. The midmorning and midafternoon snacks were combined.
Statistical Analysis
Data were analyzed using SPSS version 17.0 (SPSS Inc, Chicago, Illinois). Descriptive statistics are presented. The Shapiro-Wilk test for normality was used to identify skewed distributions, but no comparative statistical analysis was performed.
Results
Day-to-Day and Week-to-Week Variation in Nutrient Offering
The mean daily offering of energy and selected nutrient obtained from the SOSEP menu is presented in the first column of Table 1. After testing for the normality of the distributions, it was determined that estimated intake for most nutrients was normally distributed (18 of 31), and 13 had skewed distributions (namely, energy; fiber; MUFAs; vitamins A, D, and K; riboflavin; vitamin B6; pantothenic acid; vitamin B12; calcium; copper; and sodium), as indicated in Table 1. Estimated energy and nutrient day-to-day variations (for 40 days) were greater than the week-to-week variations (for 8 weeks). The CVs for day-to-day variation ranged from a low of 10.1% for energy to a high of 233.1%, again for vitamin B12. The CV for week-to-week variation ranged from a low of 5.1% for carbohydrate to a high of 100.6% for vitamin B12.
Estimated Daily Energy and Nutrient Offering of a 40-Day SOSEP Menu and Week-to-Week and Day-to-Day Variation.
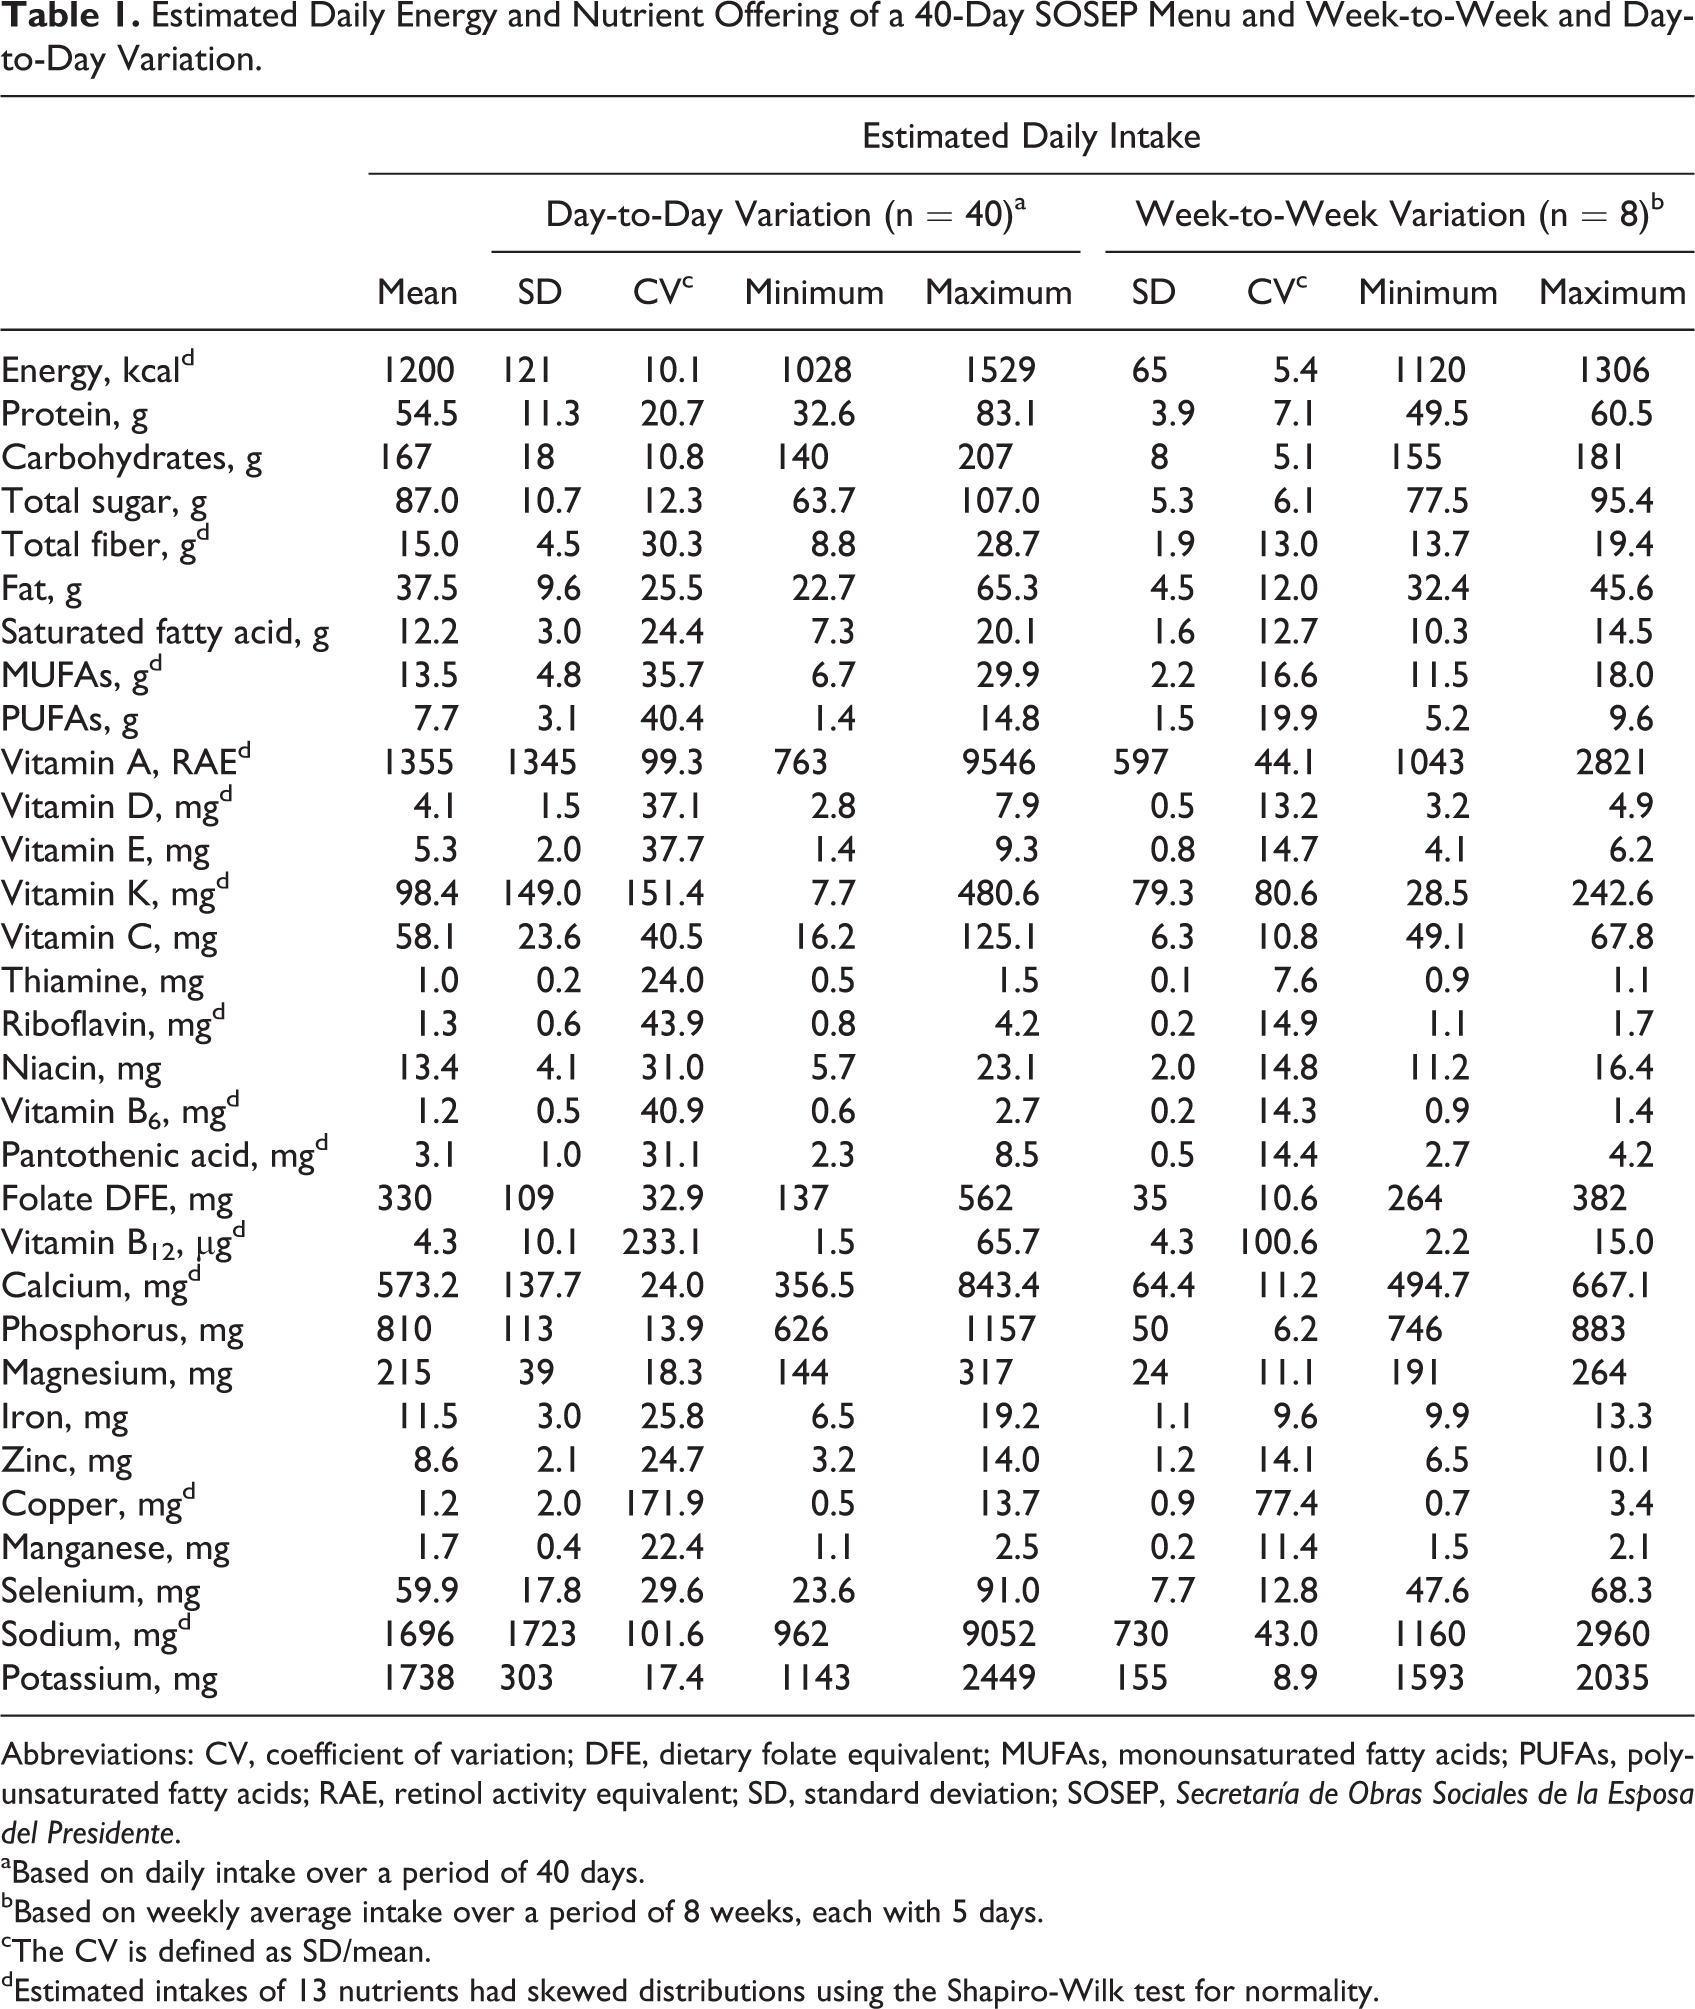
Abbreviations: CV, coefficient of variation; DFE, dietary folate equivalent; MUFAs, monounsaturated fatty acids; PUFAs, polyunsaturated fatty acids; RAE, retinol activity equivalent; SD, standard deviation; SOSEP, Secretaría de Obras Sociales de la Esposa del Presidente.
aBased on daily intake over a period of 40 days.
bBased on weekly average intake over a period of 8 weeks, each with 5 days.
cThe CV is defined as SD/mean.
dEstimated intakes of 13 nutrients had skewed distributions using the Shapiro-Wilk test for normality.
Expressions of Adequacy of the Nutrient Offering
The contribution of the nutrients offered within 2 main meals and 2 snacks to a full day’s recommended intake for children in this age-group are presented in Table 2. The nutrients not meeting 100% of the target value for the 19 specified in the RNI system are energy and iron (Table 2). The DRI provides recommendations for 26 distinct nutrients, and the following 7 nutrients do not meet the full target RDA value: energy, fiber, vitamin D, vitamin E, calcium, magnesium, and copper (Table 2).
Energy and Nutrient Adequacy of the Nutrient Offering of a 40-day SOSEP Menu.
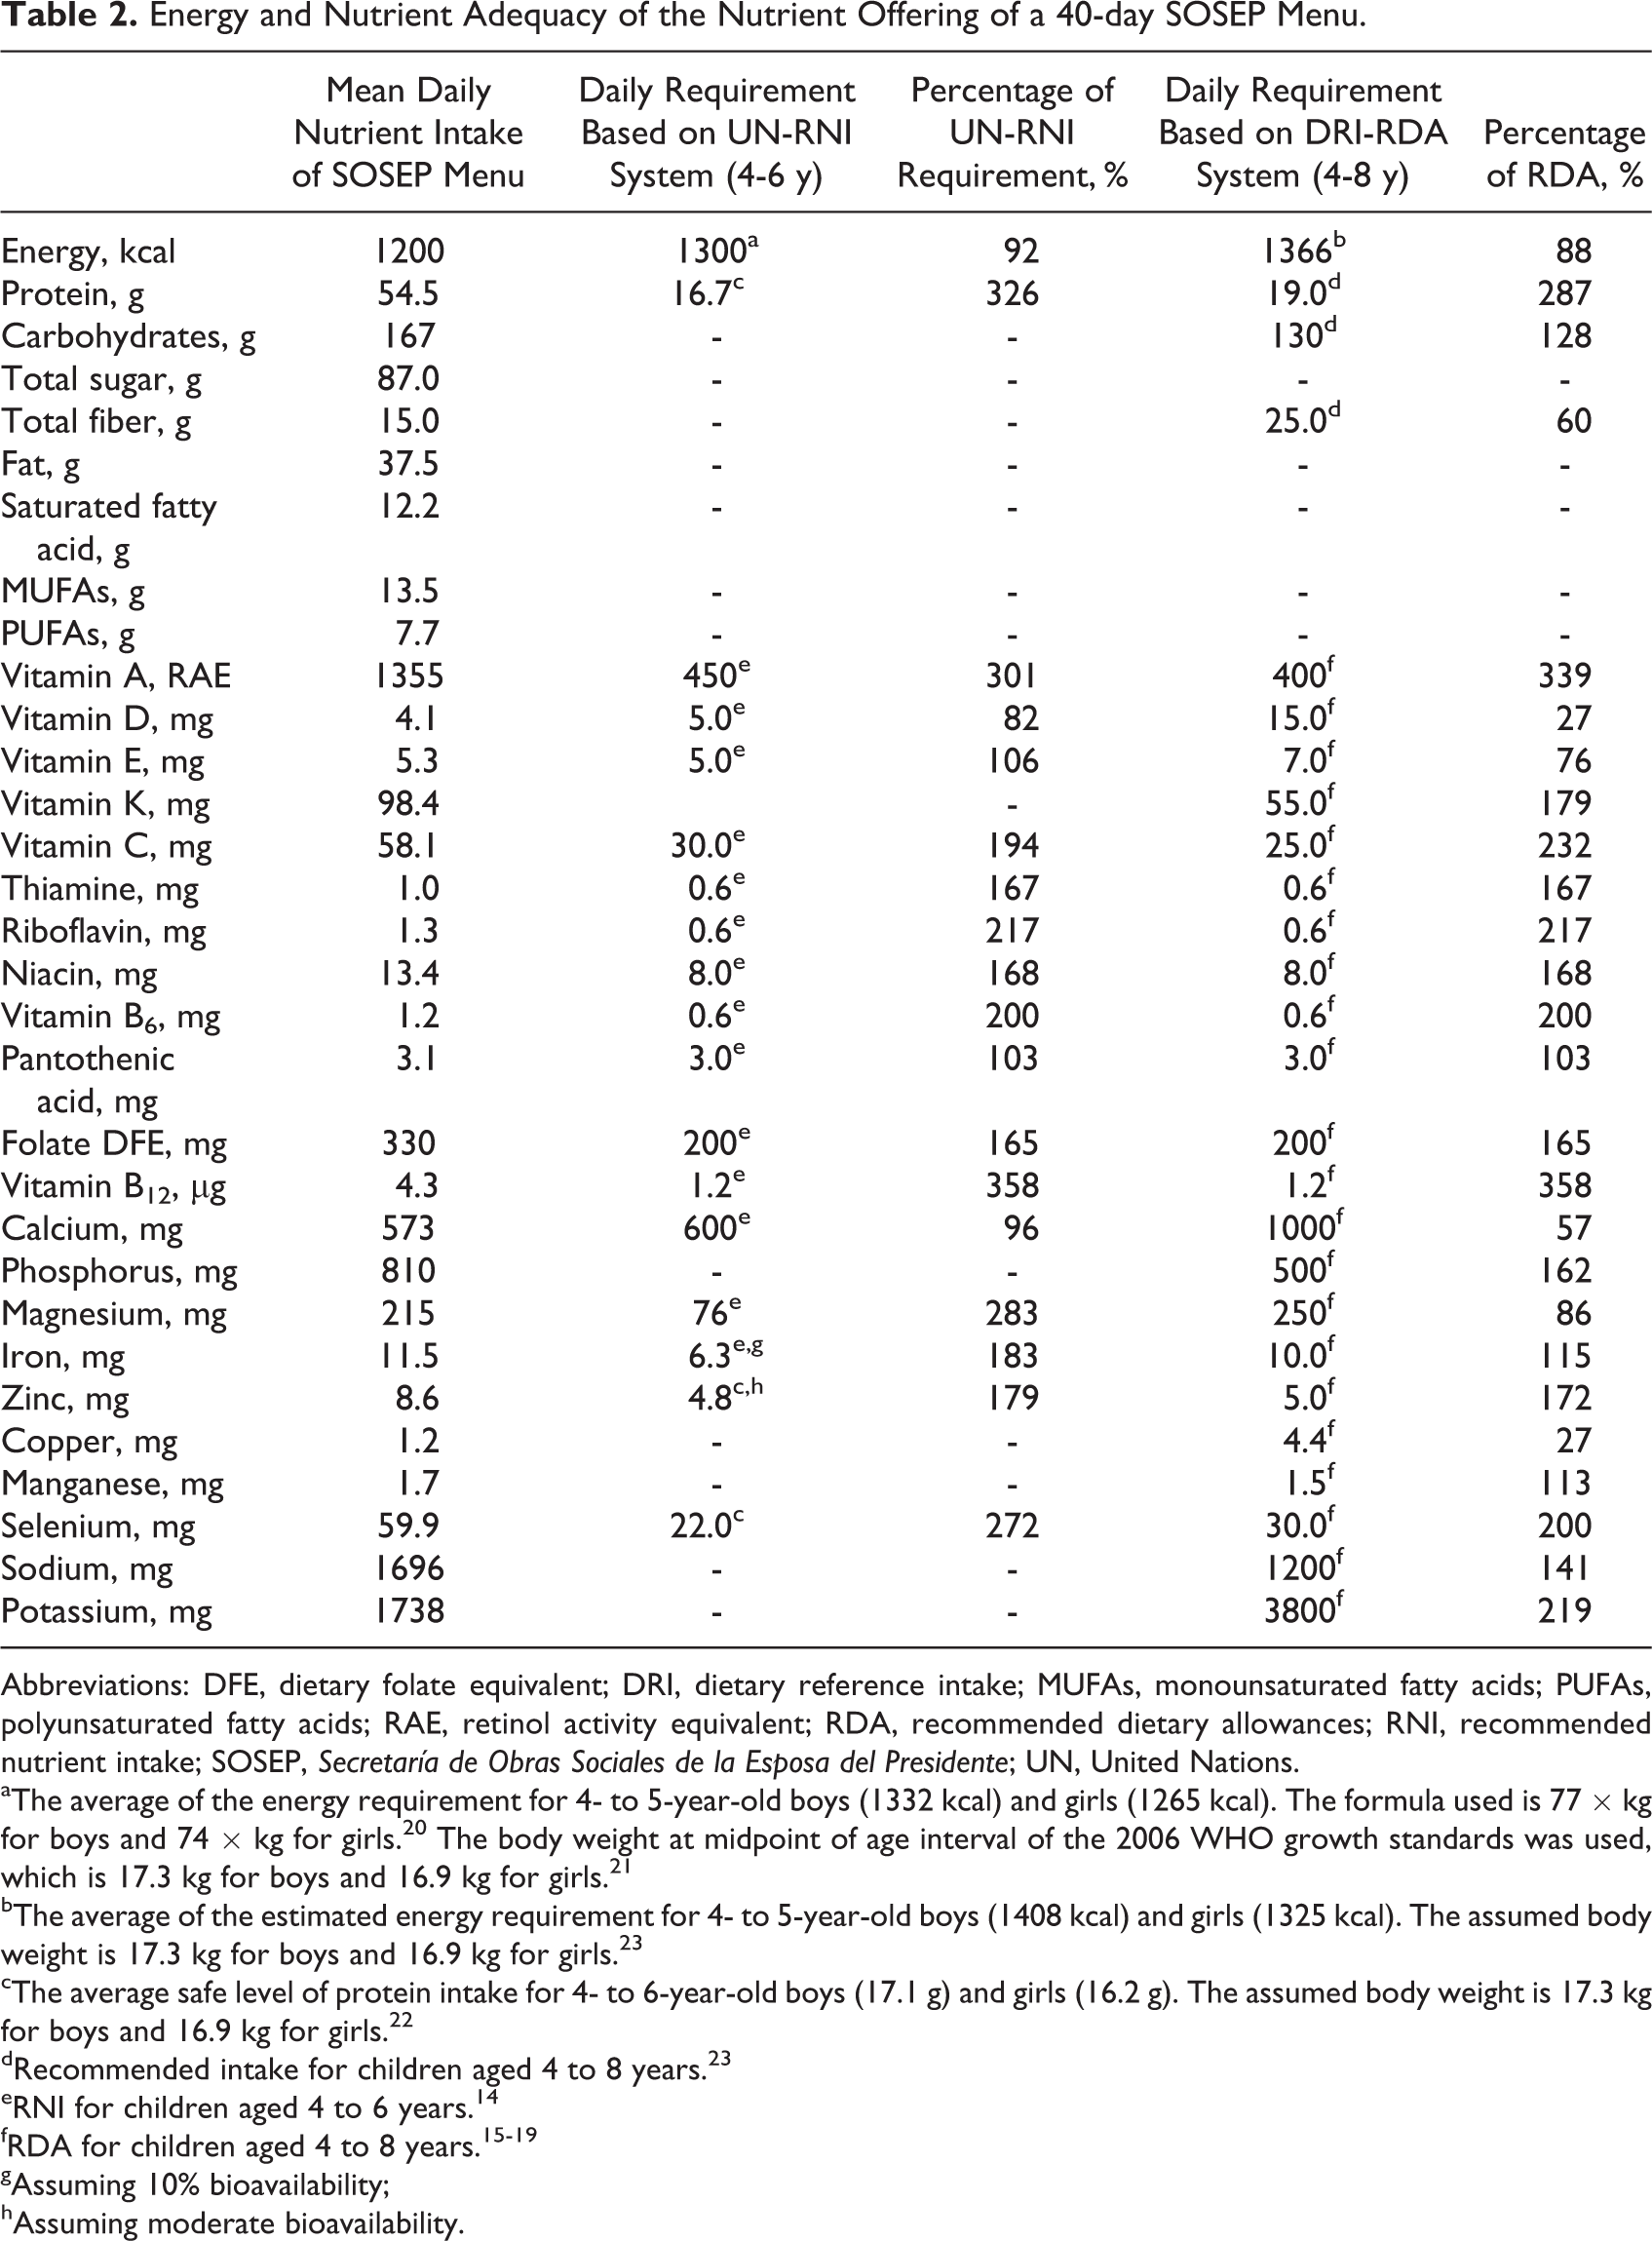
Abbreviations: DFE, dietary folate equivalent; DRI, dietary reference intake; MUFAs, monounsaturated fatty acids; PUFAs, polyunsaturated fatty acids; RAE, retinol activity equivalent; RDA, recommended dietary allowances; RNI, recommended nutrient intake; SOSEP, Secretaría de Obras Sociales de la Esposa del Presidente; UN, United Nations.
aThe average of the energy requirement for 4- to 5-year-old boys (1332 kcal) and girls (1265 kcal). The formula used is 77 × kg for boys and 74 × kg for girls. 20 The body weight at midpoint of age interval of the 2006 WHO growth standards was used, which is 17.3 kg for boys and 16.9 kg for girls. 21
bThe average of the estimated energy requirement for 4- to 5-year-old boys (1408 kcal) and girls (1325 kcal). The assumed body weight is 17.3 kg for boys and 16.9 kg for girls. 23
cThe average safe level of protein intake for 4- to 6-year-old boys (17.1 g) and girls (16.2 g). The assumed body weight is 17.3 kg for boys and 16.9 kg for girls. 22
dRecommended intake for children aged 4 to 8 years. 23
eRNI for children aged 4 to 6 years. 14
gAssuming 10% bioavailability;
hAssuming moderate bioavailability.
Estimated nutrient densities of the offering at the day care centers were compared to critical nutrient densities that whole diets would have to provide for requirements to be met (Table 3). As would be expected, density deficits remain for most nutrients that had gaps in meeting requirements (Table 2). Using the WHO system, it was found that only vitamin D has an observed density below the critical nutrient density. According to the IOM system, deficiencies are observed for fiber, vitamins D and E, calcium, magnesium, copper, and potassium.
Critical Nutrient Density in Relation to the Observed Nutrient Density of the Offering of a 40-day SOSEP Menu.
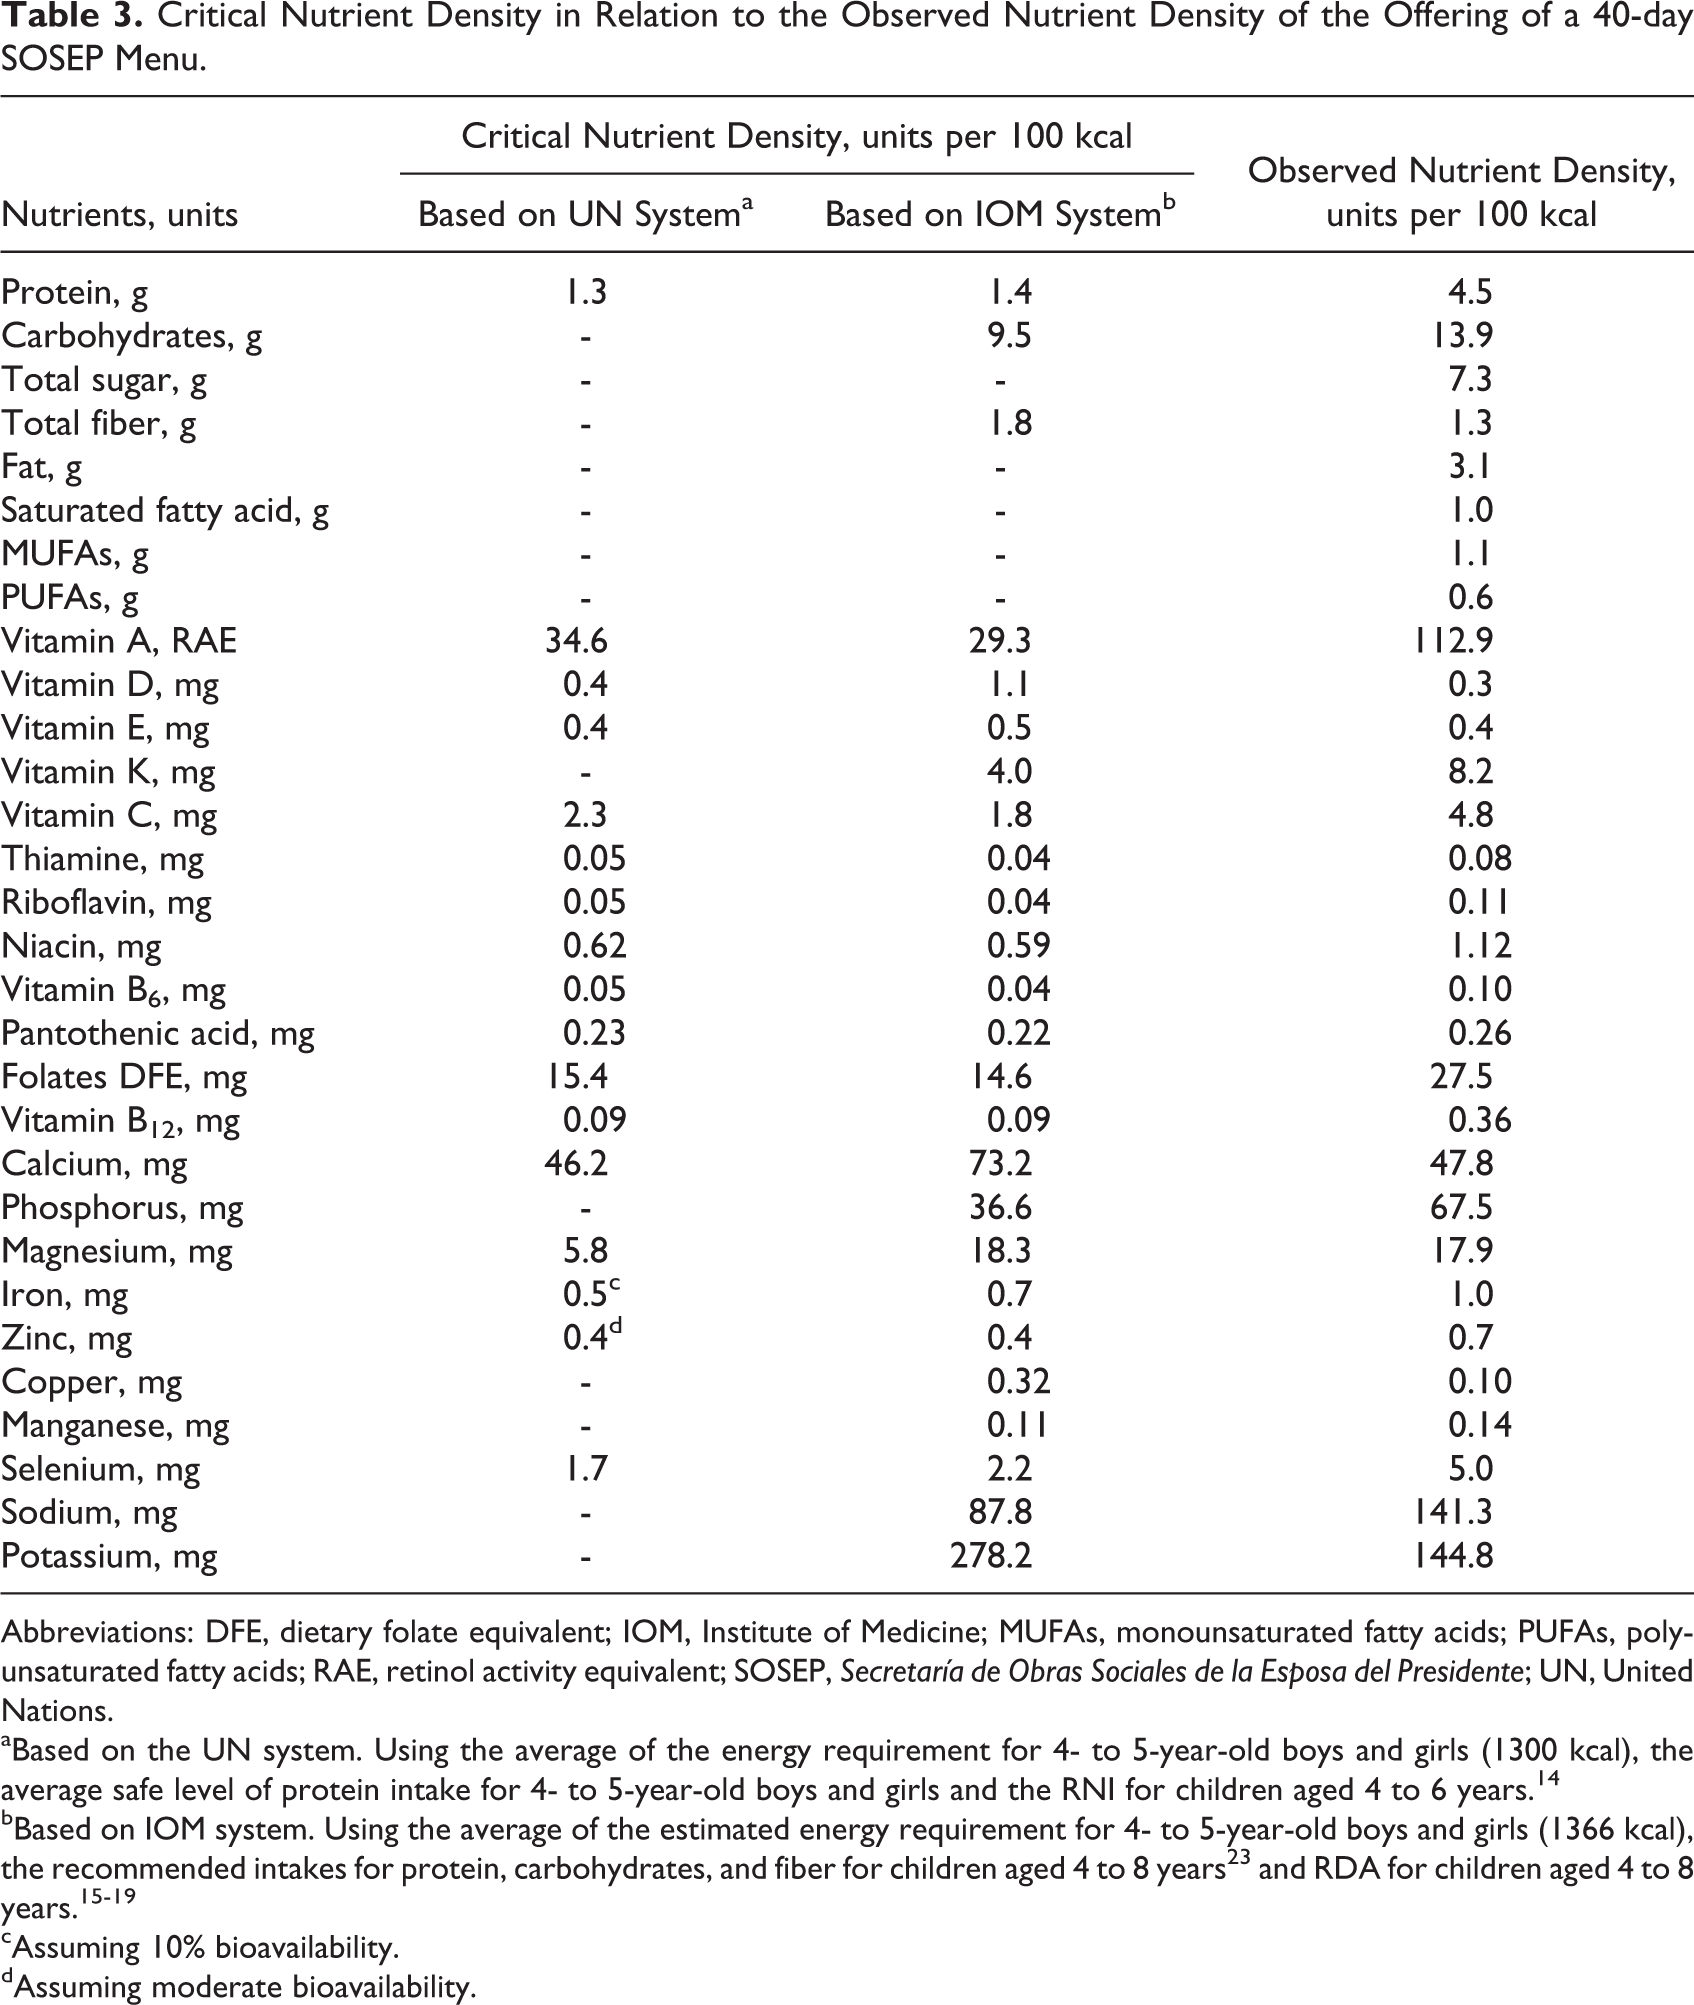
Abbreviations: DFE, dietary folate equivalent; IOM, Institute of Medicine; MUFAs, monounsaturated fatty acids; PUFAs, polyunsaturated fatty acids; RAE, retinol activity equivalent; SOSEP, Secretaría de Obras Sociales de la Esposa del Presidente; UN, United Nations.
aBased on the UN system. Using the average of the energy requirement for 4- to 5-year-old boys and girls (1300 kcal), the average safe level of protein intake for 4- to 5-year-old boys and girls and the RNI for children aged 4 to 6 years. 14
bBased on IOM system. Using the average of the estimated energy requirement for 4- to 5-year-old boys and girls (1366 kcal), the recommended intakes for protein, carbohydrates, and fiber for children aged 4 to 8 years 23 and RDA for children aged 4 to 8 years. 15 –19
cAssuming 10% bioavailability.
dAssuming moderate bioavailability.
Nutrient Excess in the Menu Offering
This rotating menu may be contributing to nutrient excess in one specific instance, that is, of preformed vitamin A. Food sources of provitamin A carotenoids cannot contribute to excess, and it is only vitamin A in its preformed (retinoid) presentation that can lead to adverse consequences. 18,31 The estimated mean intake is 1355 retinol activity equivalent (RAE)/day, with 1084 µg in the preformed state. The upper tolerable intake level (UL), as established by the IOM for the upper ranges of age of our day care center attendees, is 900 µg/day of preformed vitamin A. 18 Ten specific food and beverage items, comprising fortified foods and animal protein sources, provided virtually all the preformed vitamin A in the menu. Specifically, with respect to preformed vitamin A, the first 4 items—fortified sugar (51%), beef liver (20%), Incaparina® gruel (Alimentos, SA, Santa Catarina Pinula, Guatemala) (8%), and whole liquid cow milk (7%)—cumulatively accounted for 87% of the total 1084 µg. These 4 foods, moreover, contributed 69% of total dietary vitamin A (data not shown). Overall, provitamin A contributed only 20% of total vitamin A and preformed vitamin A contributed the remaining 80%.
Main and Leading Food Sources and Meal Times for Nutrients
Continuing with the focus on principal source begun in the previous paragraph, Table 4 lists, for each nutrient, the item on the rotating 40-day menu which made the single greatest relative contribution to the entire intake of the nutrient, along with the cumulative percentage it delivered. This is termed the “main” source and ranged from 63% for the first sources of vitamin K and total sugars, to 12% for vitamin B6 and 10% for that of iron. Of the 31 macro- and micronutrients of interest, only 11 different food items appeared as the main source. This included whole milk in the first place with 7 different nutrients. Black beans in second rank with 6 nutrients , with a tie at 4 nutrients for vegetable oil and granulated sugar. Thereafter, cooked chicken and beef liver covered 3 and 2 nutrients each. Finally, spinach, oranges, beef, Incaparina® gruel (Alimentos, SA, Santa Catarina Pinula, Guatemala), and table salt were the main source for 1 nutrient each.
First Leading Source of Energy, Macronutrients, and Micronutrients of the Offering of a 40-Day SOSEP Menu.
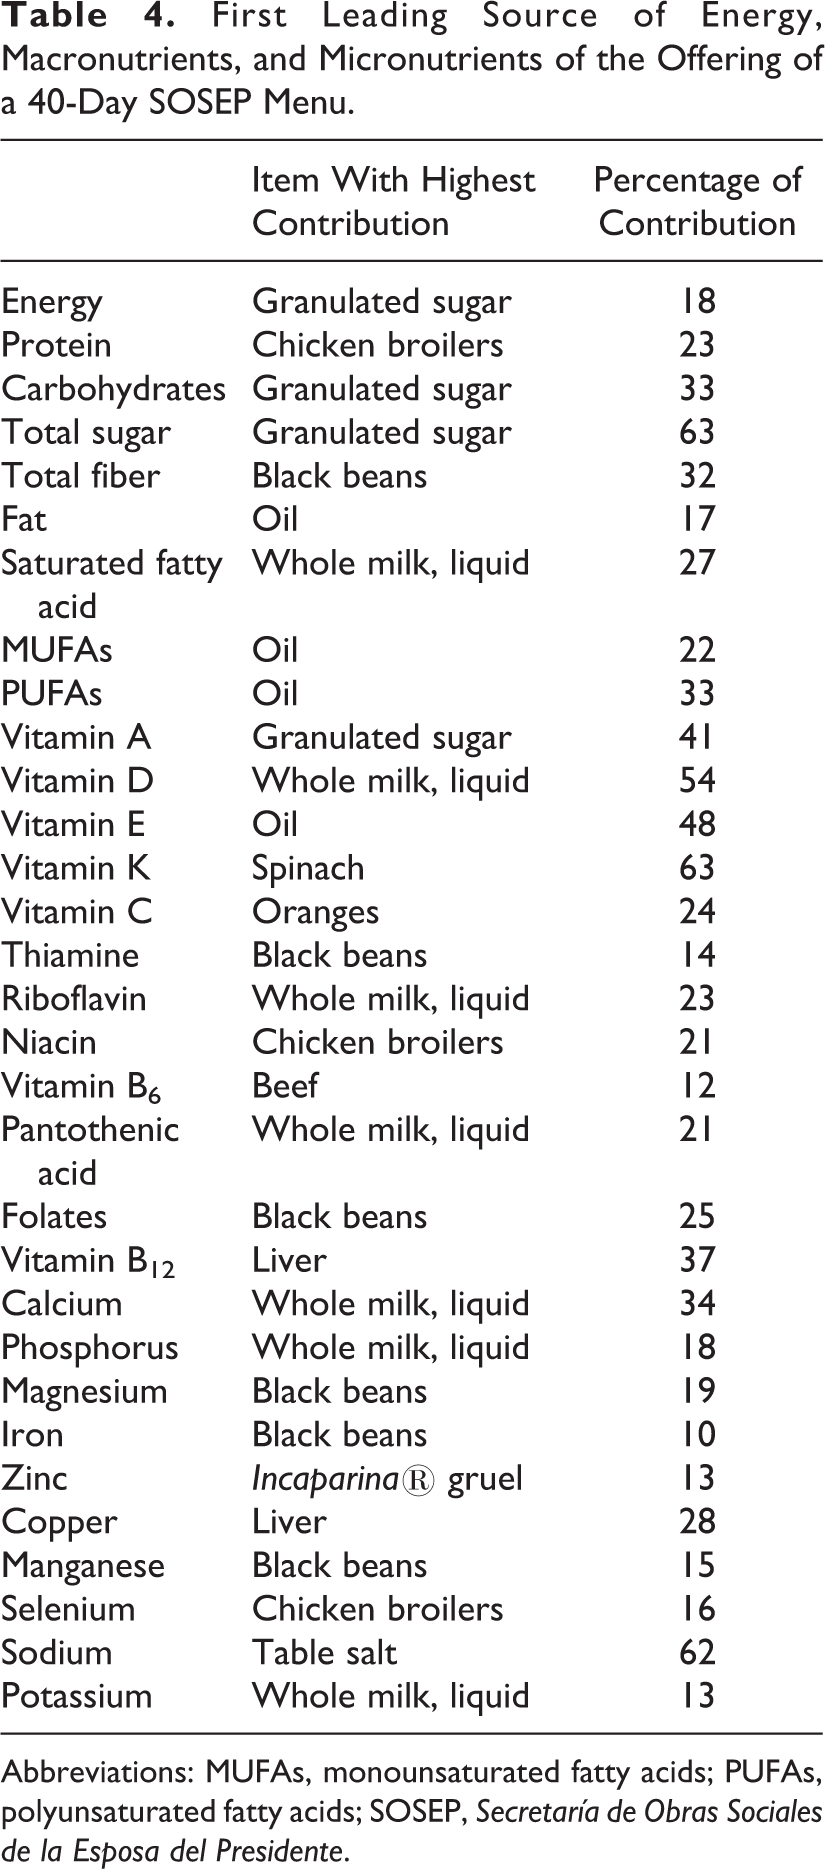
Abbreviations: MUFAs, monounsaturated fatty acids; PUFAs, polyunsaturated fatty acids; SOSEP, Secretaría de Obras Sociales de la Esposa del Presidente.
In Table 5, however, we have presented the 10 “leading” sources for dietary energy and protein, 5 illustrative vitamins, and 3 selected minerals. The first 2 leading sources accounted for over 50% of cumulative intake for vitamins D, E, and B12 and calcium. The top 10 sources accounted for from 62% of the cumulative total for energy to 99% for vitamin D. The other nutrient for which 10 dietary items accounted for over 90% of the total was vitamin B12.
Top 10 Sources of Energy and Selected Nutrients of the Offering of a 40-Day SOSEP Menu.
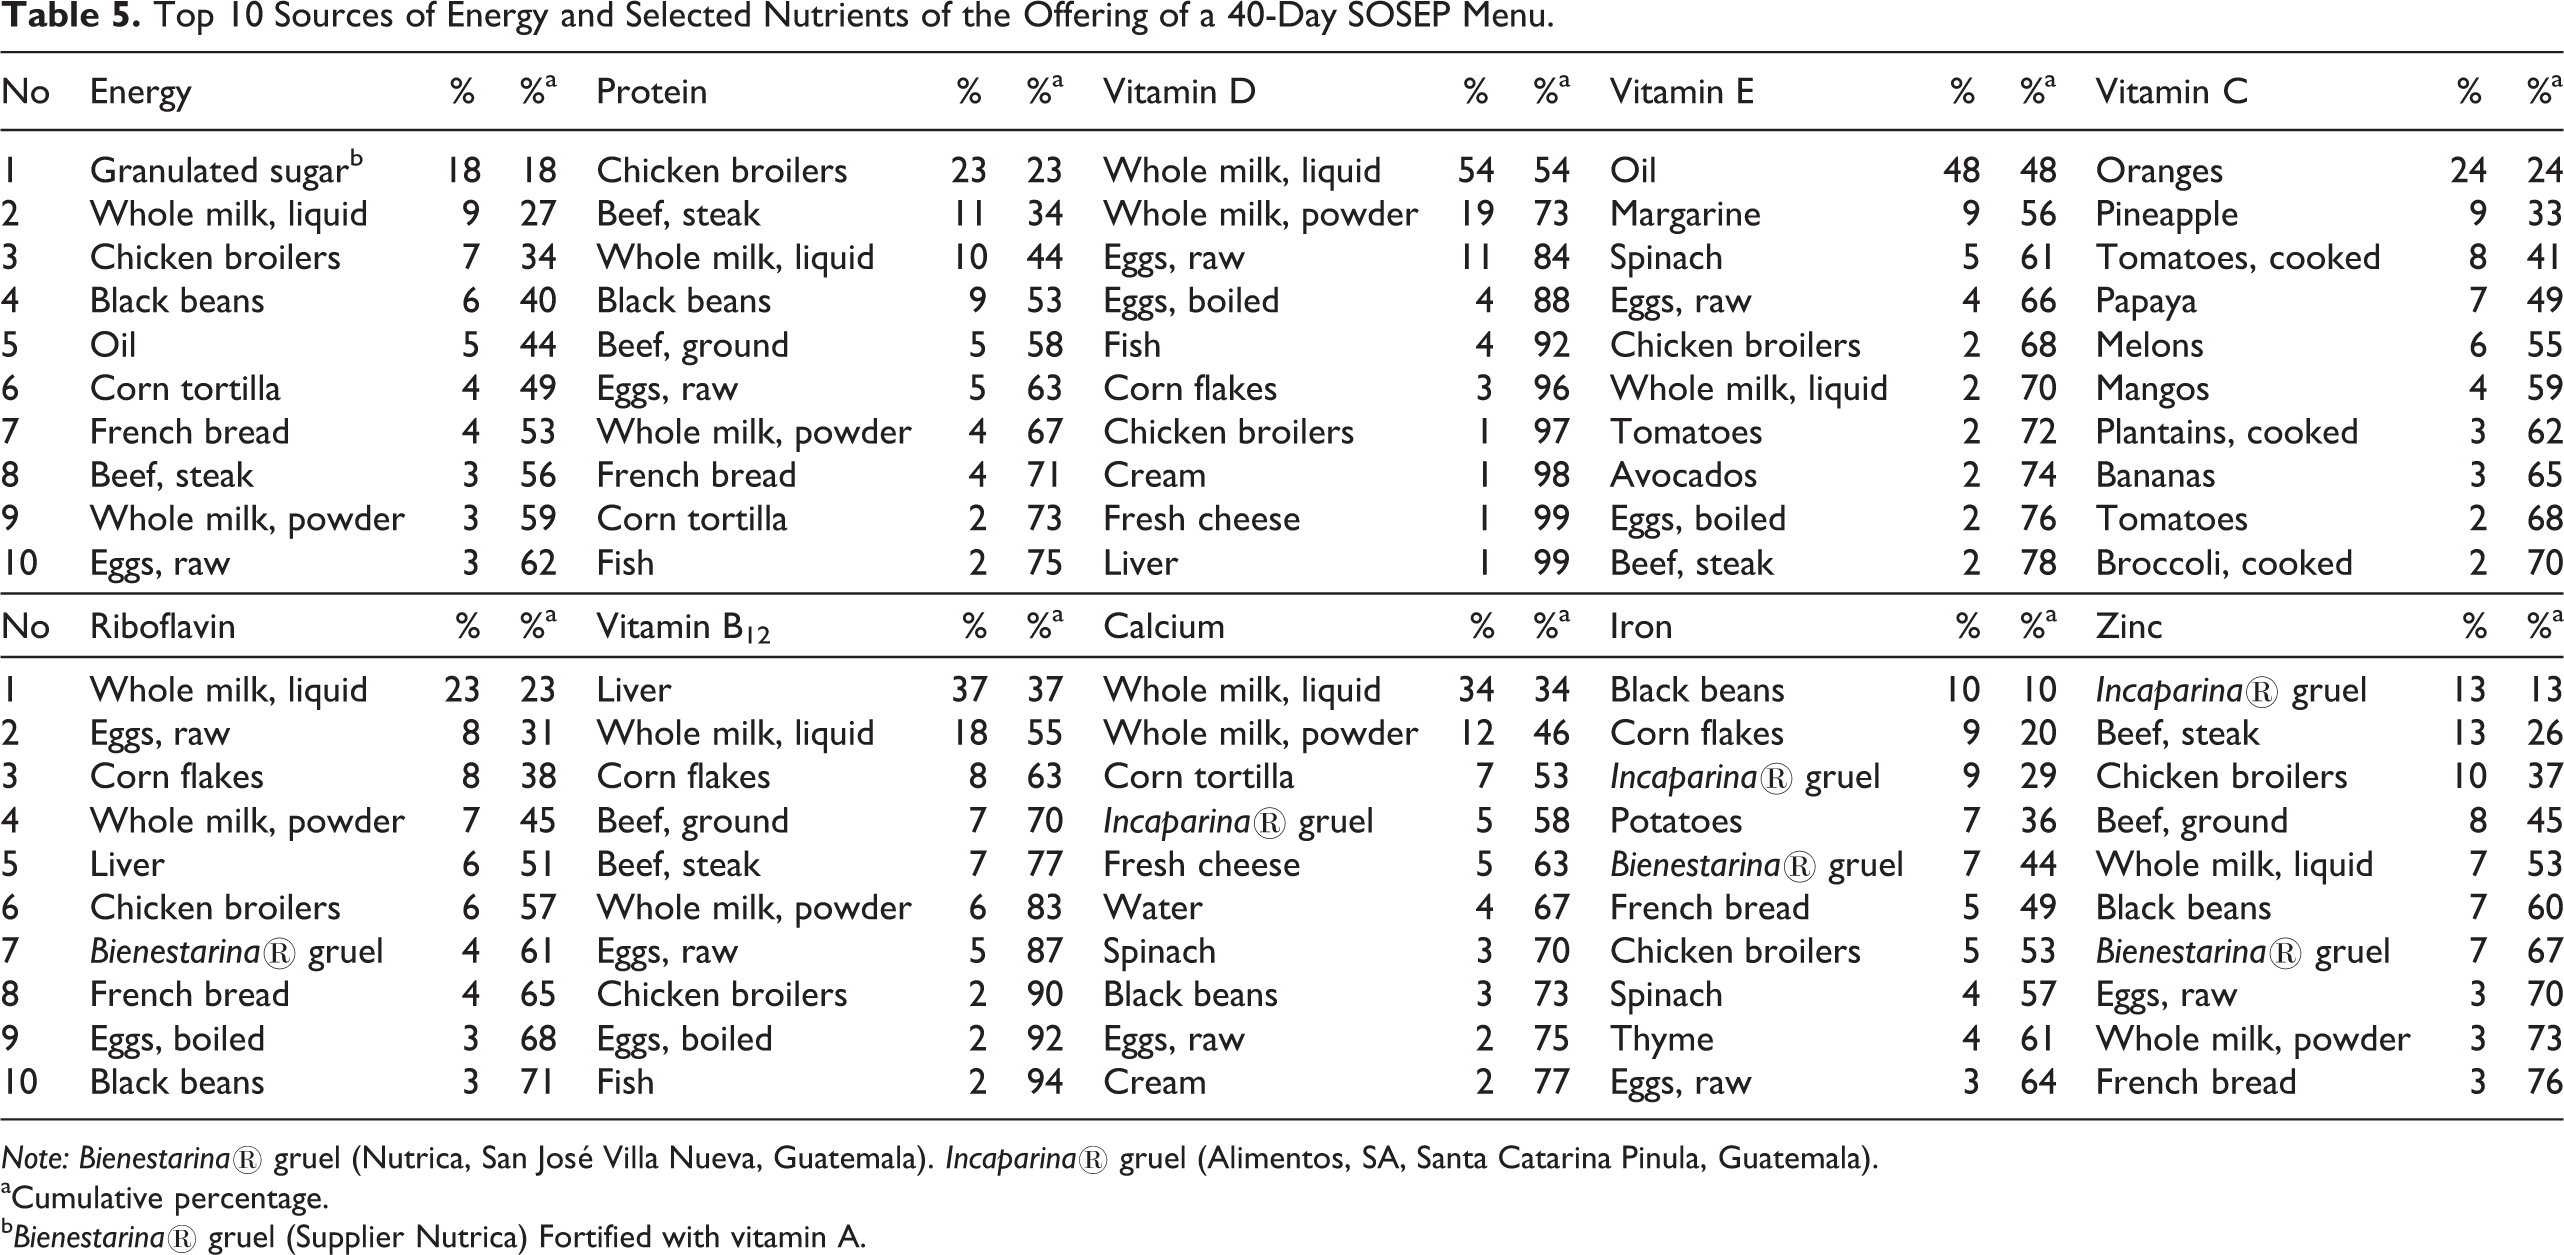
Note: Bienestarina® gruel (Nutrica, San José Villa Nueva, Guatemala). Incaparina® gruel (Alimentos, SA, Santa Catarina Pinula, Guatemala).
aCumulative percentage.
b Bienestarina® gruel (Supplier Nutrica) Fortified with vitamin A.
A further way of appraising the contributions of nutrients to the diet is to assess energy and nutrient intake for each specific meal. 30 Table 6 presents the partition of energy and nutrients among breakfast, lunch, and combined snacks. Lunch contributed just less than half (47%) of the daily energy provided by the SOSEP menu, more than 50% of the intake for 15 nutrients, and less than 50% of the intake for 16 nutrients. Lunch contributed almost all the daily vitamin K (96%) and a large proportion of sodium (72%) and vitamin E (72%). In contrast, vitamin D contribution from lunch was 13% and that of calcium, thiamine, sugar, and riboflavin was approximately one-third of the daily intake. Breakfast provided one-third (32%) of the daily energy and more than 50% of the intake for 3 of 31 nutrients. The contributions of vitamin D, riboflavin, calcium, thiamine, and folates were particularly important, whereas the contribution of vitamins K (2%) and C (6%) was negligible. Combined morning and afternoon snacks provided one-fifth (21%) of the daily energy and were not a main source (ie, >50% of daily intakes) of any nutrients. Snacks provided 41% of vitamin C, 38% of sugars, and 29% of carbohydrates.
Percentage of Contribution of Energy and Nutrient Offering of a 40-Day SOSEP Menu by Meal-Time.
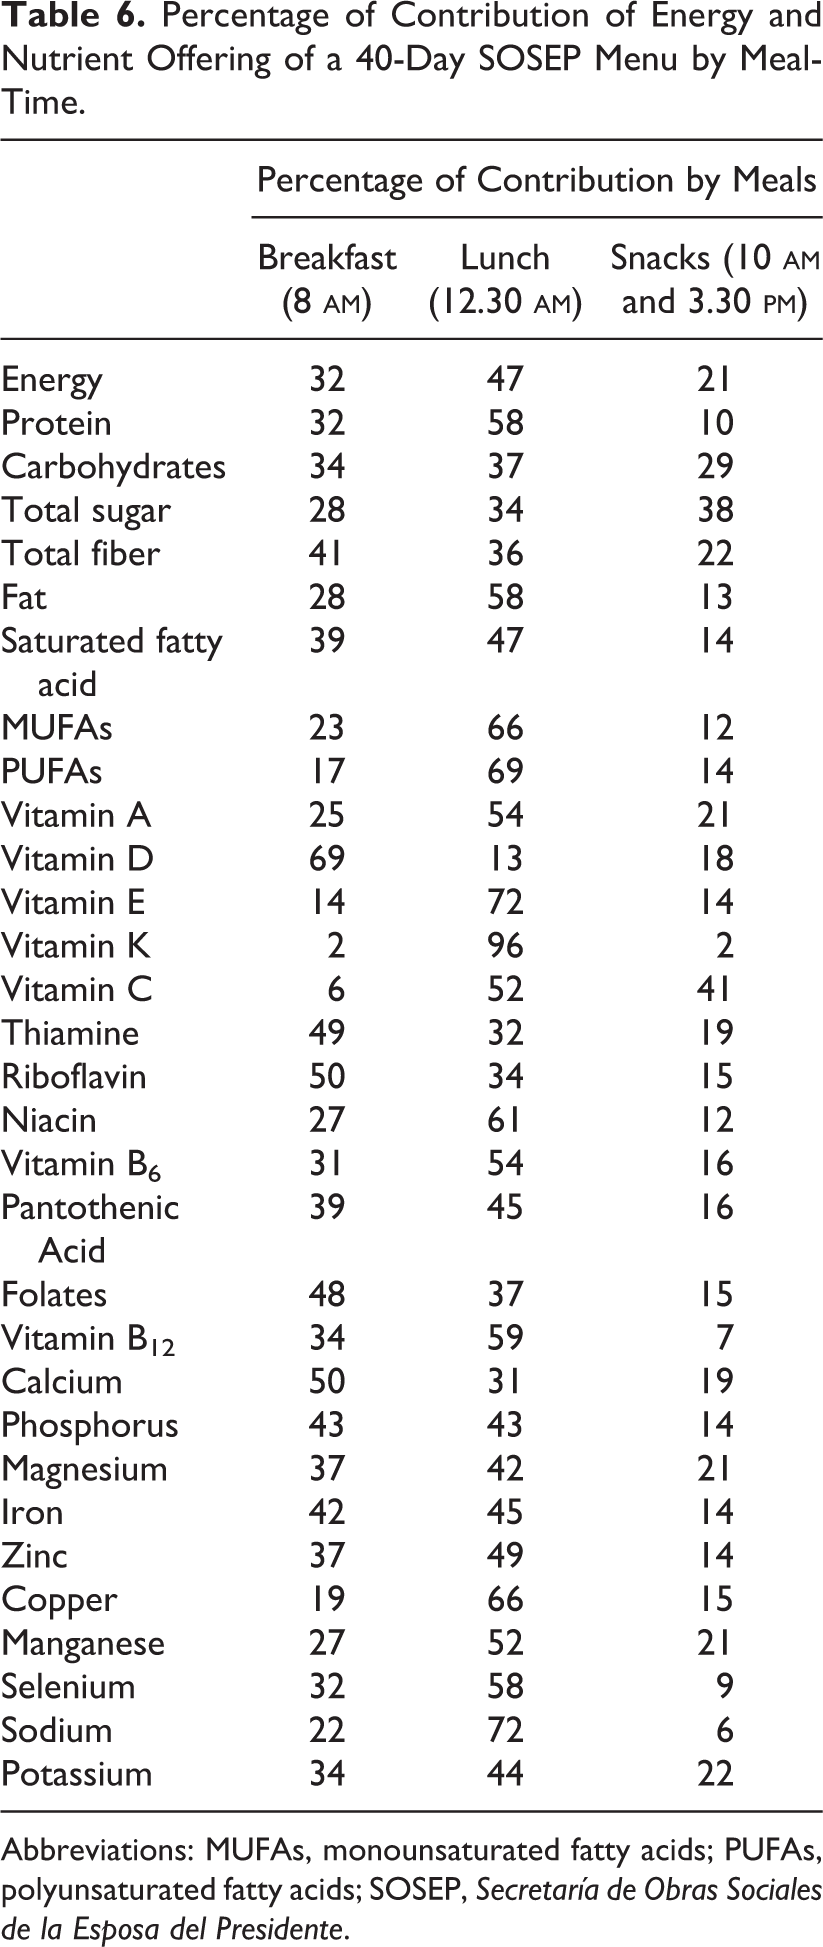
Abbreviations: MUFAs, monounsaturated fatty acids; PUFAs, polyunsaturated fatty acids; SOSEP, Secretaría de Obras Sociales de la Esposa del Presidente.
Discussion
Since food selection by or for young children has multiple implications for food safety, nutrient adequacy, 1,2 and the development of healthy eating habits, 32,33 a menu offering applied daily to thousands of Guatemalan preschoolers was inherently worthy of in-depth enquiry. Menu analysis, which requires no ethical approvals while fostering precision and exactness down to the level of food ingredients, has proven to be a useful tool for diverse applications, 34 –40 including those of our group in Guatemala. 9 –11
Adequacy of Nutrient Offering
The most appropriate manner to evaluate adequacy at a public health level would be using the estimated average requirement (EAR), which makes a series of assumptions about the appropriate distribution of nutrients around the median needs of a population 41 rather than the criteria—RNI or RDA—which cover almost all of the population. We justify our present approach based on both expedience and the nature of institutional feeding. Only the DRI, but not the United Nations (UN) system, has an official EAR on which recommendations are based. For the UN system, a partial proxy for EAR, retrofitted post hoc, exists, but it does not provide values for the age range of interest. 42 Moreover, the EAR assumes a variance in intake within the population. As discussed previously, 9,10 with a uniform and standard offering in an institutional setting, the prima facie intraindividual distribution is nil such that only the RNI and RDA are operative. Even with this higher requisite, the food and drink offered in the centers provide more than 100% for most age-specific macro- and micronutrient recommendations within the context of 88% to 92% of the energy needs for age. There are 7 exceptions on the RDA side and 2 regarding the RNI (Tables 2 and 3).
A much higher satisfaction of actual nutrient requirements for these 7 nutrients, moreover, may be achieved. Using a standard covering of over 90% of a normal population, most children in the SOSEP centers would be satisfying their specific individual needs at caloric intakes below the recommendation criterion. Moreover, even with respect to the RDA and RNI standards, there is still time and opportunity during the evening hours at home for consumption of additional snacks and meals. Unfortunately, we have no estimation of residual intake from which to estimate residual nutrient intakes over the course of the full 24 hours. In a prior study, 11 in a similar day care setting offering 3 institutional repasts, home feeding provided 48% of the daily energy intake and between 30% and 54% of daily nutrients. If at all this is replicated after school among the SOSEP beneficiaries, the small deficits in calcium, magnesium, vitamin E, and even dietary fiber may be made up at home.
In this respect, then, only copper and vitamin D, as viewed from a DRI perspective, would stand out as being likely to be consumed below the individual needs of a large number of the SOSEP beneficiaries. Clinical deficiency of copper is rarely manifested in individuals with an oral diet. 43 Vitamin D requirements can be met both from the diet and from solar exposure. Thus, not meeting the intake from the diet does not necessarily condemn an individual to risk of deficiency as long as appropriate daily sunning is undertaken at these tropical latitudes. Our group at CeSSIAM has documented subnormal vitamin D status in elderly Mayan Guatemalans 44 and have found high prevalence of “insufficient” and “deficient” circulating levels of vitamin D in 4 additional age-groups in Guatemala (Unpublished data: Noel W Solomons MD. 2012-2014). A review of data for Latin America and the Caribbean populations shows that the notion of vitamin D adequacy in the lower latitudes is more of an exception than a rule. 45
Despite limited resources, careful dietary planning has allowed the SOSEP menu offering to contribute to an exceedingly low probability that individual requirements will not be met for almost all nutrients, assuming the menu is adhered to the latter. By contrast, in other day care experiences in Guatemala, 10 much less of the daily needs are met by the offering in the residual intake.
Excessive Offering of Nutrients
Emerging out of the discovery of endemic hypovitaminosis A in Guatemala, Arroyave et al 46 devised a technique to fortify granulated table sugar with retinyl palmitate, with a recommended fortification level of 10 to 20 mg/kg. Although the prevailing enrichment level at consumption remained constant at ∼10 mg/kg during a 27-year period of continuous mandated fortification since 1992, sugar consumption, alone and in sweetened products, has risen in all segments of the Guatemalan population. 10,11,47 The estimated daily consumption of vitamin A in its preformed (retinoid) state of 1084 µg is problematic as it drives the total above the UL by 20%for children aged 4 to 8 years. For the younger attendees, the UL is 600 µg, 18 comprising an 81% excess. This present situation, however, is consistent with what was observed in our previous day care center studies in urban Guatemala in which dietary analysis in 4 day care centers revealed that preformed vitamin A offerings accounted for 26% to 71% of the total vitamin A intake. 10 The vitamin A intake exceeded the UL in 2 of the 4 centers examined. Further analysis of the total daily diet of children attending 2 day care centers revealed median daily vitamin A intakes of 1862 and 1227 RAE. 11 The table sugar–driven high intake of preformed vitamin A is a matter of public health concern.
As to a solution for the excess, the contribution of preformed vitamin A from liver has the additional context of liver’s important contributions of vitamin B12 and copper to the institutional menu. Clearly, some reduction in the consumption of granulated table sugar would be the most prudent solution to excessive preformed vitamin A offering.
Main Source and Leading Sources of Nutrient Intake
It is interesting to note the concentration of main sources among a cluster of certain foods and beverages. Only 11 different items were main sources for 31 nutrients, and all but 5 of these were sources for multiple nutrients, with whole liquid milk covering 7 specific nutrients. That salt was the main source of sodium at 62% and granulated sucrose was the first source of total sugars at 63% are not surprising. The other dominant source, with 63% of contribution, was spinach for dietary vitamin K. The remaining main sources governed only 54% to 10% of the total intake.
Similar analysis in 4 day care centers revealed that at least one-fifth and up to one-third of the total energy sources in a typical weekly menu were provided by the 2 top energy sources. 10 In one center (A), fruit juice was the top energy source, providing 17% of the total energy. For the 2 centers (C and D) with the lower offering of total daily energy, the first 10 contributing items constituted close to 100% of the all the nutrients provided. In contrast, in the other 2 centers (A and B), the 10 most contributory items accounted for less than 70% of energy and less than 80% of protein and carbohydrate sources.
Analysis of the sum of the diet in day care centers in addition to foods served at home showed that the top leading sources of energy and nutrients were remarkably similar for children attending day care centers that served several versus a single meal. 11 Milk powder and white sugar were the main sources of energy in the diet of the children attending both day care centers examined. Overall, for energy, niacin, iron, and zinc, the 10 leading food sources contributed less than 60% of their total intake, whereas for calcium and vitamin A, the top 10 sources provided more than 70%. Fortification is an important source of iron in this population.
The percentage of the total intake covered by the first 10 nutrients is a surrogate measure of dietary variety. Of the 10 nutrients selected for illustration (Table 5), only 2—energy and iron—still have 35% or more of the contribution to be made by other additional items beyond the top 10. For satisfying any given nutrient by this menu, the consumers are reliant on a specific set of items, but to cover the whole gamut of macro- and micronutrients in a food-based fashion, it requires numerous items from different food groups.
Partition of Offering Among Snacks and Meal Time and Drinks Versus Foods
Similar to the findings from previous studies done by our group, 9 –11,30 lunch was the main contributor of energy, macronutrient, and most micronutrients examined. By analyzing the 24-hour dietary intake of urban school children in Western Guatemala, it was found that the observed daily distribution of energy intake was 24% at breakfast, 30% at lunch, 23% at dinner, and 23% among snacks, 30 which is very similar to the observed distribution of the SOSEP menu. Lunch provided relatively more vitamin C and zinc, whereas breakfast led in terms of vitamins A and D, thiamine, riboflavin, folate, calcium, and iron. Snacks generally provide a relatively large amount of sugar, and the contribution of both intrinsic and added sugars from snacks in the SOSPE was 38%. As such, reducing the content of added sugar to snack provides an opportunity to decrease the total sugar intake.
Relative Magnitude of Day-to-Day Variance
For a menu, the 40-day nutrient means can be established by simple tabulation of each day in the rotation and divided by the total duration. The principle that variance of distribution of estimated nutrient intake declines as multiple daily estimates of intake are accumulated is not novel. 48 With 40 days of daily offerings, we could more systematically examine the operation of this principle. As would be expected, the CV diminishes markedly, up to 69.3% with thiamine and 72.3% with vitamin C. Among the 27 remaining nutrients of interest, the week-to-week CV shrank by at least 50% compared to the day-to-day CV, except for 6 nutrients: energy, saturated fatty acids, vitamin K, magnesium, zinc, and potassium.
Strengths and Limitations
This inquiry was undertaken by investigators versed in the assessment of nutrient offerings in institutional settings, this time using a permanent and preestablished rotation of meals and snacks over a period of 8 weeks. To the degree accuracy is maintained in the calculations and the reasonable fidelity in the food composition assumptions for the international database to the true conditions across Guatemala, a valid estimation of daily, weekly, and cumulative offering can be made. The limitations, however, are the assumptions needed to be invoked in reference to offering versus actual intake. It is one thing to prepare foods and dish them onto serving ware, and another that they be totally consumed without spillage or plate waste. For that reason, we have consistently used the term “offering” rather than “intake” or “consumption” and admit that we are commenting on the ideal scenario, which may differ markedly in operative practice at the level of individual centers. While the framework of EAR is most appropriate for population assessment, the lack of variance in the offering and the absence of EARs for the UN system force reliance on recommendations covering most of the population.
Conclusion
Within an environment of budgetary constraints, inherent in governmental financing, the SOSEP has developed and advocated an exemplary menu offering for children in the vulnerable preschool period. We have demonstrated that, if prepared and served as planned, the items from the official, standard rotating menu would supply most of the nutrients needed to cover the requirements of all but 2.5% of preschool-aged children, even before considering additional consumption in the homes. High vitamin A intake related to the mandated national fortification problem is a potential problem. From the analysis, it was found that vitamin D emerges as the most prominent candidate for a problem nutrient of deficient intake.
Footnotes
Authors’ Note
MV participated in the conception and design of the study, obtaining funding, supervision of students, analysis and interpretation of data, and drafting of the manuscript. LH, GMB, and MJSM participated in the supervision of students, analysis and interpretation of data, and critical revision of the manuscript. OIB participated in the conception and design of the study, interpretation of data, and critical revision of the manuscript. NWS participated in the conception and design of the study, obtaining funding, supervision of students, interpretation of data, and drafting of the manuscript.
Acknowledgments
We thank Matilde de la Cruz and the personnel from the Community Homes of SOSEP.
Declaration of Conflicting Interests
The author(s) declared no potential conflicts of interest with respect to the research, authorship, and/or publication of this article.
Funding
The author(s) disclosed receipt of the following financial support for the research, authorship, and/or publication of this article: Financial support was obtained from the Hildegard-Grunow-Foundation for Nutrition Research.