
Abstract
Background:
Tibial torsion is a twist in the tibia measured as an angle between a proximal axis line and a distal axis line. Abnormal torsion has been associated with a variety of painful clinical syndromes of the lower limb. Measurements of normal tibial torsion reported by different authors vary by 100% (ranging from 20° to 42°), making it impossible to determine normal and pathological levels.
Purpose:
To address the problem of unreliable measurements, this study was conducted to define an automated, validated computer method to calculate tibial torsion. Reliability was compared with current clinical methods. The difference between measurements of torsion generated from computed tomography (CT) and magnetic resonance imaging (MRI) scans of the same bone, and between males and females, was assessed.
Study Design:
Controlled laboratory study.
Methods:
Previous methods of analyzing tibial torsion were reviewed, and limitations were identified. An automated measurement method to address these limitations was defined. A total of 56 cadaveric and patient tibiae (mean ± SD age, 37 ± 15 years; range, 17-71 years; 28 female) underwent CT scanning, and 3 blinded assessors made torsion measurements by applying 2 current clinical methods and the automated method defined in the present article. Intraclass correlation coefficient (ICC) values were calculated. Further, 12 cadaveric tibiae were scanned by MRI, stripped of tissue, and measured using a structured light (SL) scanner. Differences between torsion values obtained from CT, SL, and MRI scans, and between males and females, were compared using t tests. SPSS was used for all statistical analysis.
Results:
When the automated method was used, the tibiae had a mean external torsion of 29°± 11° (range, 9°-65). Automated torsion assessment had excellent reliability (ICC, 1), whereas current methods had good reliability (ICC, 0.78-0.81). No significant difference was found between the torsion values calculated from SL and CT (P = .802), SL and MRI (P = .708), or MRI and CT scans (P = .826).
Conclusion:
The use of software to automatically perform measurements ensures consistency, time efficiency, validity, and accuracy not possible with manual measurements, which are dependent on assessor experience.
Clinical Relevance:
We recommend that this method be adopted in clinical practice to establish databases of normal and pathological tibial torsion reference values and ultimately guide management of related conditions.
Tibial torsion refers to the twist within the tibia about its longitudinal axis, reflecting the relationship of the distal and proximal ends of the bone.22,52 The normal torsion is in an external direction from proximal to distal and has been found to increase with age until maturity. 22 Accurate measurement of torsion in the axial plane is necessary to determine the presence and extent of deformity and, where indicated, to direct clinical decision making and intervention. Abnormal torsion of the tibia (either increased or decreased) is a pathological presentation that has been related to patellofemoral instability, 48 Osgood-Schlatter disease, 49 and congenital talipes equinovarus (clubfoot) 35 and has been identified in cases of malunited tibial fracture. 12
Accurate and repeatable measurements are essential in orthopaedics to ensure optimal, standardized, and clinically reasoned patient management. Since first described by Le Damany in 1903, 52 tibial torsion has been assessed using a range of methods. Although computed tomography (CT) is the recognized gold standard for measurement,1,16,44 concerns regarding exposure to radiation have led to the exploration of less invasive approaches. These include clinical,29,45 motion capture, 1 ultrasound, 3 digital inclinometer, 46 and fluroscopy 4 methods. However, these methods have significant limitations, and none provides valid and reliable torsion measurement comparable with CT.1,3,4,24 Magnetic resonance imaging (MRI) offers a nonionizing, radiation-free option from which values equivalent to those derived from CT have been reported for tibial torsion assessment when the same anatomic reference lines are applied. 30 This offers significant potential because contrasts between bone and soft tissue improve on MRI, giving more certainty to bony contours and landmarks, meaning normative data could be collected from healthy individuals, in particular young patients, without concern for radiation exposure. 30
To date, no anatomic tibial reference lines reported to assess tibial torsion have gained universal clinical agreement, meaning there is no consistency in current measurements.47,48 Consequently, “normal” values of tibial torsion among the population are unknown. Hence, there is no reference against which to compare values from pathological tibiae thought to be caused by abnormal limb torsion.19,48 In addition, because both lower limbs often are affected, a normal reference value from the opposite side is typically not available. 7 Therefore, current corrective derotation osteotomy procedures lack a standard reference and, rather than being based on science, are largely dependent on the experience of the operating surgeon.47,48 This must be addressed to improve clinical outcomes and promote understanding in this complex field.
Noninvasive methods to assess tibial torsion, although convenient and inexpensive, are highly inaccurate due to their subjectivity.3,29,45,46 A validated and repeatable method to assess tibial torsion using CT or MRI is lacking and must be generated.19,48 Ideally, such a method should ensure time efficiency for busy clinical settings, 27 minimize the high error associated with manual measurements,6,43 and permit the generation of large, comparable data sets of normative and pathological alignment worldwide. The first aim of the present article is to define a reliable and clinically reasoned method for the calculation of tibial torsion that is automated, removing the potential for human error. This measurement will be validated by comparing CT and MRI measures with those taken directly from cadaveric bones. A second aim is to report the reliability of this novel method and compare it with currently applied measurement methods.16,34 Third, measurements of torsion generated by the automated method from CT and MRI scans of the same bone will be compared. Fourth, tibial torsion values from a database of CT images from cadaveric bones and patients will be reported and values of males and females compared.
Methods
Defining a Method for Tibial Torsion Assessment
To develop a valid method to assess tibial torsion, a stepwise approach was applied, identifying potential errors occurring at each stage of analysis and implementing methods to mitigate these.
Image Segmentation, 3-Dimensional Bone Reconstruction, and Image Conversion to a Set of Point Coordinates
Bone torsion is quantified as the angle between 2 intersecting reference lines through bone in the transverse plane. Each of these lines is formed by connecting 2 points that exist in 3-dimensional (3D) space (ie, the traditional distal reference line for tibial torsion is the line connecting the points defined as the most medial prominence of the medial malleolus and the most lateral prominence of the lateral malleolus). Accurate, consistent determination of the position of these individual points is therefore critical to consistently define torsion angle. Taking these measurements from MRI or CT slices means that these points are determined in 2 dimensions (2D); consequently, the complexity of the bone is reduced and details are lost (Figure 1). Valid and repeatable bone torsion measurements cannot be determined from a 2D scan, and therefore 3D bone reconstruction is the first, essential step for accurate torsion assessment.
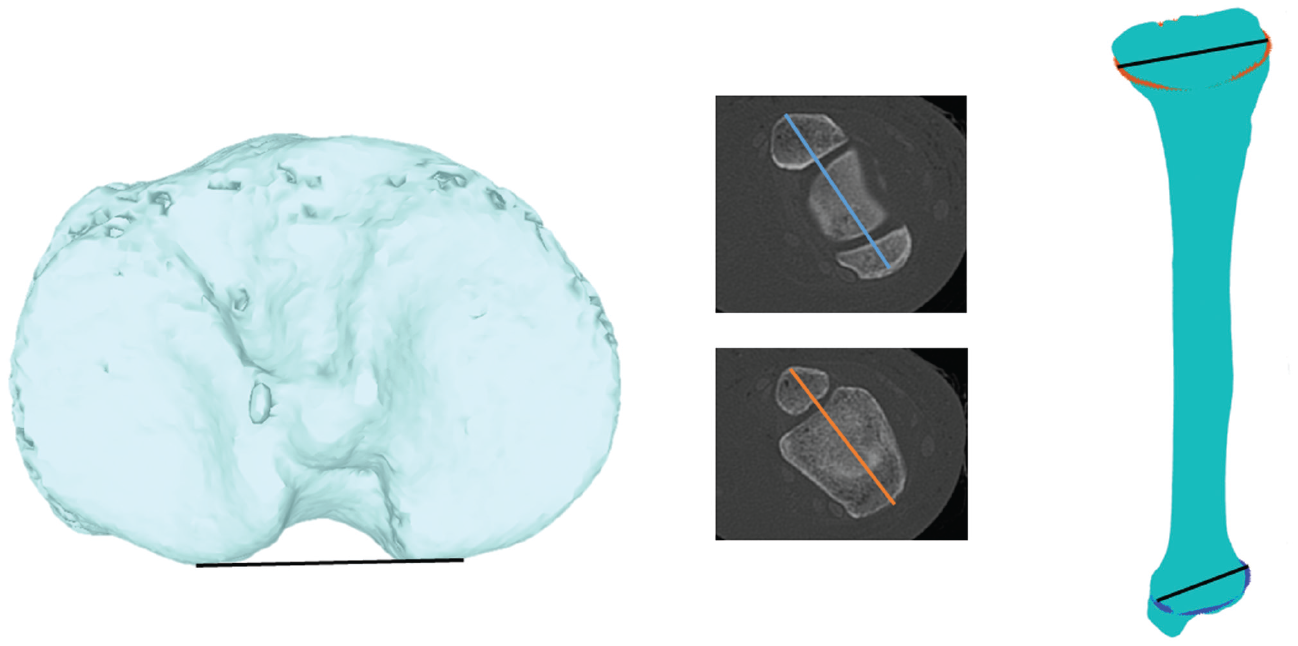
Commonly used measurement methods for the tibia. Left image shows a common reference line along the posterior tibial plateau. Middle images show the range of slice levels applied in the literature, with the resulting variety of angles generated depending on the selected slice evident. Right image shows the proposed method based on numerically computing the 3-dimensional coordinates of the line connecting the widest aspects of the proximal and distal tibia.
Bone reconstruction ensures that the most relevant slice from which to take the measurement is consistently selected. This is critical; for example, in the femur, variation in torsion angles of up to 13° (depending on slice level) have been reported compared with 3D measurements taken from reconstructed bone models. 43 Further, 3D models mitigate concerns regarding the alignment of the patient in the scanner. Because CT and MRI obtain slice images through the bone, the angle of the bone in relation to the beam of the scanner (as dictated by the patient position in the scanner) at the time of imaging significantly affects axial and therefore torsion assessment, because it results in the use of bone slices that are not truly perpendicular to the long axis of the bone but, rather, oblique to it (eg, if the limb is slightly flexed) (Figure 2), leading to inaccuracies. This phenomenon particularly affects axial measurements. We identified this in a series of pilot scans. This phenomenon can be addressed by reconstruction of bones in 3D, using widely available software, which was the first essential step to ensure that valid measures of torsion were obtained.
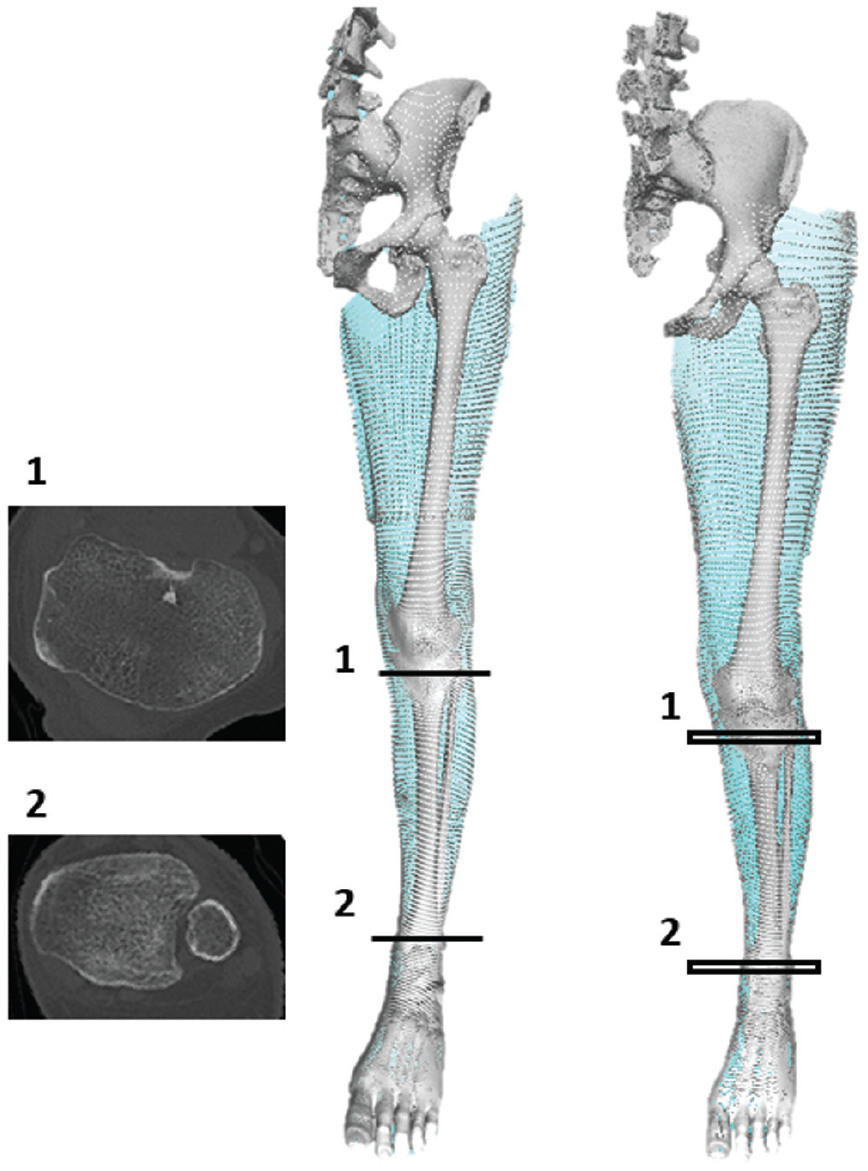
Torsion in the tibia is measured by the angle between the proximal and distal transverse axes. It is evident that if the patient is not lying with the limb completely straight (right image with flexed knee) in the scanner, then the slice scanned (1, 2) is not perpendicular to the long axis of the tibia, and the measured values of torsion will be inaccurate. To avoid this potential error, bones should be reconstructed 3-dimensionally and relevant slices then selected from the bone models from which to calculate torsion.
Once reconstructed in 3D, the bone must be aligned to an axis from which perpendicular slices are taken at the relevant levels in the bone. Traditionally, this has been performed with the use of bony landmark references in accordance with the International Society of Biomechanics method. 53 Typically, this is done manually, requiring the assessing clinician to select a series of local bony landmarks from which to standardize bone alignment. However, manual selection of tibial landmarks is known to introduce errors that will compromise intra- and interrater reliability, because unpredictable human error and arbitrary choices are introduced.6,41 This must be avoided to ensure consistent measurements. Therefore, for the new measurement presented in this article, we applied a standard method to create a reference frame for the bone slicing. This is based on principal components analysis of bone scans (CT and MRI), a standardized method enabling the bone to be aligned in relation to the variation in its geometry. 20 This was performed automatically using a custom written Matlab (The MathWorks) software.
Once the bone was reconstructed and aligned in 3D, specialized software was used to transfer the outline and surface markings of the bone to a set of point coordinates, each appearing as a point in space (Figure 3). 15 The points each had 3 coordinates in space and represented a large number of reference points from which the ends of the torsion axis lines could be measured. Because there are many of these points on the tibia, once generated they were described as a “cloud” of points. The more points there were, the more accurate the measurement of torsion became because the reference points for tibial torsion can be calculated only from the points. Thus, the more gaps between the points, the less accurate was the measurement. The number of points generated was determined by the scan quality: Improving scan quality for MRI requires a longer scanning time (introducing increased cost and the concern that patients will move and thereby distort images) and for CT requires higher doses of radiation, neither of which practice is favorable. To mitigate this, the resolution of the scan was enhanced by applying a midpoint subdivision filter, resulting in a greater number of points to process (up to 4 times as many coordinates per scan) (Figure 3) 11 ; this increased the overall accuracy and reliability of the measurement without any inconvenience, cost implications from longer scanning periods, or risk to the patient. From this, the relevant level was determined by automatically calculating the slice in the proximal 20% of the tibia with the greatest cross-sectional area and the same for the distal slice. This provided a more standardized approach compared with taking slices a standard distance from the proximal or distal bone end; the latter practice would be significantly affected by the length of bone, leading to unpredictable variability depending on individual height. 5
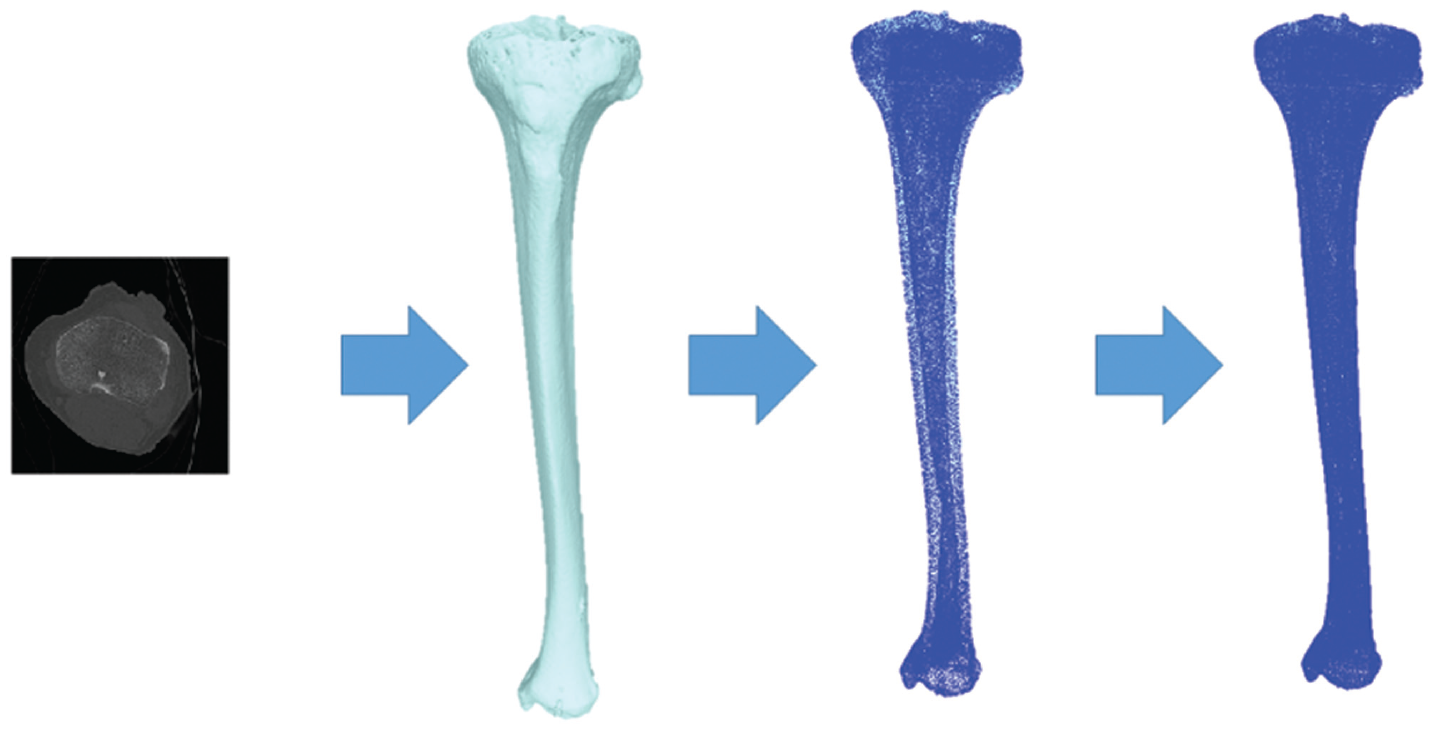
First (leftmost) image shows segmentation of the tibia from the computed tomography scan, used to reconstruct the tibia 3-dimensionally (3D) (second image). This 3D-reconstructed surface marking of the tibia is then converted to a “cloud” of individual points—coordinates in space (third image). Finally, the number of points in the cloud is increased by applying a midpoint subdivision filter, significantly increasing the number of points and resulting in very few spaces between the points. This is seen in the fourth image, where the bone appears almost as a solid in 3D, again due to the increase in the number of points.
Fully automated software was developed to complete the above process, allowing accurate, consistent, and automatic application of numerical methods to determine the 4 points in 3D space from which the proximal and distal axes of tibial torsion were defined.
Determination of Reference Points for the Proximal Tibial Axis
It has been proposed that because the primary reason for assessing tibial torsion is often to compare the knee joint flexion-extension axis with the ankle flexion-extension axis, the flexion-extension axis of the knee joint would be a logical proximal reference line.22,34 However, this axis lies within the femur. 10 To be consistent and accurate, bone torsion should be assessed and referenced only in relation to landmarks on the bone concerned, thereby ensuring that the measurement is independent of joint rotation that occurs between bones and distorts measurements—in this case, the femur and tibia. 17 The proximal dorsal aspect of the tibial condyles has also been referenced.18,39 However, this method can be challenging to apply accurately and consistently because these bony landmarks are not typically well-delineated on CT or MRI. An alternative, which involves fitting concentric circles to the tibial plateau to provide 2 circle centers to join as an axis, 5 is also flawed because the lateral plateau rarely has an arc of a circle as contour, and so a circle cannot be accurately applied to this contour. 19 Alternative methods considering tibial bone parameters have applied an ellipse to the proximal tibia, 36 which does confer a superior fit to circles. Therefore, to determine the proximal reference for tibial torsion in the protocol presented in this article, the software determined the proximal tibial slice with the greatest cross-sectional area and automatically fitted an elliptical shape to the outline (Figure 4). The major axis was taken to be the widest medial and lateral points of this ellipse.
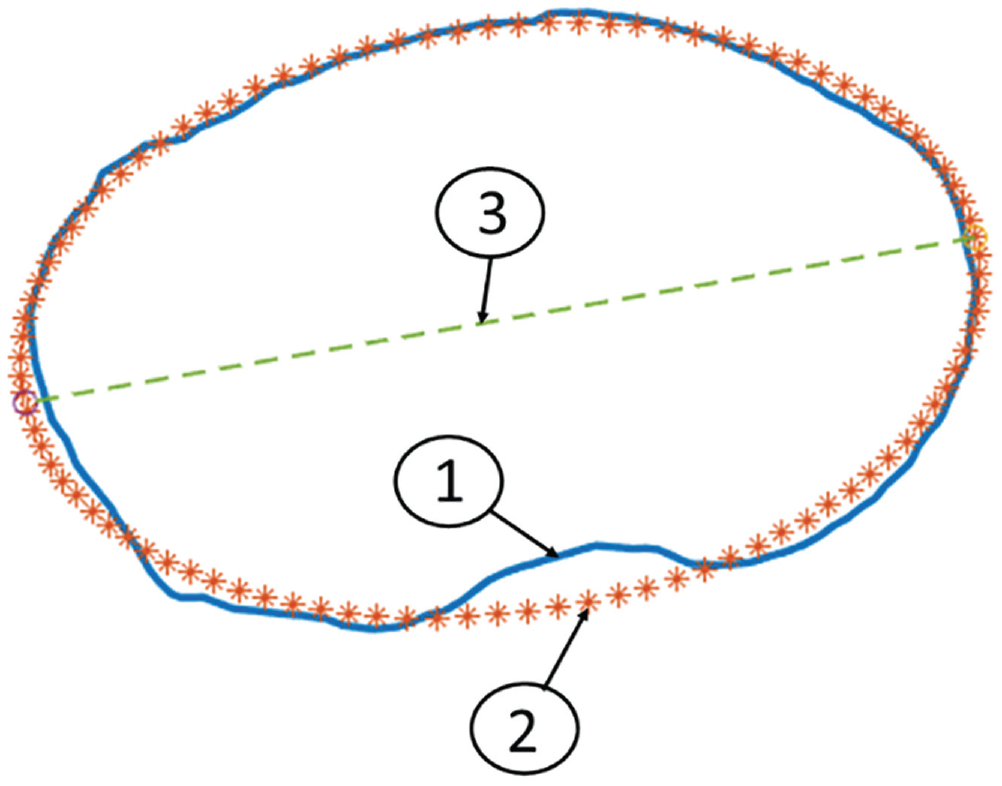
Greatest cross-sectional area of the proximal tibia, on an axial view looking from proximal to distal of a left-sided proximal tibia. Line 1, the border of the proximal slice of the tibia found to have the largest cross-sectional area. Line 2, the automatically generated ellipse that is fitted to the shape of the proximal tibia. Line 3, the proximal reference line for calculation of tibial torsion generated by the major axis line connecting the widest medial and lateral aspects of the ellipse.
Determination of Reference Points for the Distal Tibial Axis
Similar to the proximal tibia, it has been widely assumed that the optimal reference for the distal tibia is the flexion-extension (plantarflexion-dorsiflexion) axis of the ankle (ie, the transmalleolar axis). 25 Indeed, this is the most commonly applied reference axis in the literature.5,55 However, again this choice of axis is a proxy one of convenience, and because the transmalleolar axis may or may not coincide with it, the true axis of the tibia in the axial plane should be referred to specifically according to its geometry. Although the transmalleolar axis is probably closer to the distal tibial axial plane axis than the flexion-extension axis of the knee is to the proximal tibial axial plane axis, there can be problems. In the presence of an abnormal or displaced fibula (eg, distal fibular fracture) or disruption of the normal relationship between fibula and tibia (eg, rupture of syndesmosis, creating a diastasis), referencing tibial torsion in relation to the fibula will be inaccurate. 26 Investigators have also defined axes formed by connecting the center of a circle fitted to the distal tibia and the midpoint of a line across the fibular notch of the tibia39,47 and the perpendicular axis to the line connecting the distal fibular notch of the tibia. 26 Generation of the cloud points described above demonstrated clearly and consistently that the distal tibial slice medially represented a partial ellipse. However, laterally in the region where the fibula rests against the tibia, the shape of the region of bone contact between the fibula and tibia was highly variable (Figure 5) in our study of 56 CT and 12 MRI scans.
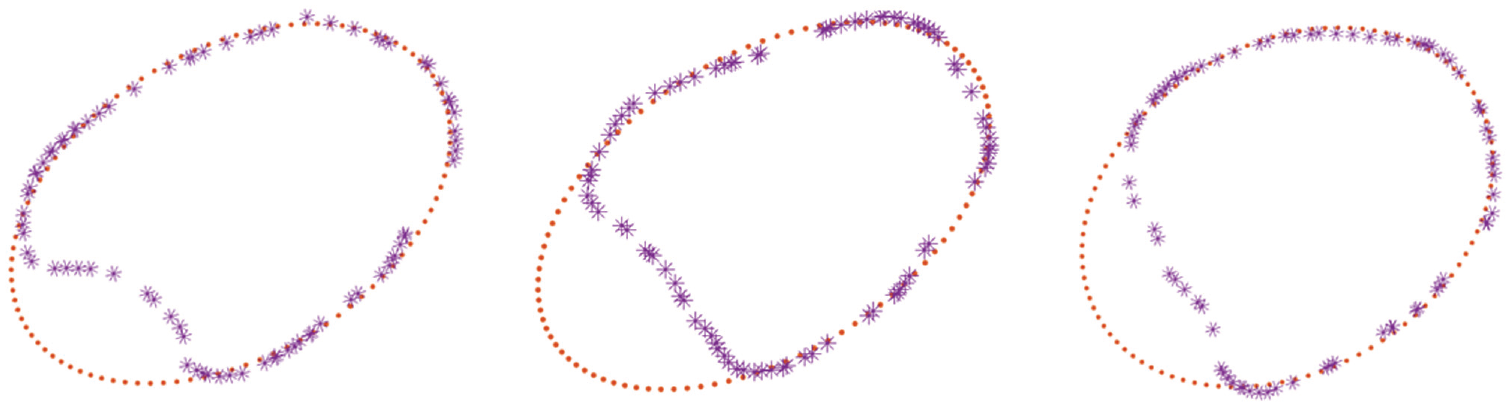
Cross-sectional area, looking at the axial view from proximal to distal of a range of left-sided distal tibiae. The medial tibia (right side of the image) consistently fits into the shape of an automatically generated ellipse. However, the lateral tibia where the fibula rests is more variable and does not form a consistent shape. Whereas in the left image, the fibular notch forms a second elliptical shape, the center and right images show that this was not consistently the case.
Given the variability of the distal tibial and fibular relationship, and because it is unknown what determines or influences fibular or tibial morphology distally, we decided to base the distal axis on the use of a single ellipse, fitted to the medial border, taking its medial and lateral borders as the points of reference (Figure 6).
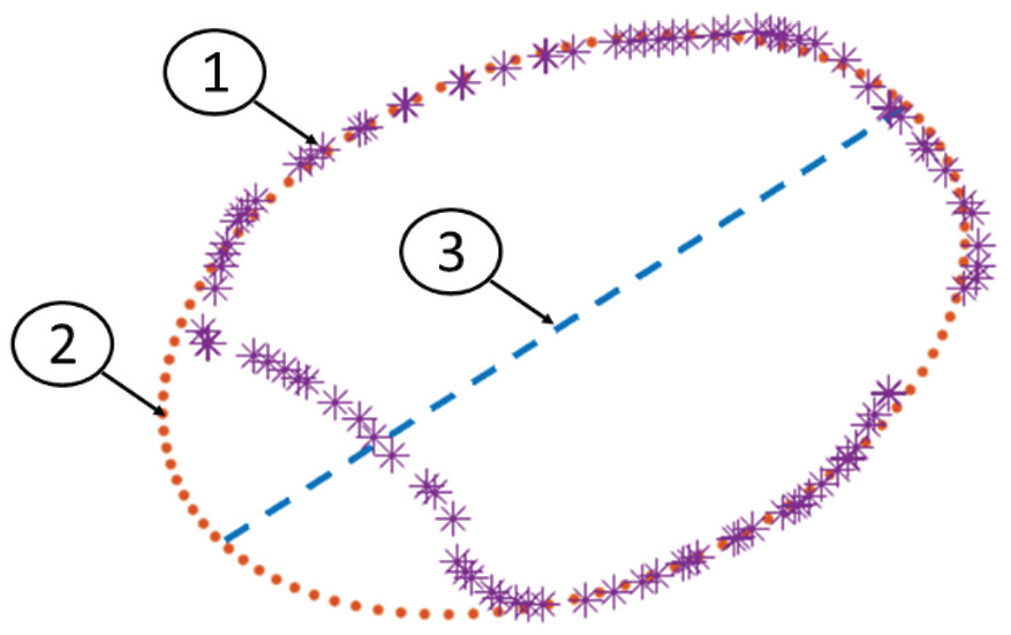
Greatest cross-sectional area of the distal tibia, looking at the axial view from proximal to distal of a left-sided distal tibia. Line 1, the border of the distal slice of the tibia found to have the largest cross-sectional area. Line 2, the automatically generated ellipse fitted to the shape of the medial distal tibia. Line 3, the distal reference line for calculation of tibial torsion generated by the major axis line connecting the widest medial and lateral aspects of the ellipse.
Tibial torsion, therefore, was calculated as the angle between the proximal tibial slice defined above and the distal tibial slice as described when they were overlaid with each other (Figure 7). The slices with the widest diameters proximally and distally were chosen.
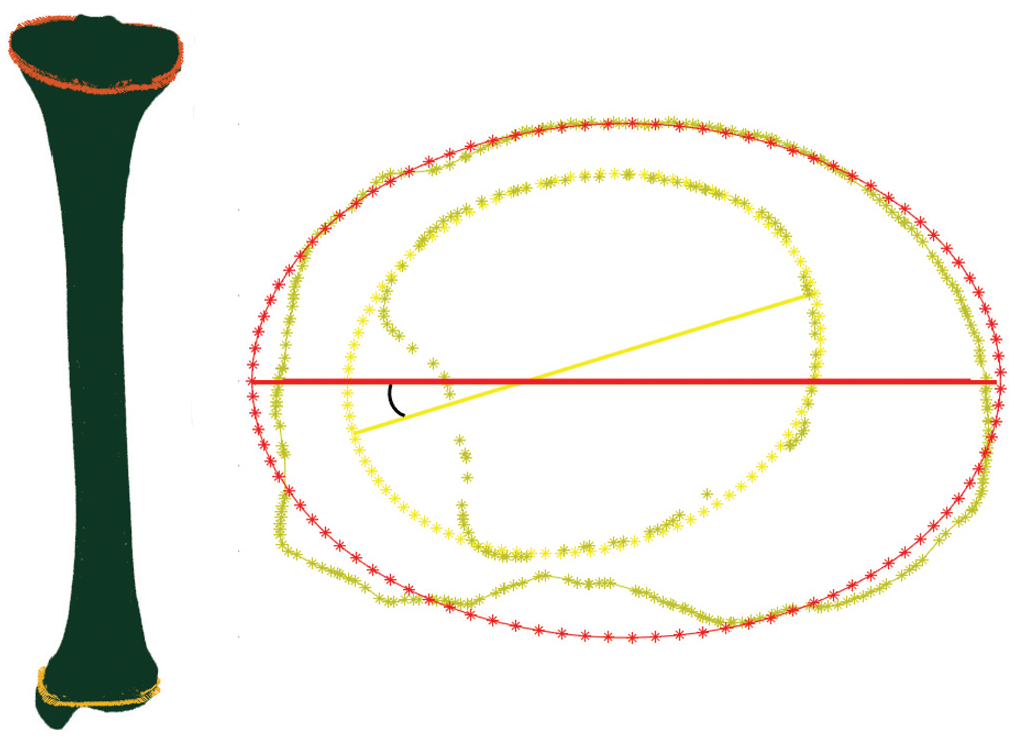
Left image shows the full tibia reconstructed 3-dimensionally with the proximal and distal ellipse outlined. Right image shows determination of tibial torsion taken as the angle between the described proximal (orange ellipse) and distal (yellow ellipse) slices of the tibia.
Calculation of Tibial Torsion and Comparison of Torsion Between CT and MRI Scans
After approval was obtained from the local research ethics committee, 28 cadaveric tibiae (mean ± SD age, 46 ± 14 years; range, 20-71 years; 14 female) with intact soft tissues were obtained from a tissue bank and scanned using CT imaging techniques. Further, 12 of the cadaveric bones were also scanned by MRI (age 26 ± 6 years; range, 20-42 years; 6 female). CT images were acquired using a high radiation dose in a conventional CT scanner (SOMATOM Definition AS+; Siemens) with a 512 × 512 resolution, 0.6-mm slice thickness, 120-KV kilovoltage peak, 0.44-mm pixel size, and 313-mm field of view. A gradient echo parameters “black bone” technique 8 was adapted for MRI using a 3.0-T MRI scanner (Siemens Spectra) at a 404 × 1212 resolution, 1-mm slice thickness, 1-mm pixel size, 1-mm slice increment, 400-mm field of view, 10-ms repetition time, 3.69-ms echo time, and 5° flip angle. The MRI scanning was achieved using proton density volume blocks in the coronal plane. A scanner-specific software was then used to stitch those blocks together and perform the multiplanar reconstruction. Images from both scans were stored in DICOM (Digital Imaging and Communications in Medicine) format. A further 28 CT scans were obtained from clinical patients (age, 28 ± 7 years; range, 17-44 years; 16 female) and analyzed. These patients reported a range of knee pathologies.
All scans were segmented by applying a threshold method based on the brightness of pixels identified using MIMICS software (Materialise). The segmented scan was then exported in stl (stereolithography) format to Matlab. The stepwise method detailed above was applied to reconstruct the tibia in 3D, transfer the image to a point cloud, and then assess tibial torsion in accordance with the defined axis reference lines.
Validation of the Method Using Dry Bones
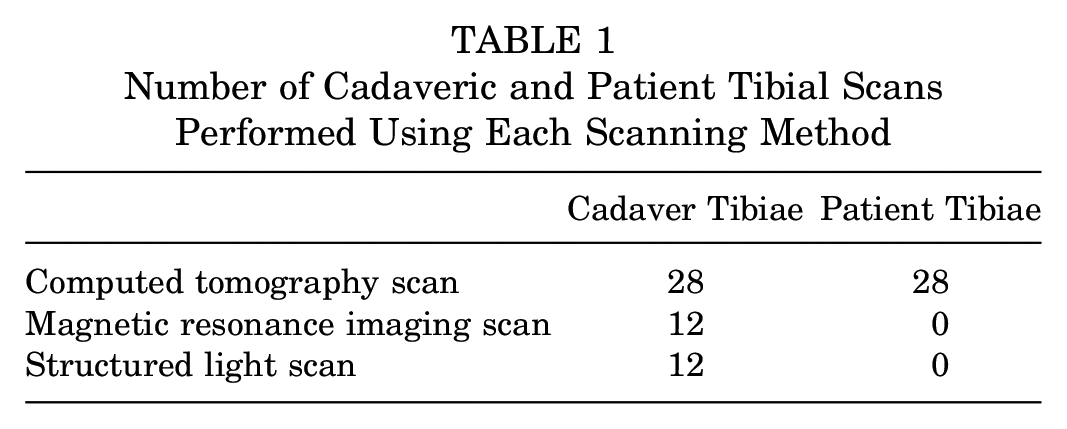
To validate the measurements generated from the scans, cadaveric 12 tibiae (age, 40 ± 12 years; range, 21-44 years; 6 female) were stripped of all soft tissues and soaked for 24 hours in 30% hydrogen peroxide solution to ensure that all flesh was removed and clean bone surfaces were obtained. A structured light (SL) scanner (HDI C210 scanner; maximum resolution 0.06 mm, accuracy up to 35 µm) was then used to collect the surface geometry of each tibia by scanning the bony surfaces directly. The data generated were used to construct a 3D bone model, and measurements of torsion by the various methods were compared. The number and type of scans undertaken on the cadaveric and patient bones are shown in Table 1.
Number of Cadaveric and Patient Tibial Scans Performed Using Each Scanning Method
Reliability of Tibial Torsion Assessment Methods
To determine the reliability of different methods of tibial torsion assessment, a trained engineer and 2 surgeons (experienced in taking torsion measurements) were asked to process scans through the automated software and to take manual measurements from the same scans using 2 commonly applied manual methods defined in the literature.16,34 Both methods are based on CT imaging and compute the tibial torsion as the angle between 1 proximal axis and 1 distal axis. In the first method, 16 the proximal axis is the axis of the slice with the widest transverse condylar diameter, and the distal axis goes through the lower end of the tibia, bisects the anteroposterior diameter, and passes through the anterior half of the lateral malleolus. In the second method, 34 the proximal axis is the dorsal tangent to the tibial condyles and the distal axis is the axis joining the centers of the medial and lateral malleoli. The torsion values of 30 tibiae were analyzed using each of the 3 methods. The mean measurement from 3 repeated assessments for each method was taken. All assessors were blinded to the measurements of others, and measurements taken using the different methods were calculated on different days, 1 week apart, to prevent any bias. Data were analyzed for reliability.
Statistical Analysis
In accordance with previous recommendations, 30 heterogeneous samples and 3 raters were used for the reliability study. 21 Data were assessed for normality using a Shapiro-Wilk test. Intraclass correlation coefficient (ICC) estimates were calculated based on a mean rating (k = 3), absolute-agreement, 2-way mixed-effects model. A paired t test was applied to compare differences between torsion values generated from MRI and CT models, SL and CT models, and MRI and SL models of the same bone. Finally, an independent t test was performed to compare the differences in tibial torsion in female compared with male tibiae. Significance level was set a priori to P < .05. All statistical analysis was performed using SPSS statistical package Version 22 (SPSS).
Results
The novel automated method detailed above determined that the cadaveric tibiae had mean external torsion of 29°± 10° (range, 9°-46°) and the patient tibiae a mean external torsion of 29°± 11° (range, 15°-65°). Combining all 56 scans provided a mean external torsion of 29°± 11° (range, 9°-65°). The 12 tibiae selected to be stripped of soft tissue and assessed using SL were found to have a mean torsion of 28°± 12° using the CT method. With the SL method, a mean torsion of 28°± 11° was identified, and the MRI method gave a mean torsion of 28°± 12°. A maximal difference of 1° of torsion was found between the 3 methods. No significant differences between the torsion values calculated from SL and CT (P = .802), SL and MRI (P = .708), or MRI and CT scans (P = .826) were identified.
In the reliability study performed on 30 tibiae, the novel automated approach determined the mean external tibial torsion to be 29°± 10°; the method by Jakob et al 16 found it to be 32°± 11° and the method by Reikerås and Høiseth 35 gave 28°± 11°. The novel automated torsion assessment was found to have an ICC of 1, reflecting excellent reliability, 21 with identical torsion values generated by all assessors when the scans were processed. The method proposed by Jakob et al had an ICC of 0.84, with variability of up to 12° reported between the measurements recorded by the different assessors, whereas the method proposed by Reikerås and Høiseth had an ICC of 0.78, with differences of up to 13° identified between the different assessors. The latter 2 methods, therefore, indicated good reliability 21 but demonstrated much greater variability in the values generated by different assessors than with the automated method. The average time taken for manual measurement was 28 minutes (range, 12-42 minutes); the computer software consistently took <1 minute to provide a measurement for all scans.
No significance was found (P = .271) in external tibial torsion measured in female tibiae (31°± 11°; range, 15°-65°) compared with male tibiae (26°± 10°; range, 9°-50°). As well, no significant difference was identified between the torsion values calculated from MRI and CT scans of the same bone using the newly developed automated approach (P = .826).
Discussion
This study has defined a previously undescribed automated, validated, reliable, and repeatable method to quantify tibial torsion. The stepwise approach addresses potential sources of measurement error encountered at each stage of analysis with other established methods. It is proposed that this novel method therefore enables more accurate determination of tibial torsion, with significantly fewer limitations and errors compared with previously reported methods. Its measurements were equivalent to those taken directly from the bone surface using an SL scanning method and those obtained from CT scanning, which provides considerable validation of the new measurement method. CT and MRI scan reconstructions analyzed from the same bone were also comparable, meaning normative and pathological data can be collected with MRI, thus avoiding the ethical concern regarding radiation exposure from CT scanning. Compared with previously reported methods,5,40 which were found to demonstrate poor reliability, the novel automated method always generated an identical torsion value from each scan, regardless of the assessor. This results from the automated method of standardizing bone alignment, appropriate slice selection, and identification of proximal and distal reference lines, all of which remove potential human error. Over time we aim to make software to apply this method available online, enabling the generation of large, comparable data sets of reliable tibial torsion values to facilitate improved clinical decision making and outcome data. The present version of the software was not commercial and was written using custom Matlab functions and scripts. However, the method presented in this paper would be easy to program with any commercial or open-source programming platform and therefore could be made freely available. Alongside ensuring consistent, accurate, and reliable measures, the method presented offers a significant advantage of time efficiency; manual measurements often take even experienced assessors 20 to 30 minutes to perform accurately, whereas the automated method required <1 minute.
Tibial torsion is the angular relationship of lines drawn between 2 points at the proximal and distal bone ends; thus, 4 fixed points must be determined. To generate a reliable and accurate torsion measure, these points must be constant and reflective of bone torsion. 38 As described above, the proximal reference line for torsion assessment of the tibia remains particularly contentious and widely debated. The tibial tubercle has been used 54 but is reported to be unreliable.5,23 The posterior aspect of the femoral condyles has been applied22,34; however, this reference cannot account for axial rotation taking place at the knee according to knee flexion angle, leading to false measurements and error. 17 A proximal reference line parallel to a tangent line drawn at the anterior articular cartilage edge of the medial and the lateral tibial plateau has been described, 55 but due to the need to clearly observe local anatomic features, this application is limited to dry bone studies.9,51 The 2 most clinically applicable methods we identified from previously proposed methods were the posterior tangent to the tibial condyles proximally31,34,39 and the axis through a manually selected slice in the proximal tibia that has the widest transverse condylar diameter. 16 Limitations regarding both of these have been discussed above, specifically the challenges of clearly identifying proximal tibial morphology to apply the former method and of selecting the correct slice level and landmarks manually in the latter method. In addition, and a likely reflection of these issues, both methods were found to have suboptimal reliability in the present study, with variability of up to 13° between assessors. We propose an alternative proximal reference line. First, a consistently present ellipse at the level of the greatest cross-sectional area of the proximal tibia is located. Next, the most medial and lateral points of the ellipse are identified, and the line joining these 2 points is taken as the proximal tibial reference line. This method is more appropriate because it generates consistent reference points localized to the proximal tibia itself and is not a proxy measurement. The automated software developed to apply this method provided 100% repeatability, with no dependence on user experience, unlike the other methods.
Regarding the distal reference line, there is wider agreement on approaches reported in the literature that the transmalleolar axis is an appropriate option, and this is commonly applied.5,34,55 However, again, this method is reliant on the morphology of the fibula and its relative position to the tibia, meaning this reference is dependent on the fibula and not just the tibia. Consequently, an alternative has been proposed: the line formed by connecting the center of a circle fitted to the distal tibia with the midpoint of a line across the fibular notch of the tibia.39,47 The perpendicular axis to the line connecting the anterior and posterior aspects of the distal fibular notch of the tibia has also been defined. 26 After seeing the initial scans, we had intended to apply an ellipse to the distal medial tibial contour and another ellipse, rotated 90° in relation to the first, fitted to the fibular notch of the tibia. However, after we analyzed a number of scans, it became clear that there was high variability in the appearance of the fibular notch and its geometry. Because it is unknown what affects this variability, we decided to depend solely on the tibia and therefore reference the most medial and lateral reference points of the ellipse fitted to the medial aspect of the distal tibia (Figure 7). This was easily determined automatically with applied software, generating a repeatable and reliable measurement.
At present, owing to the lack of a universally and consistently applied, accurate method of measurement, normal values of tibial torsion amongst the normal population are unknown and there is unsurprisingly high variability in the values reported. Jakob et al 16 reported mean tibial torsion to be 30° external, which is similar to the present study. However, when different assessors used this method in the present study, variability of up to 12° was seen in values reported from the same bone, suggesting that the measure does not have adequate reliability to apply in practice. Reikerås and Høiseth 34 found that female patients had a mean external torsion of 38° and male patients a mean of 41°, the greater values likely reflecting the investigators’ reliance on the transmalleolar axis as a distal reference. Interestingly, Reikerås and Høiseth found greater external torsion in male than female patients, in contrast to the current study and that of Yoshioka et al. 55 Greater numbers of tibial samples are required to determine whether there is any true sex difference in torsion measures. Jend et al 17 determined normal tibial external torsion values in 69 limbs to be 40°± 9°, and the same method applied by a further study 40 gave a mean torsion of 42°± 9°. Repeated-measurement errors of 3°± 2.7° were reported. Yoshioka et al 55 determined external torsion of 21° in male patients and 27° in female patients to be normal, more similar to the average 24° originally reported by Le Damany. 52 In a group of 50 normal (asymptomatic) male participants, Seber et al 41 calculated mean external tibial torsion of 30° (range, 16°-50°), whereas CT measurements by Sayli et al 38 averaged 30° to 35°, both similar to the present study. Crucially, none of these methods used 3D reconstruction techniques and therefore are very unlikely, for the outlined reasons, to be accurate and reflective of true tibial torsion. The lack of consistent data is clearly a significant limiting factor in identifying the influence that tibial torsion has on a range of pathological conditions and determining when interventions such as osteotomy may be indicated and useful. 47 Adoption of the automated approach outlined will address this limitation, because the approach allows easy, quick, and accurate generation of a large data set of normal values.
Tibial torsion has been linked to a range of clinical conditions.12,35,48,49 Assessment of limb alignment has focused mainly on the coronal (frontal) and to a lesser extent sagittal planes, with the importance of axial alignment neglected, probably because it is challenging to assess, comprehend, and address. However, excessive torsion of the tibia has been identified to significantly affect muscular function, reducing the capacity of lower limb muscles to generate force and dampen impact shock. 14 This suggests that in select cases, tibial derotational surgery could significantly improve lower limb function, not only by improving structural alignment but also by optimizing the dynamic function of the limb via the improvement in muscular leverage provided. Future work using bone model analysis could help determine the level of rotational osteotomy that would optimize the dynamic function of the lower limb via improvement in muscular leverage.
The consistent and accurate assessment of transverse bone alignment is also critical to the success of partial and total knee arthroplasty 50 and total ankle replacement systems, 42 because such understanding will help determine the optimal alignment of the implant. Rotational malalignment accounts for an unacceptable number of failures in total knee arthroplasty, and a significant correlation between optimal tibial rotational alignment and improved functional outcomes has been established. 50 Currently, femoral component placement in total knee arthroplasty can be improved with computer assistance, but not reliably for tibial placement. 13 This is likely, in part, a reflection of the lack of agreement regarding methods to assess true tibial torsion.
This study has some limitations. As discussed, a validated gold standard method to assess tibial torsion is not available. To account for this, we assessed dry bones directly, performing 3D reconstruction and comparing torsion calculations from this model to those obtained from CT. Through the stepwise approach, which allowed identification of errors in the previously proposed methods to measure tibial torsion, we developed the novel method, which is both accurate and reliable. Another factor to consider is the relatively small number of CT scans available with which to assess and report torsion. A total of 28 of the specimens were cadaveric, and it is impossible to know whether these specimens were from normal or pathological limbs. Ideally, a high-volume database should be developed to enable normal and pathological values of torsion to be determined with the application of this automated method to ensure consistency. Finally, our results were comparable between CT and MRI measurements. However, the MRI protocol for scanning involved development to optimize tissue contrast and ensure accuracy with bone segmentation. Routine, nonspecific MRI protocols may not provide such favorable comparisons, and clinicians should be aware of this. In addition, MRI scanning took longer than CT scanning. The speed of scanning and ease of image processing have historically made CT scanning particularly attractive. However, CT holds the significant disadvantage of using multiple x-ray beams, resulting in exposure of the individual to radiation of significant levels. 34 Of concern, a significant increase in lifetime cancer risk attributable to radiation from pediatric CT scans relative to adult CT scans2,32 has been reported. Another recent study with a cohort of 11 million patients showed that the adjusted overall cancer incidence for young people was 24% greater for those who were exposed to a CT scan than for those who were not exposed. 28 Therefore, use of CT should be reduced as much as possible and alternative modalities considered, particularly when patients are relatively young 32 and repetitive imaging is required. Based on the present data, MRI therefore appears to offer an attractive alternative.
A clinically reasoned approach to assess tibial torsion with excellent reliability and repeatability has been defined. Long bone torsion is often ignored in limb alignment assessment because it is challenging to assess accurately. Small changes in torsion have significant implications for joint loading through both bony alignment and dynamic muscular activity and therefore cannot be ignored. Given that it is difficult to “eyeball” subtle torsions in the transverse plane, it is crucial to have a reliable and validated method from which a large database of measurements can be developed. The automated method defined here will enable the creation of such as database. Because many of the issues raised by this study will apply to other bones (eg, the femur), similar stepwise automated methods should be developed for these bones.
Footnotes
Acknowledgements
The authors thank David Hillier from Siemens for his expertise, time, and assistance in developing the scanning protocol and Shane Palmer, a radiographer at Fortius Clinic, for his time and assistance.
Submitted January 8, 2020; accepted October 5, 2020.
The authors declared that they have no conflicts of interest in the authorship and publication of this contribution. AOSSM checks author disclosures against the Open Payments Database (OPD). AOSSM has not conducted an independent investigation on the OPD and disclaims any liability or responsibility relating thereto.