
Abstract
Porous asphalt mixtures are increasingly used in pavement infrastructure because of their environmental benefits and enhanced surface drainage. However, their unique open-graded structure and reduced stiffness present challenges for rutting prediction using traditional dense-graded asphalt models. This study developed and calibrated a rutting prediction model specifically for porous asphalt pavements using data from full-scale accelerated pavement testing with a Heavy Vehicle Simulator. The first section, consisting of a 2-in. modified open-graded friction course (MOGFC) over a 10-in. asphalt-stabilized drainage course (ASDC), was subjected to 1 million equivalent single axle loads (ESALs) under controlled conditions at 85°F. The second test section consisted of a 6-in. MOGFC layer over 13-in. ASDC, and was designed for 13 million ESALs. Laser profilometer measurements were used to track surface deformation. A power law model was fitted between the measured rut depth and ESALs, yielding a strong correlation (coefficient of determination = 0.97). Vertical compressive strains within each asphalt layer were computed using a structural response model that incorporated modulus values from laboratory testing. These strain values were input into the Pavement mechanistic–empirical viscoplastic rutting model, which revealed that over 64% of the rutting occurred in the MOGFC layer because of its high strain and shallow depth. The default global Pavement mechanistic–empirical coefficients significantly underpredicted the measured rutting, prompting calibration. Optimized model parameters aligned the predictions with observed performance. This calibrated model enhances the rutting prediction for porous asphalt systems and supports performance-based design under high-traffic loading.
Keywords
Introduction
Porous asphalt mixtures are increasingly used in modern pavement infrastructure because of their environmental and safety benefits. With interconnected air voids content typically exceeding 20% and an open-graded aggregate skeleton, porous asphalt mixtures enable rapid water infiltration, reduced surface spray, hydroplaning risk, and tire-pavement noise, while improving stormwater management ( 1 , 2 ). Subsequently, these structures are widely used as hydrological structures. However, the reduced fines and interconnected void network that provide these benefits also reduce mixture stiffness, creating a heterogeneous structure that behaves differently from conventional dense-graded asphalt concrete (AC) under repeated traffic loading ( 3 , 4 ). Therefore, porous asphalt pavements (PAPs) are more susceptible to permanent deformation (rutting), particularly under high-traffic volumes and elevated temperatures.
Traditional rutting prediction models and frameworks, such as those embedded in the American Association of State Highway and Transportation Officials (AASHTO) Mechanistic–Empirical Pavement Design Guide and implemented in Pavement ME, were calibrated primarily for dense-graded AC ( 5 ). These models assume a relatively homogeneous material structure and fail to account for the higher air voids, open-graded stone skeleton, and unique stress–strain response of porous systems. Applying these default models to porous asphalt mixtures often leads to substantial underprediction or overprediction of rutting because they do not incorporate the distinct viscoplastic deformation characteristics of porous mixtures. Furthermore, porous asphalt mixture rutting performance is strongly influenced by binder type and modification, aggregate gradation, air void structure, and environmental effects, such as oxidative aging, moisture ingress, and high temperature softening ( 6 – 8 ). Polymer-modified binders, for example, have been shown to enhance mixture stiffness and delay plastic flow in porous mixtures ( 9 , 10 ). These interdependent material, structural, and environmental factors highlight the need for the calibration of mechanistic–empirical (ME) rutting models specific to porous asphalt systems.
Laboratory testing protocols such as the Hamburg Wheel Tracking Device and Flow Number tests provide valuable insights into mixture deformation resistance under controlled conditions ( 11 , 12 ). However, these tests cannot fully replicate field confinement conditions, lateral wheel wander, multi-axle loading, and cumulative effects of temperature and moisture cycling. Therefore, laboratory results alone are insufficient for reliable performance prediction of PAPs.
Accelerated pavement testing (APT) provides a powerful tool for bridging the gap between laboratory performance tests and field observations. The APT facilities allow millions of equivalent single axle loads (ESALs) to be applied in a controlled environment, enabling high-resolution monitoring of rutting progression, surface deflection, and distress development within a short period of time ( 13 ). For innovative or nontraditional pavement systems such as PAPs, where long-term field performance data are often limited, the APT provides critical data for calibrating ME models and validating performance predictions.
Globally, full-scale studies have emphasized the need for region-specific and structure-dependent rutting models for porous asphalt. Nishizawa et al. ( 14 ) evaluated porous asphalt overlays in Japan under APT loading, reporting slower but nonlinear rutting accumulation compared with dense-graded pavements. Hofstra and Klijn ( 15 ) observed that the long-term performance of porous asphalt in the Netherlands depends heavily on support layer stiffness and environmental exposure. In China, Yu et al. ( 16 ) documented substantial rut accumulation in porous asphalt under high temperature and saturated conditions using in situ sensors. These studies collectively demonstrate that rutting behavior in PAPs is highly sensitive to mixture properties, layer configuration, and climatic conditions, underscoring the limitations of applying uncalibrated dense-graded models to PAPs.
In summary, while porous asphalt mixtures offer significant hydraulic and safety benefits, their structural performance under traffic loading remains a key challenge. Conventional rutting models in Pavement ME do not adequately capture their unique deformation behavior, leading to inaccurate predictions when used without calibration. This study addresses this gap by integrating full-scale APT data with ME modeling to develop and calibrate rutting prediction parameters for full-depth PAPs.
Goal and Objectives
The goal of this study is to provide a rutting prediction framework for full-depth PAPs by integrating full-scale APT results with laboratory characterization. This study integrates field performance monitoring with mechanistic modeling to enhance the reliability of rutting predictions for PAPs. By focusing on a power law-based viscoplastic strain model and modifying its parameters based on observed APT trends and laboratory-derived material properties, this study aims to bridge the gap between empirical observations and mechanistic understanding. Ultimately, the findings of this study are expected to promote the widespread adoption of PAPs across all road networks, including high-traffic roadways. The specific objectives are as follows.
Develop an empirical power law model for rutting prediction using total measured rut depth from APT data under high-traffic loading.
Determine the contribution of individual asphalt layers to total rutting in a full-depth PAPs.
Calibrate the Pavement ME rutting model by adjusting global model coefficients while retaining default local coefficients using APT data.
Materials and Methods
Materials Used in the Porous Asphalt Mixtures
The porous asphalt mixtures used in this study were designed with a nominal maximum aggregate size of 12.5 mm and a target air void content exceeding 20%. The mix consisted of aggregates, polymer-modified Performance Grade (PG) 76-22 binder, and 0.3% loose cellulose fiber. The high air void content was intended to enhance permeability while maintaining structural integrity under traffic loading. The properties of the mixtures used in this study are presented in Table 1, and Figure 1 shows the aggregate gradation curves. More details on materials, mix design tests, and performance tests for laboratory-produced and laboratory-compacted porous mixtures are provided in the related work ( 17 ).
Properties of Porous Asphalt Mixtures (MOGFC and ASDC)
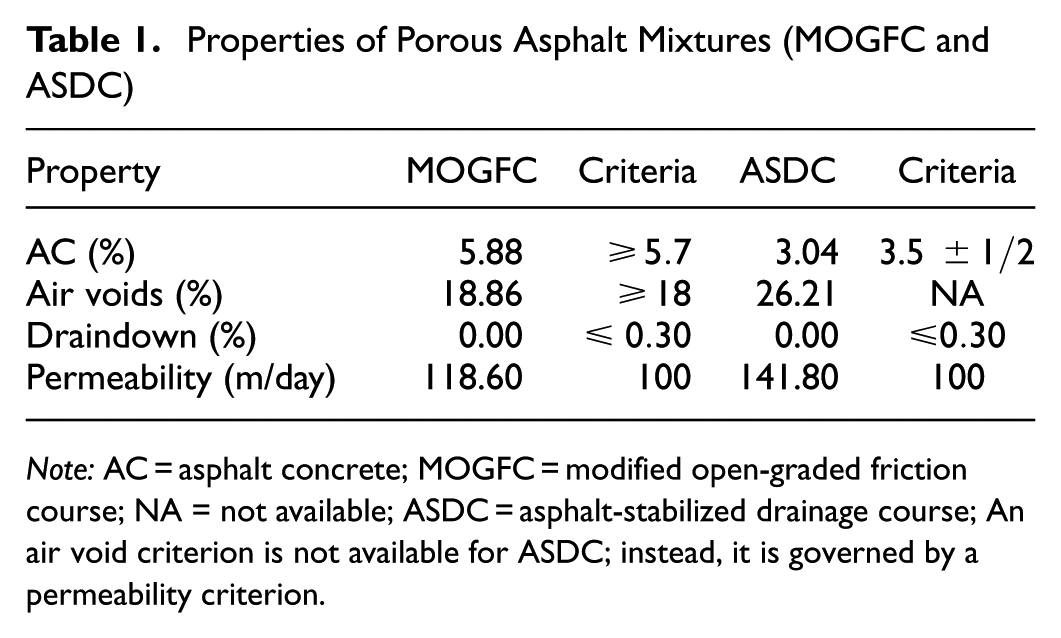
Note: AC = asphalt concrete; MOGFC = modified open-graded friction course; NA = not available; ASDC = asphalt-stabilized drainage course; An air void criterion is not available for ASDC; instead, it is governed by a permeability criterion.
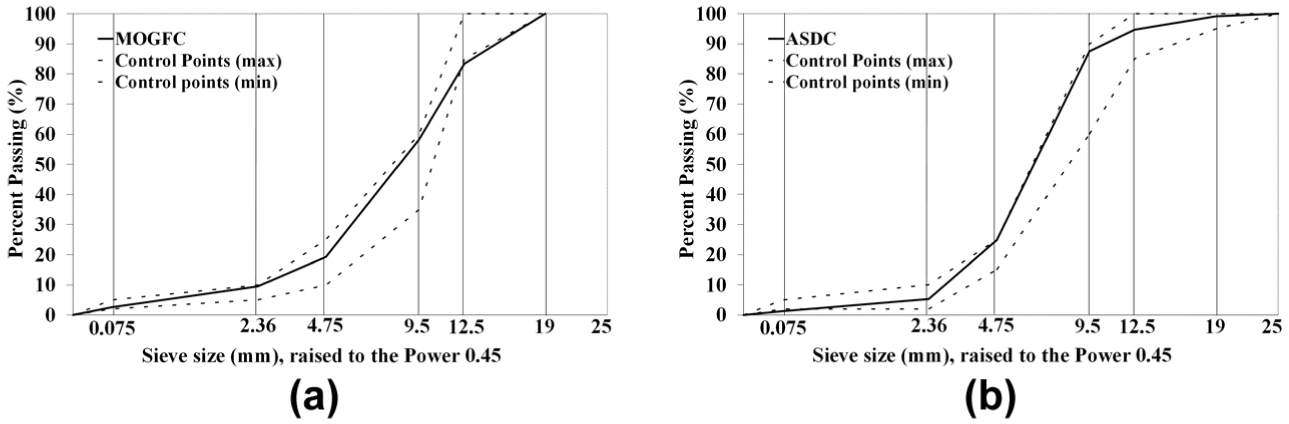
Gradation curves for the porous mixes: (a) MOGFC; and (b) ASDC.
Laboratory Characterization of Porous Asphalt Mixtures
Plant-produced, laboratory-compacted specimens of the porous asphalt mixtures were tested to characterize their durability and permeability (
17
). The dynamic modulus
Structural Design of Full-Depth Porous Asphalt Pavement Test Sections
As part of this study, a framework was developed for designing durable PAPs for high-traffic roadways and validated through a New Jersey case study ( 19 ). Traditionally, these hydrological structures were designed for stormwater management on low-volume roads and parking lots. In contrast, the goal of the developed structural design framework was to balance functional performance (permeability) with structural capacity (durability) for heavy-traffic applications.
The initial trial thickness was based on a hydrological design available for New Jersey conditions. This thickness was optimized for the structural capacity using the AASHTO 93 empirical design method ( 20 ). The optimized design was then analyzed in Pavement ME (Version 3.0) to finalize the cross section. The final designs of full-depth PAPs are shown in Figure 2. A full-infiltration configuration was selected in this study because the soil permeability was 9.62 in./h. The subgrade soil was left uncompacted to ensure the infiltration; therefore, only half of the subgrade modulus was considered in the structural design. A nonwoven permeable geotextile was spread over the uncompacted subgrade to prevent fine soil particles from migrating into the coarse aggregate layers above in the presence of water. A 1-in.-thick stabilization course was provided to protect the geotextile from tearing during placement of larger aggregates in the coarse aggregate storage bed and to provide a stable base for the coarse aggregate storage bed; therefore, this layer was not included in the structural design. The thickness of the coarse aggregate storage bed was determined using the curve number method to accommodate peak stormwater volumes and allow complete drainage within 72 h according to the hydrological design. The subgrade and the coarse aggregate storage bed were combined as the composite subgrade for the structural design. A 1-in.-thick choker course was placed on top of the coarse aggregate storage bed to provide a stable base for the upper asphalt layers. An ASDC layer, often omitted in the hydrological design, was added to improve structural capacity. The section designed for 1 million ESALs over a 20-year design life is shown in Figure 2a. The design in Figure 2b, incorporating a 6 in. MOGFC, 13 in. ASDC, and an 18 in. stone reservoir layer, was designed to carry 13 million ESALs over a 50-year design life. The MOGFC and ASDC layers are both called porous asphalt mixtures.
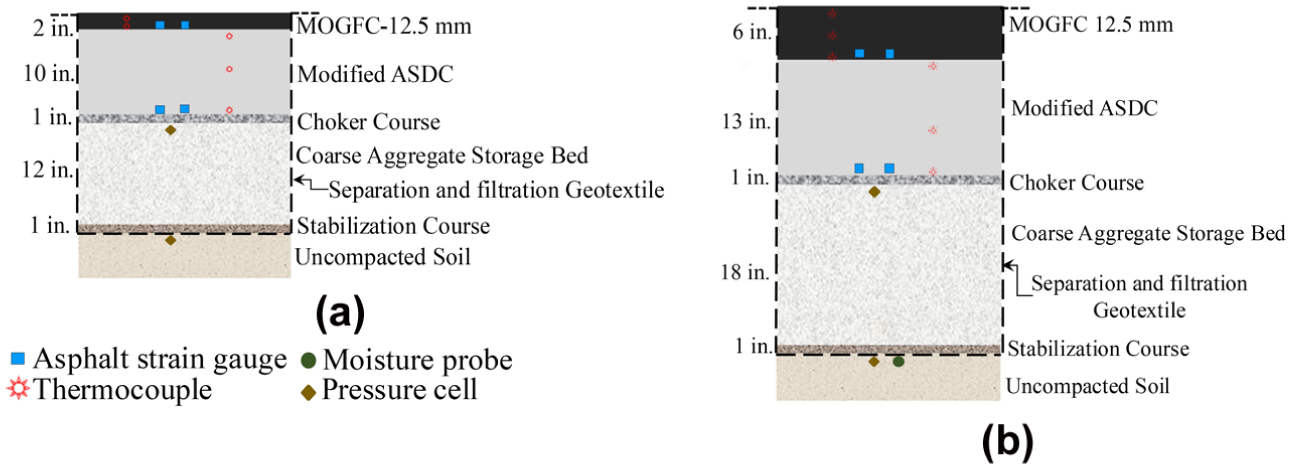
Full-depth porous pavement sections based on the developed design framework: (a) Section 1; and (b) Section 2.
For this study, a rutting threshold of 19 mm (0.75 in.) and a bottom-up fatigue cracking threshold of 25% were adopted, consistent with the default settings in AASHTOWare Pavement ME. A design reliability level of 90% was assumed, and national calibration factors were applied without modification. These parameters align with the standard ME calibration framework; however, future studies should address the need for local calibration specific to porous asphalt mixtures.
Laboratory testing of three porous asphalt mixtures demonstrated improved stiffness under confined dynamic modulus conditions ( 18 ). Pavement ME analysis confirmed that the designs met rutting resistance requirements but revealed limitations in predicting distress for PAPs because of software constraints. These findings underscore the need for field validation, confined dynamic modulus testing, and enhancements to Pavement ME to refine the framework for long-lasting PAPs in high-traffic applications.
Construction of Full-Scale Full-Depth Porous Pavement Sections
The seven-layer porous asphalt pavement sections, as shown in Figure 2, were constructed following a multilayer approach. The sections incorporated a nonwoven geotextile over uncompacted subgrade, a stabilization course, a coarse aggregate storage bed (placed in 6-in. lifts and compacted with a static roller), and a choker course to provide a stable platform for paving. The MOGFC was placed without a tack coat to maintain permeability. Quality control included field density testing, binder draindown checks, gradation verification, and permeability testing of plant-produced mixes. The sections were instrumented with pressure cells, strain gauges, and thermocouples. The average in-place density measured by the nuclear density gauge was 24% for the MOGFC layer and 32% for the ASDC layer. A 6-ton static roller was used for the compaction. The porous asphalt layers were compacted with one roller pass immediately after the placement. Each lift was compacted using a very slow-moving static roller with three passes initially when the temperature was between 200°F and 250°F, and an NDG was used to measure the density of the compacted layer. Subsequent compactions were performed until the layer’s peak density was achieved, involving three intermediate and three final roller passes. After intermediate rolling and the appropriate density was achieved, the layers were evenly sprayed with water to accelerate cooling to the temperature levels necessary for final rolling and density. Strict temperature control (mix discharge 250°F–290°F, final rolling 130°F–150°F) and static rolling ensured adequate compaction without closing surface pores. Slow, steady, and static rolling was the best way to achieve the required compaction. Two observation wells were installed to monitor the water levels under the APT. The steps involved in the construction of the test sections are shown in Figure 3.
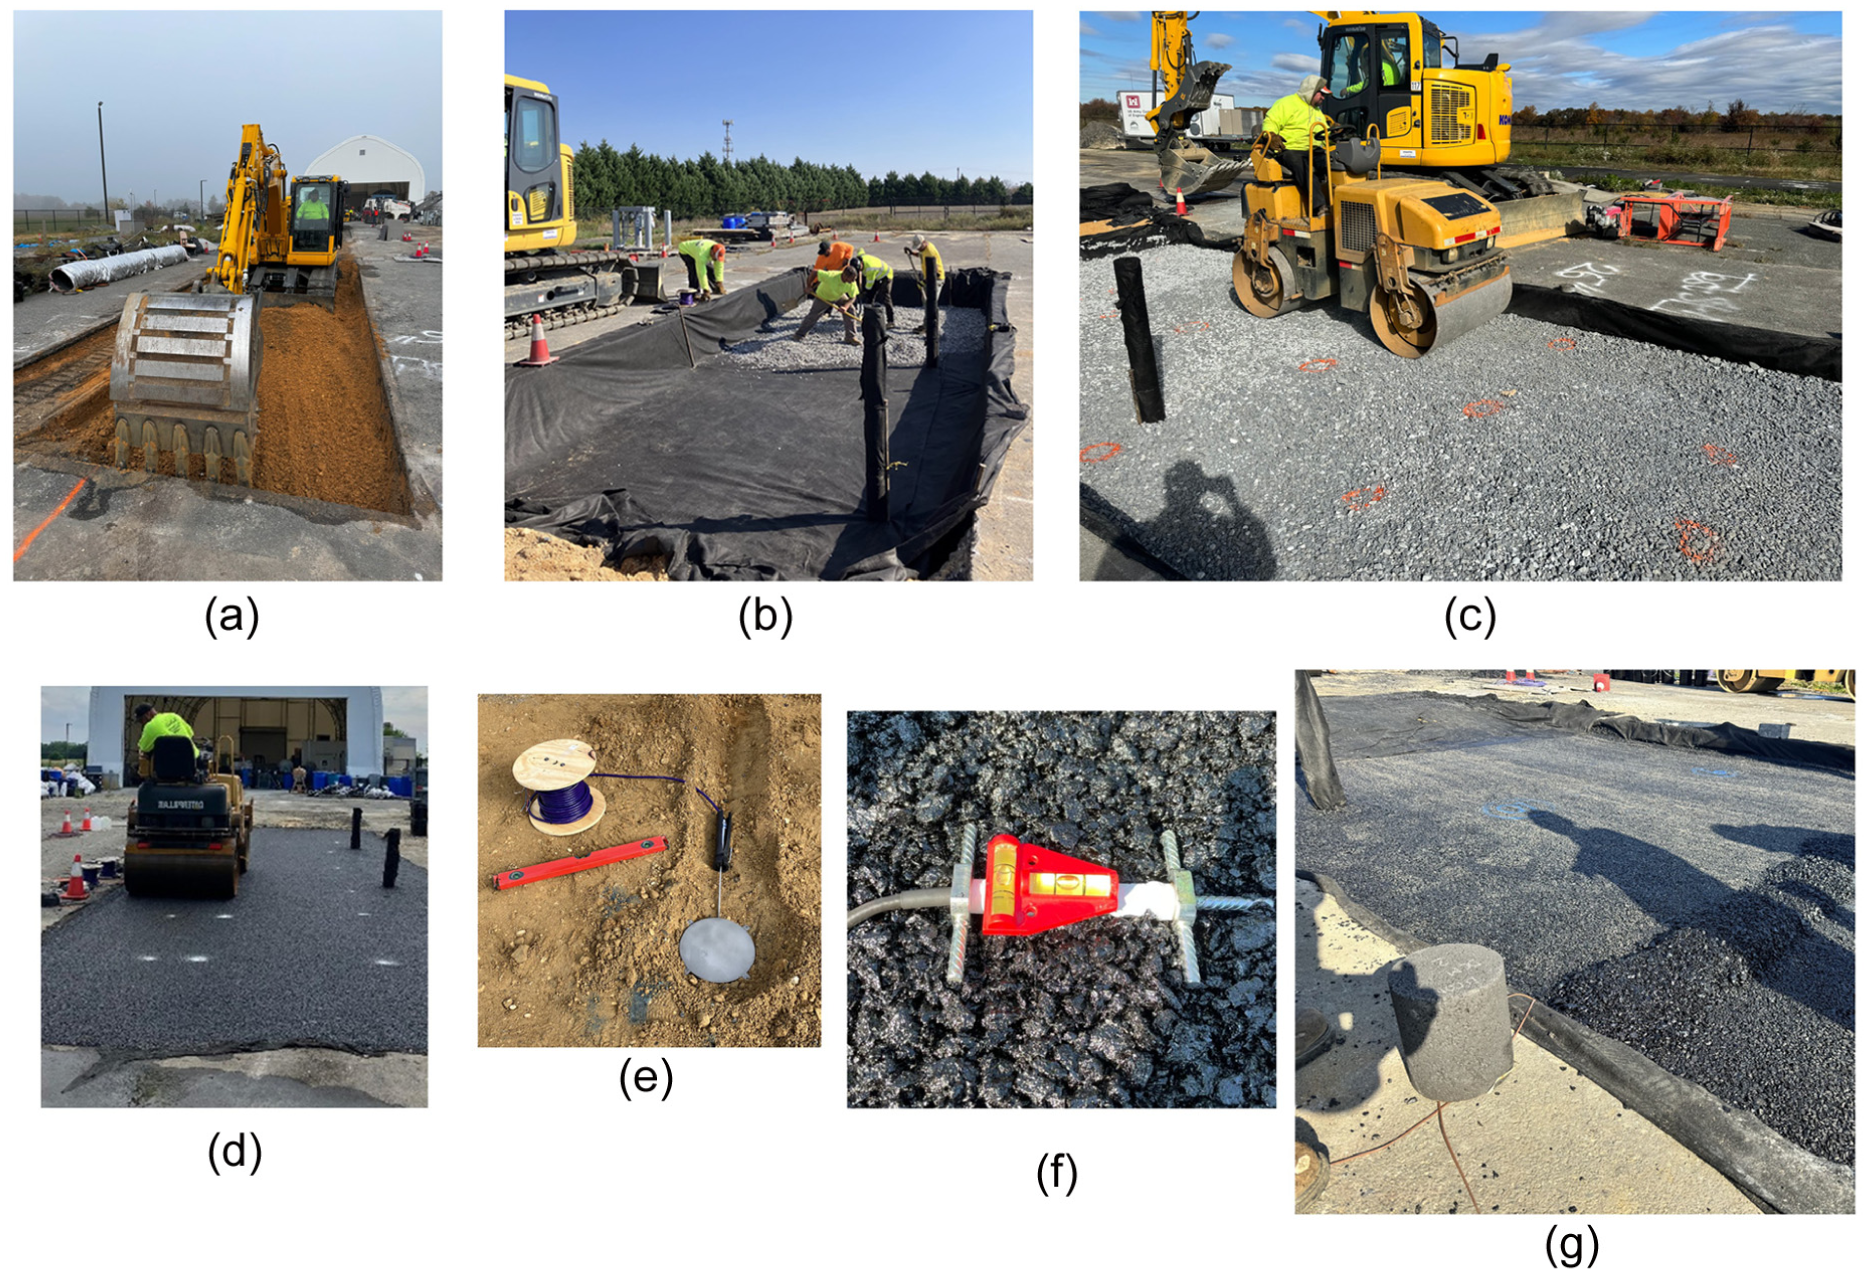
Full-depth porous asphalt pavement construction activities: (a) subgrade; (b) geotextile and water wells; (c) aggregate layer compaction; (d) asphalt layers; (e) pressure cell; (f) strain gauge; and (g) thermocouple.
APT Using Heavy Vehicle Simulator
Traffic loading was applied to the test sections using an HVS by mounting a single wide-base tire (at 115 psi) on the test carriage capable of applying up to 80 kN of load. Wheel loading was applied at 8 km/h, with a lateral wander of 2 in. on either side to simulate realistic tire paths. The air temperature around the pavement test section was controlled to 85°F. This temperature was selected as representing the average air temperature in New Jersey and the intermediate temperature for the PG 76-22 binder used in this study. A high temperature test was also selected because of the expected failure mechanism in porous pavements: rutting. Rut depths were measured continuously using a laser profilometer and validated with manual measurements at regular intervals. The Heavy Vehicle Simulator (HVS MkIV) used for this study is shown in Figure 4a, and the layout of the porous pavement test sections within the facility is shown in Figure 4b.
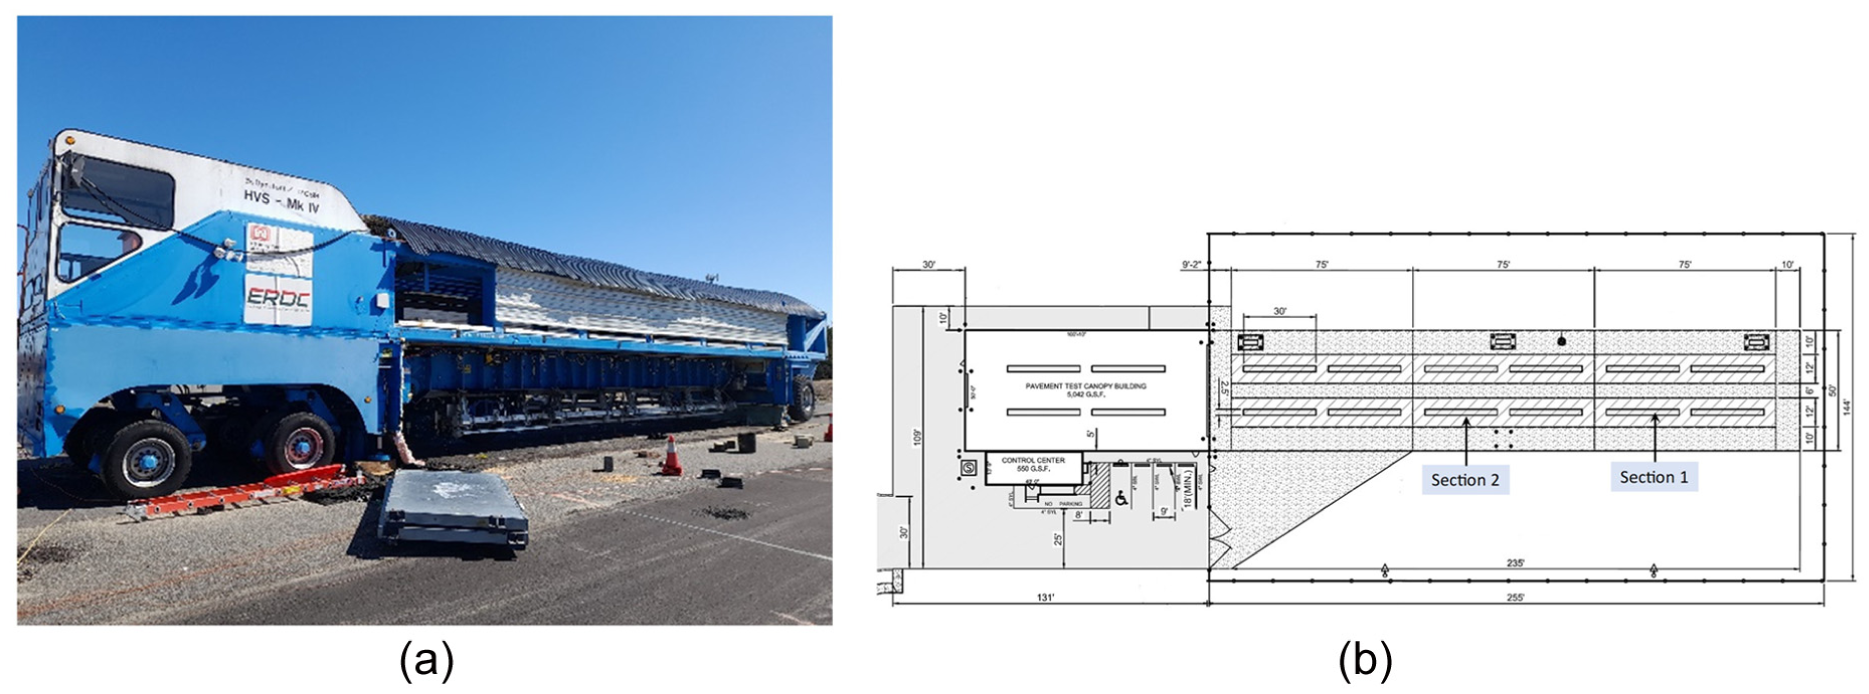
Heavy Vehicle Simulator and the layout of accelerated pavement testing: (a) Heavy Vehicle Simulator on porous asphalt pavements; and (b) facility layout.
The progressive development of distress in the full-depth porous pavement sections was evaluated using HVS loading. Instead of directly applying the 1 million ESALs at 80 kN, loading was applied incrementally at four axle load levels (20, 40, 60, and 80 kN). The HVS operated at a bidirectional loading rate of approximately 20,000 passes per day. Surface profiles were recorded using a laser profilometer before and after each load increment at five fixed locations spaced 5 ft apart (Figure 5), with metallic base plates installed at these locations to ensure repeatable measurements. Even after reaching the designed 1 million ESALs, no additional distresses, such as stripping, raveling, fatigue, or shear failure, were observed. Therefore, loading continued to 1.4 million ESALs at 85°F, followed by an increase in test temperature to 122°F with loading extended to 2 million ESALs. Beyond the expected increase in rut depth, no new distress developed, leading to the termination of HVS testing for Section 1. The same staged loading protocol and environmental conditions were applied to Section 2, which was designed for 13 million ESALs. At the time of reporting, approximately 5.6 million ESALs have been applied, and the corresponding rutting results are presented in this study.
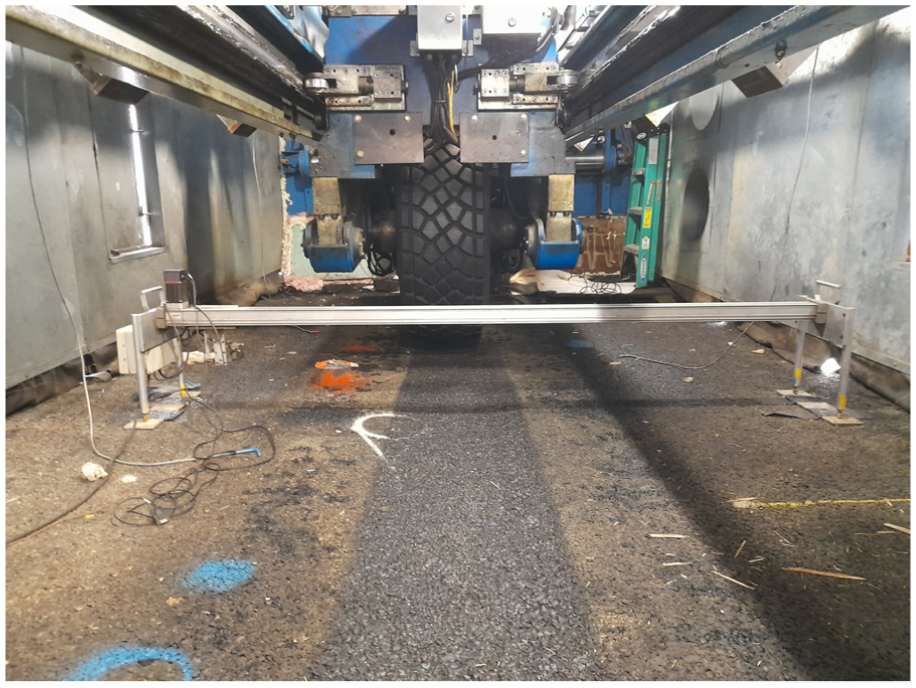
Laser profilometer used for surface profile recording.
Modeling Approach
Rutting progression was modeled using a two-stage approach. This framework enabled direct comparison between empirical and mechanistic predictions and provided a basis for calibrating the ME model coefficients. The two-stage modeling approach is explained in the following sections.
Empirical Power Law Model
Rutting prediction was performed by developing a power law model to correlate ESALs versus measured rut depth. The full-depth porous asphalt pavement test section was subjected to 1 million ESALs through a sequence of accelerated pavement loading phases. The cumulative rutting observed at the end of testing was approximately 0.75 in., as measured by a surface profilometer. This measured deformation was used as a benchmark for model calibration. The MOGFC and ASDC layers were included in the mechanistic analysis, given the structural role assigned to the MOGFC in this design. A power law relationship of the form, as shown in Equation 1, was applied.

where
N = cumulative number of ESALs.
ME Model
To bridge the empirical model with the ME rutting framework used in AASHTOWare ME Design ( 5 ), the general form of the viscoplastic strain-based model was adopted.

where
n = number of axle load applications,
T = mix or pavement temperature (°F),
D = depth below the surface (in.),
global coefficient for New Jersey
The resilient strain at mid-depth
Depth Confinement Factors for Porous Asphalt Layers
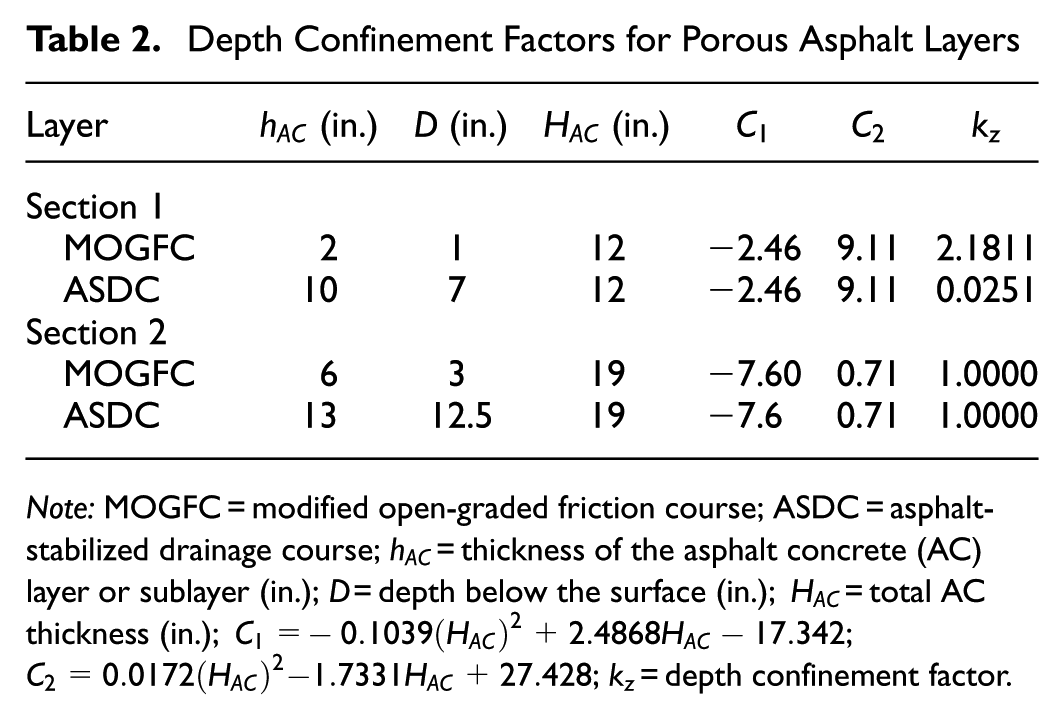
Note: MOGFC = modified open-graded friction course; ASDC = asphalt-stabilized drainage course;
To align the empirical and mechanistic models, the empirical coefficients A and B were equated to the corresponding mechanistic expressions.


The rut profile in Figure 6 shows an initial compaction phase followed by stabilization, indicating that deformation is confined to the asphalt layers. Layer-wise rutting predictions were generated using default Pavement ME coefficients (Table 2) to quantify contributions from the MOGFC and the underlying ASDC. This analysis explains whether the observed surface rutting originated predominantly in one course or a combination of both. Table 3 indicates that rutting is concentrated in the MOGFC layer, accounting for approximately 99% of total rutting in Section 1 and 64% in Section 2, while the ASDC contribution remains minimal. Therefore, subsequent calibration efforts focused on the MOGFC layer, which dominates the deformation response in these full-depth porous asphalt sections.
Predicted Rut Depth with Default Calibration Factors
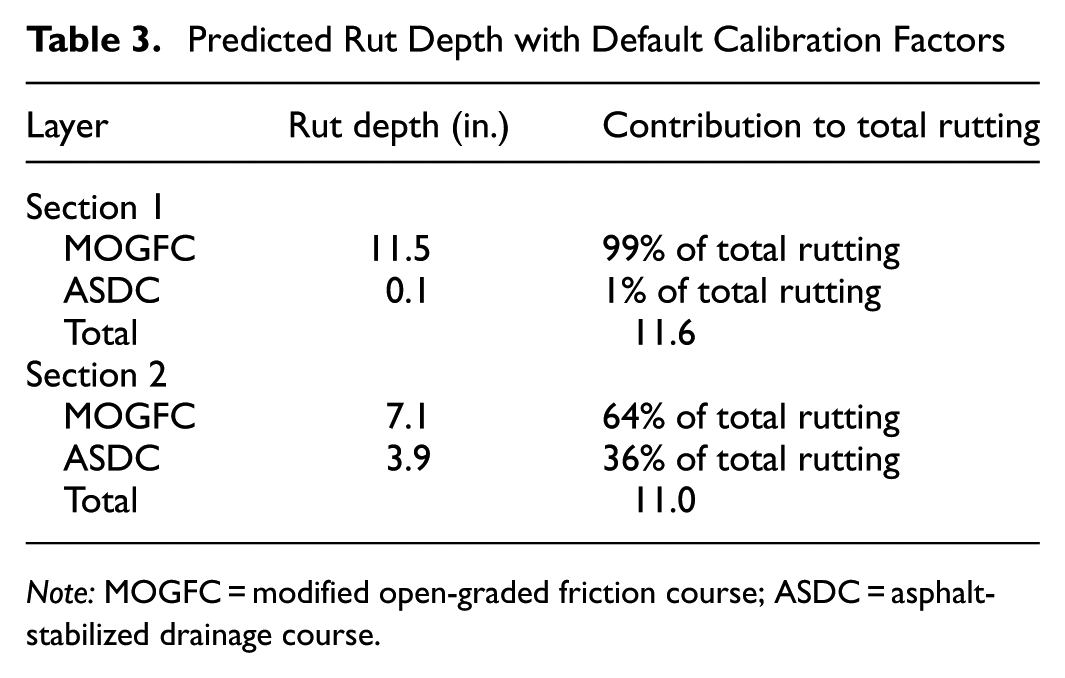
Note: MOGFC = modified open-graded friction course; ASDC = asphalt-stabilized drainage course.
Results and Discussion
APT Results
Section 1 reached 0.75-in. rut depth at 1 million ESALs when measured at the mid-point of the test section where instrumentation was located. Section 2 showed a rut depth of 0.87 in. for the current load of 5.6 million ESALs. The resulting surface profiles are shown in Figure 6, and the progression of rut depths over loading cycles is shown in Figure 7.
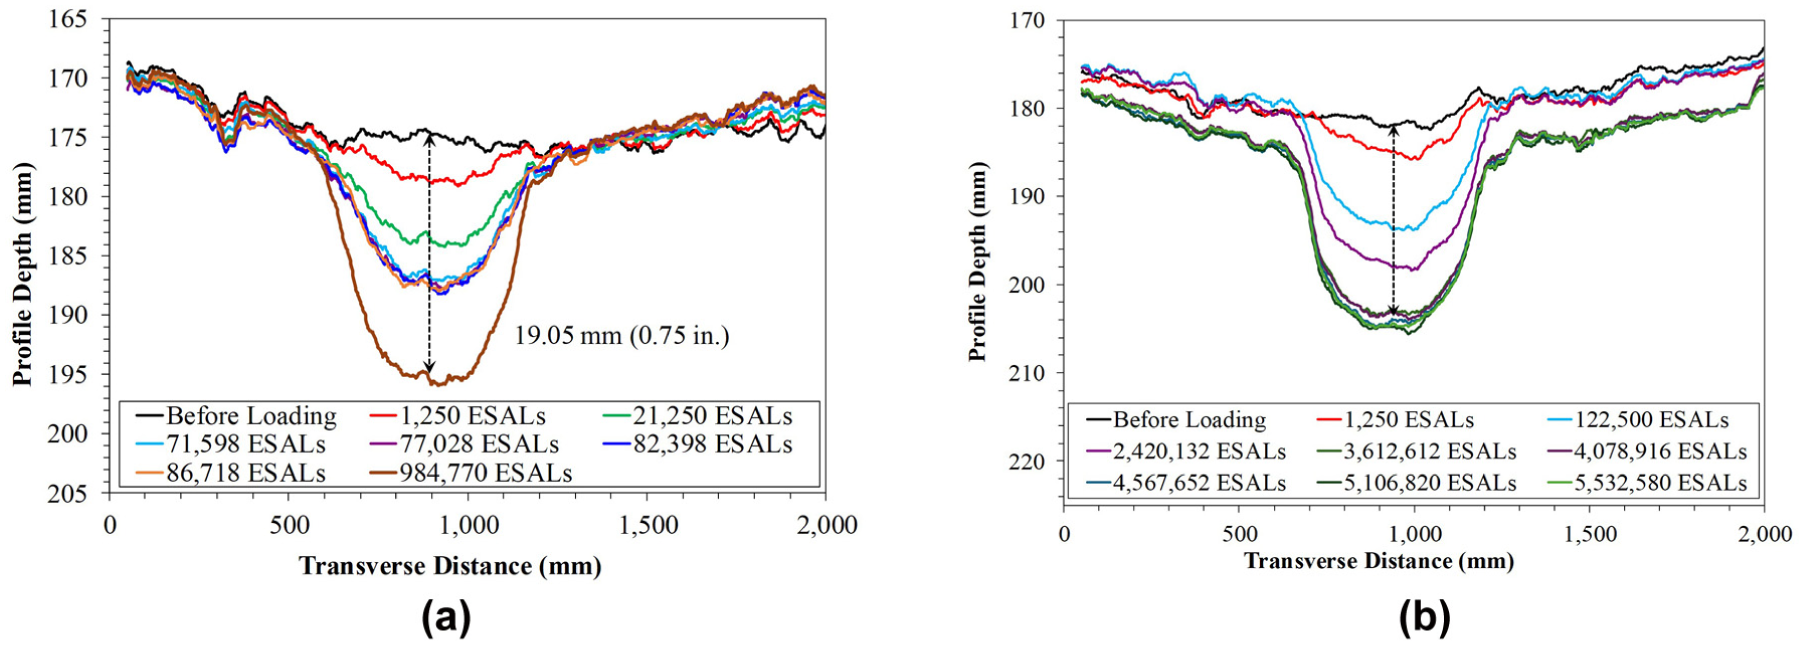
Surface profiles of porous asphalt pavement sections: (a) surface profile of Section 1; and (b) surface profile of Section 2.
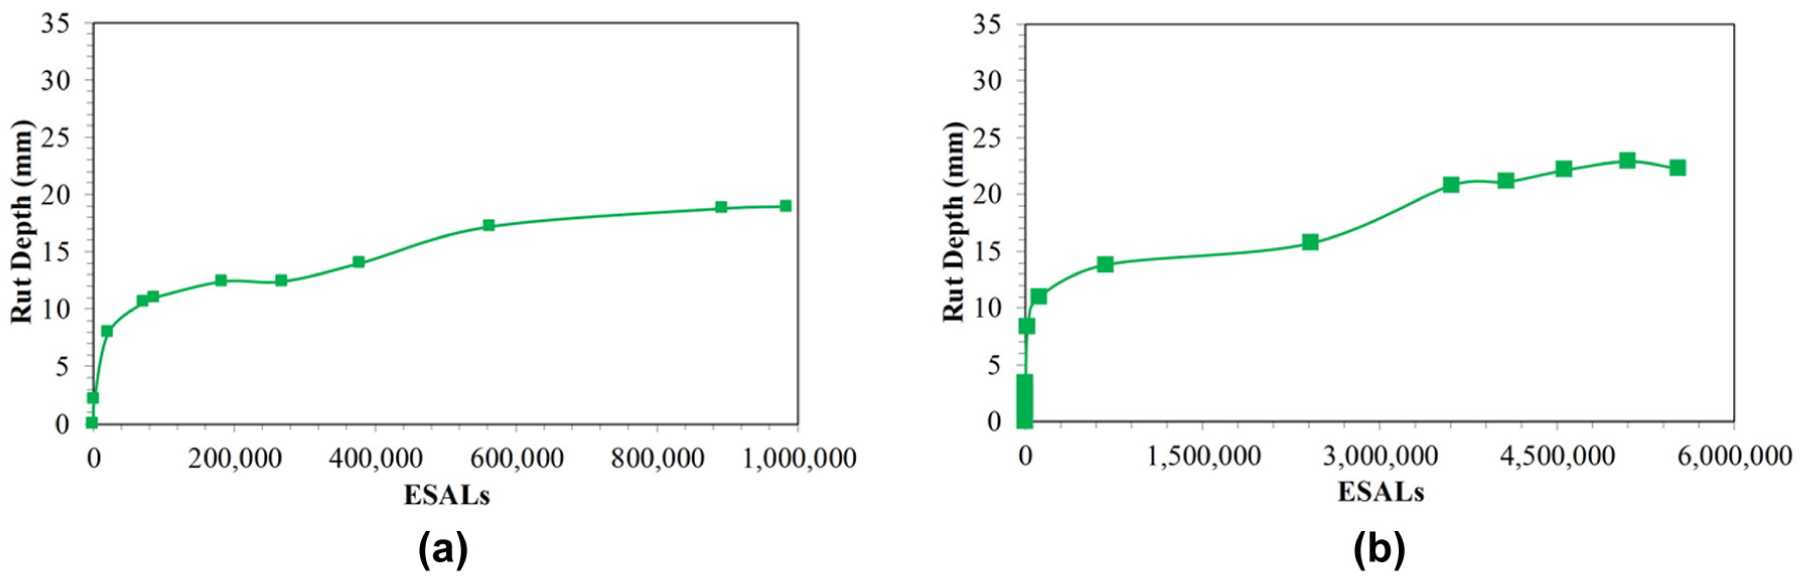
Rutting progression in porous pavement sections: (a) Section 1 designed for 1 million ESALs; and (b) Section 2 designed for 13 million ESALs.
The rut depth at each stage was determined relative to the initial surface profile. A noticeable shift in the surface profile occurred as the axle load increased from 20 to 40 kN, from 40 to 60 kN, and from 60 to 80 kN, followed by a stabilization phase until the next load increment. This is reflected in the rut profile shown in Figure 6. Figure 6 shows an initial compaction phase followed by structural stabilization of the pavement layers. As shown in Figure 7, the maximum rut depth after 1 million ESALs was 0.75 in. Given that the test strip was designed to withstand 1 million ESALs with a failure criterion of 1 in., these results indicate that Section 1 is overdesigned. For Section 2, loading is ongoing, and at the current cumulative traffic of 5,532,580 ESALs, the measured rut depth has reached 0.87 in. Because this measurement falls below the selected rutting failure criterion of 1 in., HVS loading continued to evaluate permanent deformation progression and monitor for the onset of additional distress mechanisms as the section approaches its design capacity of 13 million ESALs.
Empirical Power Law Model Performance
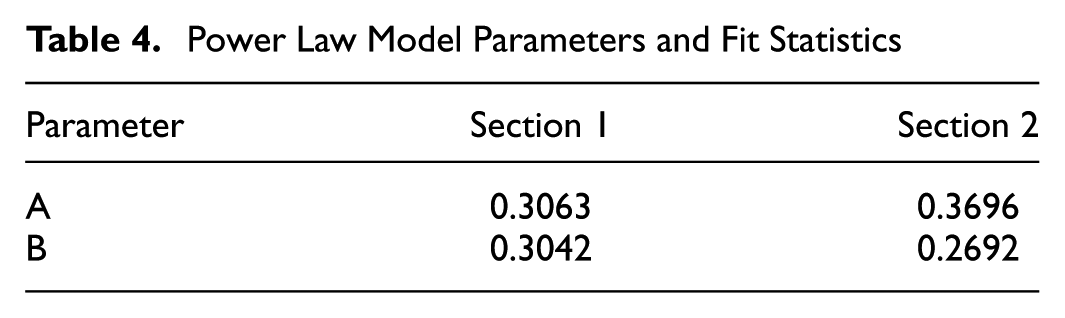
Using Equation 1, the power law model was fitted to the ESALs versus measured rut depth from the APT. This approach yielded a strong fit with a coefficient of determination
Power Law Model Parameters and Fit Statistics
ME Coefficient Determination
Building on insights from the empirical power law calibration, the ME rutting model embedded in Pavement ME, as presented in Equation 2, was evaluated to assess its predictive adequacy for full-depth PAPs. Initial modeling using New Jersey resulted in a total predicted rut depth of approximately 0.45 in., underestimating the 0.75 in. measured in the full-depth porous asphalt pavement section after 1 million ESALs. This significant discrepancy highlights the inadequacy of using default dense-graded asphalt parameters for porous asphalt systems, necessitating localized calibration to better capture their unique viscoplastic behavior.
In addition, the compression-shaped rut profile (Figure 6) observed from the profilometer reading further supports the hypothesis of vertical consolidation within the asphalt layers, particularly MOGFC. No signs of lateral shoving or displacement typical of base or subgrade failure were noted, ruling out significant rutting from unbound layers. These findings reinforce the need for localized calibration of rutting model coefficients, particularly
Depth Confinement Factor
The depth confinement factor
During calibration for the second test section, the empirical depth correction factor
Global Laboratory-Derived Coefficients
The calibration of the Pavement ME rutting model was undertaken by minimizing the sum of squared errors between measured and predicted rut depths. This process yielded updated coefficients of
Although both sections used the same materials, their calibrated coefficients differed slightly (Section 1:
Comparison of Calibrated Rutting Model Coefficients
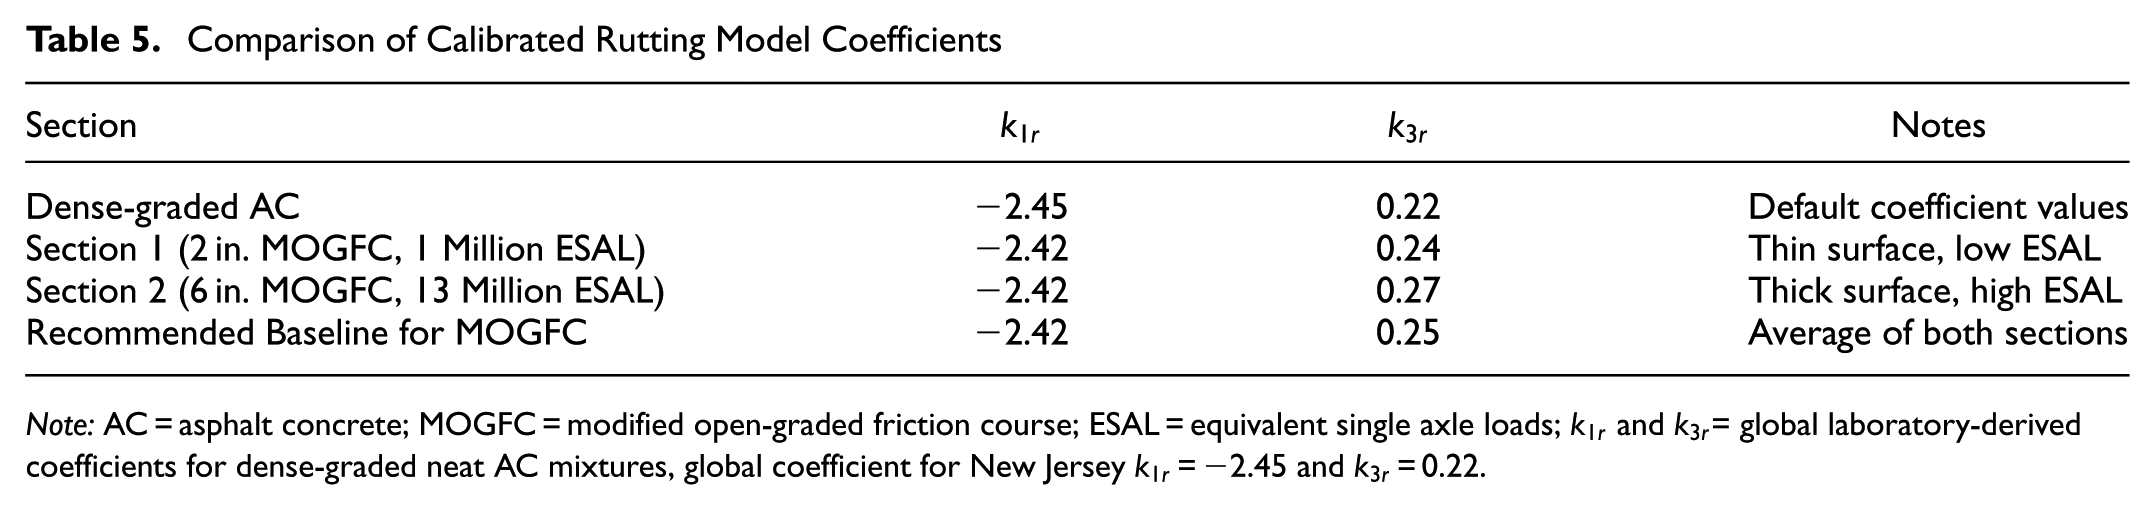
Note: AC = asphalt concrete; MOGFC = modified open-graded friction course; ESAL = equivalent single axle loads;
The slight reduction in strain sensitivity
Applicability of Calibration Across Temperatures
Based on the dynamic complex modulus (DCM) master curves, the DCM of porous asphalt mixture at 20 psi confinement was less sensitive to temperature compared with dense-graded mixtures. A typical master curve of both mixtures is shown in Figure 8. The lesser sensitivity of porous asphalt to temperature is because of the load-carrying behavior of the open-graded aggregate skeleton, where stone-on-stone contact dominates binder viscosity in governing the viscoelastic response. Recent findings further corroborate the reduced temperature susceptibility of porous asphalt mixtures under confinement ( 23 ). Given this lower sensitivity, retaining the default temperature coefficient in the Pavement ME rutting model represents a conservative and reasonable approach for extending predictions across temperatures.
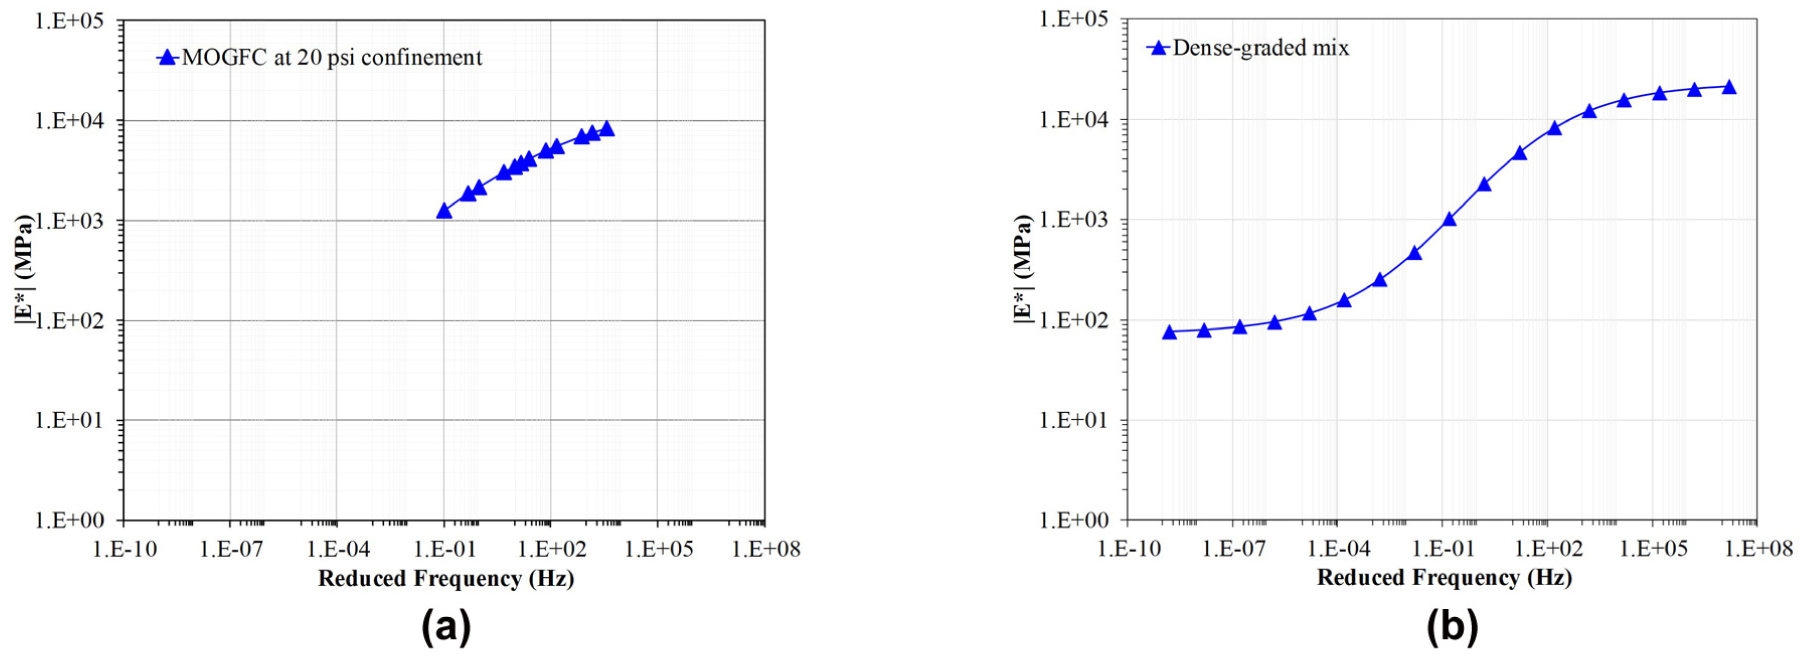
Comparison of master curves: (a) porous mix master curve; and (b) dense-graded mix master curve.
Effect of Coefficient Calibration on Rutting Predictions
Calibration of the Pavement ME rutting model significantly improved the agreement between predicted and observed rut depths from the APT sections. Using the default Pavement ME global coefficients, the model underpredicted rutting, capturing only about 60% of the measured deformation in Section 1 (0.45 in. versus 0.75 in.) and about 30% in Section 2 (0.28 in. versus 0.87 in.). After calibrating
Effect of Calibration on Rutting Prediction
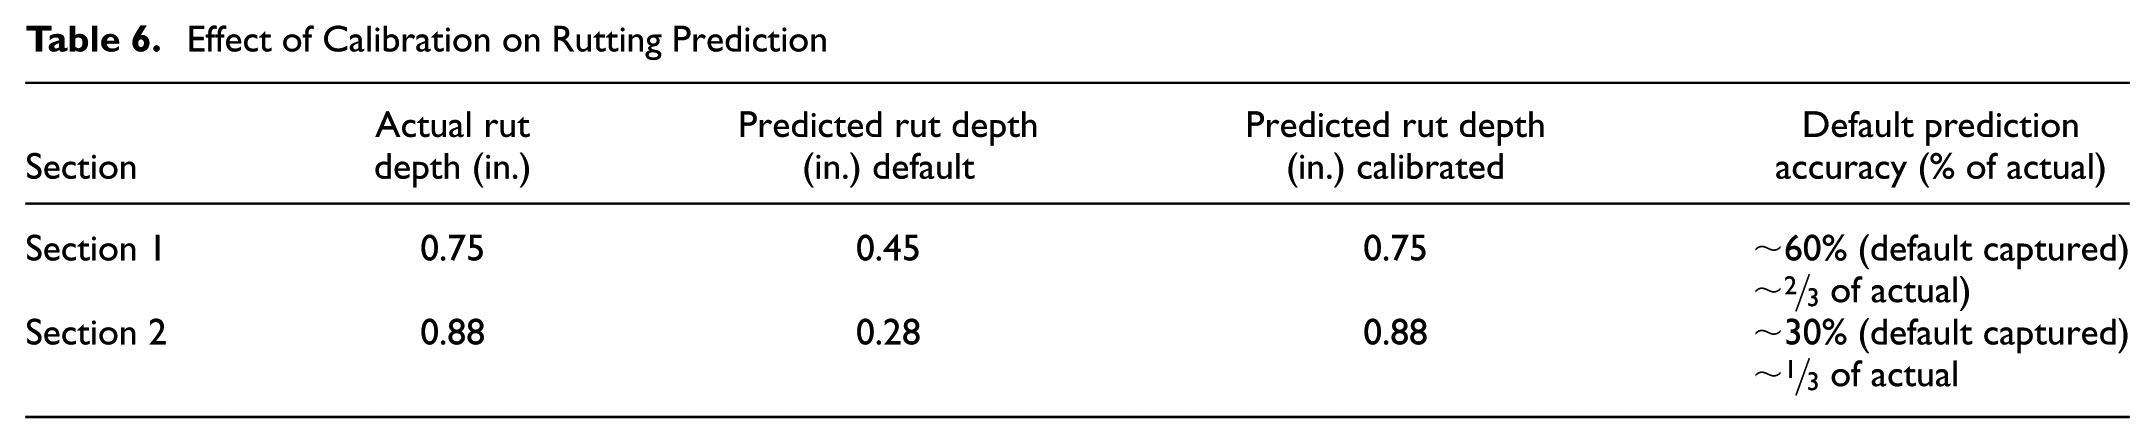
This comparison demonstrates that without calibration, the default Pavement ME model would significantly underestimate rutting, leading to unconservative designs and misrepresenting the structural demands on porous asphalt systems.
For design engineers, these findings indicate that using default Pavement ME rutting coefficients for full-depth PAPs may result in overly optimistic performance predictions and potentially under-designed structures. The calibrated coefficients presented in this study provide a more realistic basis for design, especially for high-traffic applications, ensuring that thickness and service life predictions align with field performance. By integrating these calibrated parameters, agencies can improve the reliability of ME design for porous asphalt systems and avoid premature failures, ultimately leading to safer and more cost-effective pavements.
Finally, the results of this study will contribute to the body of knowledge that can support future calibration of the Pavement ME distress model coefficients. The current model was developed from ME principles and full-scale testing data and therefore provides a more reliable prediction framework for PAPS, as illustrated in Table 5. The Pavement ME analysis of PAPs revealed limitations related to air voids, aggregate gradation parameters, binder content, and hydrological properties. However, this model needs to be verified with more field performance. Using Pavement ME version 3.0 further underscored the need for modifications in structural input definitions, additional provisions for hydrological properties, and the development of distress prediction models specifically tailored to porous asphalt mixtures.
Conclusions and Recommendations
This study developed and calibrated a rutting prediction model for full-depth PAPs using data from full-scale APT with an HVS. The key conclusions are as follows.
Approximately 64% of deformation occurs in the MOGFC layer because of its low confinement and open-graded structure.
The Pavement ME default global coefficients significantly underpredicted (Section 1: ∼60% and Section 2: ∼30%) rutting in full-depth porous sections, highlighting the need for calibration.
Calibration of k coefficients (
The empirical depth correction factor
The observed differences in calibration parameters across sections (Section 1:
The findings of this study led to the following recommendations.
Adopt the average calibrated coefficients (
Set the confinement factor
Integrate confined dynamic modulus testing as a standard input for mechanistic-empirical design of porous asphalt systems, reflecting in situ material behavior more accurately.
Incorporate localized calibration protocols into state-level Pavement ME design practices for innovative pavement types like porous asphalt.
Footnotes
Acknowledgements
The authors thank the New Jersey Department of Transportation for supporting this study.
Author Contribution
The authors confirm contribution to the paper as follows: study conception and design: Abhary Eleyedath, Abu Bakar Md Siddique, Ayman Ali, Yusuf Mehta; data collection: Abhary Eleyedath, Abu Bakar Md Siddique, Ayman Ali, Yusuf Mehta; analysis and interpretation of results: Abhary Eleyedath, Abu Bakar Md Siddique, Ayman Ali, Yusuf Mehta; draft manuscript preparation: Abhary Eleyedath, Abu Bakar Md Siddique, Ayman Ali, Yusuf Mehta. All authors reviewed the results and approved the final version of the manuscript.
Declaration of Conflicting Interests
The authors declared no potential conflicts of interest with respect to the research, authorship, and/or publication of this article.
Funding
The authors disclosed receipt of the following financial support for the research, authorship, and/or publication of this article: This research was funded by the New Jersey Department of Transportation under the Pavement Support Program.
Data Accessibility Statement
The datasets generated during and/or analyzed during the current study are available from the corresponding author on request.
Any opinions, findings, conclusions, or recommendations expressed in this material are those of the author(s) and do not necessarily reflect the views of the New Jersey Department of Transportation.