
Abstract
This study investigates the factors affecting transit ridership at the stop level, including the effect of business establishment attributes. Using a large-scale passenger boarding and alighting data set, a mixed-effects hierarchical regression modeling technique is employed to capture the heterogeneity of various attributes considered in the weekday and weekend ridership analysis. Key findings reveal that population density significantly affects ridership, with higher values increasing ridership. Higher-income individuals are more likely to use personal vehicles, and the model shows a negative effect on ridership. Single-detached households, larger household sizes, and higher employment rates also have a negative effect on ridership, especially during the evening hours. Proximity to educational institutions and healthcare facilities is associated with lower ridership, and locations such as commercial banks, insurance agencies, parks, studios, consulting services, engineering services, and law offices show higher ridership. Proximity to highways, downtown, and more bus routes increases ridership, and longer wait times and parking facilities decrease it. This study also finds that professional and technical services, as well as dining out and weekend partying at restaurants, positively affect ridership. Retail and wholesale services negatively affect ridership, suggesting a preference for personal vehicles and active transportation modes. In addition, larger employee sizes contribute to increased ridership. Insights from this study, such as enhancing transit access in densely populated and low-income areas, fostering business development, providing more frequent and varied routes, improving infrastructure, reducing wait times, and increasing bus routes, can help policymakers substantially increase transit ridership. This study model can also predict future ridership based on business changes, which is important as e-commerce and remote work evolve in the post-pandemic era.
Background
Public transit is an excellent way to achieve environmental sustainability and a key strategy for enhancing accessibility, supporting efficient urban form, and coordinating transportation with land use planning. It helps reduce transport emissions by enabling the mass transportation of people. By accumulating many passengers, transit helps reduce congestion and lowers the probability of high-accident scenarios ( 1 , 2 ). In Litman ( 3 ), adding vehicle lanes is not an efficient solution for increasing mobility, but implementing a well-designed transit system can effectively address this issue by streamlining vehicle movement. As urban populations grow and travel demand rises, public transportation offers a cost-effective and equitable alternative to private vehicle use, particularly for individuals without driving licenses or access to cars ( 4 ). To accommodate the growing demands of urban mobility, public transit plays a significant role in reducing the need for parking facilities and contributes to more efficient and compact infrastructure development. When planning for accessibility, it is important to connect transportation systems with surrounding land uses. Effective transit can help create well-functioning and accessible areas that serve a wide range of people ( 5 ).
The International Energy Agency analysis projects that the number of automobiles in North American nations may double by 2035 and may even triple by 2050 ( 6 ). The rising number of automobiles presents a significant challenge for infrastructure development and is likely to increase traffic congestion and environmental degradation in the future. In response, many urban regions are enhancing or considering improvements to their public transportation infrastructure to curb car dependency and support long-term sustainability. Major Canadian cities, such as Toronto and Montreal, are actively investing in expanding and modernizing their transit networks ( 7 ). However, because of COVID-19, the number of people using public transportation has significantly decreased, adding an extra layer of difficulty to promoting its use. Ridership fell sharply early in the pandemic and has not recovered to prepandemic levels globally ( 8 ). Other forms of transportation are returning to previous levels of use, except public transit. The modal share of public transportation increased significantly from 6.8% in 2021 to 10% in 2023. Even with this upward trend, the share is still below the 12% attained in 2016 in Halifax ( 9 ). Figure 1 shows the modal share across various cities in North America ( 10 , 11 ).
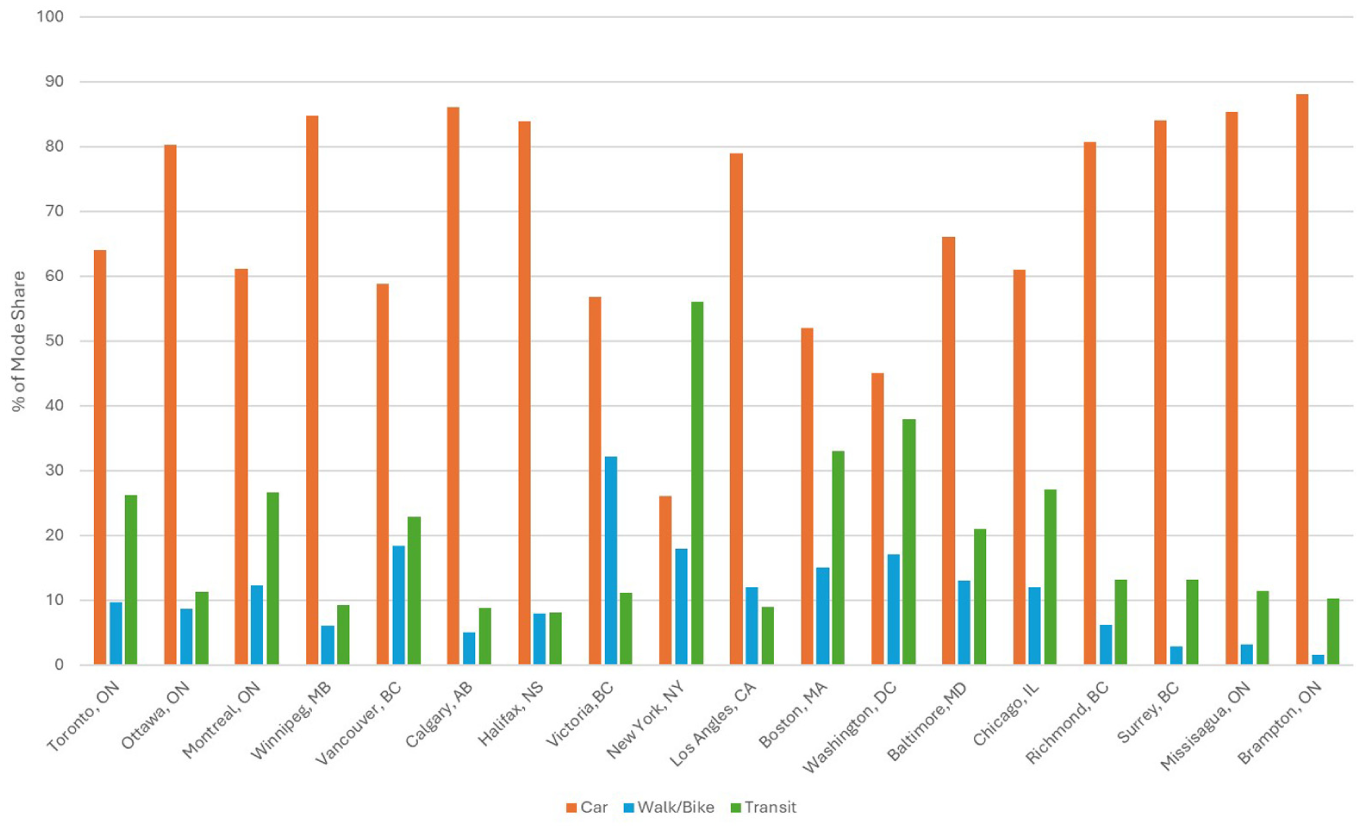
Modal share across various cities.
This figure shows that Halifax is trailing behind in the sustainable transport share. In Halifax, 83% of trips are by car, with less than 10% attributed to transit. In contrast, major Canadian cities boast transit shares exceeding 20%, and some US cities perform even better. To reverse this trend, it is essential to address factors that encourage public transit use, particularly the role of businesses and activity zones in influencing travel behavior ( 12 , 13 ). Travel demand is closely linked to people’s activities and can be more accurately predicted using detailed data on business establishments ( 14 ). Individual built environment factors have a limited effect on travel behavior; their combined influence is substantial. Transit use is strongly shaped by proximity to transit, street network design, and land use diversity ( 15 ).
The factors influencing ridership are generally of two types: (1) user perspectives; and (2) analysis of direct factors. User perspectives analyze the perception and choice of the transit user, and direct factors involve the service, environment, and characteristics and nature of the built environment ( 16 – 18 ). Many studies suggest that ridership is highly dependent on the urban spatial structure and work locations ( 19 ). Therefore, more detailed aspects of the urban built environment should be included when studying factors that influence transit ridership ( 20 ). Although many studies have examined the influence of the built environment on transit ridership, they often rely on aggregated spatial units, such as dissemination- or county-level data, and typically focus on broad indicators such as density, population, and demographic factors like income and age. However, these traditional models often overlook disaggregated data and local factors. These factors can significantly influence boarding and alighting behavior. In particular, the presence and role of business establishments near transit stops play a crucial role in shaping these patterns. This gap is especially relevant post-COVID-19, where remote work and the rise of e-commerce have led to widespread business closures and altered urban activity patterns. Transit agencies require more policy-relevant tools and models to predict ridership for better operational and strategic planning ( 21 – 23 ).
To address this limitation, this study takes a stop-level approach, integrating detailed data on business establishments and exploring unobserved heterogeneity in ridership behavior. Unlike traditional models, which often assume homogeneity across transit stops or spatial zones, this study captures the unique characteristics of each stop’s surrounding environment and the directional nature of trips by examining boarding versus alighting. The objective is to assess how stop-level ridership is influenced by business activity, built environment features, service quality, accessibility, and connectivity. By quantifying these relationships, this study provides transit agencies with more policy-relevant and operationally useful insights for predicting ridership, particularly in the post-pandemic recovery. For instance, Halifax Transit can use time-specific boarding and alighting patterns to better anticipate bus occupancy levels and optimize vehicle fleet allocation. Ultimately, this study contributes to a more nuanced understanding of transit use and offers a significant departure from conventional modeling frameworks, providing practical tools for strategic planning and day-to-day operations. The structure of this study is as follows: Literature review, data and methodology, analysis and results, and discussion and conclusion.
Literature Review
Public transit is one of the most sustainable options for travel, offering efficiency and affordability ( 3 , 24 ). To increase ridership in public transit, it is important to evaluate the factors affecting it, particularly at the stop level. In European countries, public transit use is quite remarkable because the built environment entails supporting factors ( 25 , 26 ). Many countries are investing heavily in public transit and supporting spatial structures ( 27 – 29 ). In countries such as Japan, public transit systems are well-designed to provide adequate, affordable service to people and maintain social equity ( 30 ). However, in North America, people still have a car-oriented mindset. In large cities such as Toronto, the use of public transit is somewhat common but not as prevalent as in Europe ( 7 , 31 ). There are some studies on factors affecting ridership in these big cities; however, there is a lack of studies on growing cities such as Halifax. Halifax is currently the second-fastest-growing city in Canada, with increasing demand for transportation as the population grows. However, bus ridership in these areas remains relatively low compared with the increasing number of travelers. In North America, land use and transit planning are often disconnected, leading to zoning that limits dense development near transit. This contributes to car-oriented cities and underused transit systems. Studies suggest that better integration can support the development of dense, mixed-use, and mixed-income communities, which offer environmental, economic, and mobility benefits. Higher density and improved accessibility enhance transit viability and ridership ( 32 ). Many small cities in Canada have bus services and other facilities that are underutilized ( 33 ). This is gradually increasing the number of private vehicles on the road and raising emissions. Therefore, to reduce emissions in the transportation sector, it is crucial to understand why transit use is low. The transportation sector globally produces significant emissions, and increasing transit use can help reduce them by reducing excess vehicles on the road ( 34 ). To analyze and uncover the links among variables affecting ridership, advanced information and communication technology can be instrumental. Improved data collection helps overcome limitations and low response rates. Factors such as land use, demographic characteristics, and travel demand influence ridership, with external and internal factors at play. Internal factors include transit fare, service quality, and vehicle comfort ( 16 ). Given that transit quality in Halifax and Canada is generally adequate, this study focuses on external factors, specifically the effect of business establishments on transit ridership.
The Canadian Transit Study ( 7 ) suggests that transit ridership factors are associated with the built environment, socioeconomic characteristics, transit service quality, and external influences. Many studies analyze transit ridership at the route level but often assume uniform service and land use along routes. This assumption is flawed, especially for routes that pass through areas with significant variations in land use and sociodemographic characteristics, such as downtown-to-suburb routes ( 35 ). At the aggregate level, key factors such as population, population density, and employment rate are commonly used to understand transit ridership trends ( 32 , 36 ). Many studies have utilized sociodemographic information from census tracts around areas that are serviced by public transit to explain observed ridership and particularly the effects of small changes in service on overall ridership ( 2 , 7 , 21 ). Chakour and Eluru ( 37 ) estimated econometric models of boarding and alighting for weekdays, weekends, and peak periods. According to Chakraborty and Mishra ( 32 ), population characteristics, such as the share of college students, population in poverty, average income, proportion of recent immigrants, and ethnic composition, are acknowledged as significant external socioeconomic factors. Wang and Woo ( 38 ) found that poverty rates and low-income populations in suburban areas, compared with downtown and inner-city areas, positively influenced transit ridership. Their findings also indicated that transit usage increased with higher proportions of renters and minorities. In addition, younger generations tend to use transit more frequently than older populations ( 39 ).
The COVID-19 pandemic has brought significant changes to work arrangements and psychological effects on transit use. Public transit ridership dropped sharply during COVID-19 and remains below prepandemic levels. In Halifax, transit use remains lower than in 2016, and other modes of transport have recovered ( 9 ). Many people now fear using transit because of high ridership. Carvalho and El-Geneidy ( 40 ) used clustering to identify changes in ridership among different groups of people, considering telecommunications and captive transit users in their study as well. Few studies have identified subgroups who are transit-captive and more likely to take transit, such as recent immigrants, students, unemployed individuals, and seniors ( 41 ). Land use variables, including population density and parking availability, have been identified as contributors to ridership as well. Since the pandemic, increased rates of telework have been associated with declining transit ridership ( 42 ). However, accessibility to public transit buses is also recognized as a critical factor ( 43 ). Built environment attributes have been examined to some extent; the influence of location and economic characteristics of business establishments, such as sales volume and employee size, remains unclear. As business officials express concerns about the closure of brick-and-mortar retail stores and teleworking trends, it is crucial to better understand how ridership relates to business attributes and other relevant factors identified in the literature.
Data and Method
Study Area
This section covers the data used in this study. The study area for this research is the Halifax Regional Municipality (HRM), the largest city in Atlantic Canada, with a population of 480,000. With a rapidly increasing population, demand for transportation is changing quickly. According to the 2022 Halifax Travel Activity survey, 83.5% of mode share is private vehicles, and transit accounts for only 8.6%, and walking accounts for 7.9% ( 44 ). Figure 2 shows this study area.
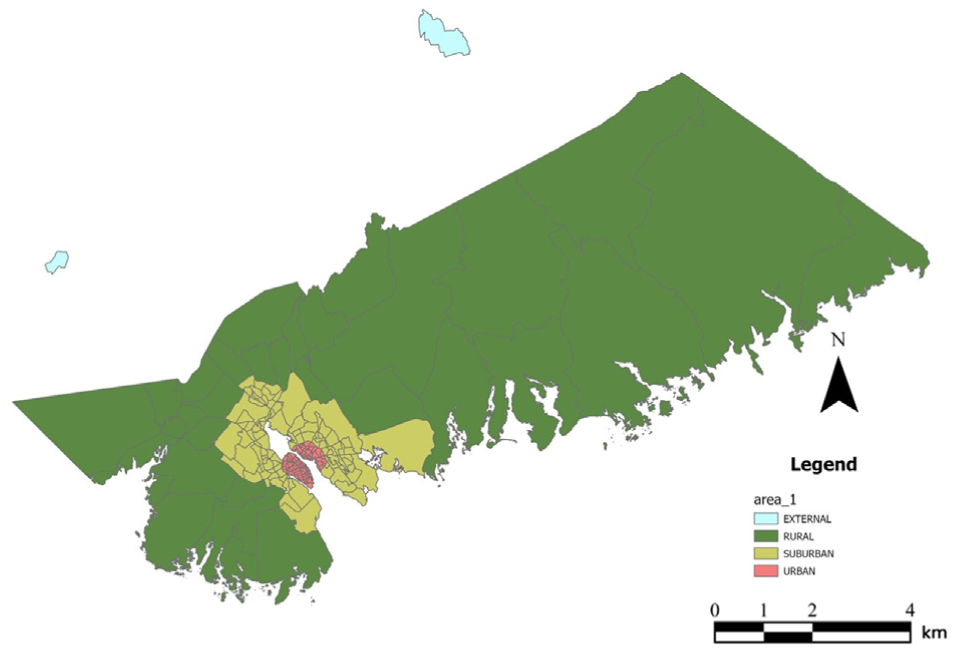
Study area: Halifax Regional Municipality.
Data Collection
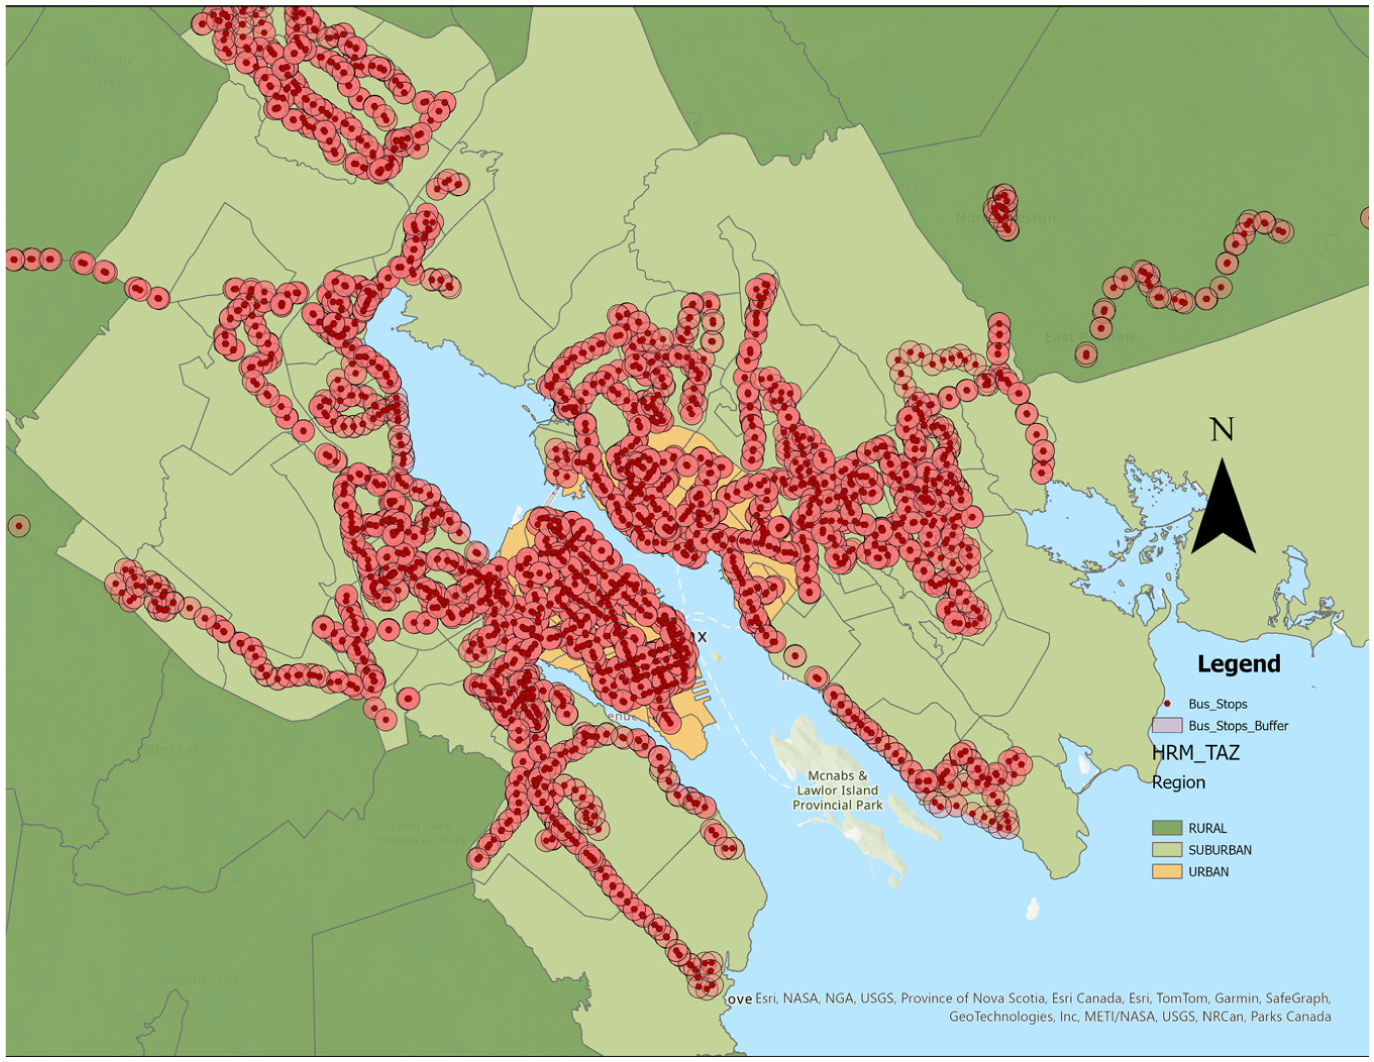
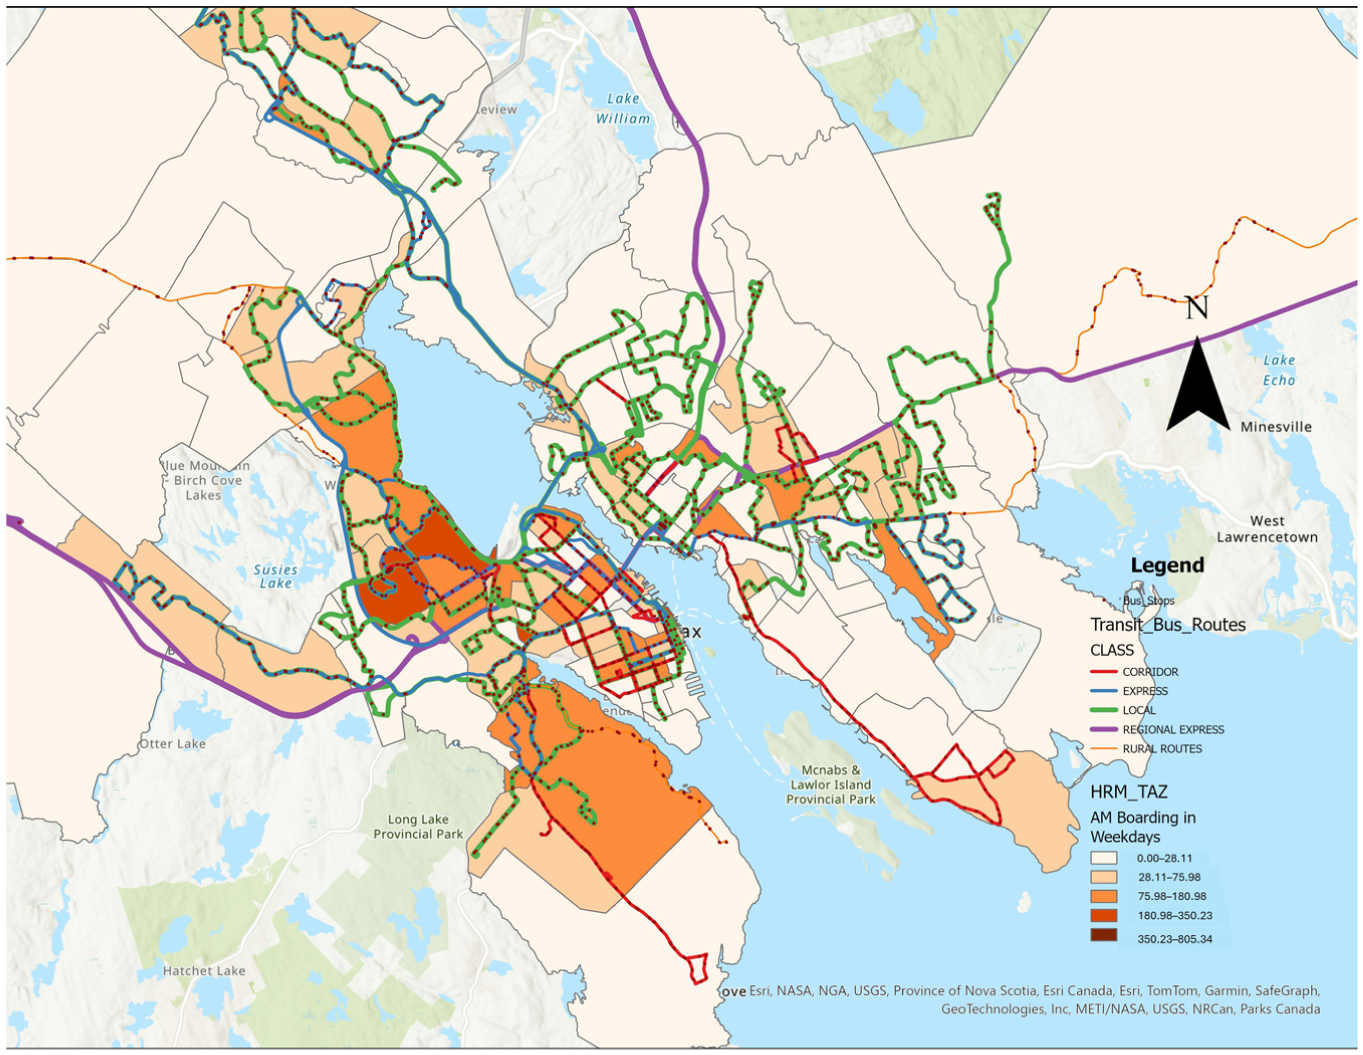
This study aims to analyze the factors influencing ridership at the stop level. Data is collected from several sources to achieve this objective. The first data set is the ridership data at the stop level. Bus ridership data is collected by HRM’s Automated Passenger Count system. The ridership data used in this study represent 2022 and 2023. It employed computer programming and ArcGIS Pro software for data processing. Primarily descriptive and summary statistics for the data analysis are performed utilizing Python programming. Then, to analyze all attributes and determine the factors affecting transit ridership, a multilevel, mixed-effects linear regression modeling framework was developed. Figure 3 shows some bus stops and routes in the urban HRM region. In the HRM, bus routes are divided into several categories, including corridor, local, express, regional express, and rural services. Figure 3 shows the distribution of these routes across the HRM. Corridor and local services are the most common; there is a significant presence of express routes ( 47 ).
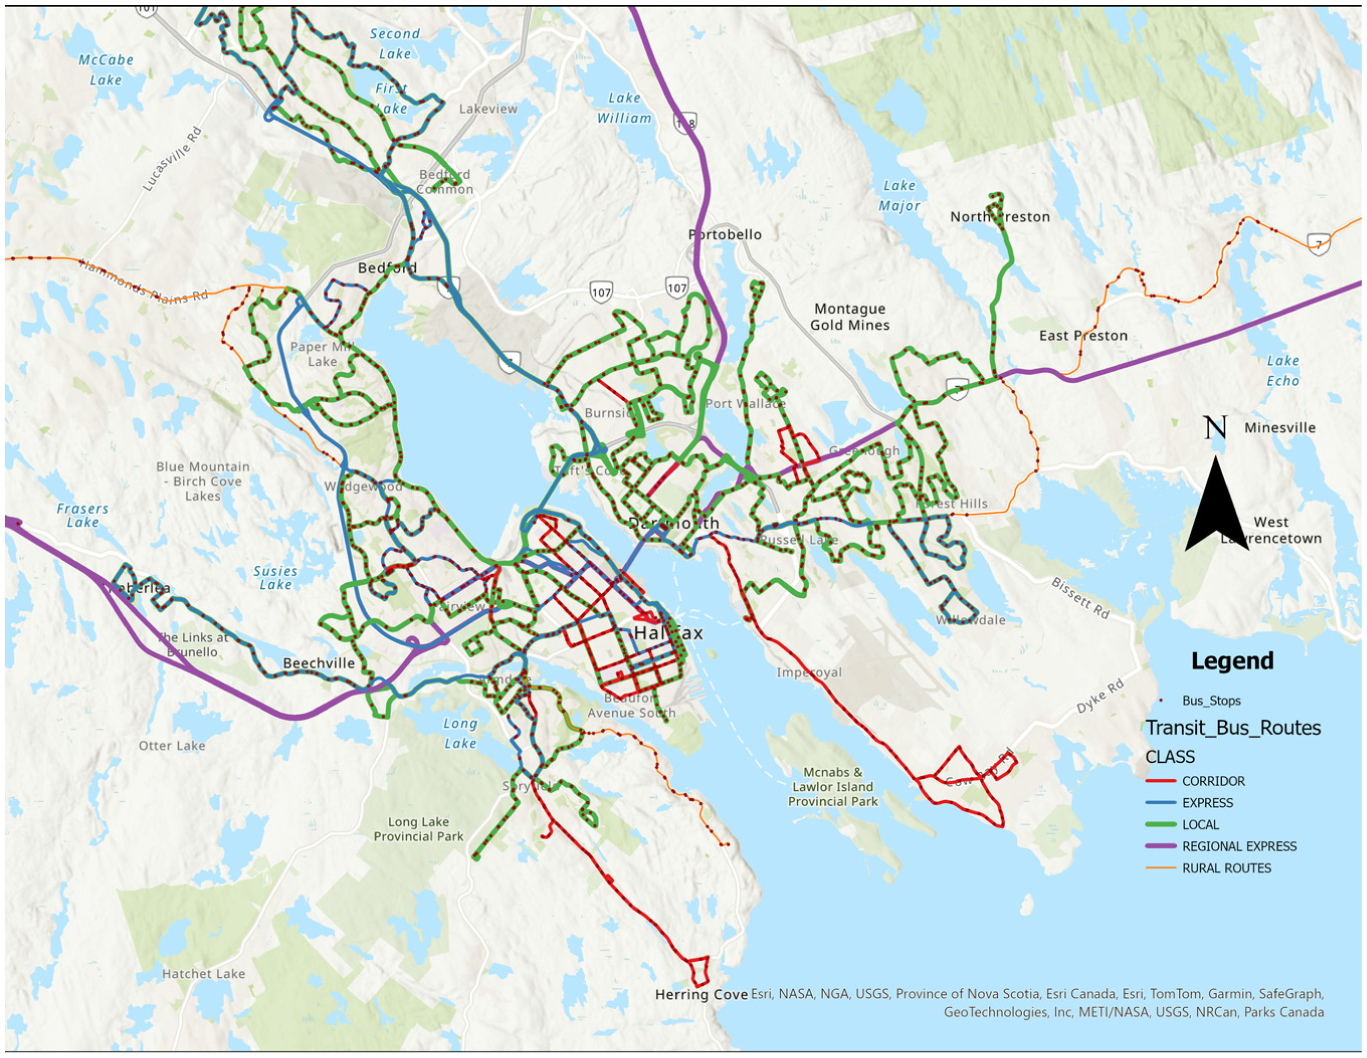
Bus stops and bus routes in the urban Halifax Regional Municipality region.
Second, the road network and bus stop locations are collected from the Nova Scotia Geographic Data Directory and the Halifax Open Data source. Finally, business establishment data from Data Axle Canada ( 45 ) and Dissemination Area (DA) level data from Statistics Canada ( 46 ) are used for the built environment data and to capture some socioeconomic characteristics of the areas served by the bus routes.
Descriptive Summary
Analyzing Halifax Transit ridership data shows two major weekday peaks: one around 7:00–8:00 a.m. and another around 3:00–5:00 p.m. The evening period has relatively higher ridership than the morning peak. During weekends, the scenario is quite different. There are no significant peaks on weekends, although two peaks are noticeable: the morning one around 9:00–10:00 a.m., with a gradual increase in ridership at noon. By early evening, the ridership decreases significantly. There is a notable difference in ridership between weekdays and weekends. Saturday and Sunday are considered weekends, and the rest of the days are weekdays. People usually use public transit more during the week for work. Figure 4 shows the variation in daily ridership throughout the week, where the highest ridership generally occurs in the middle of the week. Ridership is usually lower at the beginning of the week (Monday) and at the end of the week (Friday). On weekends, Saturday has higher ridership than Sunday because many attractions are closed on Sundays.
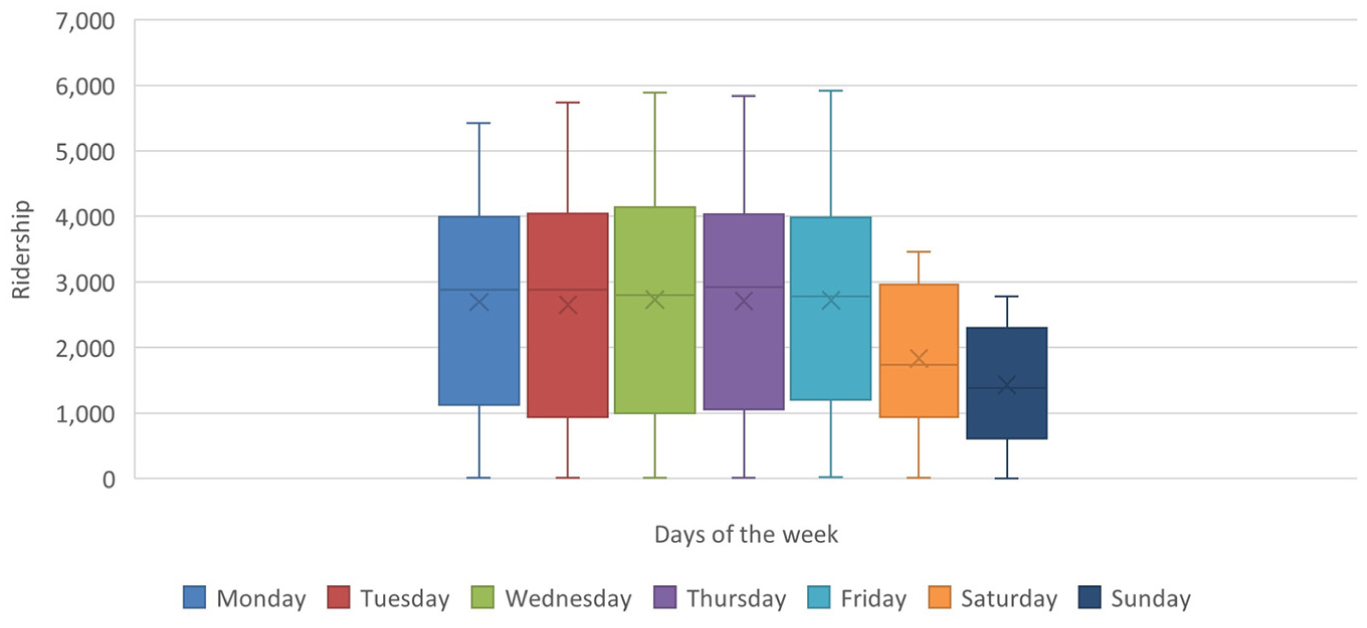
Daily ridership of all bus stops.
Figure 5 shows the hourly ridership throughout the week to understand the ridership density during peak times. Halifax Transit service generally starts at 5:30 a.m., with the exception of express (limited-access) buses, which start as early as 4:00 a.m., and runs until 1:00 a.m. The start time of the hour interval is used to represent the time, as shown in Figure 5. There are also some off-hours in the transit system timetable when no bus services are available.
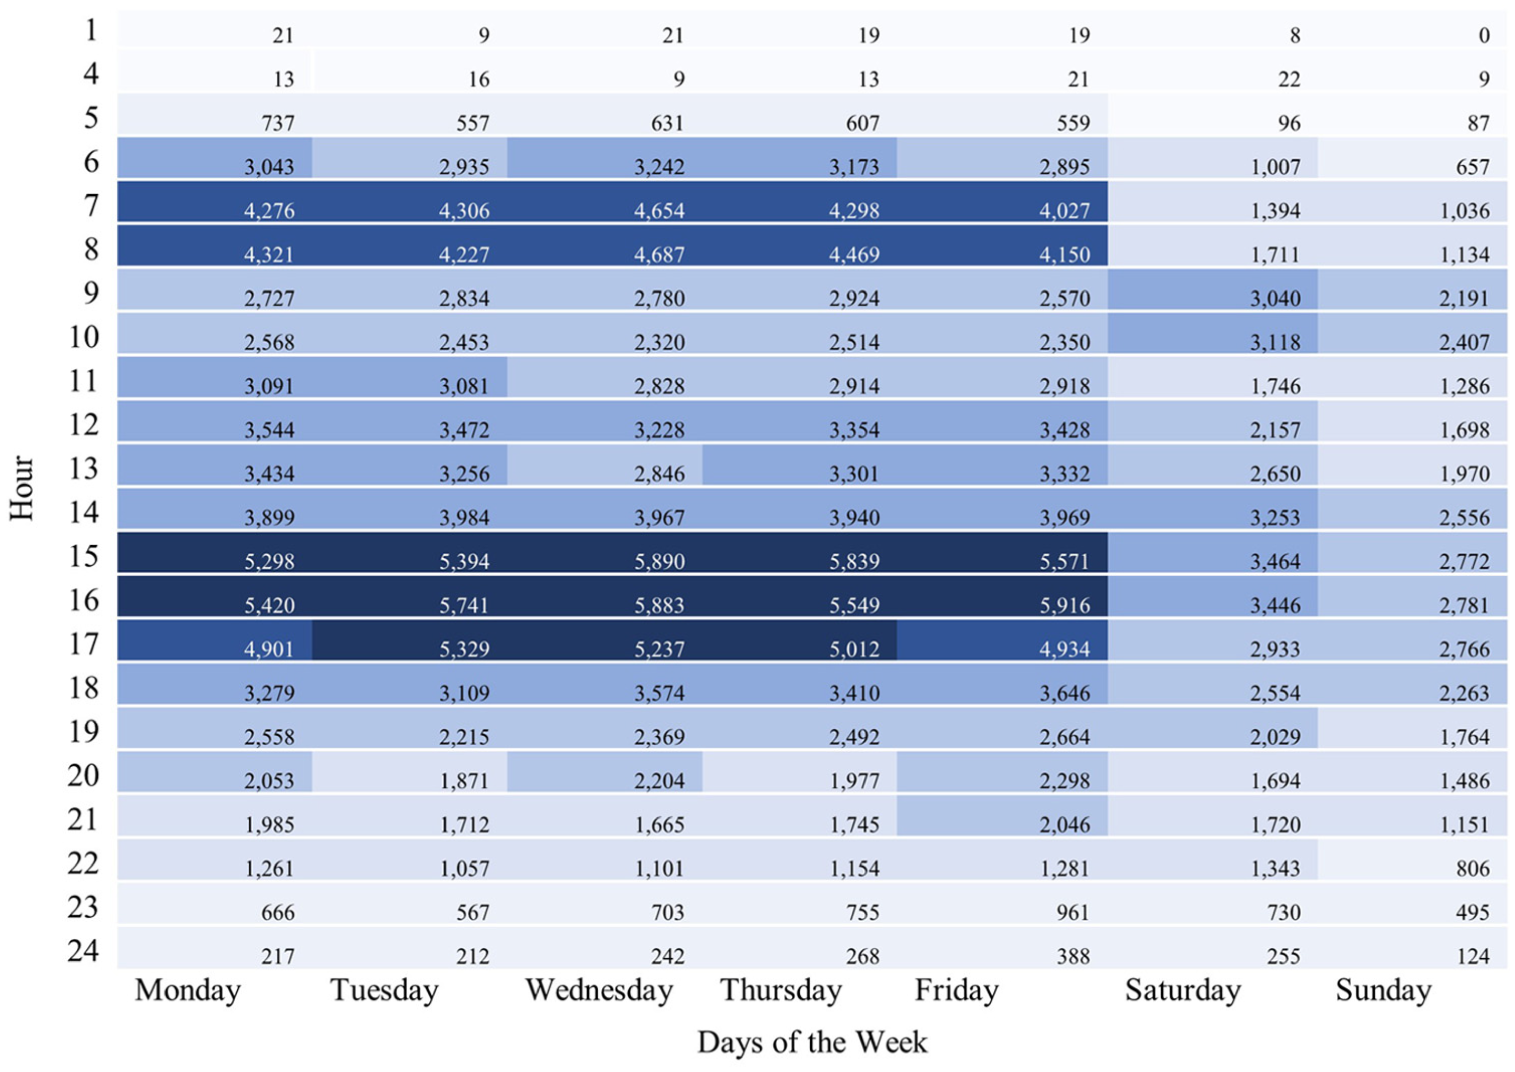
Total hourly ridership distribution of the day.
In Table 1, the ridership statistics for the stop level are given, and 2,405 bus stops in the HRM are considered in this study. The stop-level ridership closely mirrors the overall transit scenario. Halifax Transit operates more than 70 bus routes, including corridor, local, express, and regional routes. Corridor routes serve a high volume of passengers, with 11 express and three regional routes ( 47 ). The regional bus routes are not included in this study. In total, approximately 350 diesel-powered buses are in operation in Halifax ( 48 ).
Summary Statistics of Ridership at Stops
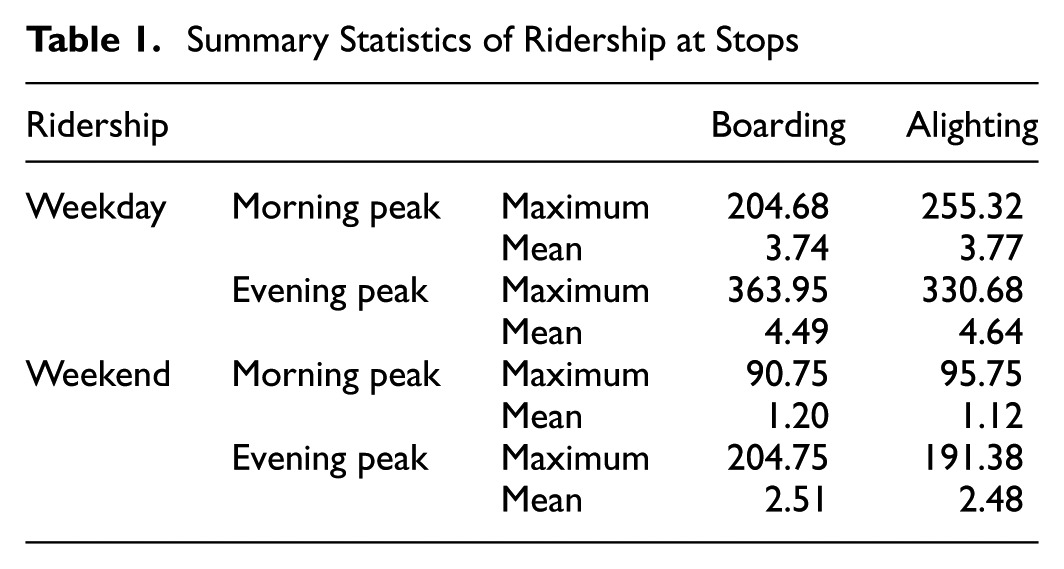
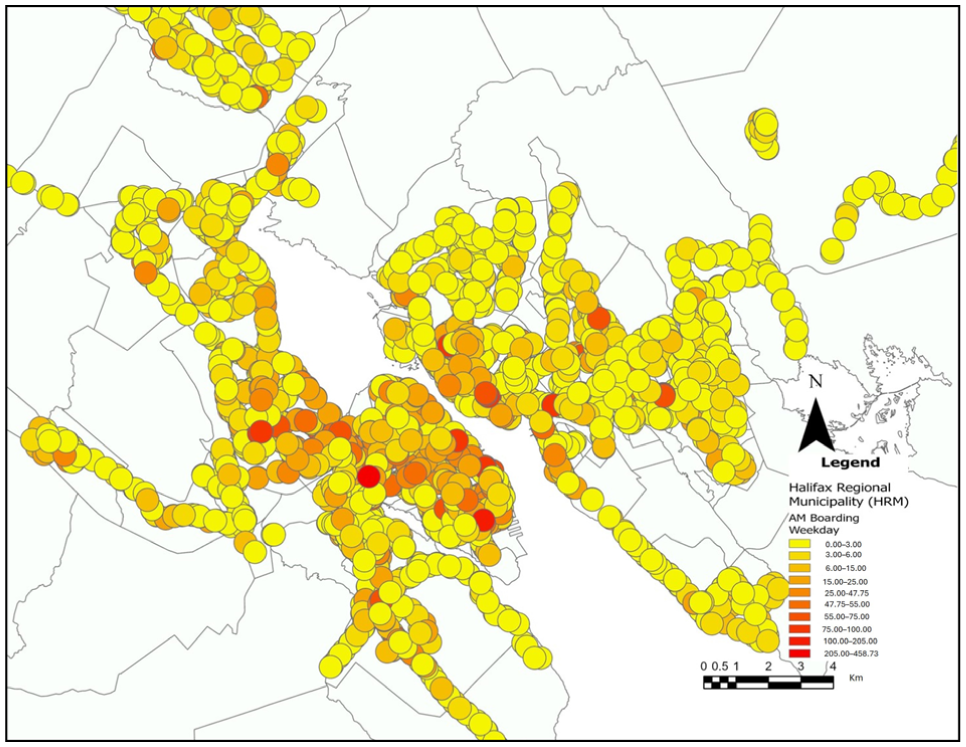
Table 1 presents the ridership data for bus stops in Halifax, showing the hourly average ridership during peak and off-peak periods. Morning peak hours are defined as 7:00 a.m.–9.00 a.m., and the evening peak spans a longer duration, from 3:00 p.m–5:00 p.m. During off-peak hours, such as around noon, ridership reaches a maximum of 116 passengers, with an average of approximately 1.01 passengers per stop. However, by late evening (around 9:00–10:00 p.m.), the maximum ridership drops to 56.09, with an average of less than 0.58 passengers per stop. Ridership further declines on weekends, with a maximum of 68.39 passengers recorded around 11:00 a.m. and a sharp decrease to just 23.21 passengers by 8:00 p.m. Of interest, the off-peak period exhibits a relatively broad and stable range of activity, reflecting passengers’ reliance on transit throughout the day and indicating emerging activity patterns. Figure 5 shows the total ridership variation across all bus stops in Halifax. Darker shades represent higher ridership levels. This figure highlights that temporal variation during off-peak hours is relatively low, and transit usage significantly diminishes during late-night hours, particularly for non-bus services. The weekday peak period scenarios are shown in Figure 6. Darker shades indicate higher ridership. The spatial distribution is zonal-based and shown for the 222 traffic assignment zones (TAZ) in Halifax, 95 of which are urban.
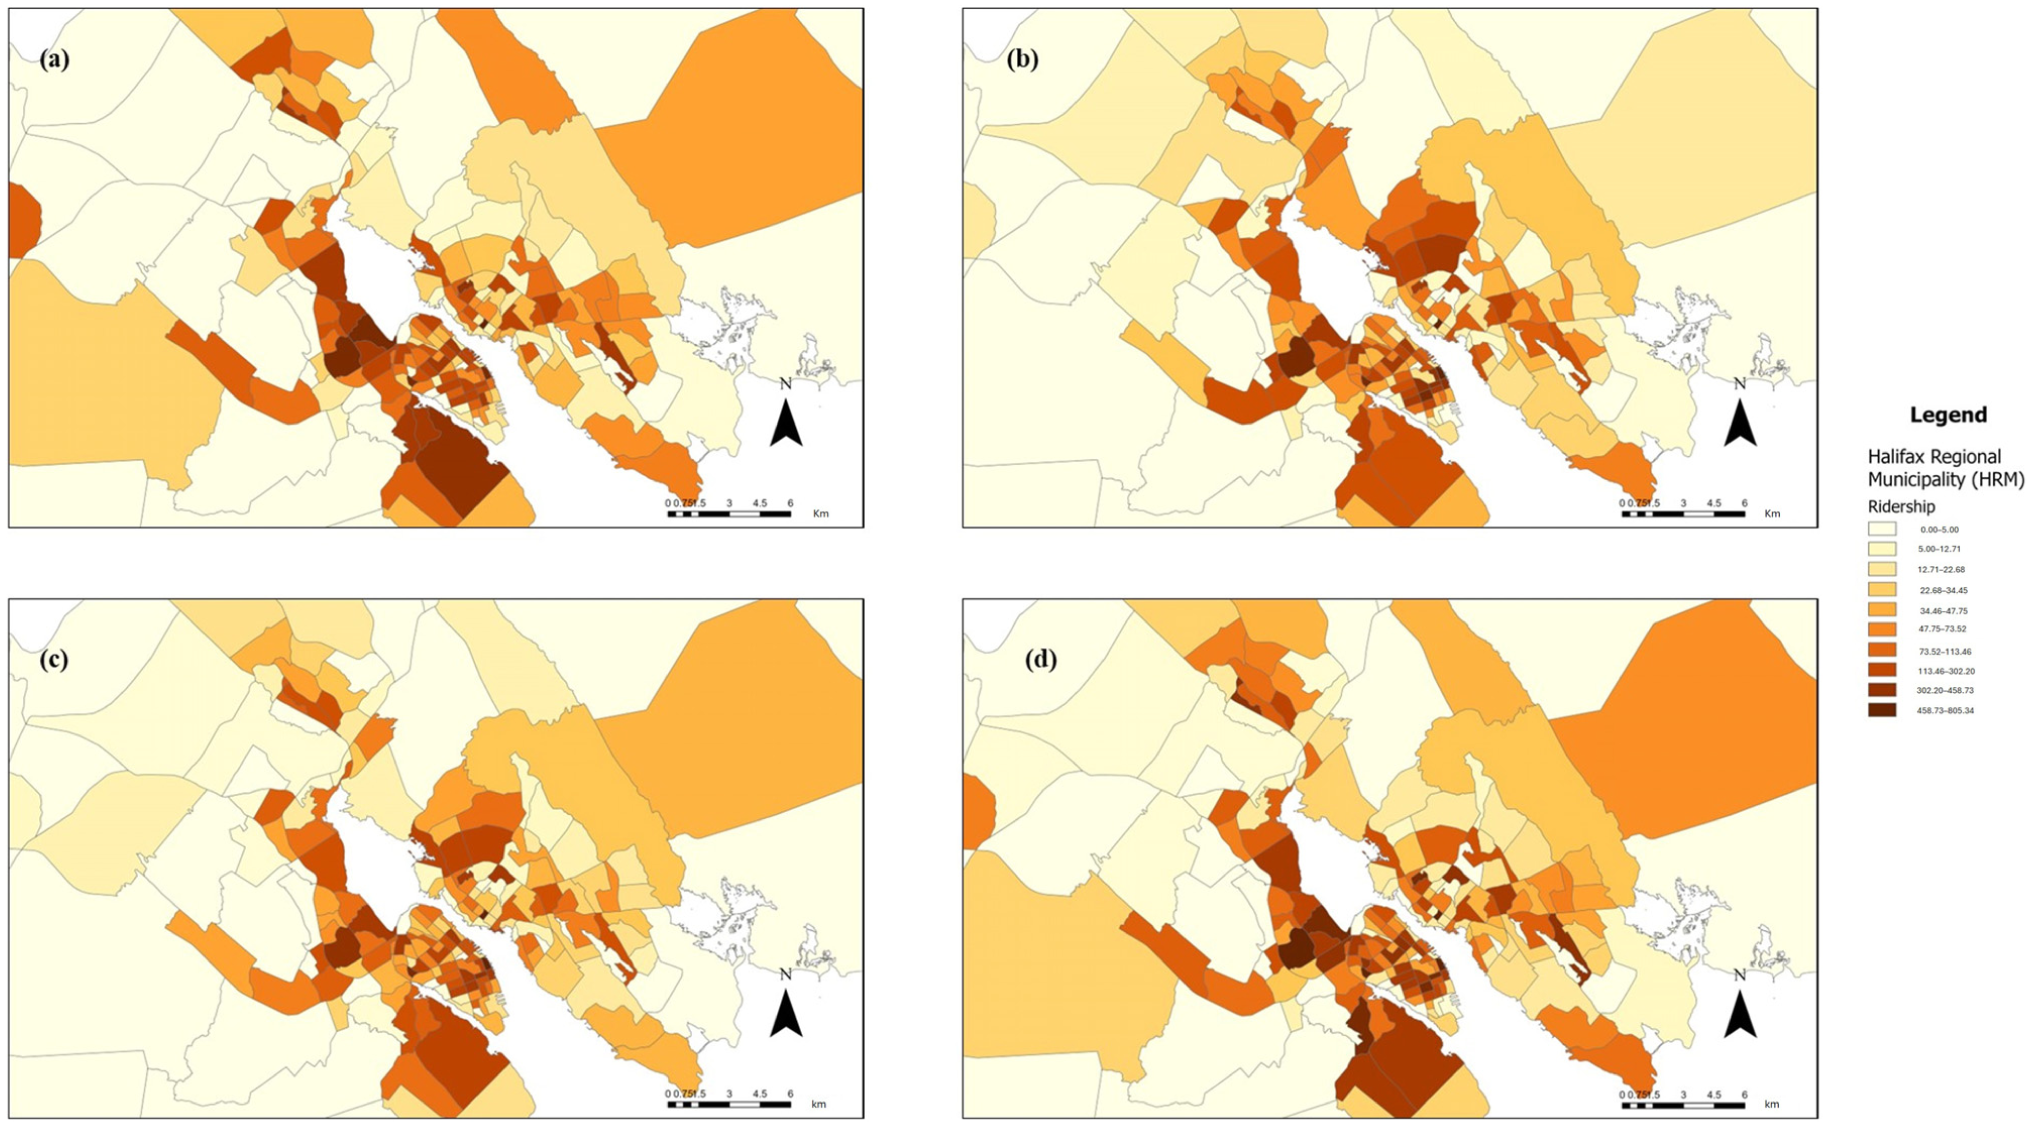
Weekday ridership in Halifax: (a) AM boarding; (b) AM alighting; (c) PM boarding; and (d) PM alighting.
Figure 7 shows an overview of the buffer zone around the bus stops, focusing on an 800-m radius. Because of the density of stops in urban areas, some overlap between buffers was expected. This overlap was assumed to reflect shared environmental influences, such as nearby commercial zones affecting multiple stops. Each buffer was treated as an independent observational unit, based on the assumption that ridership is primarily influenced by the immediate surroundings of each bus stop.
Bus stop buffer areas in Halifax Regional Municipality (HRM).
Figure 8 shows ridership around bus stops in the downtown core of Halifax. This figure highlights a significant number of high ridership bus stops, with approximately 100–200 riders during the morning peak hours. Despite the presence of three major universities in the southern part of downtown, ridership in these areas is relatively low. This is largely because downtown Halifax is a highly walkable city, featuring approximately 967 km of concrete and asphalt sidewalks ( 49 ). Many students reside within walking distance of the universities, reducing their reliance on transit in this area.
Morning peak ridership patterns at bus stops in downtown Halifax.
During weekday mornings, boarding is particularly high in residential areas far from the downtown core, and alighting is concentrated in the downtown core, where most offices and work facilities are located. In the evenings, this pattern is reversed: boarding is highest in the downtown core, with passengers alighting further from downtown. Halifax’s urban core also shows a concentration of business and apartment buildings. New construction sites are increasingly featuring apartment buildings, and older parts of the city mainly consist of single-family homes or row houses in the downtown area (Figure 6).
Of interest, bus ridership in Halifax displays diverse patterns in the express bus routes. In most cities, express buses usually have more riders; however, in Halifax, they often have fewer. Some areas along express routes do have higher ridership, but it is actually the local buses in these areas that are more popular, showing stronger demand for local services.
This study considered multiple types of socioeconomic and built environment attributes, which can be categorized as: (1) socioeconomic and housing attributes; (2) accessibility measures; and (3) business establishment attributes. Based on the literature review, variables such as population density, employment, household size, education, income, transit service frequency, the number of bus routes serving each stop, walkability score, and the distance from the downtown center to each stop are considered in these groups ( 2 , 13 , 37 ). In addition, the number of residential units, offices, parks, hotels, restaurants, educational institutions, health centers, and business centers is included. Using business establishment data in a geographic information system (GIS), variables are computed for each stop level. Buffer zones are created around each bus stop, with facilities within an 800-m radius considered accessible to that stop ( 50 ) (Figure 9).
Transit ridership across bus routes.
GIS aggregates attributes around each bus stop to generate quantitative measures. To aggregate business establishment data, the establishments are classified into six major groups: (1) industry; (2) retail; (3) service; (4) transportation; (5) wholesale; and (5) unclassified (for establishments serving multiple purposes that do not fit neatly into one category). In the industry category, establishments in construction, manufacturing, agriculture, fishing, forestry, hunting, mining, and oil and gas are considered. Similarly, in the retail category, establishments such as supermarkets, grocery stores, pharmacies, liquor stores, electronics stores, furniture stores, gift shops, and souvenir shops are included. To enhance this study, these categories are further disaggregated. For example, the service category is broken down into education, healthcare, and recreational services. A summary description of these establishments and other attributes is provided in Table 2. Details on the types of business establishments are provided in this table. Figure 10 shows examples of business establishments in Halifax.
Summary Statistics of Attribute Used
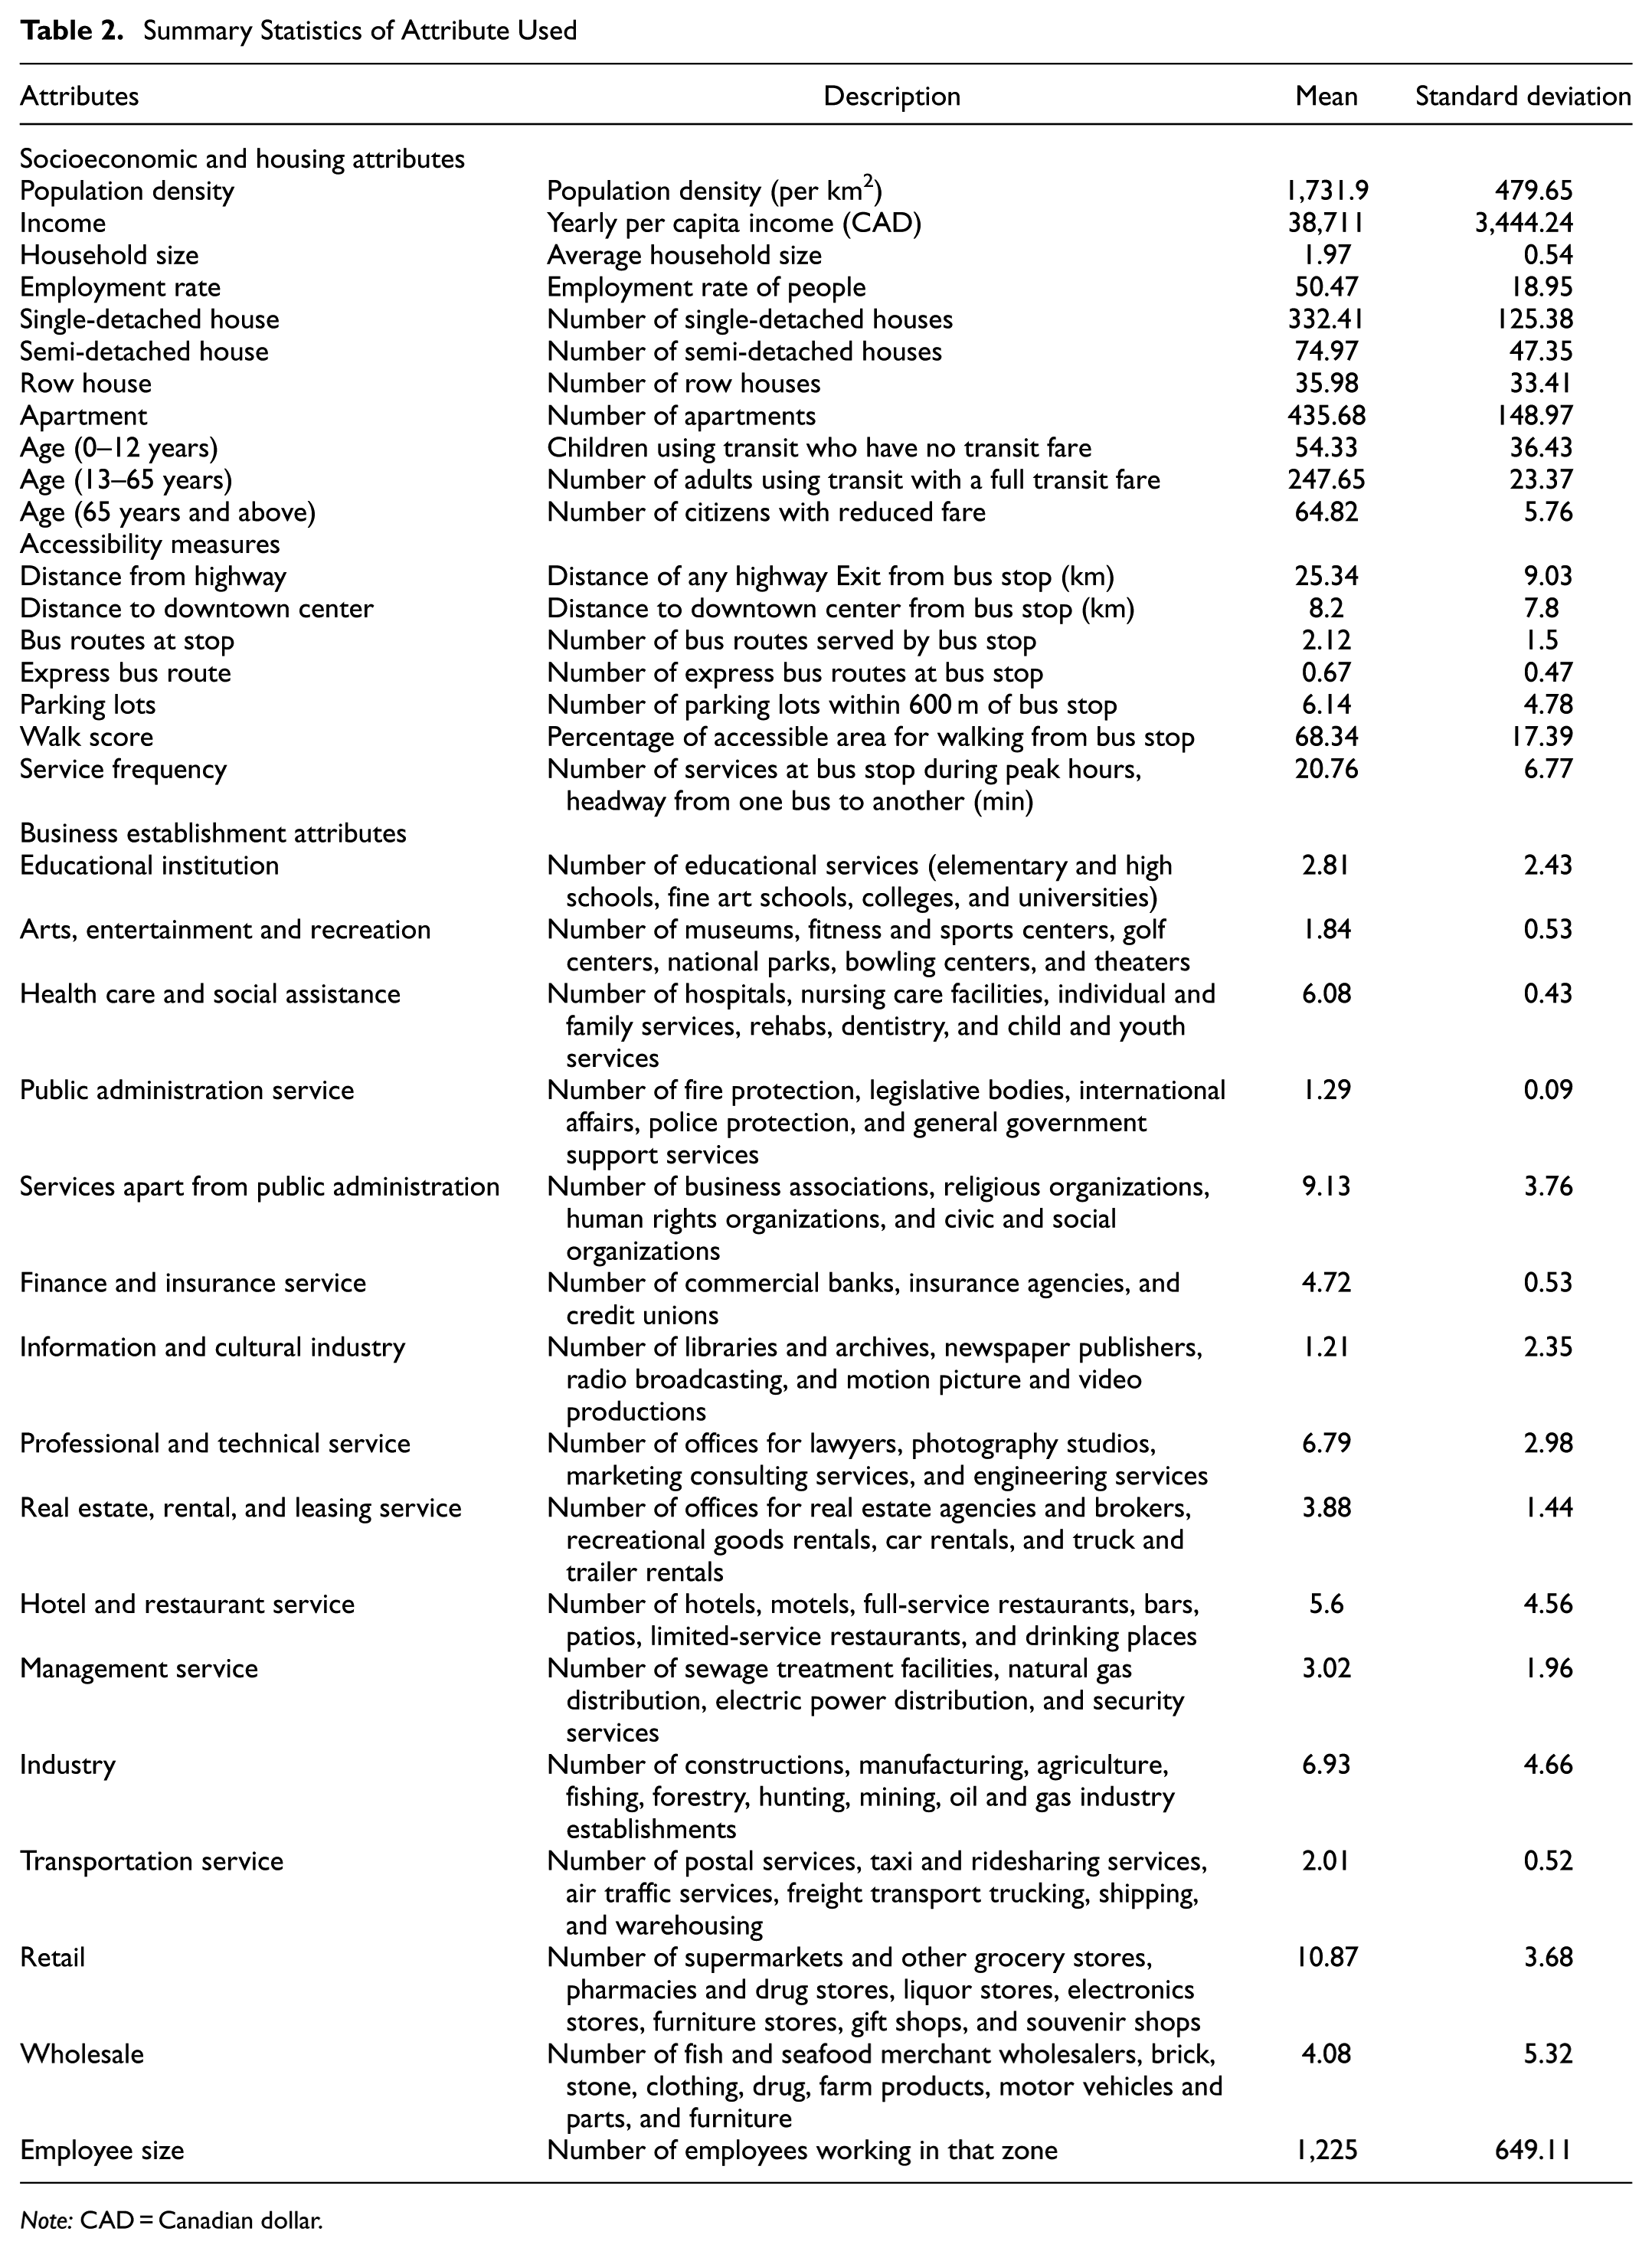
Note: CAD = Canadian dollar.
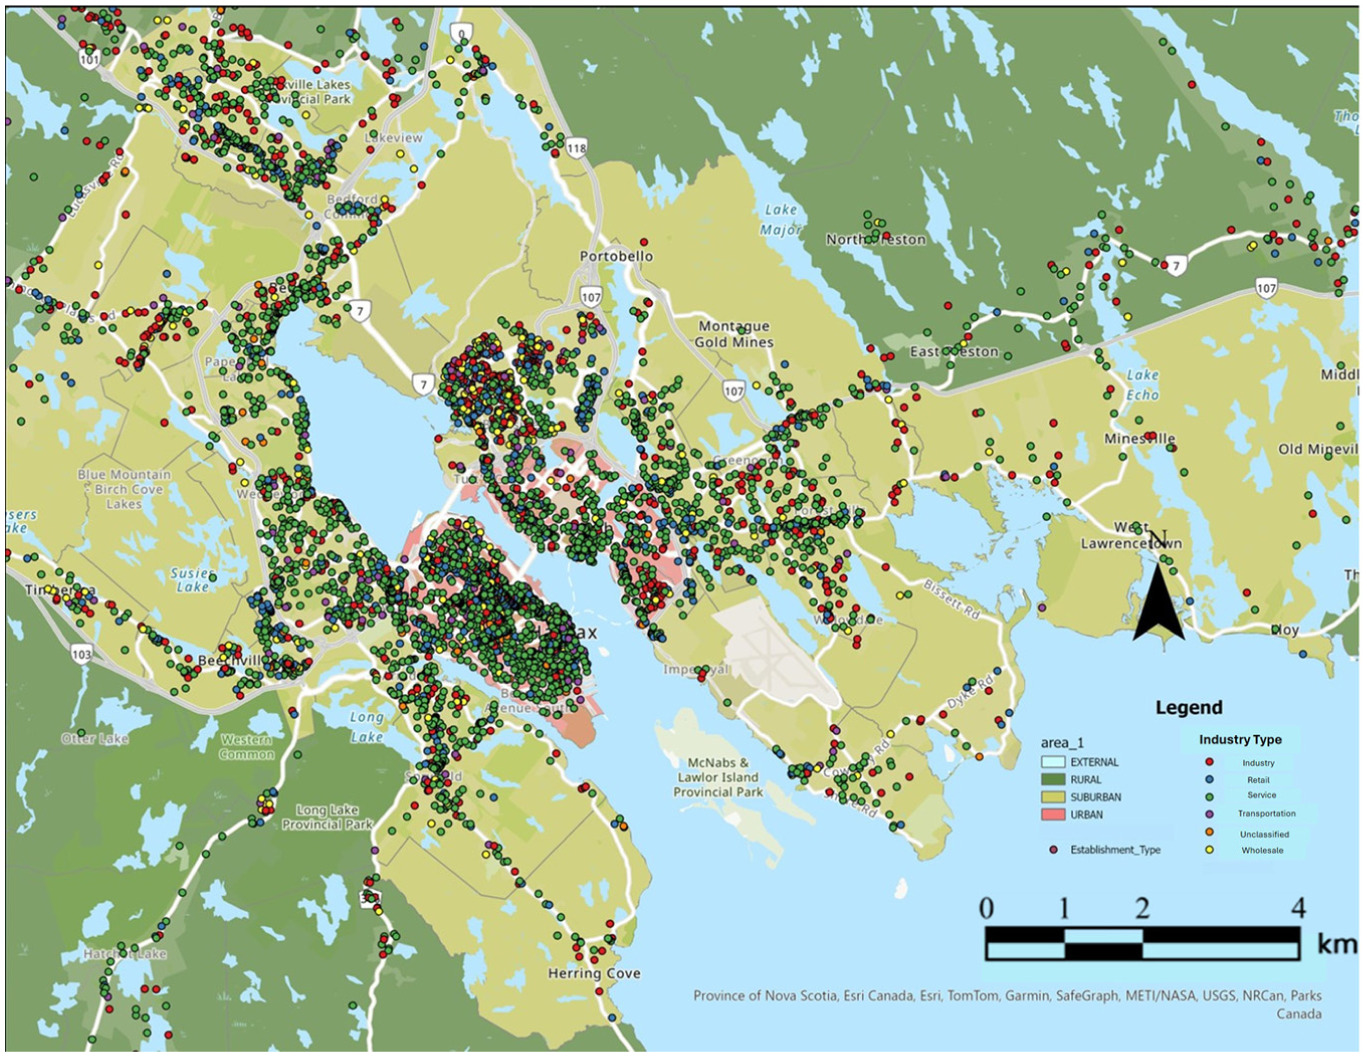
Location of business establishments in Halifax.
Table 2 displays the mean and standard deviation for 34 attributes, categorized into three major groups. The socioeconomic and housing data are derived from the DA level, and other attributes are based on the bus stop buffer zones. The data gives an overview of Halifax, where population density is around 2,000 people/km2, suggesting a balance between urbanization and space. Halifax is transit- and walk-friendly, with a 70% walk score. Average service frequency of 20 min during peak hours (± 5–6 min) in Halifax. Common establishments near bus stops include grocery stores, drug stores, and liquor shops, and healthcare facilities such as hospitals, child care, and family services are well represented. Other businesses are from one to four establishments, with a standard deviation between 0.5 and 2.5.
Method
This study used multilevel mixed-effects linear regression for ridership modeling, which is suitable for hierarchical data with structured or nested characteristics. This approach captures the fixed and random effects of the variables. Fixed effects are presented as coefficients, and random effects are captured as intercepts. The coefficients represent the average change in the dependent variable for a one-unit change in the predictor, holding all other variables constant. The random effect variance indicates how much the intercepts vary across different groups, accounting for variations at different levels of the data hierarchy ( 51 ).
In this study, all variables are assumed to be independent, and the overall error distribution of the linear mixed-effects model is assumed to be Gaussian ( 52 ). Laird and Ware highlighted two major advantages of using a mixed-model formulation: it simplifies the specification of random effect terms and allows for multiple sets of random effects ( 53 ).
The formula for the mixed-effects model used in this study is,
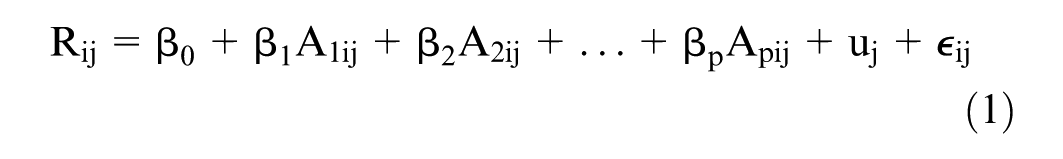
where
R ij = dependent variable of transit ridership for the ith bus stop in the jth TAZ,
β 0 = intercept,
β 1, …, β p = fixed-effect coefficients representing the effect of specific attribute,
A 1ij, A2ij, …, A pij = attribute variables on ridership,
u j = random effects capturing unobserved variability within TAZs, and
This hierarchical model considers buffer zone factors at the bus stop level and sociodemographic factors at the TAZ level. Grouping bus stops within TAZs accounts for shared characteristics. Eight separate models were created, each tailored to specific ridership patterns (e.g., time periods or boarding data). Statistically significant variables were included to provide insights into key factors influencing transit ridership.
Model Fit
To assess model fit, the log-likelihood and the Wald chi-squared test are used. The log-likelihood measures how well the data fit the model, while the Wald chi-squared test assesses the significance of the model ( 54 ). The coefficient of determination R, including the marginal R2 and conditional R2 values, is also provided in this study.
Table 3 presents statistical results from eight models related to morning (AM) and afternoon/evening (PM) boarding and alighting activities for weekdays and weekends. Among the models, the AM boarding model has the best fit to the data (the least negative log-likelihood), and the PM boarding model has the worst fit (the most negative log-likelihood). The AM alighting model shows the highest chi-squared value, meaning its predictors are the most significant. The AM boarding model has the lowest chi-squared value, indicating its predictors are less significant. These patterns are similar for weekdays and weekends. All models have p-values > 99%, showing that their predictors are strongly linked to boarding and alighting activities during the AM and PM times. Since a mixed-effects model is used, the variation in the outcome variable is captured through marginal R2 for fixed effects and conditional R2 for both fixed and random effects. When the conditional R2 is substantially higher than the marginal R2, it indicates that the random effects account for a significant portion of the model’s explained variance. In all eight models, the marginal R2 values are almost above 0.5, suggesting that the fixed effects alone explain more than 50% of the variation in the outcome variable. It is considered to reflect moderate to strong explanatory power. The conditional R2 values are also consistently high, further demonstrating the meaningful contribution of the random effects to the overall model performance.
Model Fit Results
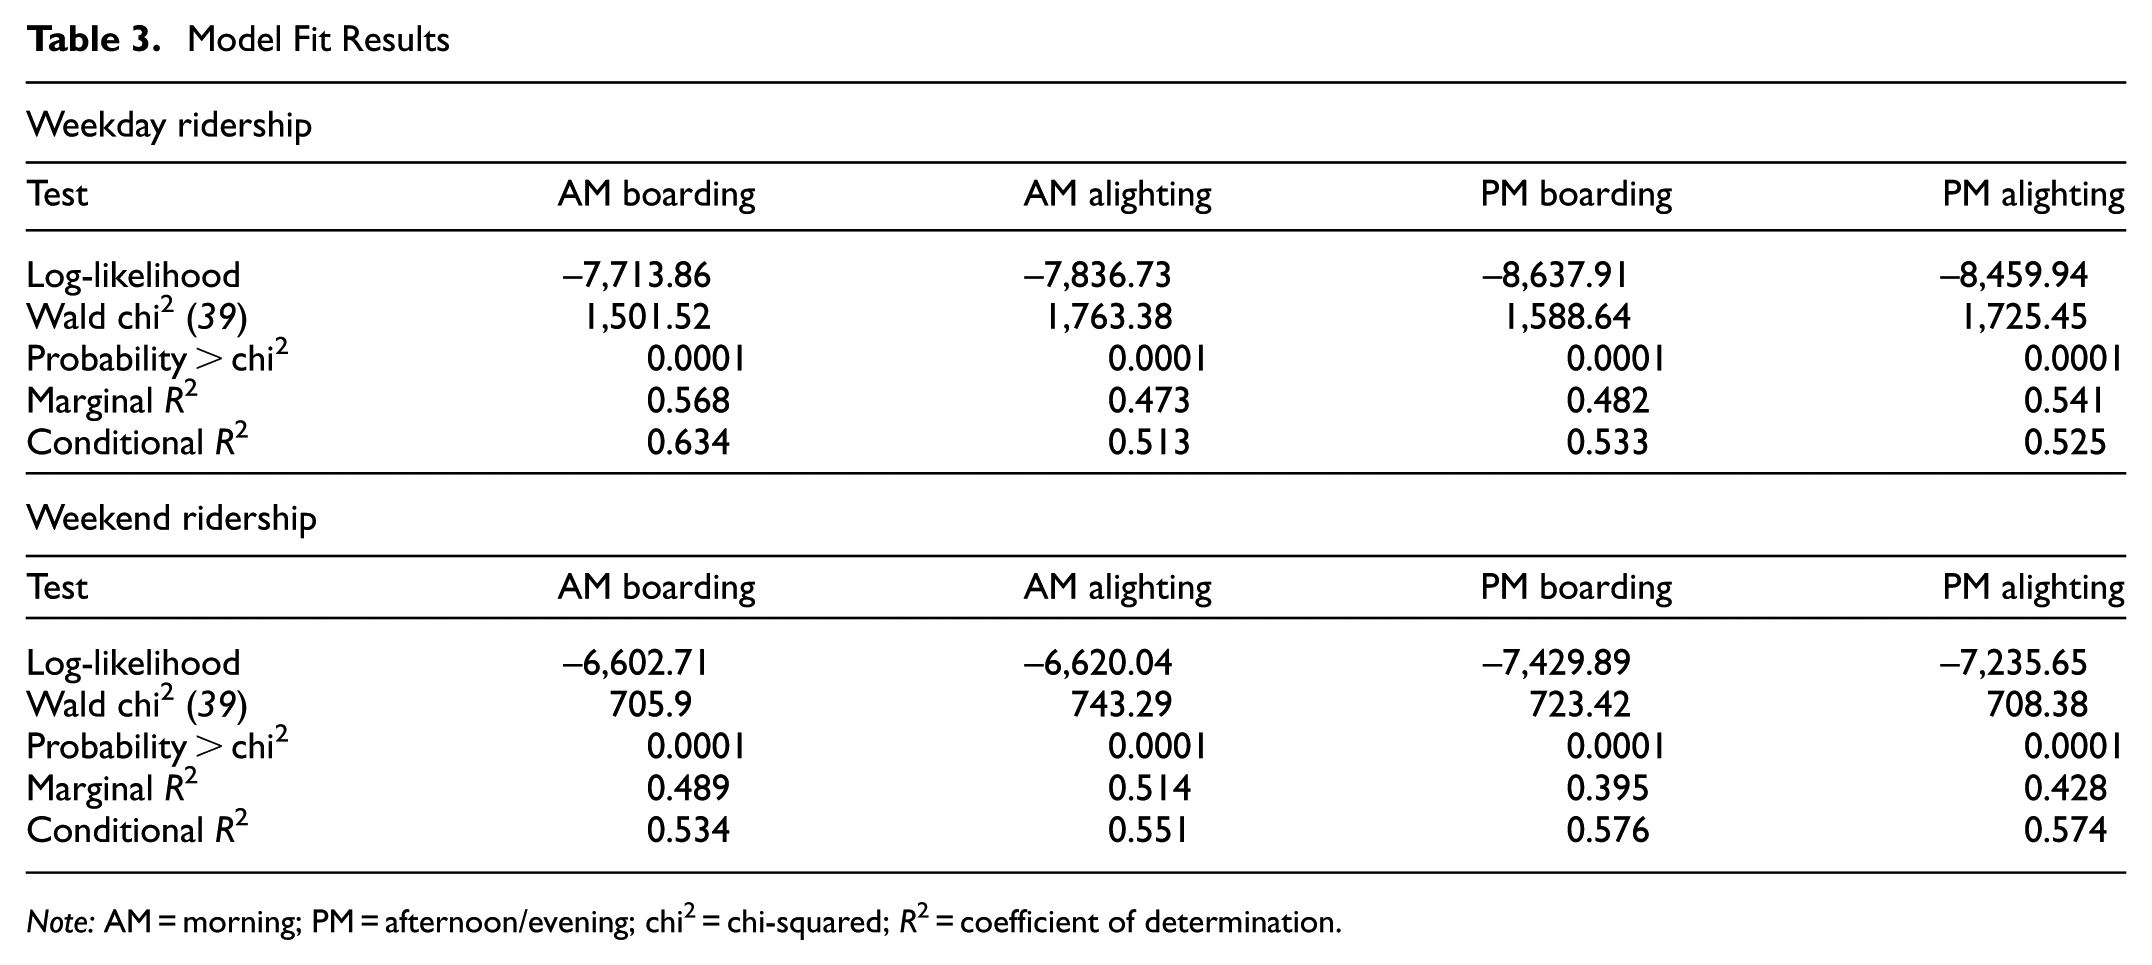
Note: AM = morning; PM = afternoon/evening; chi2 = chi-squared; R2 = coefficient of determination.
Analysis and Results
The analysis in this study captures the factors affecting the boarding and alighting ridership, accounting for variations between weekdays and weekends. The estimated model results, presented in Tables 4 and 5, use the same forms as in Table 2 for convenience, since the attributes are similar. Table 4 illustrates the weekday variations, and Table 5 displays the results for weekends. These tables highlight the effect of each factor as a coefficient, the significance of each attribute, and the standard error of the coefficient.
Factors Affecting Weekday Ridership
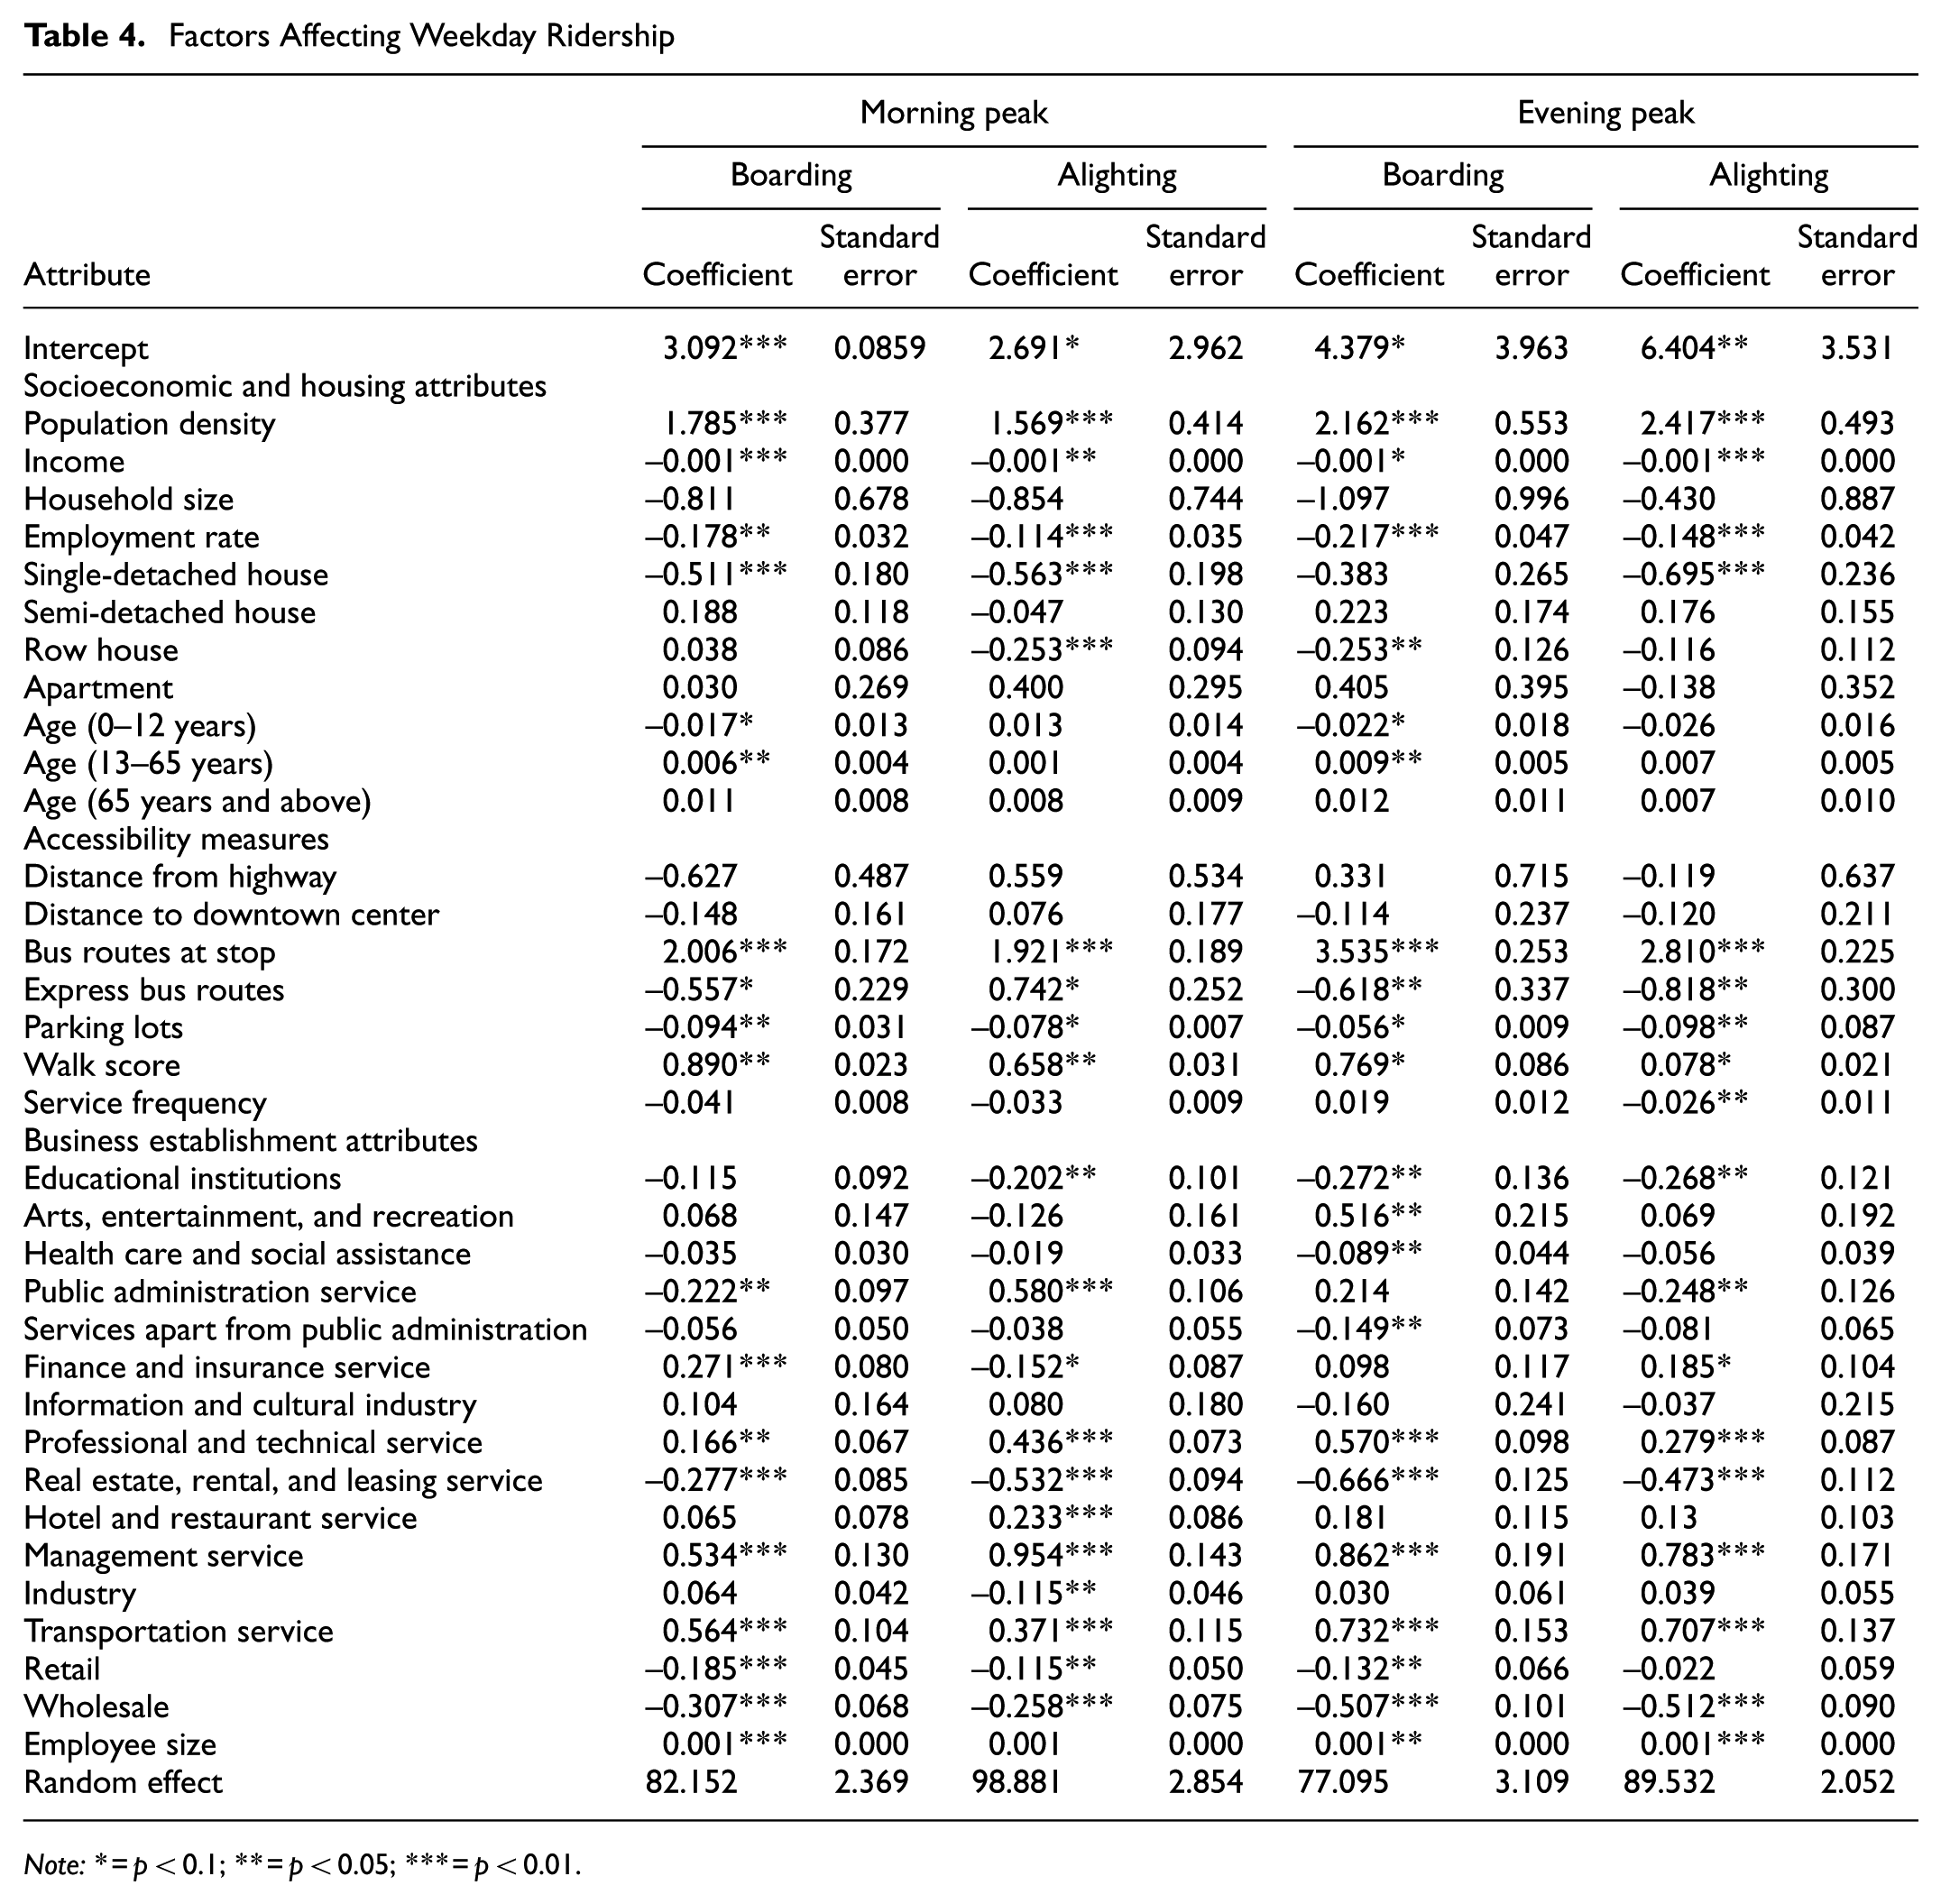
Note:* = p < 0.1; ** = p < 0.05; *** = p < 0.01.
Factors Affecting Weekend Ridership
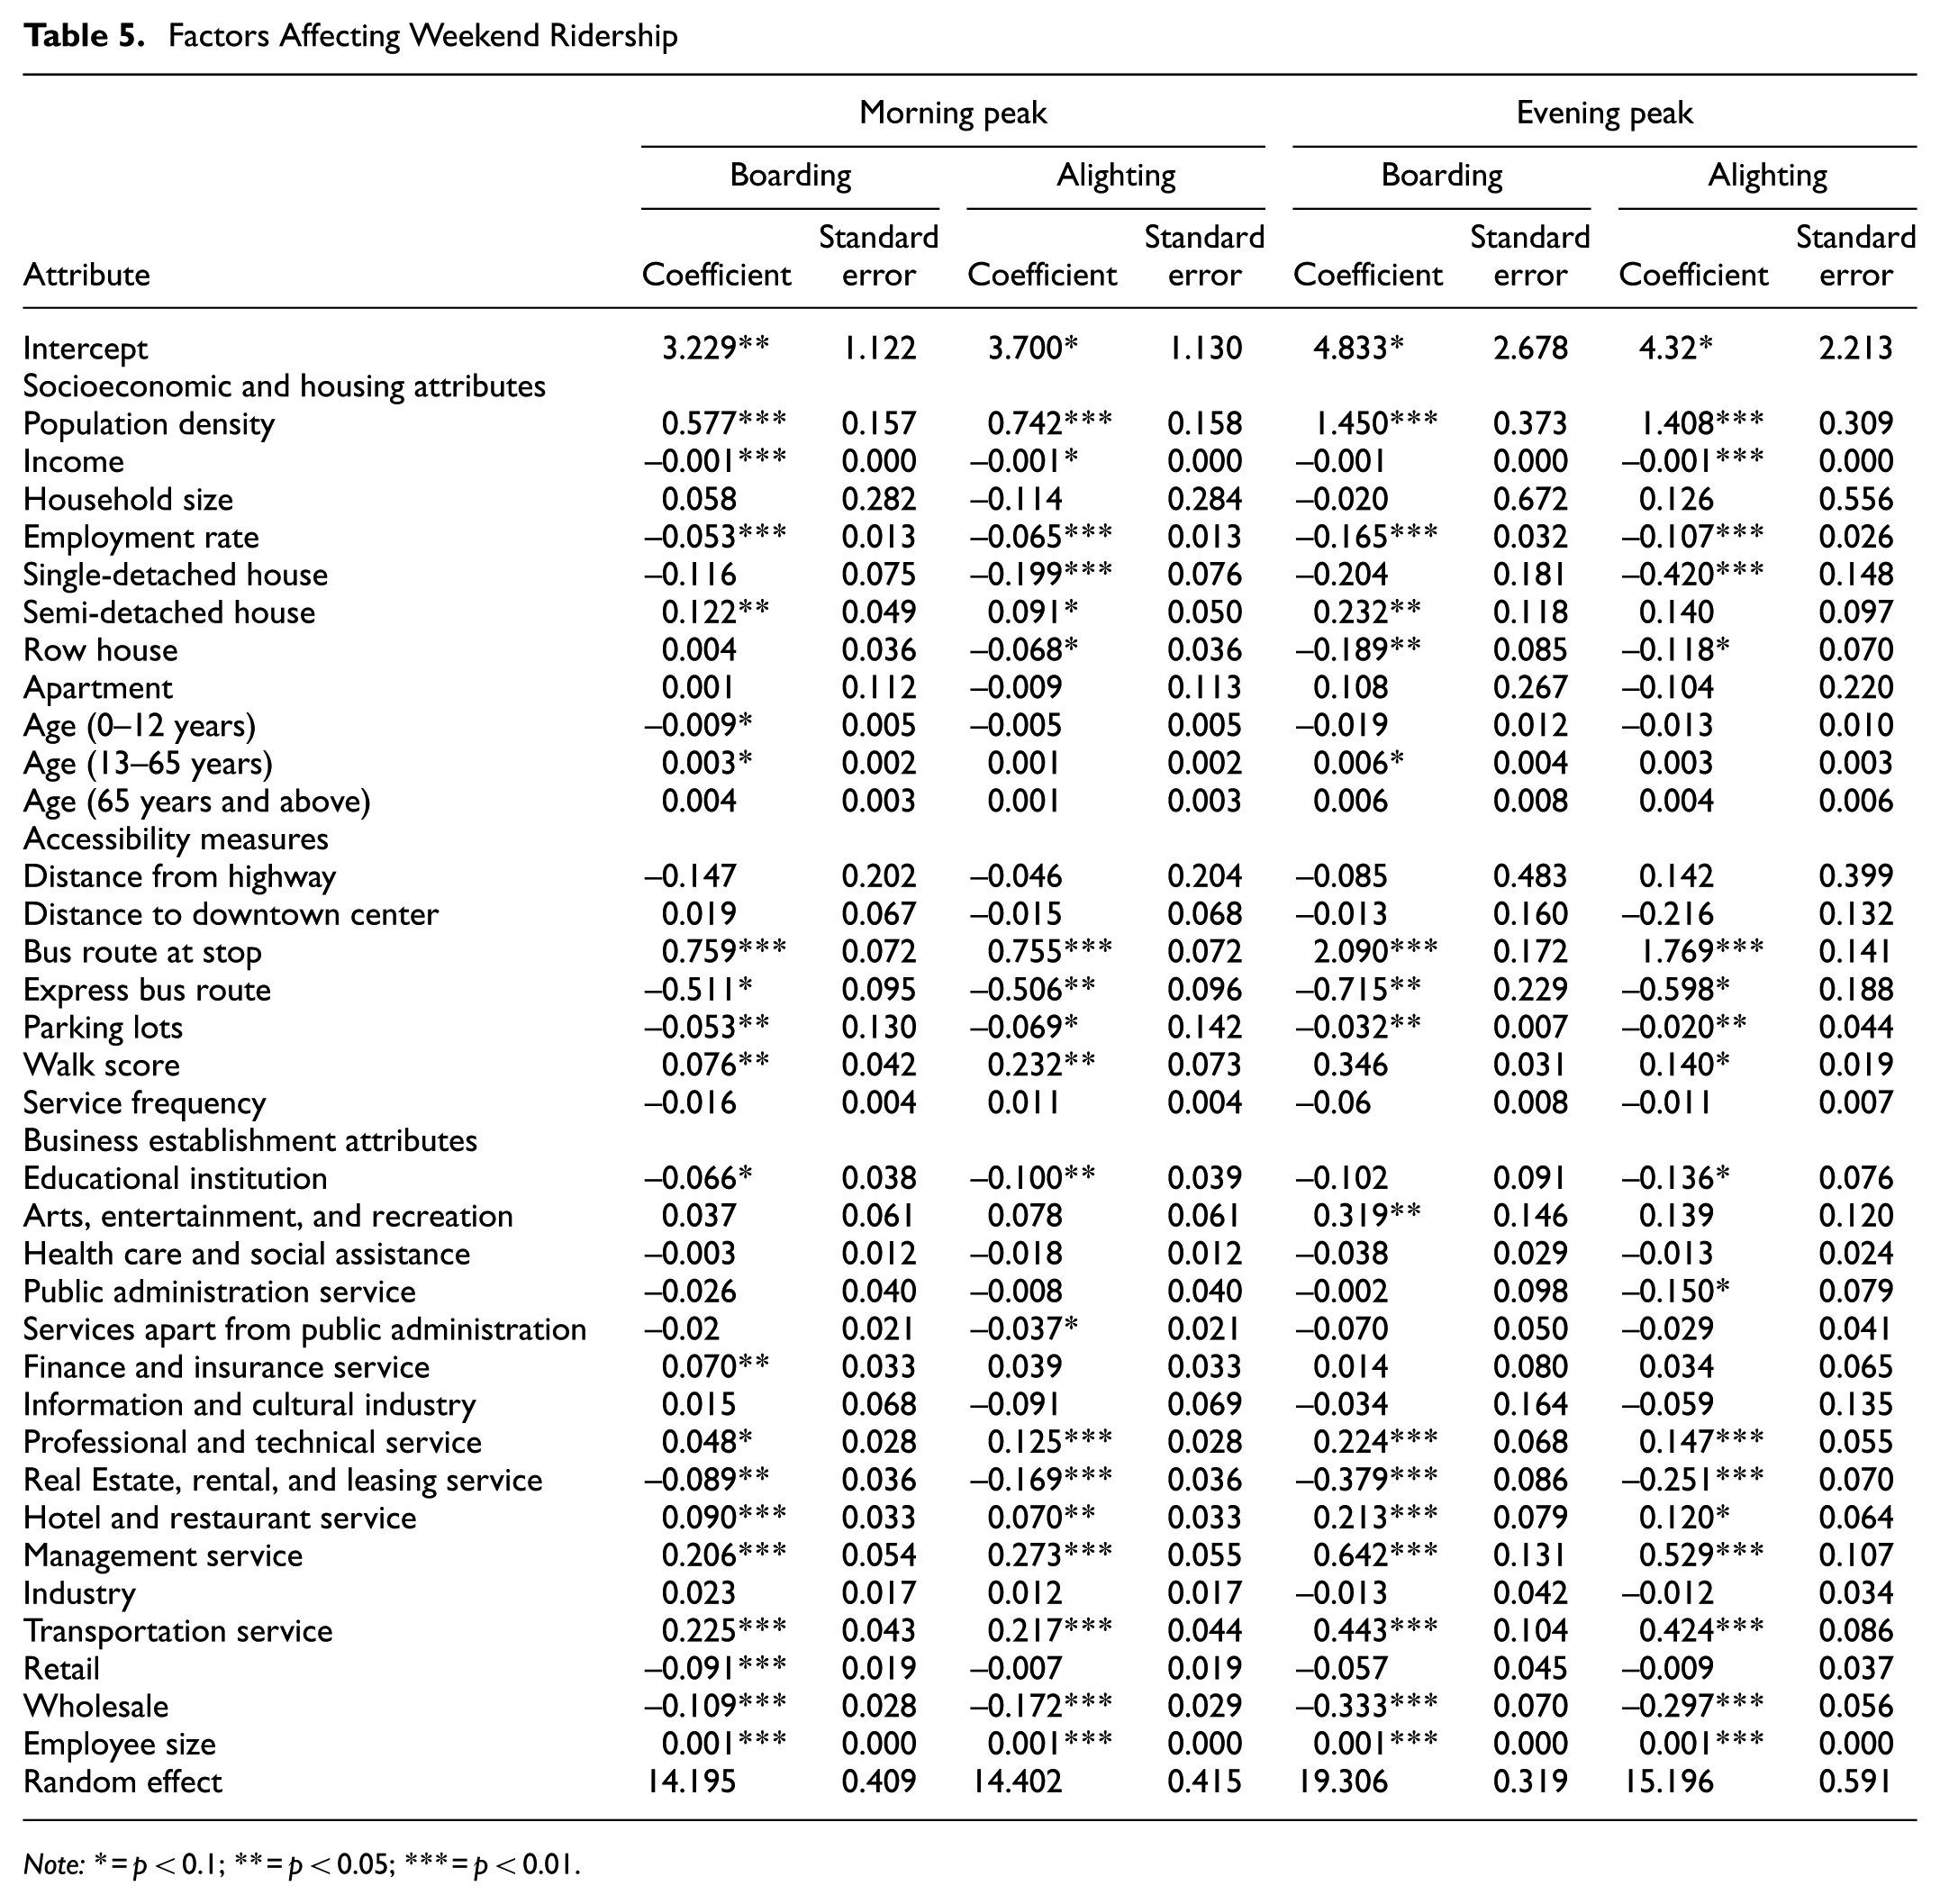
Note:* = p < 0.1; ** = p < 0.05; *** = p < 0.01.
Socioeconomic and Housing Attributes
Population density has a positive effect on boarding and alighting ridership. In the morning, during peak boarding, the coefficient is 1.78; in the evening, it is 2.14. The logarithm of population is used in the analysis, indicating that as population density increases, the likelihood of using public transit also rises.
Average zonal income reveals interesting patterns. Higher-income individuals are more likely to use personal vehicles, and the model shows a small negative effect of average zonal income on transit ridership, with a coefficient of –0.001. This suggests that higher-income areas tend to generate lower ridership, possibly because a higher income often correlates with employment, leading to increased private vehicle use.
Average household size in a zone negatively affects transit ridership because larger households are less likely to use public transit. Employment rates also significantly affect ridership, particularly in the evening. The negative effect of employment on transit use increases from morning to evening boarding, from 0.178 to 0.217, indicating that employed individuals are less likely to use transit after work because they can easily participate in after-work activities, such as grocery shopping or other household errands, using a private vehicle ( 55 , 56 ).
Among household types, residents of single-detached houses are less likely to use public transit. Despite children often facing reduced or no transit fees, they are still less likely to use public transit; however, adults are more likely to use transit, and elderly people in Halifax also use it to some extent.
Accessibility Measures
Distance from the highway affects ridership because accessibility to major routes can influence people’s choice to use public transit. Similarly, distance from downtown has a negative effect: as distance from downtown increases, people are less likely to use public transit. It is probably because of the inconvenience and longer travel times. Stops with more bus routes tend to have higher ridership because they offer more options and greater flexibility for travelers. All model results show 99% statistical effect of the number of bus routes on ridership.
Of interest, express buses show a negative correlation with ridership. This suggests that people may prefer personal vehicles for long routes, possibly because of longer waiting times and limited connecting services. Understanding this trend requires Halifax’s express bus scenario to be examined. The city has approximately 10 express bus services covering 100 km in various directions, with a headway of 30 min during the peak morning and evening periods. However, these services are unavailable between peaks and are largely absent on weekends and holidays, except for specific routes such as the express bus to the airport. Longer headways between buses significantly reduce ridership because extended wait times discourage potential passengers ( 47 ). In addition, increased parking availability for private vehicles decreases transit ridership, and a higher walk score has a statistically significant positive effect on transit use. Figure 11 shows the coefficients of the model outcome.
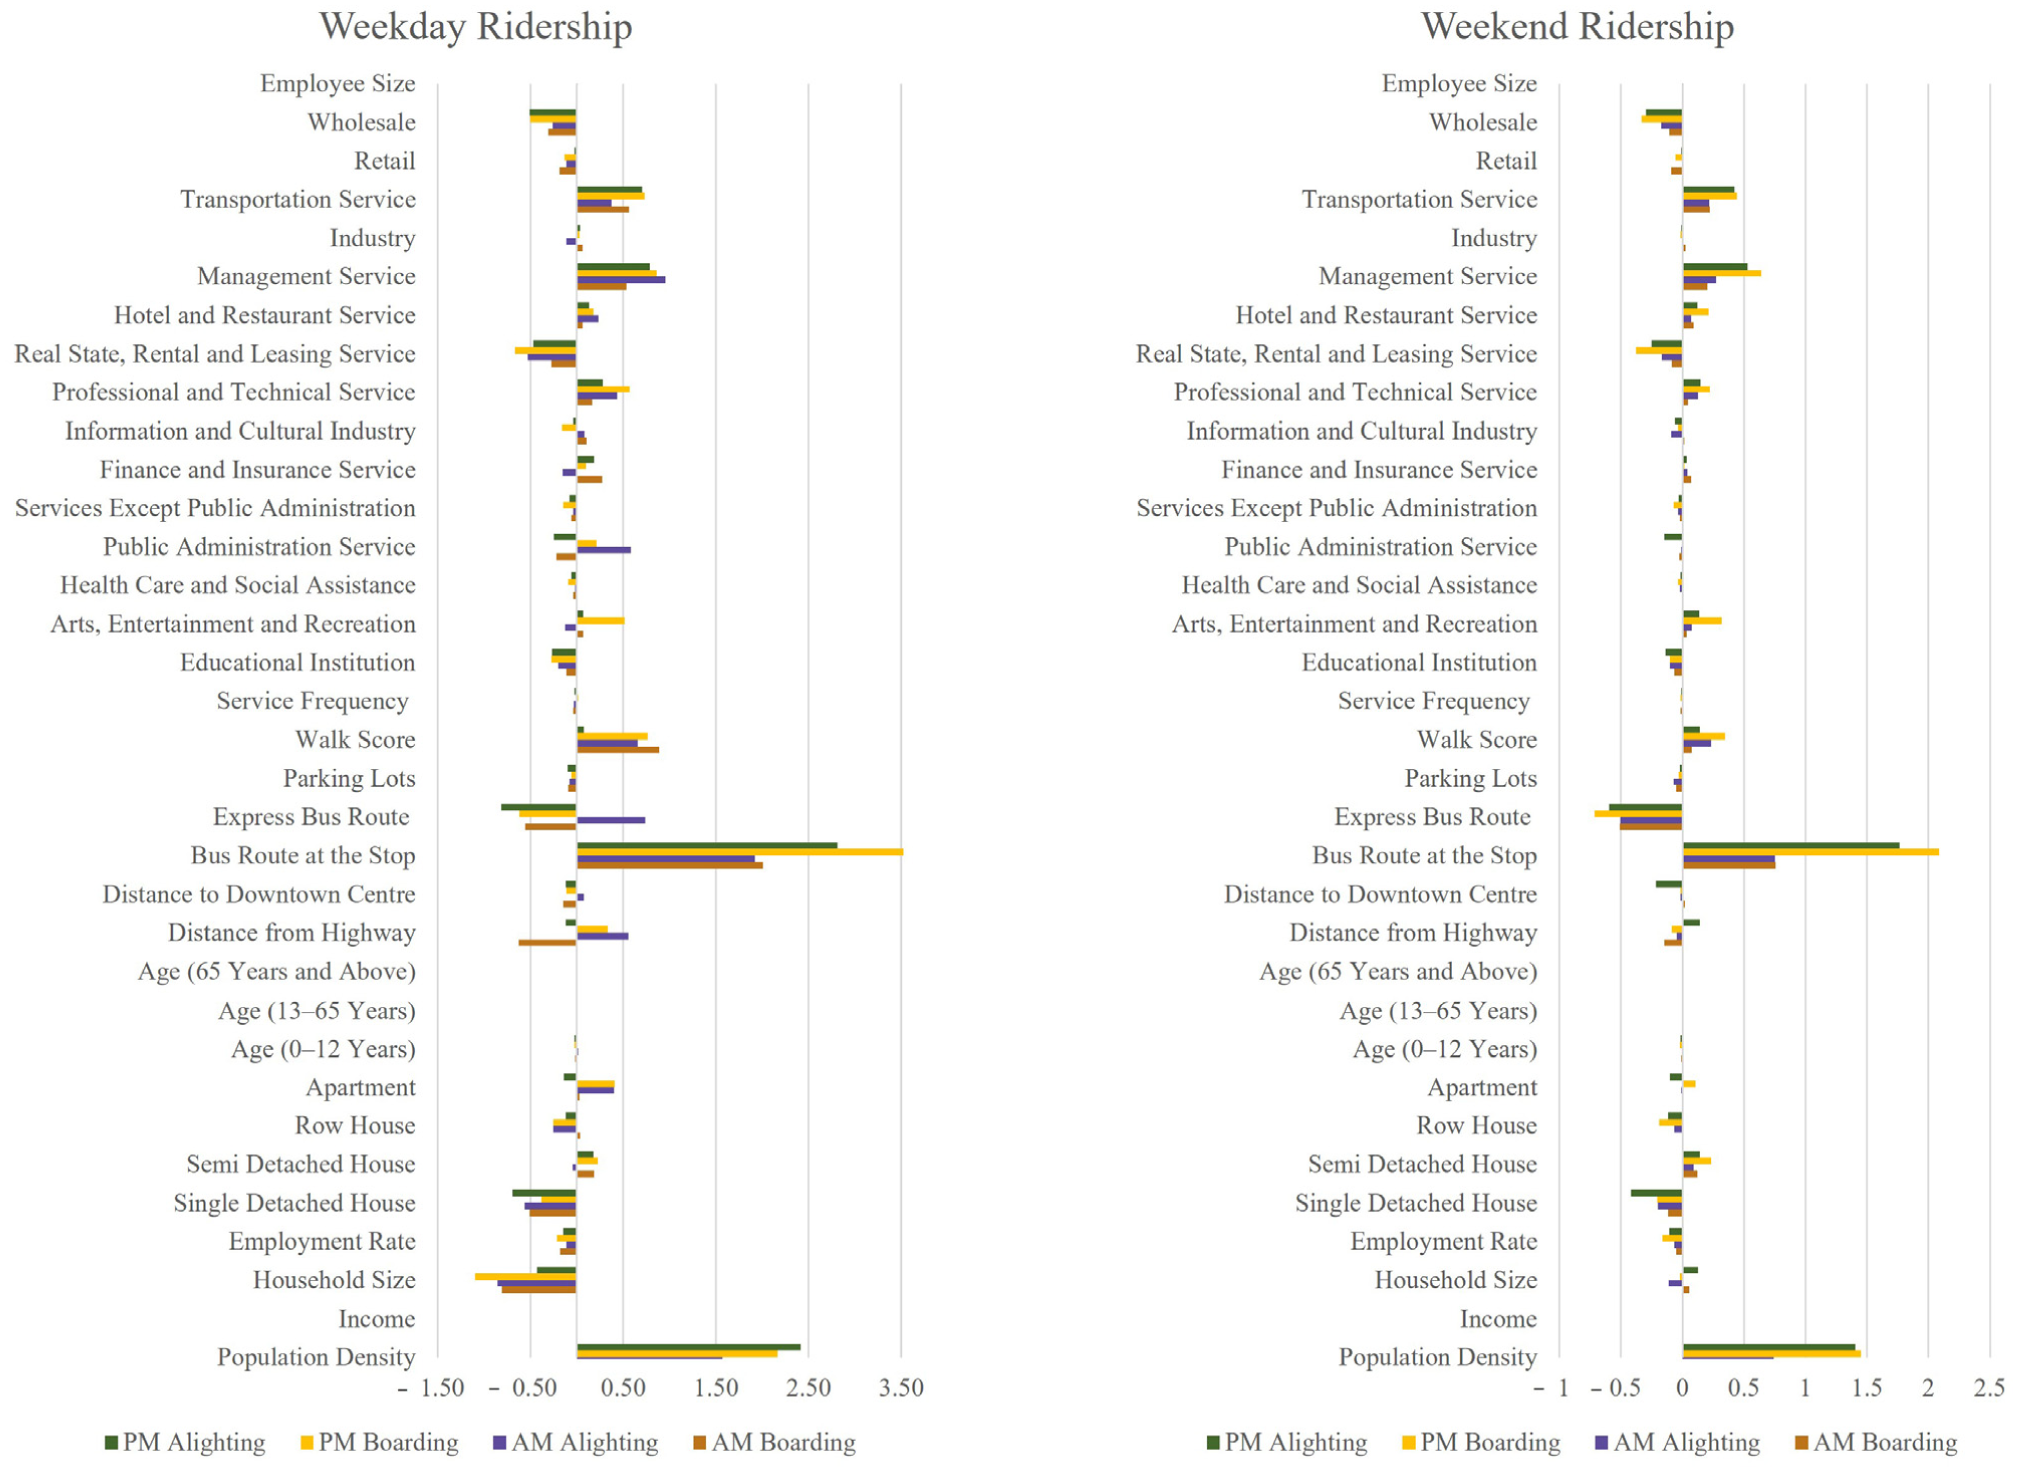
Coefficients of factors affecting transit ridership.
Business Establishment Attributes
Educational institutions, including schools, colleges, and universities, significantly influence transit ridership. However, in Halifax, the model reveals a negative relationship. This can be attributed to several factors. A substantial portion of Halifax commuters rely on active transportation, particularly in the downtown area, where many educational institutions are located ( 57 ). Students and staff traveling to these institutions often opt to walk or cycle rather than take buses. In addition, school bus trips were excluded from this study. Parents commonly drop off and pick up their children while commuting to work, and many college students live near their campuses, favoring walking over transit. The downtown area’s compact design and proximity to major university campuses further support pedestrian access. Locations such as parks and museums also positively affect transit ridership, indicating that locals and tourists use public transit for recreational purposes. However, this effect is negative in the early morning because people typically do not visit these places during that time. Health care facilities also negatively affect ridership. In this study, health care facilities have been aggregated to include hospitals, nursing care facilities, individual and family services, rehabilitation centers, dental clinics, and child and youth services. This combined categorization results in a negative overall effect. However, public services significantly influence transit ridership, particularly for alighting patterns.
During the morning peak, there is a slight positive effect, indicating people are arriving at these locations for services. However, in the evening, the effect is negative, as people prefer personal vehicles after work, including those in public service. Non-public services, such as business, social, and commercial services, typically involve the use of personal vehicles. The finance and insurance sectors positively affect ridership. Information and cultural industries, such as libraries and archives, have a positive effect on ridership in the morning but a negative effect in the evening. Professional and technical services, as well as dining out and weekend partying at restaurants and bars, positively affect ridership. Management services also show a positive correlation with ridership, possibly because small management sites often use public transit. Employees of these management sites might need to travel to sites with heavy equipment stored at service centers; therefore, they often take buses to ride back home. In addition, real estate, rental, and leasing services negatively affect ridership. Industries, because of their large scale and distance from urban areas, do not significantly affect public transit ridership. However, transportation services positively affect ridership. In contrast, retail and wholesale services have a significant negative effect on ridership because people generally prefer their own vehicles for shopping. Finally, an increase in employee size leads to higher ridership.
Variation in Weekday and Weekend Ridership Attributes
On weekdays, ridership is influenced by a broader range of factors compared with weekends. Attributes such as hotels and restaurants have a greater effect on weekend ridership, as people tend to visit these places more during leisure time ( 27 ). Similarly, attractions such as museums and arts venues also see a greater effect on weekends than professional workplaces. However, unlike restaurants, some cultural and leisure venues may be closed on weekends, resulting in a less pronounced effect on ridership.
Variation in Boarding and Alighting Ridership Attributes
The residential area has a positive effect on ridership, particularly on morning boarding and evening alighting, indicating that people are commuting to and from work. In the arts, entertainment, and recreation sector, boarding ridership shows a slight positive effect, but alighting is negative in the morning. This implies that some people might be going to work in these sectors. However, boarding and alighting are higher in the evening, indicating that people frequent these facilities then. There is also a significant positive effect on alighting from public administration services, professional services, restaurants, and hotels, suggesting that people use buses to access these services. If a bus stop is far from the highway, boarding tends to be lower. The number of express bus routes negatively affects boarding because people usually use personal vehicles for highway travel in Halifax.
Variation in Fixed and Random Effects
This model captures the fixed effects from all attributes and random effects from unobserved variability. The fixed effects show high intercept values, particularly for weekday morning boarding and evening alighting, indicating strong ridership during these times. The values are lower and less significant for morning alighting and evening boarding, reflecting lower ridership during these periods. Similar patterns are observed on weekends, with higher evening peak values. Random effects are notably higher in the evening than in the morning on weekdays and weekends, highlighting variability in ridership across bus stops or neighborhoods that is not explained by fixed effects alone.
Discussion and Conclusion
This study mainly examines factors that affect public transit ridership in Halifax, Canada, with particular emphasis on the previously underexplored role of business establishment characteristics. Traditional transit ridership models usually focus on sociodemographic, land use, and service quality factors. However, this study includes detailed business-related information, such as type, size, and proximity. It examines how these characteristics influence ridership. This marks a significant shift from conventional models and provides a better understanding of how business activity affects commuting and non-commuting transit use. It used a large-scale boarding and alighting data set from 2,405 bus stops. Public transit is a highly suitable option for sustainable transportation and reducing greenhouse gas emissions. However, the majority of residents in Halifax commute by car. Transit ridership in Halifax increased slightly from 2022 to 2023 after the COVID-19 pandemic; however, it has not yet reached prepandemic levels. The study’s findings reveal that population density significantly influences transit ridership, with higher density correlating with increased ridership. In contrast, income has a negative effect on ridership. This suggests investments should be targeted at low-income, densely populated areas to achieve higher returns. These communities remain the core transit riders, and improving their accessibility to jobs via public transit can result in substantial ridership growth ( 43 ). Single-detached households tend to use transit less, and larger households or higher employment rates can reduce ridership, particularly in the evening. Significant differences were also observed in passenger boarding and alighting based on the presence of business establishments. The model indicates that ridership is influenced by age, with a negative effect observed among younger and older individuals, as well as larger household sizes. Policies should be designed to address these challenges and attract riders from diverse demographic groups ( 43 ). Proximity to educational institutions and healthcare facilities negatively affects ridership, and proximity to recreational areas, finance, and insurance sectors positively affects ridership. These findings indicate that entertainment, land use diversity, medical services, and accommodation services affect non-commuting trips more strongly than commuting trips. These findings suggest that entertainment places, land use diversity, medical services, and accommodation services all have a more intense effect on non-commuting trips than commuting trips ( 21 , 58 ). Proximity to highways and downtown, as well as a higher number of bus routes at stops, significantly boost ridership, and longer wait times between buses reduce it. Service frequency has a greater effect on weekday ridership than on weekend ridership. According to the literature ( 59 ), reducing travel time enhances traveler satisfaction, with each minute saved increasing satisfaction by 1%. These findings emphasize the need for measures to optimize transit routes and improve service frequency to enhance ridership and satisfaction ( 60 ). The model shows a negative correlation between ridership and the presence of retail and wholesale stores. This could be attributed to the preference for personal vehicles or active transportation. In the retail category, this study includes small shops, drug stores, and neighborhood convenience stores. Unlike in larger Canadian cities such as Toronto or Montreal, a higher proportion of commuters in Halifax opt for active modes of transport rather than public transit. This may reflect either a lack of high-quality public transit infrastructure or a city structure that supports active transportation ( 57 ). In addition, ridership patterns vary by day. On weekdays, a broader range of factors influences public transit use, and leisure destinations such as hotels and restaurants have a more pronounced effect on weekends. The model also captures heterogeneity in random effects, reflecting unexplained variability in ridership across bus stops or regions. Although this study considers the effects of the built environment and business establishments, it does not consider internal factors that affect transit ridership, such as fare prices, parking pricing, park and ride, transit coverage area, transit travel time compared with buses, housing, automobile ownership and bike-sharing systems, because of data limitations. Although business establishment data could be broken down into more specific subcategories to deepen the analysis, such detailed disaggregation may not reliably capture real-world patterns. Therefore, a moderately disaggregated classification was applied to maintain analytical validity. To improve spatial precision and sensitivity analysis, future studies could consider using non-overlapping or network-based buffers to better control for spatial redundancy.
The findings from this study can provide insights for developing policies to enhance transit recovery in the post-pandemic period. As the largest city in Maritime Canada, Halifax faces unique challenges and opportunities in improving public transit ridership. All the policies can significantly increase ridership. For economic and practical convenience, these policies can be prioritized and applied accordingly. First, improving transit access in densely populated and income-diverse areas should be a priority. These areas show strong potential for consistent ridership, particularly during peak hours. Second, providing more frequent and varied bus routes can increase overall ridership. Expanding transit services around tourist attractions and leisure facilities can also significantly boost weekend ridership. Third, fostering business establishments and infrastructure improvements can make public transit more appealing. More transit facilities in high business activity areas and additional evening bus services (as the model shows higher ridership at that time) can further support ridership growth. Finally, predictive models should be introduced for future planning. The model developed in this study can help planners anticipate ridership changes, which are crucial in the post-pandemic era because significant shifts are expected due to the growth of e-commerce and remote work.
Footnotes
Acknowledgements
The authors would like to thank the Natural Sciences and Engineering Research Council of Canada Discovery Grant, the Climate Action Awareness Fund, and the HRM for supporting this research.
Author Contributions
The authors confirm contribution to the paper as follows: study conception and design: M.A. Habib, K.N. Nokshi; data collection: M.A. Habib; analysis and interpretation of results: K.N. Nokshi, M.A. Habib; draft manuscript preparation: K.N. Nokshi, M.A. Habib. All authors reviewed the results and approved the final version of the manuscript.
Declaration of Conflicting Interests
The authors declared no potential conflicts of interest with respect to the research, authorship, and/or publication of this article.
Funding
The authors acknowledge the support of the Natural Sciences and Engineering Research Council of Canada Discovery Grant, the Climate Action Awareness Fund and the Halifax Regional Municipality (HRM).