
Abstract
Connections or transfers are an important part of public transport journeys. However, transfers can be an inconvenient part of a passenger’s journey compared with direct trips, especially when connecting between low-frequency routes such as commuter rail and suburban bus services. With long headways, a missed or badly timed connection can significantly lengthen one’s commute by up to a service’s headway. Transfer optimization has been considered and applied to varying degrees, but with most emphasis on station design and intra-agency timetable coordination rather than inter-agency timetable coordination. Most reliability metrics do not consider how connections are affected by delays on intersecting routes. In this paper, global best practices employed by railways and transport authorities to measure the performance of connections are reviewed. Regional public transport governance approaches supporting timetable coordination and service integration are also synthesized. A metric of connection convenience was developed inspired by the limited academic literature and best practices. The metric is then applied to evaluate the convenience and coordination of connections between GO Transit rail services and connecting bus services in Ontario, Canada, based on walking time between stops. This research is important for informing service integration policies seeking to improve multimodal and inter-agency connections. Agencies can use this metric along with transfer demand data to help prioritize services for improved scheduling such as application of timed transfer system pulsing and better interchange facilities.
Introduction
Connections or transfers are an important part of public transport systems, enabling an efficient network to cater for anywhere-to-anywhere journeys at higher service levels than would be possible otherwise. However, transfers can be a less convenient part of a passenger’s journey compared with direct trips. Transfer optimization has been studied extensively in the research literature and occasionally applied to real-life public transit network planning to make transfers more convenient for customers through optimal scheduling and station design. However, many transit agencies do not optimize transfer times in the schedule design among intersecting routes of their own networks, let alone addressing connections between routes from different agencies.
Reliability is a second area with extensive research and practice in the transport field. Punctuality measures and techniques to improve on time performance typically concentrate on individual routes or services, assuming that if individual lines are punctual then the connections between them will be acceptable. Most reliability metrics do not consider how connections are affected by delays on feeder routes or connecting routes. Real-time control methods, principally holding control, are used to keep connections even when a service is behind schedule. Holding control is less common for inter-agency connections or for missed connections with more frequent departures. Thus, there is a dearth of literature on diagnosing the quality of connections, particularly among routes run by different agencies.
Large suburban regions can include a mix of transit services, such as commuter rail (also called regional or suburban rail), light rail and metro services, and local bus services. Traditionally, commuter rail services operate on existing rail corridors in low-density areas, making the first-mile access and last-mile egress problem a significant obstacle for growing commuter rail ridership, especially off-peak. Traditionally, suburban rail stations have large park-and-ride facilities for commuters to park their cars while taking the train into work or other activities in the central business district (CBD). Suburban local bus services can help extend the reach of commuter rail stations more sustainably than park-and-ride or even kiss-and-ride (passengers dropped off and picked up by a car driver such as a family member). However, connections between regional rail and local bus services, which typically operate at long scheduled headways, must be convenient for passengers to choose these services instead of driving.
The objectives of this study are threefold toward contributing to service integration research and developing a quantitative metric for assessing the convenience of connections. First, this study will synthesize some international best practices in measuring intermodal transfers and associated governance protocol. Second, inspired by the literature and best practice, this study will develop a data-driven connection convenience metric for quantifying the quality of connections at intermodal/interagency stations. Third, this study will then demonstrate the application of the proposed metric in a case study of the Greater Toronto Hamilton Area (GTHA) in Canada.
Service integration is facilitated by functional coordination and governance structures for a region, even when multiple agencies and operators are involved in the operation and management of public transport services. First, current literature and international best practices on assessing the temporal quality and punctuality of transfers is reviewed, including literature on the chance of missing a transit connection and discussion of timetable optimization for connections. These explored methods go beyond measuring only the on-time performance of routes. Additionally, a short review of regional transport governance structures is conducted for comparison of formal and informal cooperation practices toward timetable coordination. Then, a metric is proposed to consider missed transfers and transfers with excessive waiting time between the connection giver (arriving) service and connection taker (departing) service. This metric is applied to analyze the convenience of connections between the GTHA’s GO Transit suburban rail network and connecting transit agencies’ suburban bus services under scheduled and real-time conditions on selected days within various windows defining a comfortable transfer waiting time to quantify passenger experience of the transfers.
Review of Literature and Practice
The literature review consists of two main parts: the Academic Literature Review section highlighting the state of the art for assessing transfers between public transport services and passengers’ experience of connections, followed by the Industry Practice Review section highlighting the leading state-of-the-practice in quantifying and assessing connections between transport services within a transport authority’s data analysis and performance tracking efforts. Finally, international approaches to coordinated governance supporting both fare and service integration as part of a larger multiagency, multimode public transport network are considered.
Academic Literature Review
The academic literature about the punctuality or reliability of transfers, the convenience of transfers for passengers, and the measurement of transfer delay is limited but was reviewed to understand the limitations of assessment metrics currently employed. A rigorous metric for assessing connections was sought to quantify the chance that transfer movements were convenient for passengers, incurring minimal lost time. There has been extensive research on connection optimization and timed transfer systems (TTS), but how are connection nodes with the worst transfer times identified? Current research literature can be grouped into several focus areas: assessing the time penalty imposed by transfers, assessing transfers based on passenger demand and waiting time, and more abstract measures of connection quality.
Early studies developed metrics for assessing connections between different routes based on service schedules or real-time information. Hadas and Ceder defined a connection performance indicator given the percent passenger demand between an origin and destination routed through a given connection, the headway of the connecting service, and a categorical classification of the type of connection: crossing each other, overlapping, or distant ( 1 ). Real-time bus location data from automatic passenger counters and general transit feed specification (GTFS) real-time feeds were used to determine transfer time penalties for missing the connecting bus because of delays on the originating route ( 2 ). The risk of missed transfers is the ratio of missed connecting buses to total connecting bus departures at a stop, given the total transfers at a stop and the transfer time penalty causing a traveler to miss a bus and connecting to a later departure. The paper did not specify why certain interchanges, which were not timed transfer stations, were chosen for the analysis. Ideally, a connection metric such as this should not just consider when a rider misses the connecting transit service (insufficient time to change), but also when the wait (scheduled or not) is excessively long. An excessively long transfer time is subjective to individual experience, but can be a wait of an average headway or more (such as just missing the connecting service). In some cases, connecting vehicles are scheduled to leave before the originating vehicle arrives, and cases such as these should also be quantified.
Various researchers have assessed transfers based on the transfer time, which is the delay caused by waiting for the connecting service after alighting from the originating service. Origin-destination data from Seoul’s electronic farecard was used to measure the transfer durations of bus-to-bus, subway-to-bus, and bus-to-subway transfers, with 80% of transfer trips involving a transfer time less than 10 min ( 3 ). Using GTFS schedules and spatial data, the number of transfers that could complete in less than 5 min scheduled waiting time and no more than 100 m walking was explored for three cities: Auckland, New Zealand; Vancouver, British Columbia, Canada; and Portland, Oregon, U.S. ( 4 ). Unfortunately, these approaches are constrained by the data available. In Toronto, unlike cities such as Seoul, tap-off is not required on local transit such as suburban bus routes, and farecard data is not readily available.
Other connectivity scores or means for evaluating transfers’ impacts have been explored by researchers. Most notably, transfer time for trips with untimed connections can be considered in aggregate with in-vehicle travel time for each leg, but averaging travel times over many trips can minimize the impact of unusually long and short transfer times for random connections ( 5 ). Using Transport for London, UK, fare information and station layouts, Guo and Wilson developed a path choice model to compare passenger preferences and experience of interchange stations between London Underground lines ( 6 ).
One research area which has received extensive attention is optimizing schedules for efficient transfers through such means as TTS or real-time control methods such as holding control to ensure schedule compliance of connecting vehicles. TTS is a scheduling system under which, at key interchange nodes, all connecting vehicles arrive and depart close together as part of a pulse that is repeated at recurring intervals, called the “pulse headway,” typically at headways of every 15 or 30 min. The choice of particular stations for application of an optimization algorithm for scheduling connections is typically not explained quantitatively. One study assumed that both rail and bus services could have their schedules fully adjusted, which may not be the case because of upstream or downstream constraints such as intercity rail services but did not apply it to a particular case study ( 7 ). A similar study developed a mathematical programming algorithm optimizing train arrivals for transfers between subway lines considering transfer waiting times ( 8 ). The Beijing subway stations in China chosen to demonstrate the algorithm were not selected for specific qualitative or quantitative reasons. Real-time holding control can also be used to improve synchronization on stochastic departures and minimize transfer waiting ( 9 ). Research and application in both scheduling and real-time transfer optimization could be improved through better metrics to identify and prioritize transfer nodes for improvement in schedule synchronization and real-time connection protection. Other research has determined transfer penalties for different connection types and layouts using revealed preference data and behavioral models considering interchange disutility ( 10 ). Such research highlights how connections are seen as “wasted travel time” for passengers, thus agencies should measure the quality of connections within and between their networks and those of connecting agencies to continuously improve the passenger experience and minimize the disutility and lost travel time from transfers.
Industry Practice Review
Few railways and transport authorities publicly measure the quality or coordination of connections between services, but the Dutch and Swiss do. The government-owned railway Nederlandse Spoorwegen (NS) operates the Netherlands’hoofdrailnet (main rail network) under a concession to the Netherlands Ministry of Infrastructure and Water Management requiring NS to report key performance indicators of its services ( 11 ). Other rail services in the Netherlands are contracted out to other companies. NS must report on the quality of connections between NS and other carriers’ rail services on the Dutch network, though this metric is merely NS on-time performance at interchange stations (defined as less than 5 min late). An alternative measure of on-time performance and vehicle punctuality, called “passenger punctuality,” considers the effect of delays and cancellations on passengers’ journey times compared against journey times predicted by journey planners or timetables ( 12 ). This metric reports the share of journeys between a passenger’s origin and destination station on the hoofdrailnet where they are delayed by no more than either 5 or 15 min depending on metric being reported.
In 2016, NS and ProRail (the Dutch rail infrastructure manager) developed a new calculation algorithm for passenger punctuality using OV-chipkaart electronic farecard data to address gaps, accounting for train cancelations, missed transfers, and passenger rerouting. Unlike the earlier metric which used forecasted potential passenger demand, this metric uses actual demand as measured on each individual route by farecard tap ins and tap outs. It groups missed transfers with single-train journeys to capture all the ways a trip could be affected by operator performance. NS assumes a 1 min walking time between platform and farecard reader and a default 5 min transfer walking time between platforms, unless a station- or platform-specific walking time is specified. Unless an internal station-specific measure is used (which have not been published), the transfer time allowances are assumptions, not based on specific walking distances/speeds. This 2016 metric, as explored by Wolters, more closely represents passengers’ actual experience of the rail network and improves understanding of train performance and areas for improvement, which is important for NS and ProRail reporting to the Dutch government ( 13 ). The specified minimum amount of time that a transfer should be given is an interesting concept, ensuring the connections that are not humanly possible or involve excessive running are not counted or suggested as feasible.
The Swiss standard-gauge rail network, largely owned and operated by Swiss Federal Railways (SBB CFF FFS), measures two kinds of punctuality on the Swiss rail infrastructure: train punctuality, measuring the percent of trains no more than 3 min behind schedule, and connection punctuality ( 14 ). Understanding the use of this metric requires a better understanding of the management of the Swiss rail network. Connections to local transit services such as buses and trams are not considered in the metric because real-time performance is not tracked. Local transport services—buses and trams—are typically scheduled around train timetables or run very frequently. Timetabling, led by SBB CFF FFS, occurs under a hierarchical structure: timetables of long-distance trains developed first, followed by regional trains, and then local transport and special trains. The Swiss rail punctuality metrics include both the SBB CFF FFS rail system and independent standard-gauge railways such as BLS which use both their own infrastructure and that of other railways. All standard-gauge railways in Switzerland are counted in train and connection punctuality metrics derived from the train signaling system, as track is used by several different rail operators. Local transit services such as buses and trams, on the other hand, are typically not tracked in real time, thus preventing reporting of real-time connection punctuality (S. Buehler, personal communication, 2023).
SBB CFF FFS publicly reports connection punctuality—the percent of connections between train services where the minimum transfer time between services is satisfied at 53 railway interchange stations. Connection time is determined for each transfer station based on the time to change trains given a walking speed of 1.2 m/s assuming most connecting passengers are regular commuters without disabilities (C. Cassis, personal communication, 2023). Minimum connection time is measured as the worst case for a station or substation: from the furthest end of the furthest platform to the opposite farthest train platform entrance. Railway operator staff measure the minimum connection time for stations manually by physically walking the station premises (S. Buehler, personal communication, 2023). Because connection times are the worst case for a station or substation, possible connections such as a cross-platform transfer at a large station that are feasible but not meeting the station’s minimum connection times are not recommended by journey planners or considered in connection punctuality numbers.
Connections with transfer times exceeding the standard 30 min interval between services, called a takt, are not considered satisfactory connections in Swiss connection punctuality reporting. This prevents the counting of excessive connection times as being acceptable for passenger’s intercity and regional travel experience. Connection punctuality concepts are also considered for connections with local transit services such as buses, trams, narrow-gauge railways, and boats, though these are not included in punctuality figures, as most are not tracked in real time (most real-time vehicle tracking in Switzerland uses railway signaling systems). Specifically, minimum connection times are used for planning purposes in scheduling connections with local transit services and designing intermodal stations. Minimum connection times are set by walking the distance from the furthest end of the furthest platform to the furthest platform or bus stop at the other end. Transfer times for disabled patrons or accessible routes are not considered, though disabled persons can call to request a connection be held for them. Connections are typically held only for the last service of the day in the event of delays. Under passenger transport regulations, operators are obligated to get fare-paying passengers’ home or pay for a taxi or hotel if their service is delayed (S. Buehler, personal communication, 2023). Operators work together by holding the last departure of connections for late services to minimize compensation and alternative travel obligations. The Swiss metric and factors in the Dutch passenger punctuality metric provide useful inspiration for assessing connection convenience based on the minimum time needed to connect. This research builds on that experience in developing a metric tailored specifically to application in multi-modal public transport networks of urban regions.
The authors looked into other leading railways and transport authorities across the world but could not find publicly reported metrics or approaches measuring transfers or the passenger experience of connections within their networks. Specifically, other railway networks were investigated to see if their punctuality statistics specifically considered transfers: Société Nationale des Chemins de Fer Français (SNCF) in France, Deutsche Bahn (DB) in Germany, and Österreichische Bundesbahnen (OBB) in Austria. OBB reportedly considers a similar metric to Switzerland’s in its timetable planning, but on a smaller scale and not publicly reported. Unfortunately, Japanese railways and transport authorities do not measure or track connections between services or transfer convenience ( 16 ). The convenience of transfers is a less important consideration on high-frequency networks such as those within the high-frequency metro systems which characterize the public transport systems of most Japanese, Singaporean, Korean, and Chinese urban regions. When transit services operate at low headways (a common rule of thumb being headways of no more than 10 min), missing a connection may only involve waiting another few minutes for the next arrival.
Fare and Service Integration Governance Structures
Service integration and coordination of schedules performs better under a coordinated governance structure which brings agencies and operators involved in service delivery together. There are many different structures and international examples of governance structures that support the delivery of integrated services. In GTHA, agencies do not know of each other’s planned schedule changes sufficiently ahead of time to factor them into their own scheduling before the schedules must be locked down for bid by operators and assigned to rolling stock (Z. Bédard, personal communication, 2024).
Coordination between service timetables requires adjustment when service timetables are changed under periodic service adjustments to meet system changes in demand and capacity. Timetable coordination can be undermined by service changes occurring on different dates and agencies not sharing draft timetables and planned service changes with each other ahead of time. European railways have a continent-wide timetable change on the second Saturday of December, making coordination easier by having all railways and most connecting public transport operators all changing their timetables on the same day. Regular and integrated timetables were first introduced in 1938 in the Netherlands and further expanded since the 1970s. In Switzerland, the federal government ensures coordination in the railway timetables, which are planned strategically to similarly ensure consistent departure times and easy transfers at interchanges ( 15 ). Similarly, Dutch and German timetabling practices explicitly prioritize cyclic takt timetables in the timetable planning hierarchy to an extent not seen in Sweden and the UK, which do more qualitative timetable prioritization to meld the timetables of different rail operators based on social benefit ( 16 ).
A German verkehrsverbund (a transport association or federation) is a regional transport alliance of public transport authorities and jurisdictional governments which sacrifice some of their independence and autonomy to better coordinate services and fares for passenger convenience in regional networks. The individual agencies continue to operate as independent entities, but the transport federation governs planning and coordinating functions to ensure their services exist as a single public transport network for the public ( 17 ). Topp suggests that, in essence, the transport federation is an advocate for passengers, while the operators retain their job of providing transport services. The service operator no longer matters to the customer journey, as fares, timetables, and customer service are harmonized. Schedule planning is done over the entire scope of origin to destination to explicitly account for transfers and minimize waiting times and travel times between different services interacting in the larger transport networks ( 18 ). Verkehrsverbunds typically organize their transport networks with regional lines serving as the backbone of regional travel, with tram and metro routes providing higher-capacity services on dense corridors, and buses providing more local services.
Verkehrsverbunds can take one of three forms, with different structures depending on specific legal, political, and Funding factors in the jurisdictions served. Those founded before 1990 were led by their member public transport operators, with jurisdictional governments having an advisory role, as characterizes an unternehmensverbunde form. In 1995, Germany devolved more responsibilities for public transport planning and Funding to state and local government, including devolution of regional rail responsibility. These factors encouraged the now most-common structure, an auftraggeberverbunde, where the jurisdictional governments lead on public transport decision-making including fares and services with advice from the transport agencies. The middle option is a mischverbunde, common in rural areas, with governments and professional operators have comparable decision-making influence ( 19 ). The federation is typically governed by a board composed of its member operators or governments, and it is accountable to both the operating agencies and Funding governments. Regardless of the structure, verkehrsverbunds allow for feedback and cooperation between governments and operators on service levels and coordination of services and fares.
Single regional transport authorities are responsible for all aspects of public transport in many jurisdictions as an agency of a state, provincial or regional government. These authorities may still subcontract operations to privately or publicly owned entities, but retain almost exclusive responsibility for fare policy, service planning and standards, and scheduling. For example, the South Coast British Columbia Transportation Authority operating as TransLink is responsible for transit in the Metro Vancouver region in Canada, including planning routes and setting timetables though operations of services are contracted out to subsidiaries such as the Coast Mountain Bus Company and British Columbia Rapid Transit Corporation, private entities such as First Transit and InTransitBC, and even the City of West Vancouver ( 20 ). The state department Transport for New South Wales in Australia contracts out all bus operations across Greater Sydney specifying service levels and approving service changes. For metropolitan bus routes required to connect with Sydney Trains, the operator must report punctuality relative to passengers transferring from connecting services ( 21 ). As shown, there are various approaches to service coordination as part of timetable planning within an integrated public transport network, along with coordinated fares and service standards.
Connection Convenience Metric and Methodology
A metric assessing connection convenience between lower-frequency services should ideally meet several requirements ( 22 ). First, metrics should be quantitative and repeatable to ensure consistent results and ready comparison. Second, the walking time required between the arrival and departure stops should be factored in, so passengers are not uncomfortably racing to make their connection. Ideally, connection convenience would be weighted by passenger demand. Amenities at stops—such as waiting areas, temperature control, real-time passenger information, washrooms, wireless internet, and cafes—would ideally also be considered in a parallel metric. Finally, the metric or combination of metrics should distinguish between long scheduled transfer times because of uncoordinated timetables and missed connections because of real-time performance such as delays or early trips, by comparing real-time and scheduled connection convenience. This ideal metric would be a combination of mostly quantitative metrics and largely qualitative measures used in concert, given available information.
The academic literature and industry practice is relatively limited in quantitatively assessing the quality of scheduled connections. As shown earlier, academic literature has focused either on transfer wait times or number of missed transfers, both of which can be irritating for travelers. Various metrics are either abstract or assume a feature of connections that may not be true (such as coordinated timetables or comfortable and safe waiting areas).
Inspired by the Swiss Federal Railways connection punctuality metric, the authors developed a metric assessing individual transfer movements from an arriving service (connection giver) to a departing service (connection taker) based on walking time and a maximum connection waiting allowance. “Minimum connection time” is defined as the walking time between the connection giver and the connection taker stop points. Figure 1 presents an example interchange layout breaking down transfer movements with their walking times between stop points. Walking between platforms may involve pathways, crossing streets, and changing elevation. Changes in elevation because of stairs/elevators between platforms and entrances are not easily identified in mapping services. The connection taker’s closest (minimum) time of departure

Passengers wish to minimize any waiting and get to their destination as soon as possible. A maximum connection time window
A transport authority should choose the maximum connection window that makes the most sense given their network, passenger sensitivities and preferences, and station environment. Passengers would be more comfortable waiting in a safer climate-controlled station with passenger information and amenities such as cafes. The connecting bus or train must leave during the defined connection window fixed based on the arrival time of the connection giver and the walking time between connecting stops. Thus, for a connection to be convenient, the departure time of the connection taker must satisfy the following inequality given the arrival time of the corresponding connection giver service:
Using the minimum connection time walking distance and the chosen maximum connection window, successful connections are those where the connecting service departs within the window between the minimum connection time and maximum connection window. Successful connections over an entire period p, typically a day, are divided by total connections of that transfer movement (a giver and taker stop pair) giving a percentage score using real-time and scheduled timetable data:
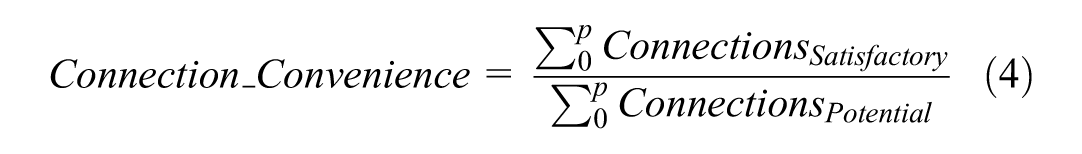
A higher connection convenience score indicates that a larger percentage (up to 100%) of all possible connections for a given transfer movement satisfy the standard above, to be considered convenient. These scores can be reported using real-time or scheduled arrival and departure times. Using real-time arrival and departure times means that the connection convenience score reports actual passenger connection experience.
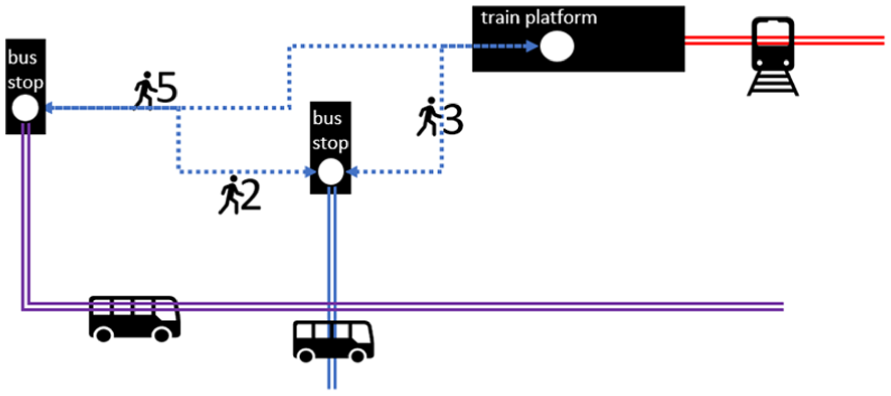
Diagram outlining conceptual interchange between a red train line and purple and blue bus lines to show elements involved in the proposed connection assessment metric, such as walking between the corresponding stops (shown by a dashed line).
Case Study
The proposed metric for assessing the quality of transfers is applied in GTHA. The GO Transit rail network is a regional commuter rail service serving the larger urban region centered around Canada’s largest city, Toronto. Traditionally, GO Transit has focused on rail services feeding CBD workers into downtown Toronto centered around Union Station. Recently, GO Transit has broadened its focus to leisure trips for downtown activities and suburban school and work commuters as a regional rail and bus service for the Golden Horseshoe. Figure 2 shows the current GO Transit rail services (GO Train) network: half-hourly service operates off-peak on the Lakeshore East and West Lines between Aldershot and Oshawa (shown in two shades of red), while service operates up to hourly on the Stouffville (brown), Kitchener (green), and Barrie (blue) lines. Only peak direction commuter service operates on the Milton (orange) and Richmond Hill (turquoise) lines. Most suburban GO Train stations offer connections with local municipal bus services and GO Transit’s regional bus services. GO stations providing interchange with the Toronto Subway network (marked with a red circle) are excluded from analysis because the subway operates at high frequencies of every 2–5 min, minimizing the total travel time impact of missing a connecting subway departure compared with lower frequency buses. GO Bus services extend the rail network to points not served by trains, provide orbital service around the region bypassing Toronto on major provincial highways, and replace train services not running. Over the next decade, Metrolinx, the regional transit authority, will expand GO Transit services extensively with higher line frequency, electrification of the core rail network, and provision of all-day service on most lines.
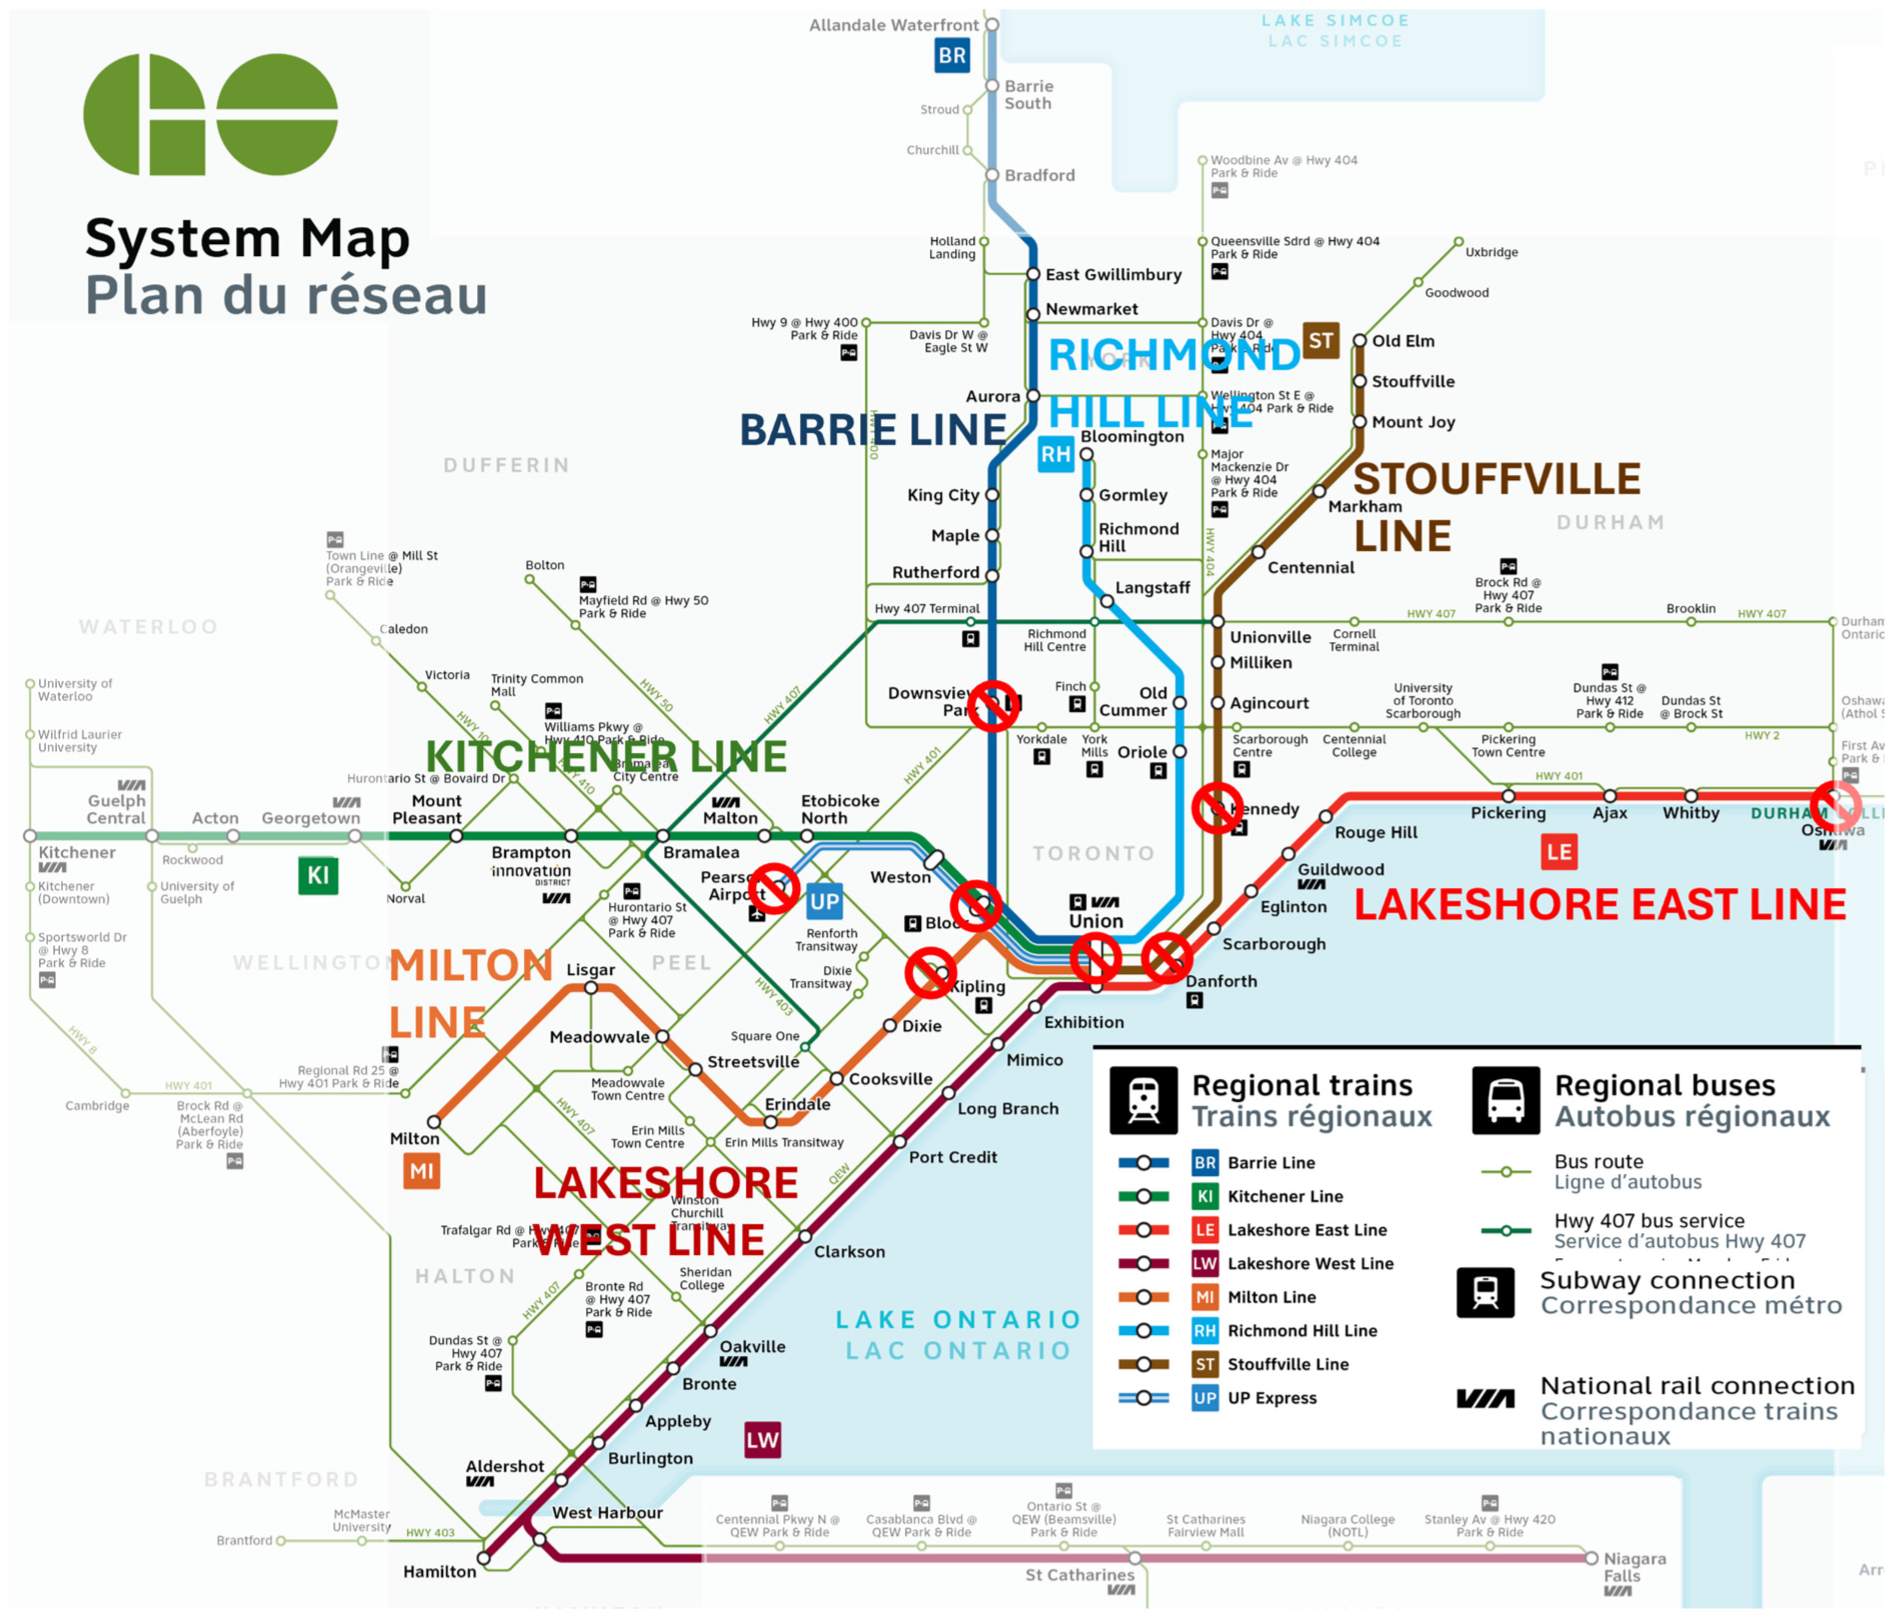
GO Transit network map showing GO rail routes, major GO bus routes, and the Union Pearson Express airport rail link (not to scale).
GO stations interchanging with the Toronto Transit Commission (TTC) subway stations such as Union Station, Kipling Station, and Kennedy Station, are excluded from analysis because of very short subway headways. GO stations outside the areas served by GTHA local transit agencies are also excluded. Connections from high-frequency services to low-frequency services are significantly more convenient than transfers between low-frequency services, as characterize today’s GO Transit and suburban bus systems, because customers can readily plan for the service to take to make the connection. Convenient transfers from low-frequency to low-frequency services require that arrivals and departures on interchanging services be within an acceptable waiting time of each other. Static GTFS transit schedules were pulled using the TransitLand API, and real-time data was sourced from TransSee for transit agencies covering GO Transit’s GTHA rail network: TTC urban bus and streetcar services and suburban bus services by MiWay, York Region Transit, Durham Region Transit, Burlington Transit, Brampton Transit, and Hamilton Street Railway ( 23 ). Oakville Transit and Milton Transit were excluded, as real-time data was not available. Routes of these and other connecting transit agencies in GTHA and surrounding area are shown in Figure 3 ( 24 ).
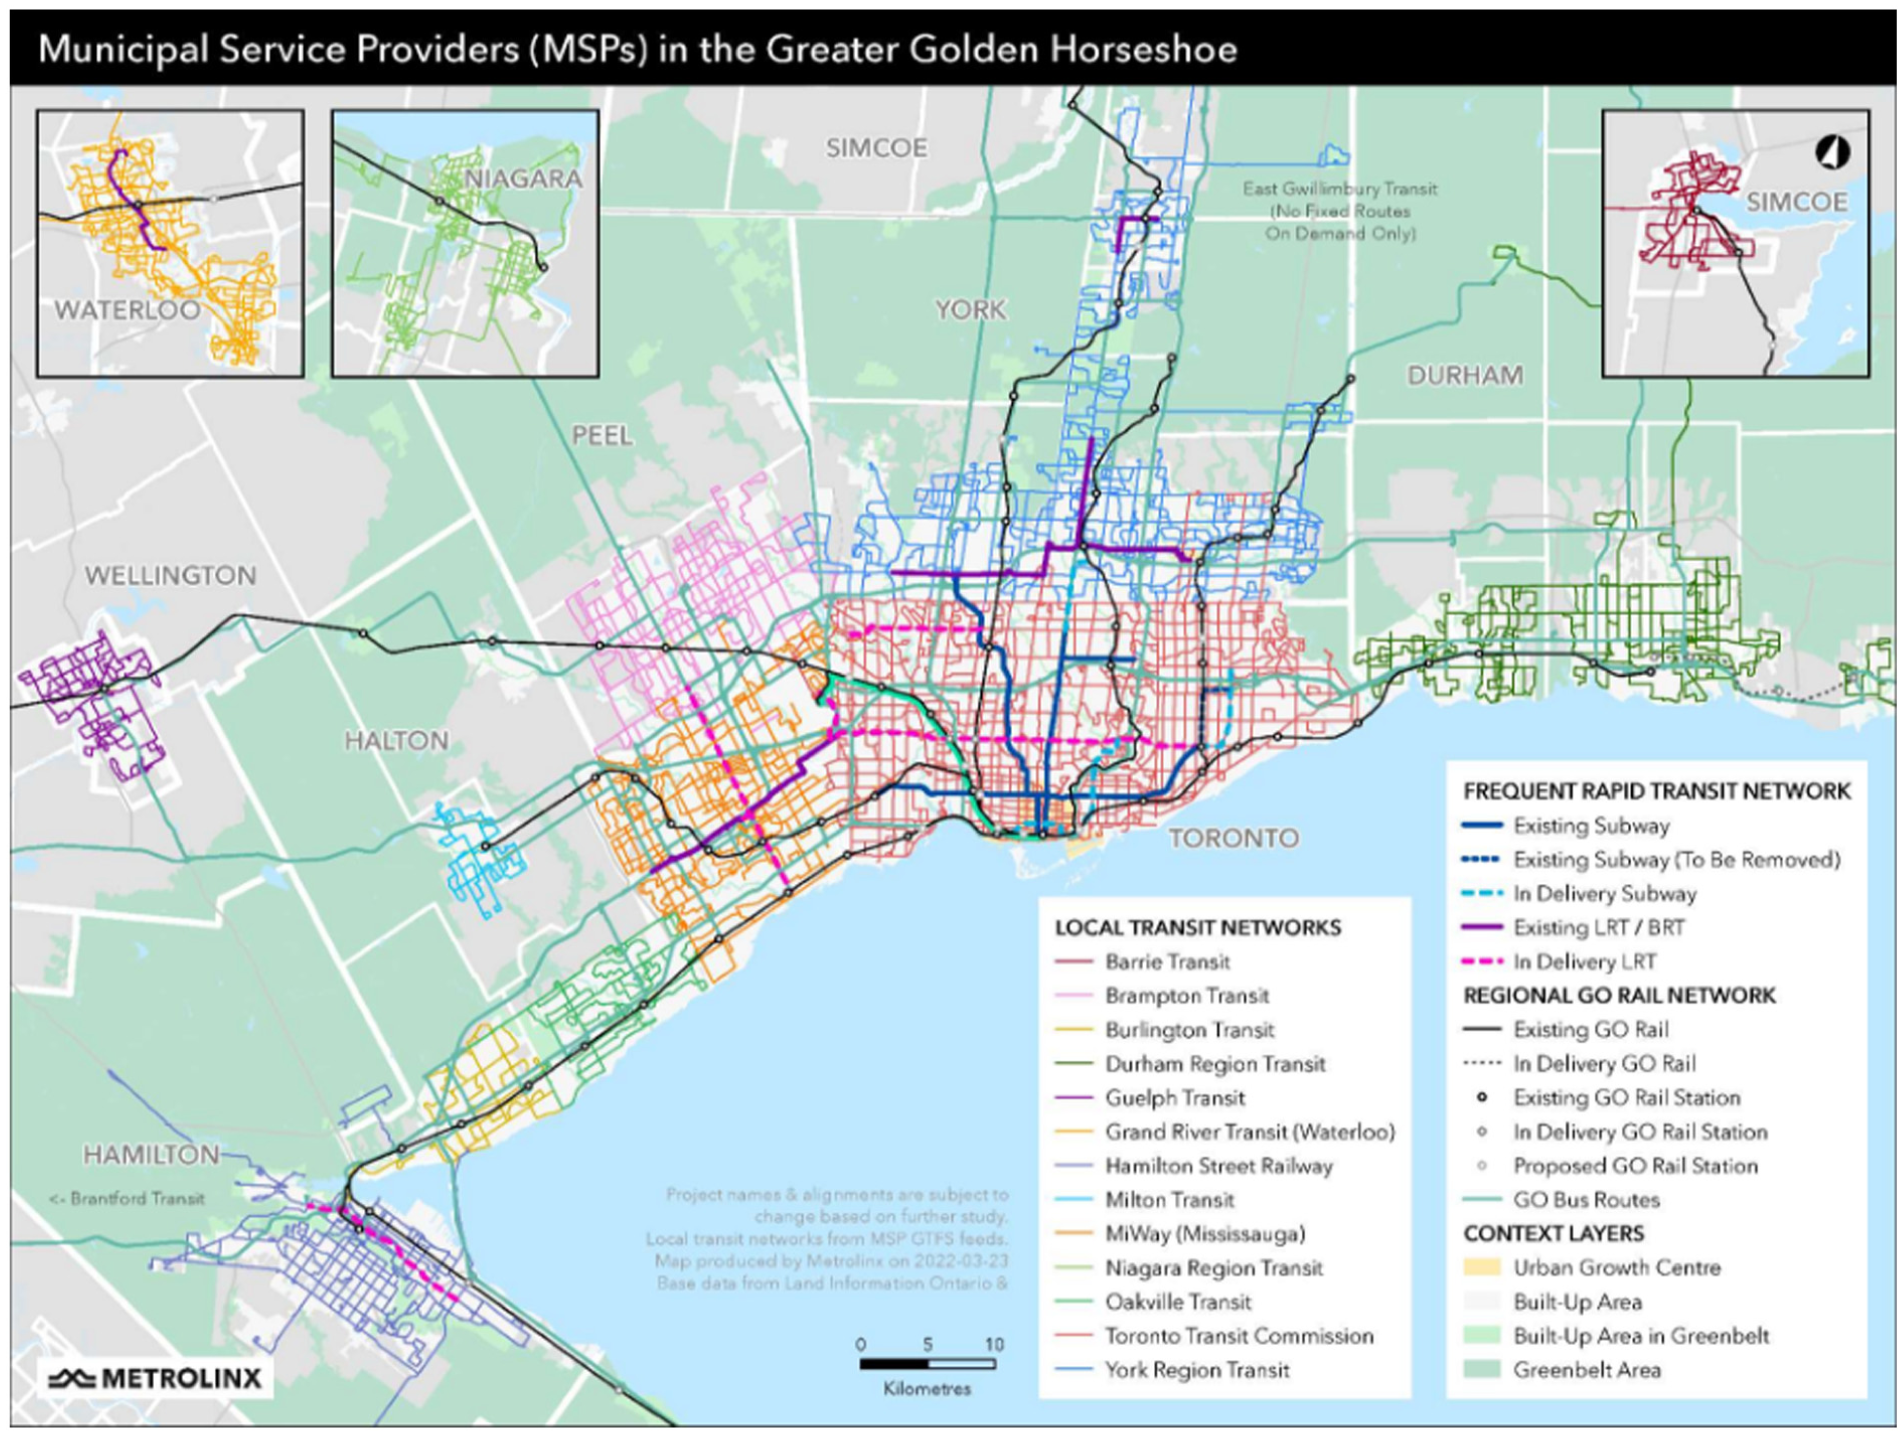
Map showing the Greater Toronto and Hamilton Area and the transit agencies serving the region (areas in inset and Guelph are excluded from analysis). Transit projects currently underway are also shown. (Source: Metrolinx.)
OpenStreetMap (OSM) is an open-source map of the world updated by users to keep it accurate and up to date with infrastructure changes that may occur. The online OSM for Ontario’s Golden Horseshoe was explored at various GO stations, especially those with recent renovations and upgrades, confirming the accurate representation of GO station layouts and reasonable routings for walking around the facilities. Sample walking directions using OSM at selected stations found sufficiently accurate and reasonable walking routes to predict walking times between adjoining streets, bus bays, and train platforms, compared against the authors’ experience and GO station plan drawings provided by Metrolinx.
Possible interchanging stops for each GO station were identified using a 360 m buffer using QGIS spatial join operations, before calculating walking distances to identify the closest preferred connecting stop. The minimum connection time is equal to the walking time determined from OSM at a conservative average walking speed of 1 m/s. Higher walking speeds would assume able-bodied regular commuters, while walking time must account for station doors, traversing stairs, and fare payment. Walking distances are found using the Open Source Routing Machine (OSRM)’s routes request service for walking (“foot” profile) returning distances in metres, divided by walking speed set at 60 m/min. A minimum value of 2 min was set to ensure reasonable transfer times between services calling at the same stop and for agencies reporting a single GTFS stop for an entire station, such as GO Transit which does not distinguish between platforms in its schedules (some stations may have up to four platforms).
Midweek dates outside holidays were chosen to reflect peak service provision, as partial work-from-home tends to reduce commuting demand at the beginning and end, rather than the middle, of the work week. Wednesday April 5, 2023, represents one of the last regular spring class weeks for post-secondary institutions across GTHA, while October 18, 2023, was a typical mid-semester fall day. September 2, 2023, was the last Saturday of the Canadian National Exhibition and the opening day of the Toronto Air Show, making it a busy weekend of civic events. The first major snowstorm of the year was on Tuesday January 9, 2024, making that an ideal day to allow consideration of how weather may affect transit operations and connection performance.
To prevent consideration of connections to limited-service routes when they are not operational, bus connections are closed out for departures more than an hour after the minimum connection time to walk from the arriving service. Connections are closed out if no bus arrives on a given route within the maximum connection window before the connecting service departs. Not counting connections before that window prevents unfairly penalizing connections with multiple arrivals before the connecting service departs, as with frequent routes, but prevents counting unsatisfactory connections before the connection window of the departing service.
As the OSRM routing service API pulls walking times based on snapping longitude and latitude coordinates provided from GTFS to the street and walking network, there may be errors in location or erroneous walking paths and thus distances. The authors manually checked all minimum connection times using the OSM website’s OSRM direction tool and Google Maps to ensure reasonable results. Most were quite reasonable, as OSM generally represents station areas more accurately and clearly than Google Maps does.
Connection convenience scores were calculated for a transfer movement across an entire day from 4 a.m. to 4 a.m. the next day. The metric should not make all connections look horrible or too good, but provide a useful comparison between connections that are good, okay, and bad, so that connections can be prioritized for improvement and timetable coordination.
Results
This section demonstrates the metric’s capability to highlight the comparative quality of transfers at different stations to help transit authorities identify the most critical connections for improvement. Because of data availability limitations, there is no information on demand for transfers at GO Train stations. Selected transfer movements have been manually verified. The “connection convenience score” refers to the percentage of daily connections meeting the standard outlined for each transfer movement (connection giver to connection taker), with a score of 1 indicating all connections that day satisfy the standard. Minimum connection times were calculated for each GO rail station hub between GO station and stops within a 360 m buffer of the GO stations for connecting bus and streetcar routes using OSM. As noted earlier, Oriole GO station was to be excluded because of connection to Toronto Subway Line 4, but reviewing the station noted that the Leslie subway station on Line 4 actually falls outside the buffer because the connection distance is too far to be practicable. Thus, Oriole GO is considered solely for connections to TTC bus routes 51 Leslie and 115 Silver Hills, which are far closer than the subway station to the GO station’s single platform.
Weekday transit connection convenience generally trends higher than weekend connection convenience, largely because of less weekend service and less timing for specific connections. As explained above, the maximum connection window is a fixed value defining the maximum time someone is willing to spend waiting for their connection at the stop or platform. In this analysis, 10 min is set for the maximum connection window during which the connecting service must depart, although other connection windows are later tested to explore metric sensitivity. A common rule of thumb for “turn-up-and-go” services is 10 min based on generally accepted values for defining a comfortable waiting time for frequent services where passengers do not consult timetables ( 25 ). Transport authorities and researchers could also opt for a different maximum connection window that better suits their network and customers’ needs. Passengers do not find it convenient to spend too long waiting for their connection, while too little time to make the connection is uncomfortable, and it is not reasonable to expect a too-tight connection window in a stochastic and complex transit system. Maximum connection windows could also vary depending on the interchange, with longer windows being acceptable at stations with additional facilities such as cafes, climate-controlled waiting areas, and public restrooms. In this analysis, the same maximum connection window is used for all stations because of limited quantitative data on station environment and amenities.
Most stations have a range of connection conveniences depending on the specific movement (route and direction of arriving and departing service) with lower convenience scores for connections to contra-peak routes and GO Transit “train-support” bus services replacing limited service trainlines. Real-time connection conveniences for each GO station between weekdays such as April 5 and October 18 are quite similar, so data from April will be focused on in Figure 4. The median connection convenience for each station is marked by a white line at the midpoint of the box while the boxes themselves outline the upper and lower quartiles, and the end of the whiskers show extremes of connection convenience scores. Toronto GO stations have the highest and most concentrated connection convenience scores because of frequent TTC connecting services, with many routes having 10 min or better headways all day. Outer suburban stations have lower median connection convenience scores and a bigger range between the most convenient and least convenient transfer movements. Stations with the fewest connecting routes—specifically Acton, East Gwillimbury, Georgetown, and Old Elm GO stations—have the lowest scores in addition to the fewest connections.
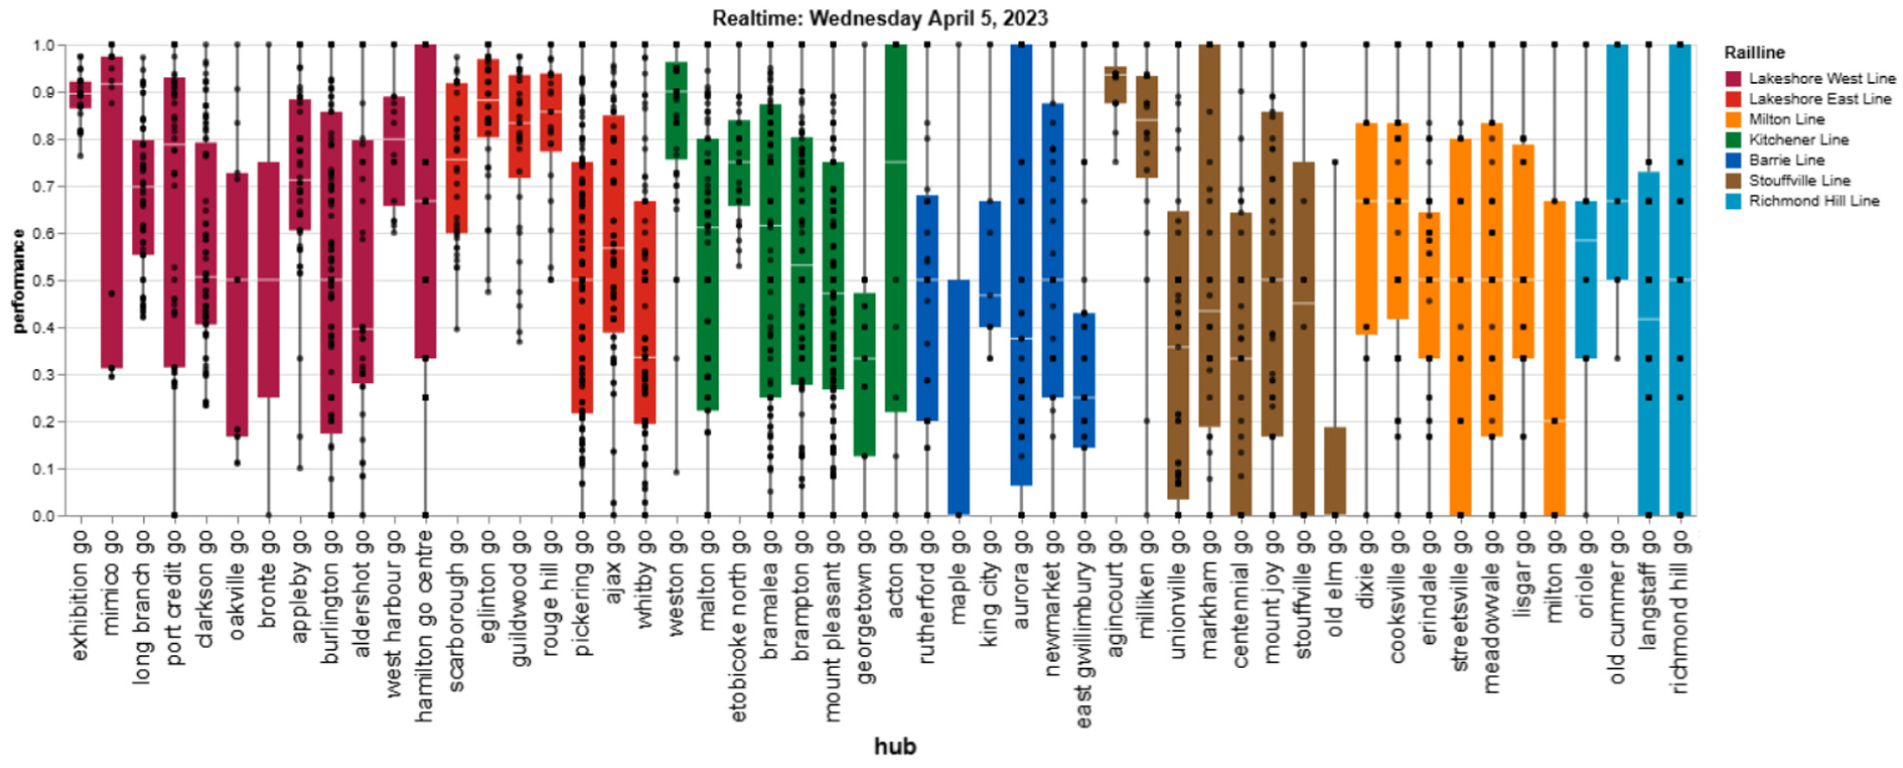
Box-and-whisker plot of connection convenience scores for GO Transit stations for Wednesday April 5, 2023, using real-time data.
Compared with the connection convenience scores based on real-time feeds’ actual arrival and departure times, there is marginally broader variation in the scheduled (static feed) connection convenience scores (see Figure 5) while the real-time connection convenience scores are slightly more concentrated, with narrower boxes in the box-and-whisker plots. Small shifts in arrival and departure times ahead of or behind schedule can affect whether a connection is within the window or just outside of it, before the minimum connection time is met for walking to the stop or after the maximum connection window for waiting for the connection elapses.
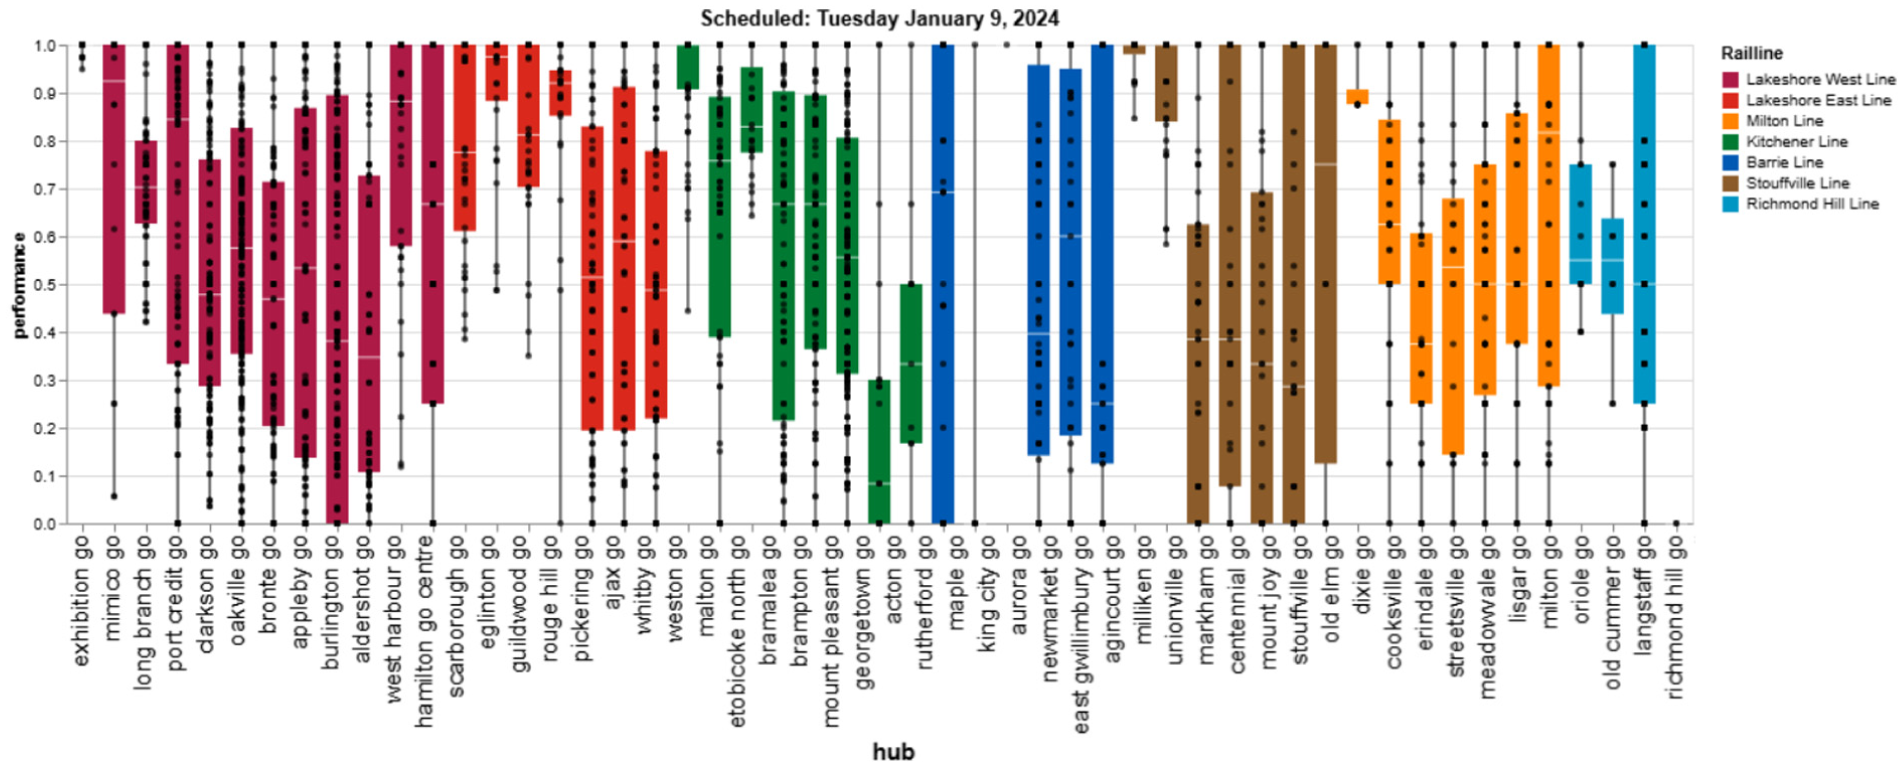
Box-and-whisker plot of scheduled connection convenience for GO Transit stations for Tuesday January 9, 2024.
A comparison between real-time and static connection conveniences was carried out by calculating the difference of successful connections under real-time and static divided by scheduled potential connections, thus a positive change indicates improved connection convenience real-time over scheduled and a negative change shows worsening connection convenience than scheduled. As with other measures of percentage change, this metric accentuates changes at stations with only a few potential or satisfactory connections a day, such as Stouffville and Old Cummer stations. Figure 6 compares connection convenience scores between scheduled connections and actual connections on April 5, 2023. Bars above the horizontal black zero-line show stations where the majority of connections are performing better than scheduled, while bars below show how the number of convenient connections is fewer than scheduled.
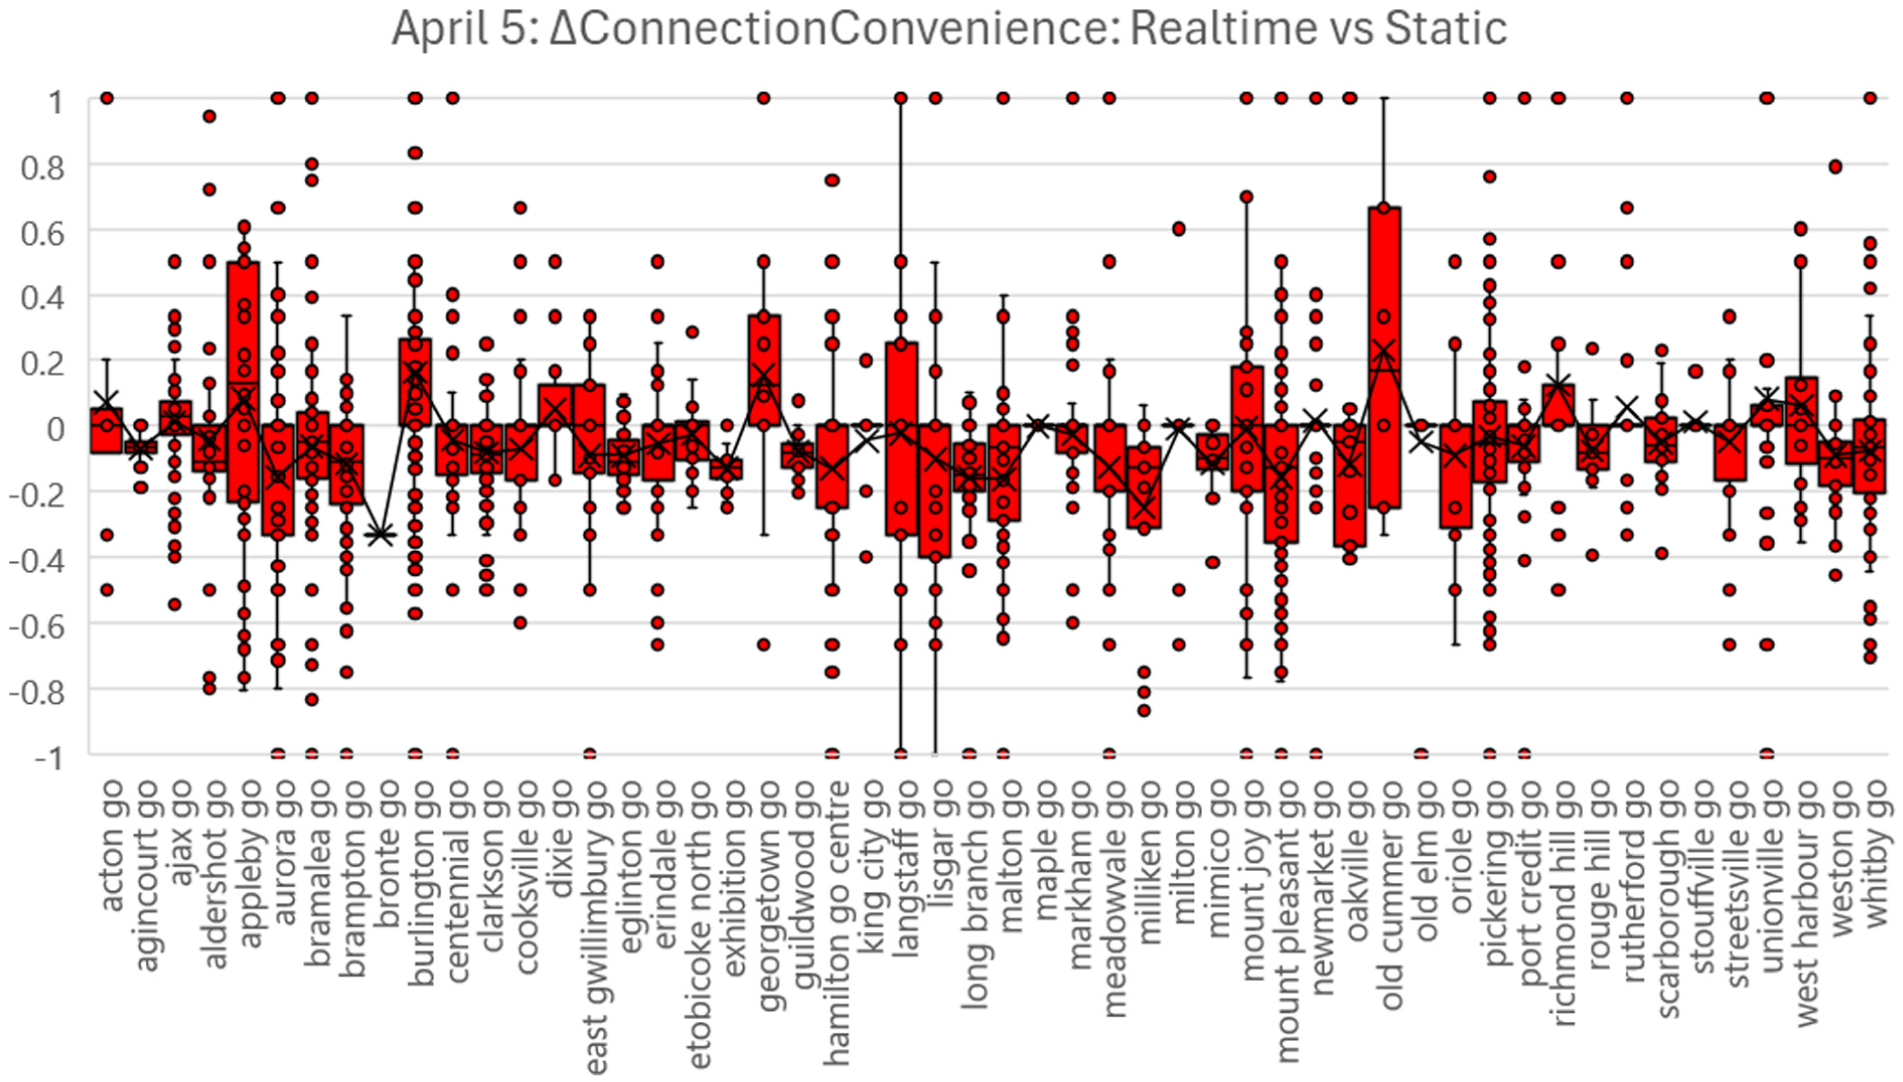
Box-and-whisker plot comparing static and real-time convenience scores for April 5, 2023. (Analyzed stations are listed in alphabetical order.)
Bramalea GO station is a suburban station on the Kitchener GO line in the City of Brampton. It is a major connection node with GO Transit’s own regional express buses, with the most connecting GO routes of any train station outside the core. Brampton Transit routes also connect the station with surrounding suburban low-density residential and industrial areas around the station. Figure 7 highlights the variation on April 5, 2023, in scheduled connection conveniences across the various movements to and from connecting routes. Note that not all GO Trains run as far as the final station, Kitchener, with most services short turning. Connections appear to generally be worse for connections from GO Trains than for connections to GO Trains. Connections to GO bus routes (Routes 30, 31, 32, 33, 36, 41, 47, 48, and 56) are not much less convenient than regular Brampton Transit routes 11, 15, 16, and 40. Brampton Transit ZUM 501 higher-frequency, limited stop “priority bus” route has among the highest connection convenience scores of any route. GO bus routes 30, 31, 32, and 33 are classified as train-support routes which primarily feed and replace train services when train services are limited or not operating.
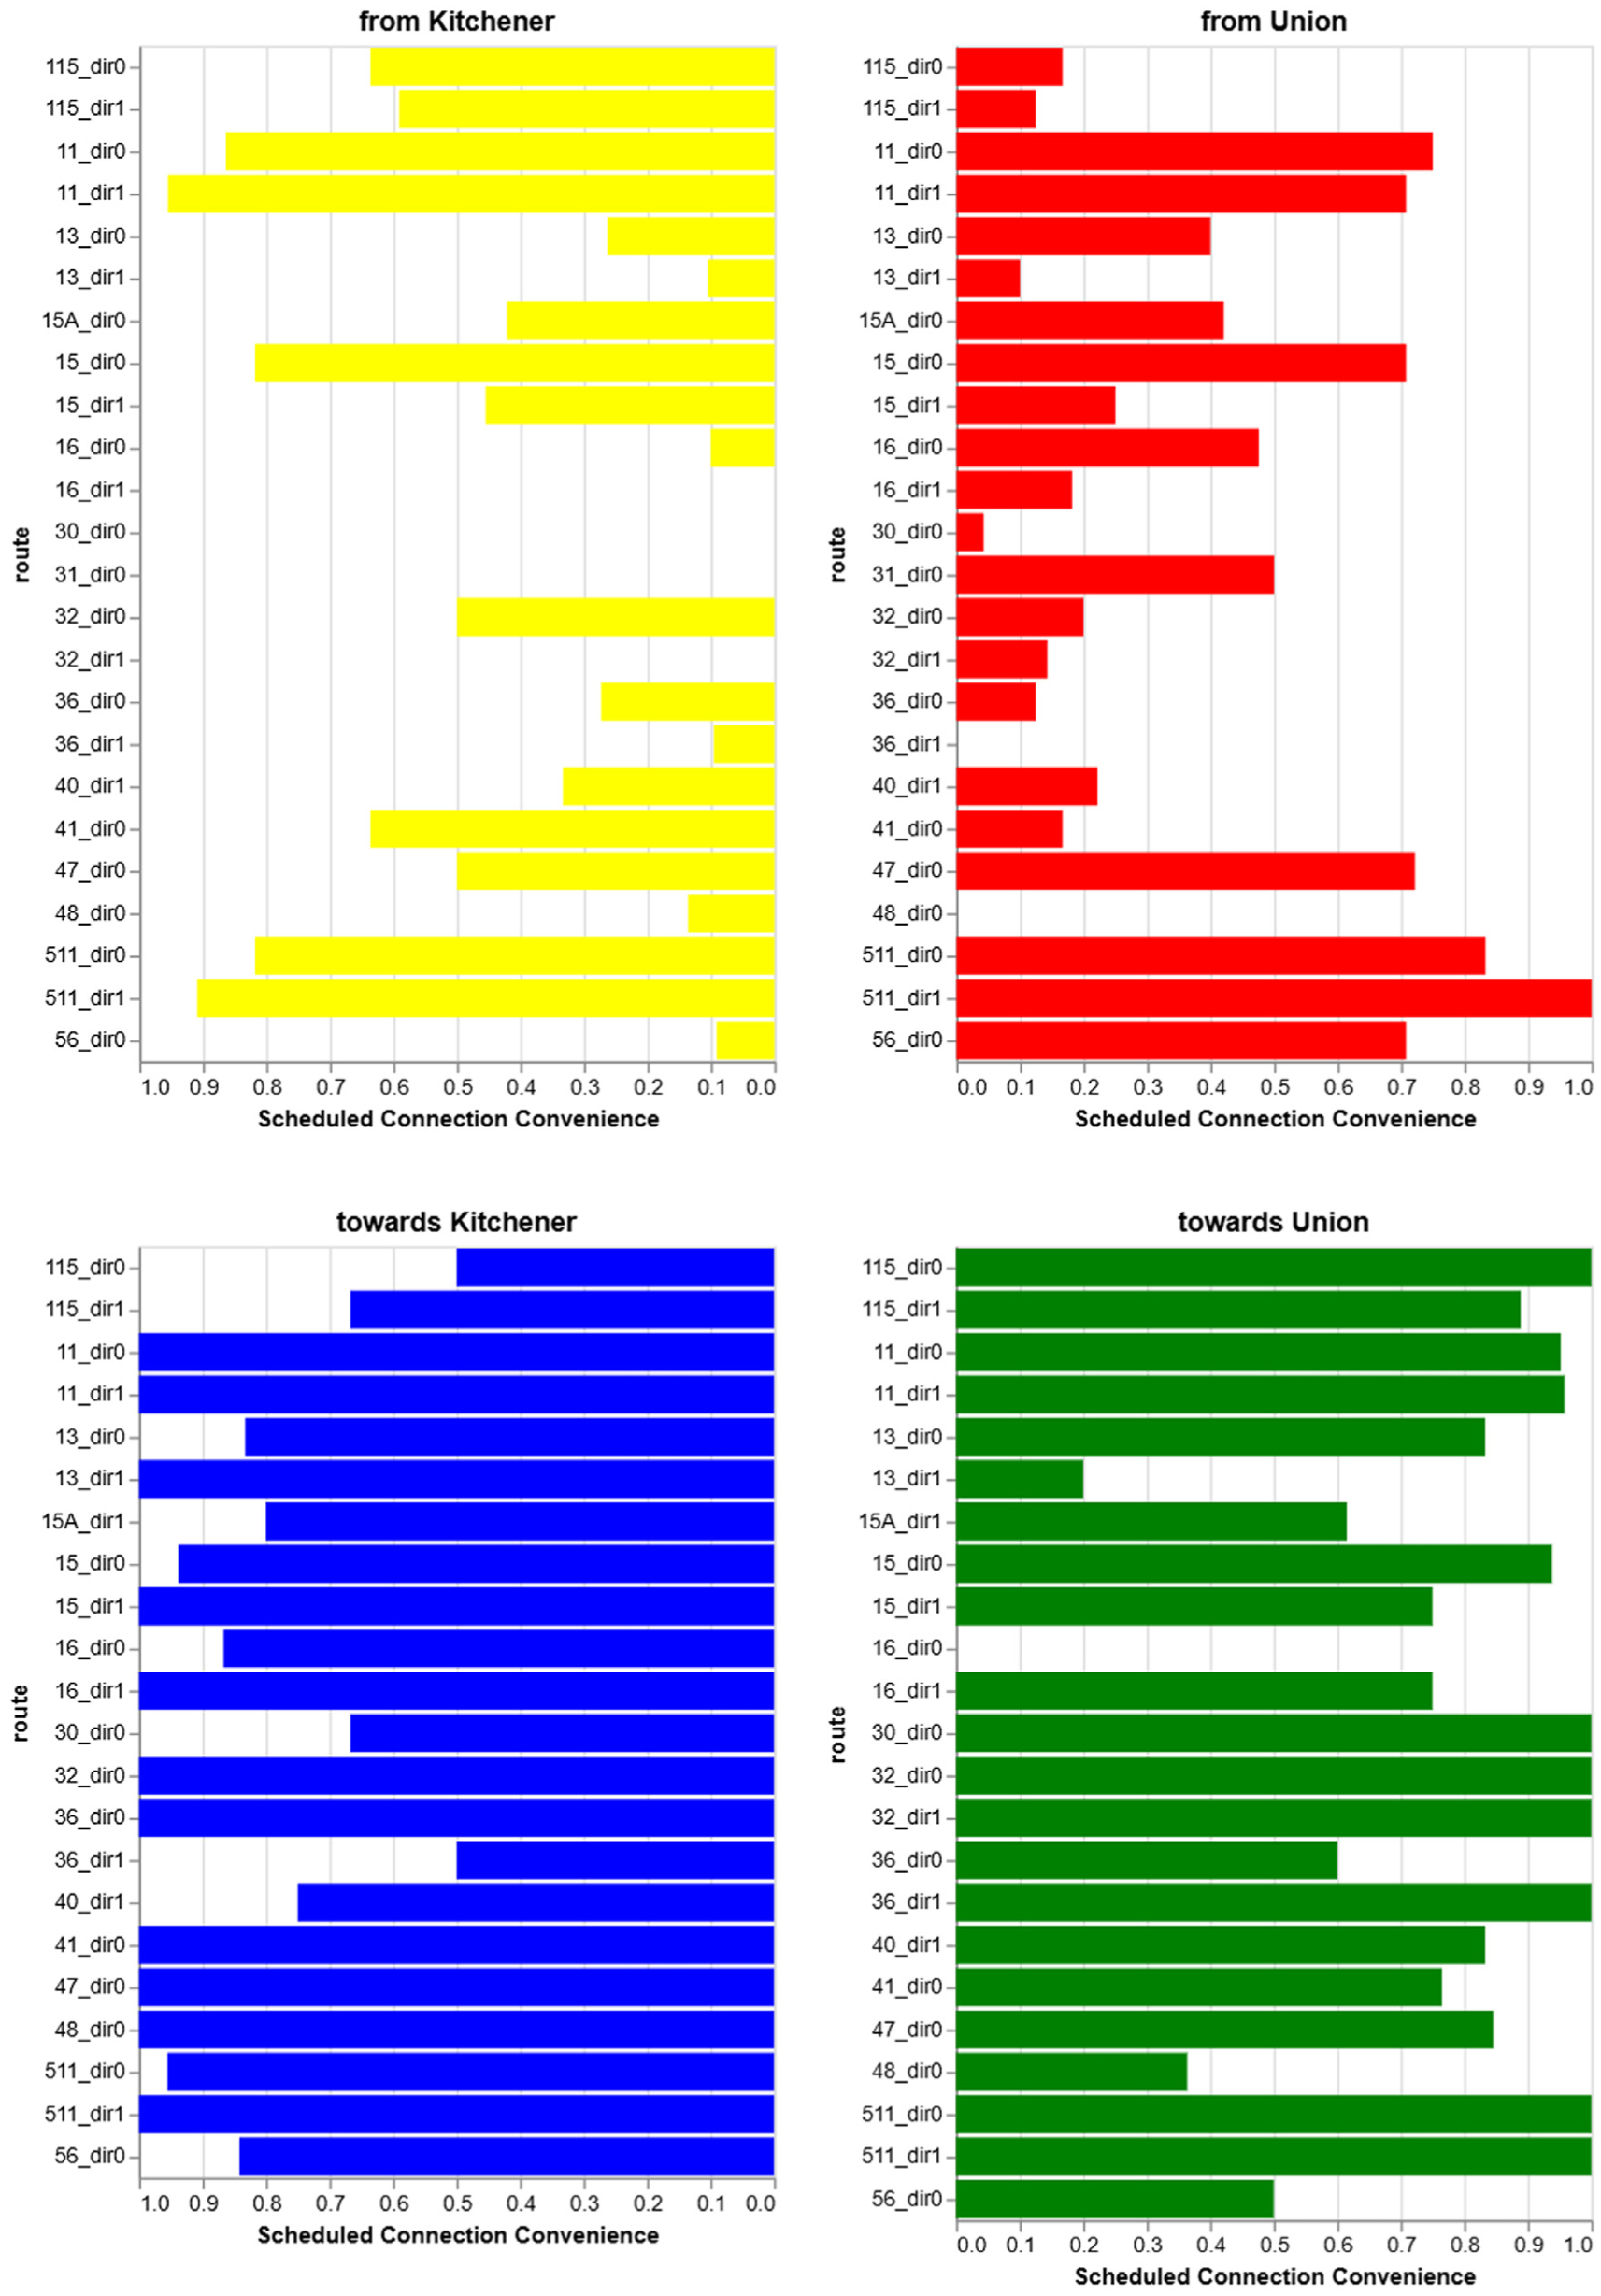
Scheduled connection conveniences for each transfer movement for the connecting routes at Bramalea GO station on April 5, 2023. The upper figures show scheduled connection convenience calculated for connections to bus routes from eastbound GO Trains (originating at Kitchener or stations east of there) on the left and connections to bus routes from westbound trains originating at Toronto Union Station on the right. The lower left shows connections from bus routes to westbound GO Trains towards Kitchener or terminuses enroute, and the lower right shows connections from bus routes to eastbound trains toward Toronto Union Station.
Under a looser maximum connection window of 15 min before walking to or after walking from the connecting train, most GO rail interchanges have near perfect connection convenience for many routes and directions, as shown in Figure 8 for October 18, 2023’s real-time data. A connection allowance of 15 min including any walking time is typically used by GO Transit for scheduled connections between their own trains and buses without factoring in a distinct station-specific walking time as in this analysis, while many major suburban bus routes run half-hourly making an excessive 15 min the average wait time under random departures. Thus, connection conveniences score higher under this extended connection window, with most interchanges scoring perfectly satisfactory for at least one transfer movement. Arguably, however, the connection standard becomes too weak to meaningfully identify and prioritize connections for improvement, because almost every connection appears good enough. Fundamentally, the point of a metric is to evaluate current services for improvement and refinement, thus a broad metric will not sufficiently challenge and motivate improvement in timetable coordination and connection scheduling. Furthermore, 15 min in addition to the required comfortable walking time between stops is itself a long maximum time to be waiting for a connecting service on the connecting service’s platform.
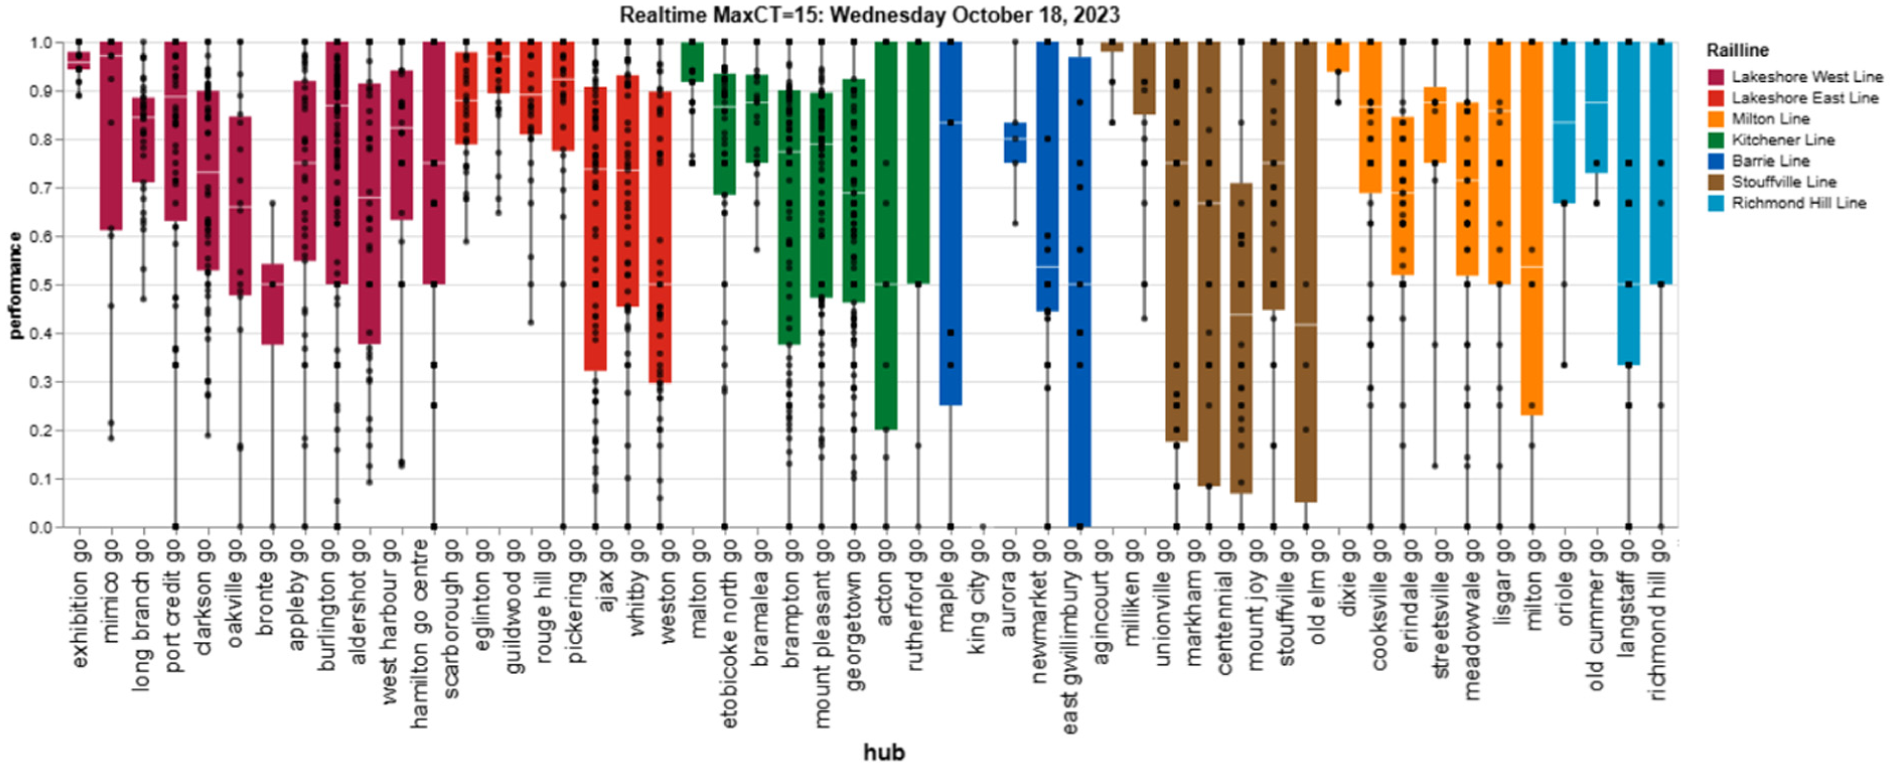
October 18, 2023, real-time data connection convenience under a maximum connection window (MaxCT) of 15 min.
A tighter connection window of 5 min for the departure of the connecting service after walking to the connecting stop was also applied to the same analysis days and stations. As Figure 9 shows for April 5, 2023, real-time connection conveniences, most stations then have failing transfer movements, while Toronto GO stations lose their near-perfect connection conveniences with most movements scoring only above 75%. This highlights that the convenient connections between many TTC services and GO Trains are because of TTC service frequency and not a conscious effort to coordinate bus and streetcar arrivals/departures for quick transfers to and from GO Trains with minimal waiting. Ideally, 5 min maximum connection windows should be used to provide the most convenient transfer experience practicable, although this reduces the “grace” in the connection standard for late or early running services. A maximum connection window of 5 min should be considered for connection coordination and scheduling to maximize the convenience of connections and be applied to assessment of transfer movements already scoring high to refine those connections.
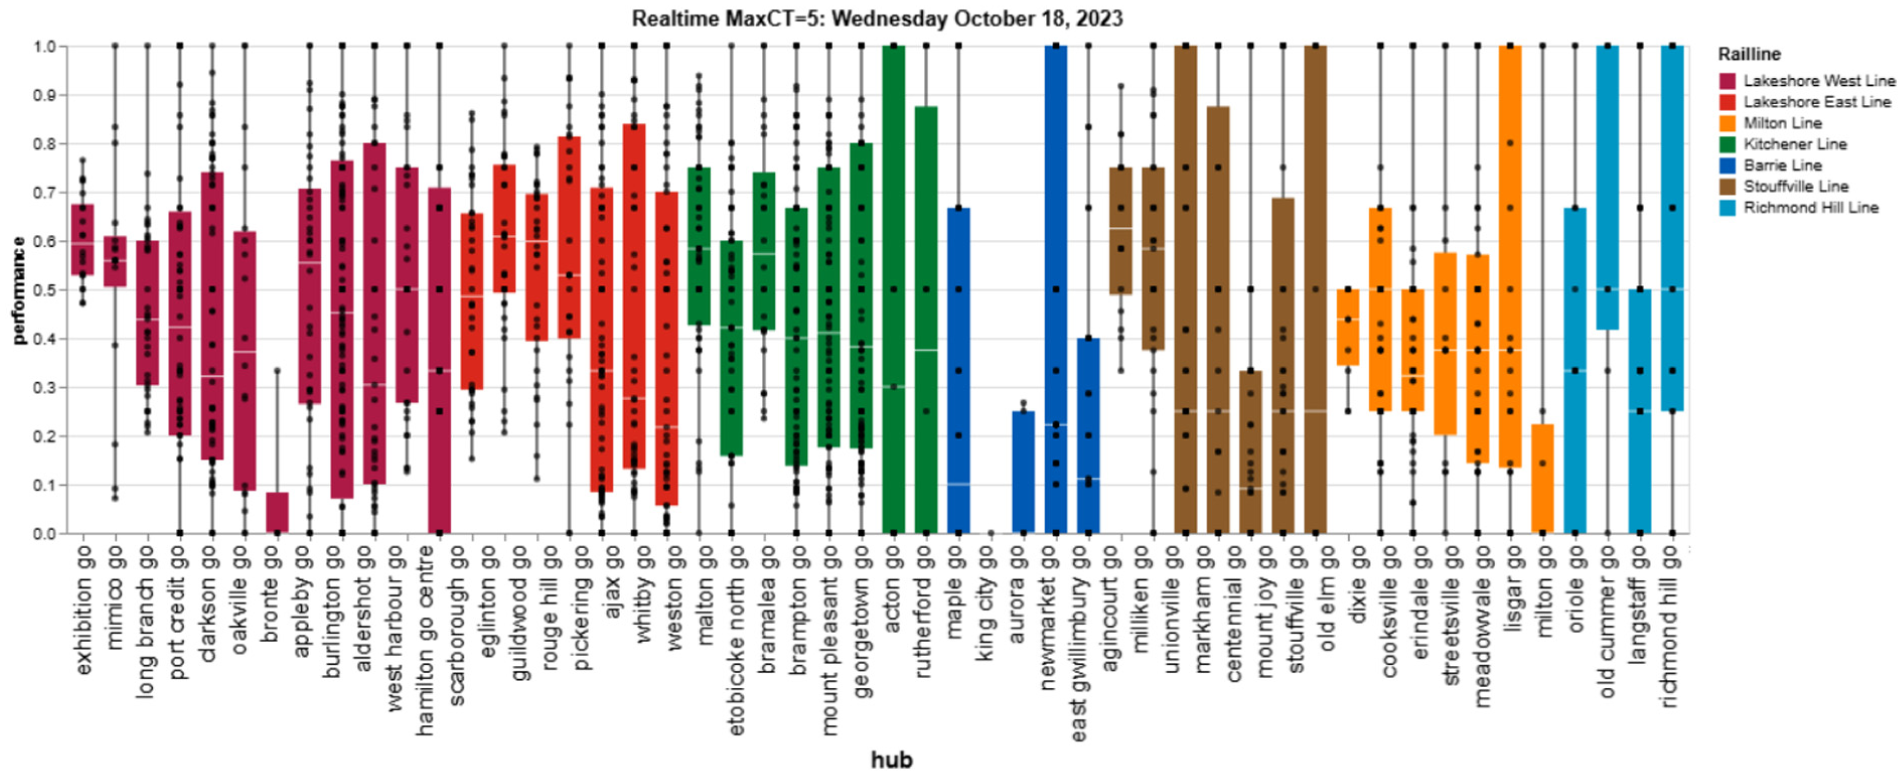
Real-time connection convenience scores for Tuesday April 5, 2023, under a maximum connection window (MaxCT) of 5 min.
Results do not differ significantly between days. Connection conveniences may appear negligibly lower on January 9, 2024, which experienced a large snowstorm (see Figure 5), and there can be fluctuations across the year on both scheduled connection convenience—as different agencies change schedules on different days and may align to train departures over time—and real-time connection convenience, because of traffic, weather, random delays, and operational incidents across the respective agency’s networks and services. However, these differences are not significant.
The minimum connection times, which are walking distances from the rail station to connecting bus stops calculated from OSM, highlight places of concern for connections. For any connection presented earlier to be deemed convenient, the transfer time must be sufficient to accommodate walking time between the rail station and connecting bus stop. The walking times present a glimpse of how the station facilities and layout support intermodal transfers, with shorter connection times indicating conveniently located bus bays or bus stops, compared with longer connection times suggesting it may be necessary to cross a busy road or large parking lot, as can be unfortunately common at commuter rail stations built around park-and-ride patronage. Figure 10 presents the range of minimum connection times seen at each GO Train station modeled in this analysis. Stations on the Lakeshore lines generally feature bus loops located close to the station building, while stations in Toronto have nearby on-street bus stops. Some stations, particularly on the Barrie, Richmond Hill, and Stouffville lines in York Region and the Milton line in Mississauga, lack bus loops or have them not used by most local transit buses, relegated instead to on-street bus stops on nearby suburban arterials across the parking lot from the station building. Stations with a bar have varying walking distances, with some connecting bus stops (such as to GO buses or certain local routes) located closer to the station building and platforms than other bus stops. The closer routes are not necessarily the most frequent or useful for feeding passengers to the suburban railway service.
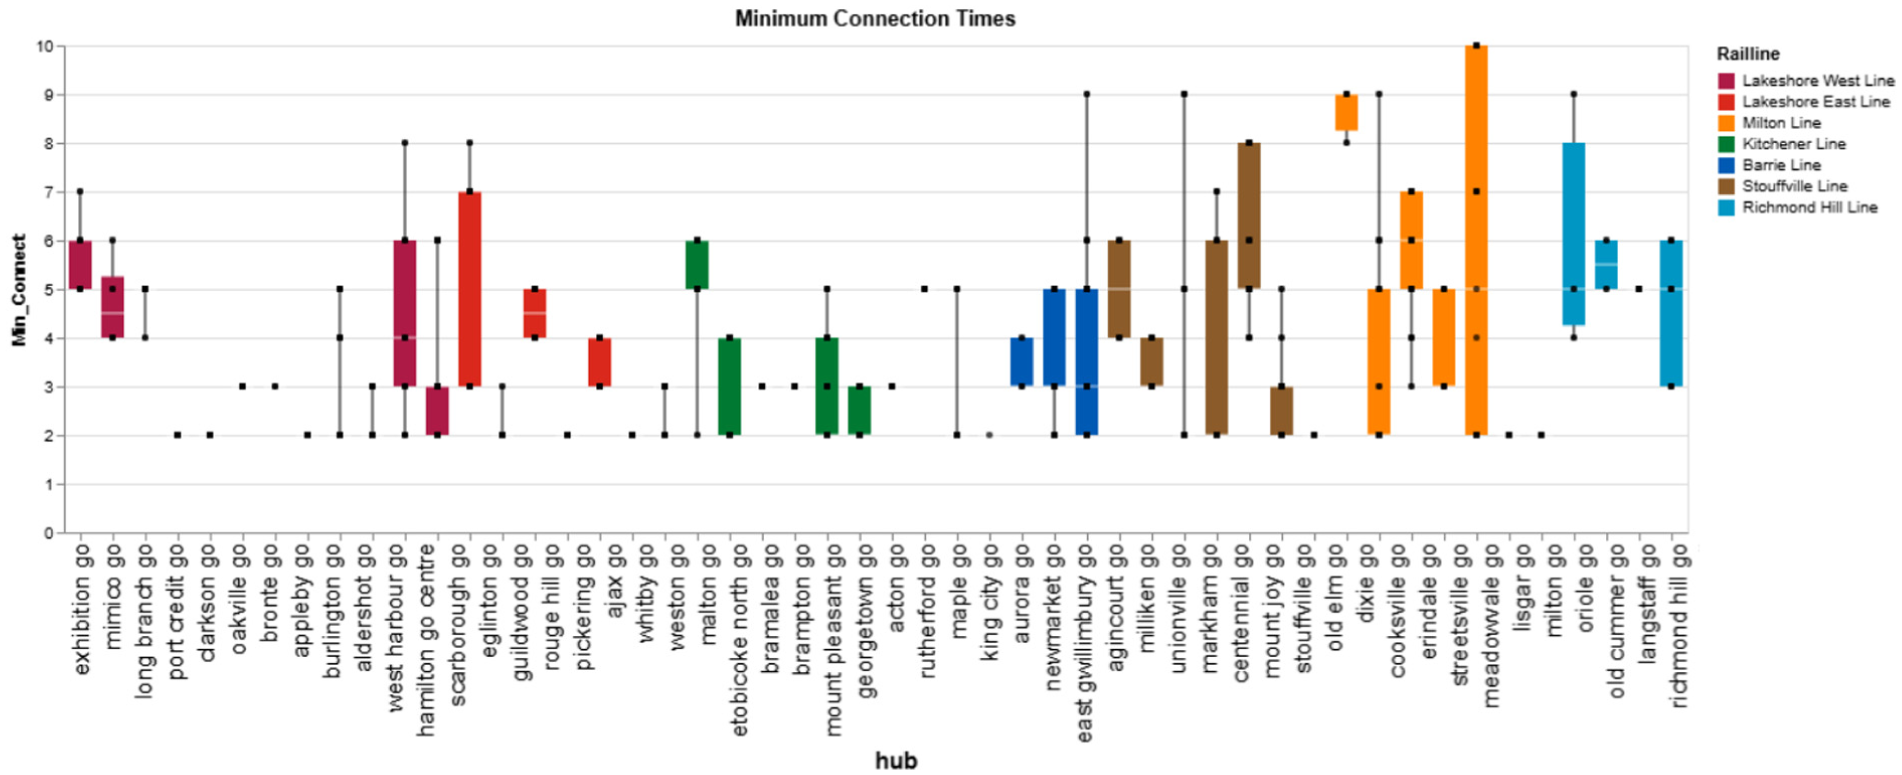
A box-and-whisker plot of the minimum connection times (walking distances) for transfers to connecting routes at each GO Train station (as of January, 2024).
At stations without dedicated bus loops, the railway line is typically away from intersections, where most bus stops are located. Thus, midblock stops may be needed, or the addition of midblock crosswalks or express routes calling at otherwise low-demand local stops, to facilitate connections with the rail service. Improvements are already being made to transfer facilities as part of GO station upgrades or other rail network improvements for GO expansion. TTC added a new express and local stop for all routes at Milliken GO station on Steeles Avenue with Metrolinx’s completion of the Steeles Avenue East grade separation in September, 2023, making connections more convenient, as connecting passengers no longer have to walk to the nearest intersection, saving 6 min walking time.
Conclusion and Further Research
Service integration between transit operators and their services is a critical part of making the use of public transport in large urban regions appealing. Most urban regions in North America are served by multiple transport operators owned by various levels of government each providing different services that together can help move people across the region safely, quickly, and reliably. With better timetable coordination, bus feeder services could play a larger role in first-mile access and last-mile egress for suburban commuter rail services. This paper presents a synthesis of academic literature and current international best practices for quantitative assessment of connections and schedule coordination for connections, including a summary of governance structures supporting service integration.
This paper proposes a quantitative connection convenience metric to report the quality of scheduled connections between transit services at a given interchange. This metric allows transit agencies to better monitor the quality of intermodal transit services, allowing TTS scheduling to be applied to the most important and poorest performing connections in a network. Traditionally, transit agencies or researchers would exogenously choose connection nodes for prioritization in scheduling, timetable coordination, and stop improvements based on qualitative considerations such as location and passenger feedback. This metric presents a quantification based on existing and available timetable data of the connections which perform conveniently and those that perform poorly. The connection convenience metric reports the percentage of connections during the day’s analysis period satisfying the standard for a convenient transfer, given scheduled or real-time arrival and departure times. The connection walking times also highlight stops benefiting from infrastructure improvements such as relocated bus stops and bus loops to shorten transfers.
Open-source OSM information was used to determine walking distances between connections for GTHA transit agencies. While most GO stations have large bus loops adjoining the station entrance, these are sometimes not served by municipal bus serves, especially in York Region. Elsewhere, customers must walk to the nearest major intersection because either select express routes or all bus routes do not stop closer to the GO rail station entrance, which may be midblock.
As expected, connections with higher-frequency GTHA suburban routes, such as buses running every 15 min or better, perform noticeably better than lower-frequency routes. This highlights a dearth of schedule sharing and timetable coordination between transit agencies in the region. Connections are generally better to the Lakeshore and Kitchener GO lines, which feature dedicated bus loops at most stations, than the Barrie, Richmond Hill, and Stouffville lines where most connecting routes serve adjacent on-street stops. Most municipal transit agencies do not consider GO Transit rail timetables in the scheduling of their own services, undermining the use of public transit to access/egress rail services, even with the introduction of the OneFare policy’s free transfers.
Current trends with transit data and standards are promising for this means of assessing the quality of transfers. Mobility data is expanding GTFS to include station layouts and platform assignment at bus and train stations. This analysis could be simplified by using the currently optional pathways.txt GTFS constituent datafile with the transfer time parameter. However, to be useful, that information must be included and shared in transit agency GTFS feeds. Expansion of the metric to include consideration of stop amenities is a possibility, provided common information and definitions to maintain a rigorous metric. Further expansion in the GTFS specification and required files and input data would allow more comprehensive connection quality metrics and better passenger information.
The proposed metric can readily be improved or expanded. Applying it to other transit networks, even for transfers not involving different operators, offers a means to diagnose impartially and quantitatively the quality of transfers between transit services in that city. Real-time passenger demand and ridership data, such as from an electronic farecard system, especially from those with both a tap-on and tap-off giving full origin and destination data, would help compare and prioritize connections for improvement. The metric could also be expanded to provide a more nuanced understanding of passengers’ experience of transfers by varying the maximum connection window depending on station environment and amenities. Connection metrics could also account for the impact of missing a transfer, with the quantitative scoring of connections factoring in the headway of connecting routes to compare between low and very low headway service. This research did not distinguish between the headways (and thus penalty for missing a connection) of low-frequency services, which could be every 20 or 30 min, or only every hour or worse. Finally, adjusting this metric to assess high-frequency to high-frequency and low-frequency to high-frequency transfers would expand the understanding of passenger experience of connections, even though these transfer movements are considerably more convenient and less “risky” for passengers with regard to delay and waiting time.
Footnotes
Acknowledgements
The authors gratefully acknowledge the funding from the Province of Ontario.
Author Contributions
The authors confirm contribution to the paper as follows: study conception and design: W. Tattersall, A. Shalaby; data collection: W. Tattersall; analysis and interpretation of results: W. Tattersall, A. Shalaby; draft manuscript preparation: W. Tattersall. All authors reviewed the results and approved the final version of the manuscript.
Declaration of Conflicting Interests
The authors declared no potential conflicts of interest with respect to the research, authorship, and/or publication of this article.
Funding
The authors disclosed receipt of the following financial support for the research, authorship, and/or publication of this article: This research was funded under the University of Toronto’s Ontario Research Fund – Research Excellence Program from the Government of Ontario; Grant Number ORF-RE10-021.