
Abstract
Public transportation plays a vital role in promoting environmental sustainability and providing convenient transportation for the public. However, individuals with disabilities encounter significant challenges while using public transportation, necessitating an evaluation of their satisfaction levels to address the barriers they face and ensure social equality. Therefore, in this study, a questionnaire survey was conducted on people with disabilities using public bus transportation in Istanbul, Türkiye, and Bayesian network (BN) analysis was used to identify the most relevant factors affecting passenger satisfaction. Based on the findings, increasing bus frequency, improving accessibility, and adequacy of spaces designated for passengers with disabilities, and enhancing security measures are recommended. This study’s contribution lies in introducing a BN model to visualize probabilistic reasoning among factors, offering scenarios to reduce dissatisfaction levels, and identifying key factors affecting passenger satisfaction, demonstrating practical implications. In particular, the results provide a framework that can guide policy makers and transportation providers in translating statistical findings into concrete improvements in accessibility, service reliability, and passenger safety, enhancing the real-world travel experiences of people with disabilities.
Introduction
Public transportation refers to various modes of transport that are available for use by the general public, such as buses, trains, subways, trams, and ferries. These modes of transportation are usually operated by government agencies or private companies and are designed to provide affordable and convenient travel options for people. Furthermore, it is crucial for modern societies because it provides a sustainable way of commuting for millions of people worldwide ( 1 , 2 ).
Public transportation plays a vital role in mitigating traffic congestion, reducing air pollution, and limiting greenhouse gas emissions, and it provides mobility and access to employment, education, healthcare, and other essential services. However, people with disabilities face several challenges when using public transportation, including the lack of accessible infrastructure, such as ramps, lifts, and audio-visual announcements ( 3 ), as well as seating arrangements on buses and narrow aisles, which create difficulties for wheelchair users and people with mobility impairments ( 4 ). In addition, the lack of adequate customer service and support for passengers with disabilities can exacerbate their discomfort and dissatisfaction with public bus transportation. These challenges are from physical barriers to social stigma, which can cause discomfort, dissatisfaction, and even exclusion ( 5 ). Therefore, improving the accessibility and inclusivity of public transportation systems for passengers with disabilities is an essential task for policymakers, transport operators, and society.
Istanbul Public Bus Transportation is the primary public transportation operator in Istanbul, Türkiye, serving over 3 million passengers daily, according to a 2022 report by the Istanbul Electric Tram and Tunnel Company (IETT). The company operates a fleet of over 6,000 buses, covering more than 700 routes and 15,000 bus stops across the city. With such a vast network, Istanbul Public Bus Transportation plays a vital role in the daily lives of Istanbul’s residents and visitors, including people with disabilities. More than 130,000 people with disabilities benefit from public transportation free of charge ( 6 ). The Istanbul Metropolitan Municipality (IBB) has implemented various services to ensure social equity for people with disabilities in public transportation, including accessible transportation services, such as buses and trams, with wheelchair ramps and low floors ( 7 ). In addition, the municipality has installed tactile paving on sidewalks and near public transportation stops to assist people with visual impairments in navigating the city. As a result of these and similar advances, steps are taken toward social equality by increasing the satisfaction of passengers with disabilities. The municipality continues to implement initiatives to increase the travel comfort of passengers with disabilities ( 8 , 9 ). However, it is important to investigate the level of satisfaction among passengers with disabilities with public bus transportation, the factors that most affect passenger satisfaction, and the most common complaints of dissatisfied passengers to further improve their travel experience.
Regional and societal differences play an important role in the social inclusion of people with disabilities. In Istanbul, a metropolis where public transportation systems, a vital component of social inclusion, are heavily used, studies on the problems faced by passengers are available ( 10 – 12 ); however, studies specifically focused on people with disabilities are quite limited ( 13 , 14 ). Evcil and Yalçın Usal ( 13 ) focused on how wheelchair users access the Bus Rapid Transit (BRT) system’s route. They measured and observed whether underpasses, overpasses, turnstiles, boarding, and alighting conditions for vehicles were suitable for wheelchair users to access BRT platforms. According to their study’s results, it was revealed that the BRT system, which should be accessible to the community, is inadequate for accessibility for passengers with wheelchairs. Varer and Akyıldız Alçura ( 14 ) conducted semi-structured interviews with 43 passengers with disabilities who traveled by bus during the pandemic period, focusing on the restrictions implemented. Their study addressed specific barriers related to different types of disabilities, determining that the pandemic negatively affected existing conditions.
In this study, the satisfaction level of passengers with disabilities is analyzed based on their responses to a questionnaire. The most related items in increasing general passenger satisfaction are determined using a Bayesian network (BN). A BN is a probabilistic graphical model that allows the representation of complex systems and their interactions between variables. Sensitivity analysis with a BN helps detect the variables that are most associated with the target factor. The use of What-If scenarios after model building visualizes the factors that affect the target item using plain and comprehensible graphics. Unlike traditional methods, the BN model offers a dynamic structure that provides different perspectives on passenger satisfaction via various scenarios based on the states of variables. Therefore, using the dynamic BN model in transportation studies allows researchers and policymakers to conduct more flexible and comprehensive analyses. This will enhance the effectiveness of decisions, leading to more accurate and sustainable solutions for passenger satisfaction and operational efficiency. The aim of this study is to investigate the factors affecting the satisfaction level of passengers with disabilities using public bus transportation in İstanbul, Türkiye, by utilizing a BN. By modeling the relationships between the factors that influence satisfaction levels, critical factors are identified, and strategies are developed to enhance the satisfaction levels of passengers with disabilities. This study contributes to the literature on public transportation and disability by providing a comprehensive analysis of the factors that most affect the general satisfaction of passengers with disabilities with public bus transportation. The first contribution of this study is the identification of these key factors, which will be helpful to policymakers and public transportation providers in designing and implementing more effective policies and strategies to improve the satisfaction level of passengers with disabilities. The second contribution is the development of a BN model to visualize the probabilistic reasoning between these factors, which will help policymakers and transportation providers understand the complex interplay between these factors and develop more effective interventions to improve the overall experience of passengers with disabilities. Finally, the third contribution is the production of scenarios that increase the satisfaction level of passengers dissatisfied with public bus transportation, which can provide a roadmap for policymakers and transportation providers to identify the effective factors that should be prioritized. Overall, this study provides valuable insights into the experiences and satisfaction levels of passengers with disabilities with public transportation and offers practical solutions to improve the quality of service and accessibility for this important segment of the population.
The paper is structured as follows. The Literature section presents a review of the challenges that people with disabilities encounter when using public transportation. In the Data section, the general characteristics of the data and variables used are outlined. The Method section provides the methodology used in this study. The Results section presents the findings and offers a detailed analysis of the results obtained. Finally, in the Conclusion section, concluding remarks are based on the findings and provide managerial recommendations to policymakers.
Literature
Research on the difficulties faced by people with disabilities in public transportation may produce diverse findings across regions because of variations in passenger perceptions influenced by the level of development and regional expectations. However, researchers examining the accessibility of public transportation systems and the barriers encountered by passengers with disabilities persist in their efforts to advance social equality. Their ultimate objective is to enhance the satisfaction of passengers with disabilities. Studies generally focus on infrastructure and the environment ( 13 , 15–20), social inclusion and socioeconomic characteristics ( 21 – 24 ), regulations and management ( 17 , 25 , 26 ), and types of disability ( 27 , 28 ).
Infrastructure-related studies generally reveal the inadequacies of systems. A suitable infrastructure for passengers with disabilities is one of the most important components of the system. To ensure access to services in a comfortable, easy, and safe manner, the infrastructure must be provided under appropriate conditions. Sze and Christensen ( 29 ) evaluated guidelines for designing accessible transport in Hong Kong, the US, and the UK, focusing on access to and within transport facilities. Their study emphasizes the importance of designing components, such as ramps, lifts, and accessible routes, to accommodate individuals with disabilities. Accessible design enhances the perceived safety and service quality for people with mobility impairments, and the walking environment affects satisfaction and perceived safety, particularly for older adults and those with mobility limitations. Bezyak et al. ( 30 ) aimed to identify barriers faced by people with disabilities when using public transportation and complementary paratransit services. They found that physical and attitudinal barriers hinder access to these transit systems.
Social inclusion is essential for achieving sustainable welfare in society and is of vital importance for people with disabilities. Ana Calle et al. ( 31 ) examined the accessibility of public transportation for people with disabilities in northern Chile based on interviews with drivers of public transportation. They identified three main categories: (1) social exclusion; (2) barriers to access; and (3) social status. The findings suggested that the drivers’ accounts revealed negative perceptions of accessibility and gaps in access for people with disabilities, highlighting the need for further research and interventions. Bascom and Christensen ( 24 ) explored how transportation access affects the social and community participation of people with disabilities in the US. Their study’s results showed that public transportation is more frequently used than private vehicles, and people with more severe disabilities are more likely to experience transportation-related exclusion. In addition, almost half of the respondents had to cancel appointments because of transportation issues. The majority of participants reported that limited transportation access had a negative effect on their social lives. Sajib ( 32 ) presented a qualitative investigation of the perceived barriers experienced by individuals with disabilities when using public transport in Dhaka. Based on the results, several barriers were identified, including negative attitudes among drivers, high travel costs, and discriminatory attitudes among other passengers. Recommendations for addressing these challenges include increasing mobility, transport accessibility, and social engagement, as well as changing cultural perceptions and prejudices. Sabella and Bezyak ( 33 ) examined the relationship between public transportation barriers and employment status among a sample of 3,218 people with disabilities in the US. Their study found that the majority (89.7%) of participants reported facing at least one barrier to using public transportation, with an average of 3.39 barriers per person. The results suggested a significant association between transportation and employment, and that public transportation barriers disproportionately affect individuals who are deaf or hard of hearing.
The criteria that managers should consider when making regulations should be presented, starting with priority groups. Disadvantaged groups should be prioritized over other groups, as regulations implemented for disadvantaged individuals will also meet the needs of non-disadvantaged groups. Rojas et al. ( 34 ) investigated the relationship between inclusive urban public transport management and the accessibility of persons with disabilities in Trujillo, Peru. A questionnaire was used to measure the variables, including five dimensions: inclusive urban public transport management and accessibility for people with disabilities. Their study found a significant and direct relationship between the management of inclusive urban public transport and accessibility for people with disabilities and identified several decisive factors. However, the management of public transport and the accessibility of people with disabilities were predominantly deficient or poor.
Visual, auditory, physical, and other types of disabilities require individuals to have different needs. Therefore, the regulations should be addressed based on the type and level of disability. Alldredge ( 27 ) investigated the accessibility of Utah Transit Authority’s (UTA) public transportation system for individuals with disabilities residing within the UTA service area, as well as the barriers they encounter. The participants included people with disabilities, their family members, or those who work with people with disabilities. Their study’s results indicated that individuals with disabilities had generally neutral to somewhat positive perceptions of UTA transportation services, although variations were observed depending on disability type, frequency of ridership, and modes of services used. Low et al. ( 28 ) explored the travel experience of visually impaired people (VIP) using public transportation in London. Their study identified limited access to information, infrastructure inconsistencies, and inadequate staff assistance as major concerns. However, concessionary travel encouraged VIP to make more trips, which in turn had a positive effect on their well-being. Their study’s results suggest that more targeted policies should be implemented to address the specific needs of passengers with particular disabilities. Ultimately, their study concludes that VIP’s journey experience is closely tied to their level of independence and inclusion in society. Ajayi et al. ( 21 ) aimed to explore the challenges faced by physically challenged individuals in accessing Intermediate Public Transport and how these difficulties vary with the nature of disability in Oyo State. Their study found four significant barriers to accessibility: (1) inadequate assistance; (2) waiting time; (3) discrimination; and (3) operators’ impatience. Furthermore, their study revealed that the difficulties faced by individuals with physical disabilities differed greatly based on the type of disability.
In summary, the existing body of research has made significant contributions to understanding the challenges faced by passengers with disabilities in public transportation; however, certain gaps persist. Studies focusing on accessibility often highlight infrastructural, social, and operational barriers. However, they seldom employ advanced modeling techniques such as BN to analyze satisfaction levels. Furthermore, there is limited literature on region-specific studies, particularly in megacities like Istanbul, which integrate diverse factors influencing passengers with disabilities' experiences. This study aims to address these gaps by employing a BN approach to comprehensively evaluate the satisfaction of passengers with disabilities in İstanbul and provide recommendations for improving their travel experience.
Data
The survey was conducted in Istanbul between August and October 2022 with 43 VIPs, 42 hearing impaired, 78 physically disabled, and 139 individuals with chronic disabilities. Individuals with mental disabilities and those under the age of 18 were not included in this study. While conducting the survey, the participants were approached through the associations for disabled individuals in the city and in the field. A total of 369 people were approached for the survey, and a sample of 302 valid responses was obtained. Because of the special nature of the target group and the requirement to use bus services to participate in the survey, the research was successfully completed with 302 people. While determining the sample distribution based on the type of disability, an effort was made to adhere to the distribution stated in the Survey on Problems and Expectations of Disabled People 2010 report ( 35 ). For participants in face-to-face interviews, it was clearly emphasized at the beginning of the document that participation was voluntary, and they could withdraw at any time. Human participants were recruited for this study, and the research questionnaire was reviewed and approved by the Ethics Committee of Yıldız Technical University-Social Sciences and Humanities Research Ethics Committee (Ref no. 2021/07), following the principles outlined in the Declaration of Helsinki.
The questionnaire was composed of two sections. Following the questions related to respondents’ characteristics, survey items related to services provided by the IETT were evaluated. The items used for the survey were derived from studies in the literature ( 13 , 15–28, 36–38). In addition, specific aspects of the system examined (e.g., the IBB’s Beyaz Masa application) were taken into consideration, and the questions were finalized after preliminary studies were conducted with experts who carried out the survey. Survey items are on a five-point Likert scale, and scores between one and five are evaluated as “I am not satisfied at all” (I), “I am not satisfied” (II), “I am neither satisfied nor dissatisfied” (III), “I am satisfied” (IV), and “I am completely satisfied” (V), respectively.
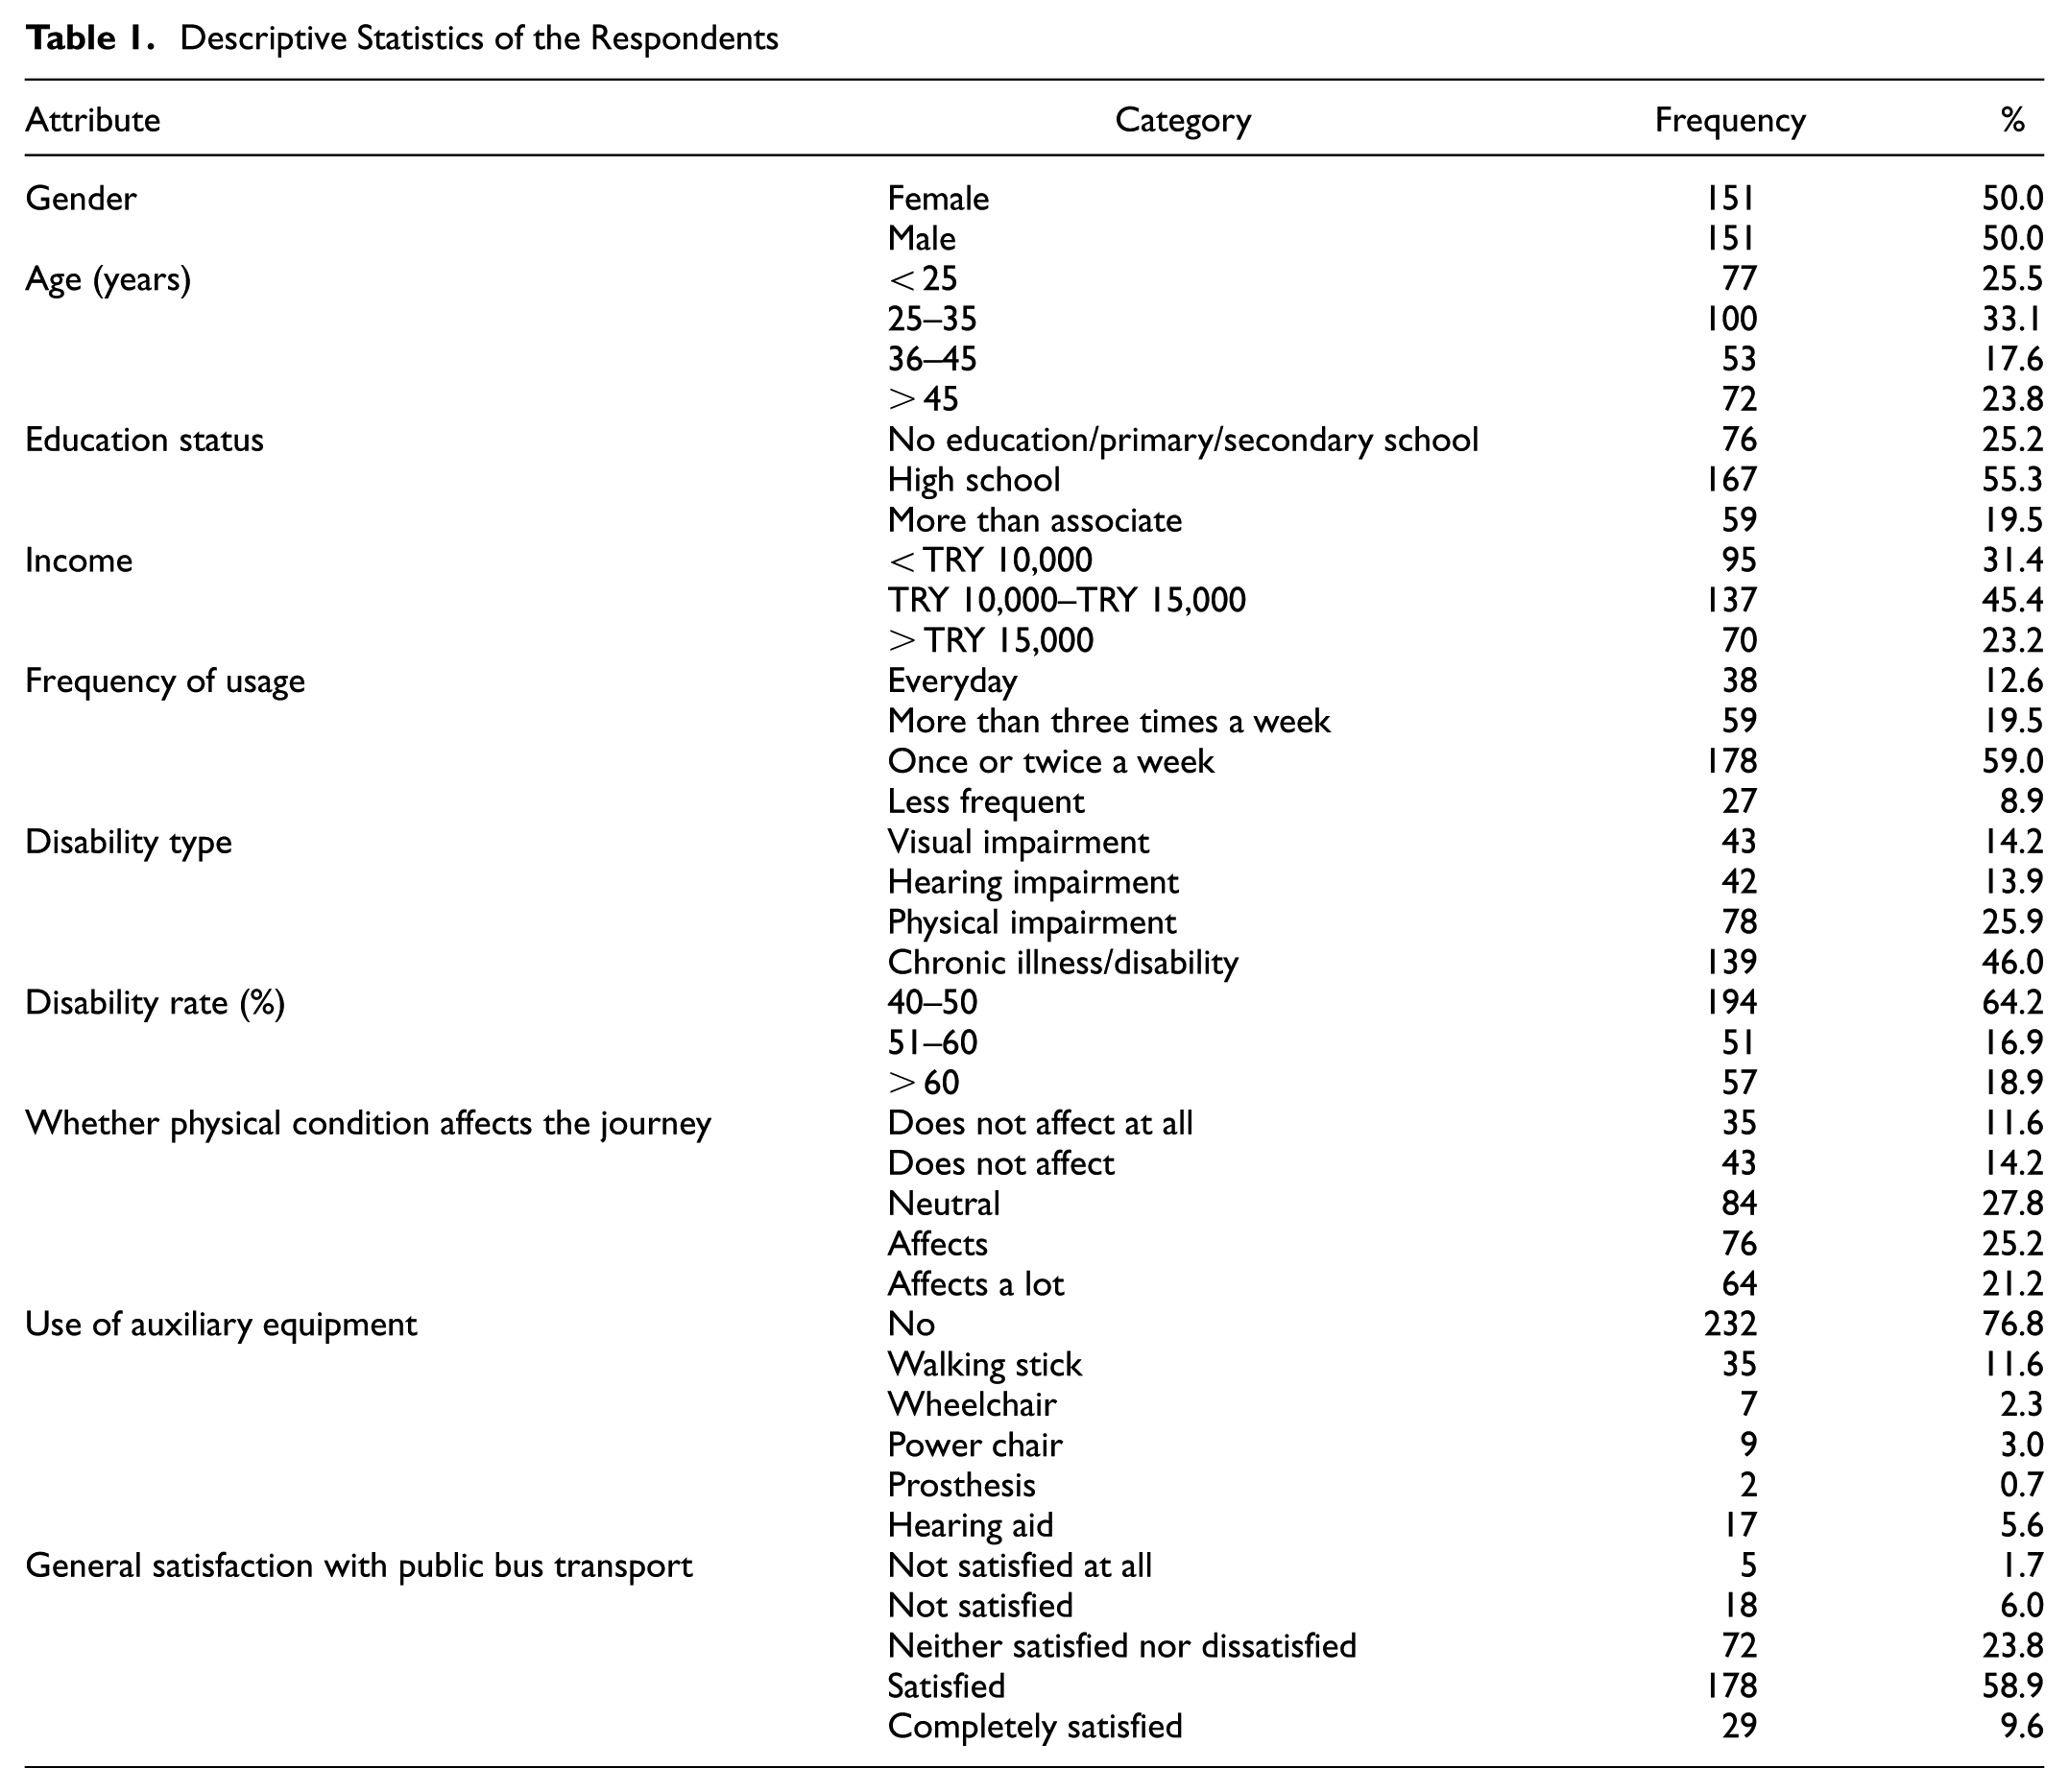
The descriptive statistics of the respondents are summarized in Table 1. The sample is balanced for gender and diverse in age distribution. Most participants hold a high school degree and report a moderate income level. For disability status, physical and chronic disabilities are more common, and the majority have a disability degree between 40% and 50%. Most respondents use public transportation once or twice a week; only a small share rely on it daily. Overall, nearly 70% of the participants reported being completely or partially satisfied with public bus transport.
Descriptive Statistics of the Respondents
Method
In this section, a brief introduction to BNs is provided, including their key concepts and applications. First, the process of creating a BN is described. Second, sensitivity analysis is discussed, which involves identifying the most influential variables in the network. Then, how to validate the final model is explained, which involves testing the network’s performance on new data and comparing its predictions with observed outcomes. Finally, What-If scenarios are discussed, which use the dynamic predictive power of BNs to produce beneficial implications. The workflow diagram of the approach used in this study is shown in Figure 1.
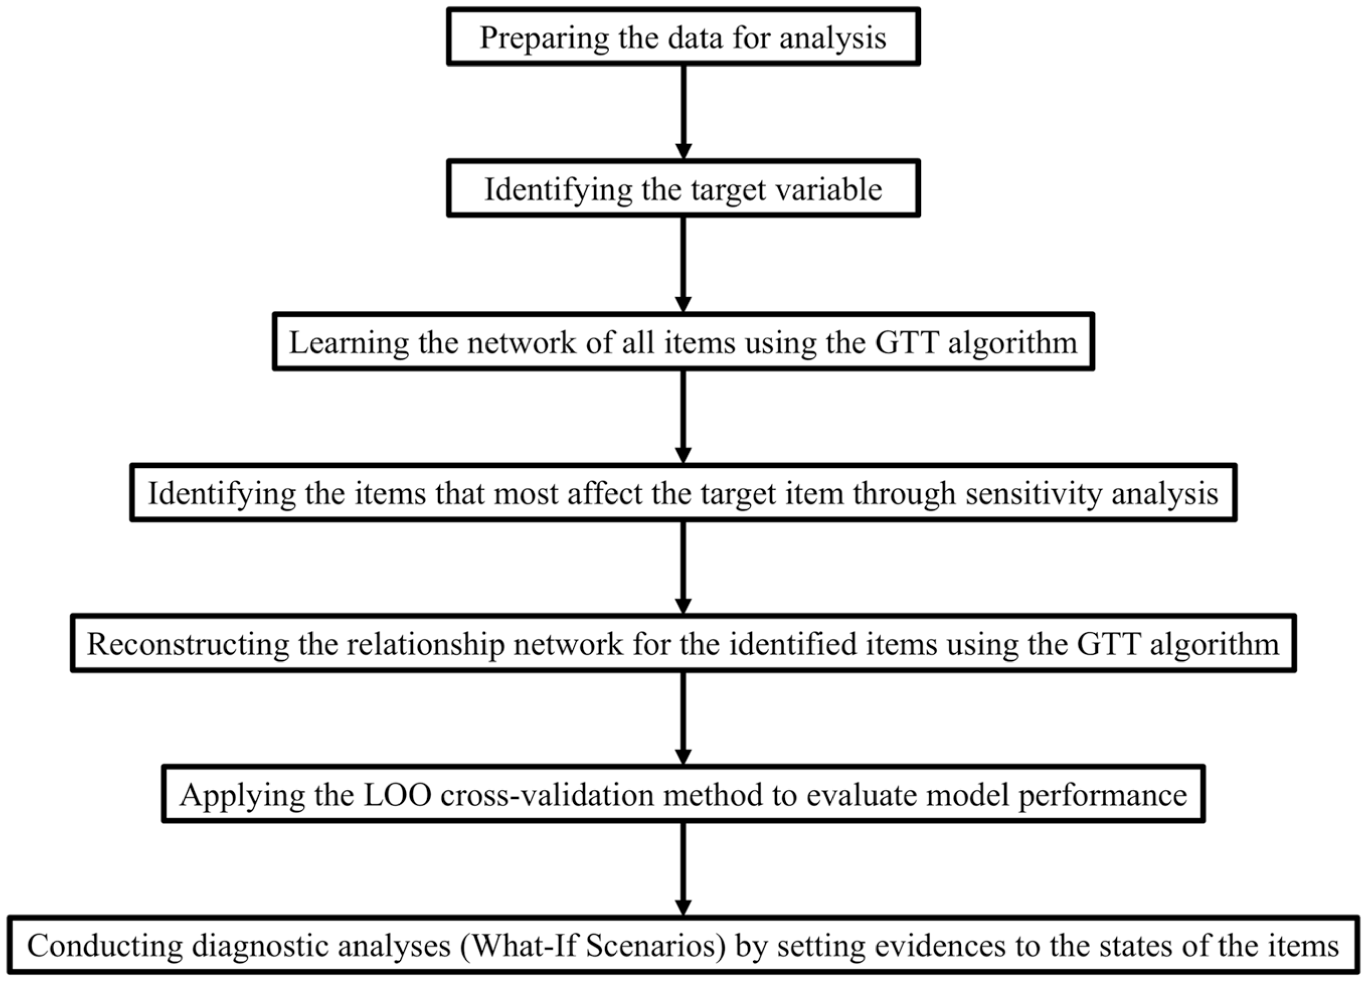
Workflow of the approach conducted in this study.
Bayesian Networks
BNs, which are also known as belief networks, Bayes networks, Bayesian belief networks, or decision networks in the literature, are probabilistic graphical models that enable the representation of uncertain knowledge. They provide a powerful visualization of the joint probability distribution for a set of variables ( 39 ), which can be used for reasoning, prediction, diagnosis, and decision-making.
The idea of BNs was initially introduced by Pearl ( 40 ), where a graphical representation of the conditional probabilities of variables in a network was presented. The BN can effectively operate even when dealing with small sample sizes ( 41 ). In addition, it can handle missing data, incorporate expert knowledge, and allow for flexible modeling of complex relationships between variables. It can also perform probabilistic inference, which enables the estimation of the probability distribution of variables given evidence. A BN consists of a set of nodes, each representing an item or a variable, and a set of directed edges, representing the conditional dependencies among the variables. The edges indicate the presence of causal relationships between linked variables ( 42 ). The BN is divided into two components: (1) the qualitative; and (2) the quantitative descriptions of the network structure. The qualitative structure is a directed acyclic graph (DAG) consisting of a set of nodes and directed edges. The DAG is a loopless graph, which means that the causal relationships never go back to where the arrows start. The quantitative component of the BN is the conditional probability table, which specifies the conditional probability for each variable given its parents in the DAG ( 43 ). One of the most important features of the BN is its ability to reduce the joint probability distribution of the model, which is often complex and challenging to evaluate, into a set of conditional probabilities by utilizing the chain rule described as
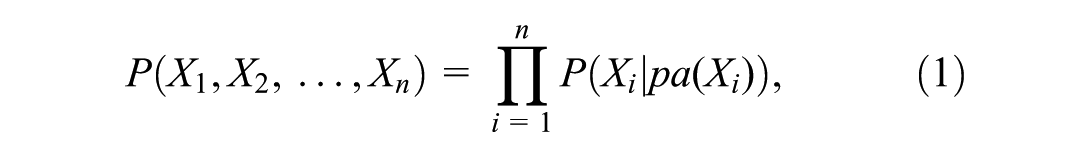
where X i (i = 1, 2, …, n) represents the variable and pa(X i ) represents the parents of node X i ( 40 ).
Graphical Network Interface (GeNIe) is a software tool used for building the BN ( 44 , 45 ). It offers a visual modeling environment that allows users to construct graphical models of complex systems and perform probabilistic inference on these models. The software includes various tools for creating, editing, and analyzing graphical models. It also allows users to perform sensitivity and decision analyses on their models, which can help to identify the most critical factors and to evaluate potential decisions. GeNIe has been used in a variety of fields, including finance, engineering, medicine, and risk analysis. It is particularly useful in situations where there are multiple sources of uncertainty and complexity and where decision-making involves evaluating different options and their potential outcomes.
Learning the Network with a BN
GeNIe offers various algorithms that serve different purposes for learning the structure of the BN. Bayesian Search (BS) and Greedy Thick Thinning (GTT) algorithms are the best heuristic methods used in GeNIe ( 46 ). The BS algorithm uses a hill-climbing process with random restarts, and the GTT algorithm uses a greedy approach to iteratively remove edges from the network, aiming to maintain the structure and dependencies between variables. This process continues until no more edges can be removed without significantly degrading the fit of the network. The resulting network is then considered to be the optimal structure for the given data set. The BS algorithm is stochastic, meaning its initial position affects the results. In contrast, the GTT algorithm is deterministic, producing the same result every time it is run. In addition, as the number of nodes increases, the time it takes for the BS algorithm to deliver results becomes longer because it searches through a hyper-exponential search space. However, the GTT algorithm is relatively fast and can handle large data sets. It is important to note that the GTT is a heuristic algorithm, and it may not always find the optimal network structure. Therefore, it is recommended to perform multiple runs of the GTT and compare the results to ensure the stability and robustness of the learned network structure. Because the study involves the simultaneous inclusion of over 40 items, the GTT algorithm, which produces output quickly and deterministically, was preferred over the BS algorithm, which takes a very long time and is stochastic ( 45 , 47 ).
Sensitivity Analysis
Sensitivity analysis in BNs is used to understand how changes in the input variables affect the output or target variable of a BN model. It allows users to examine the effects of changes in one or more variables on the network’s overall output. It also helps to identify the most influential variables in a network and to determine how changes in these variables affect the overall results ( 48 , 49 ).
The purpose of sensitivity analysis in BNs is to evaluate the robustness and reliability of the network under different scenarios. By performing sensitivity analysis, users can gain a deeper comprehension of the factors that have the greatest effect on the network’s output and can make informed decisions based on this information ( 50 ). It is important to limit the number of variables to obtain meaningful graphics and scenarios with BNs. To achieve this, sensitivity analysis can be used to identify the variables that have the greatest effect on the target item ( 51 ). By focusing on these influential variables, it is possible to work with a smaller subset and generate more understandable results. For detailed information on sensitivity analysis, including its mathematical formulas, refer to the literature ( 52 – 54 ). In this study, sensitivity analysis was employed to identify the most influential variables related to the target item. These variables were then selected for further analysis and modeling with the goal of obtaining a better understanding of the target item. A graphical representation of the sensitivity analysis results can be displayed with a sensitivity tornado. It is a type of tornado chart that displays the sensitivity of the model’s output to changes in the input variables. It is called a tornado chart because the bars resemble the shape of a tornado, with the widest part at the top and the narrowest part at the bottom. Sensitivity tornado charts are useful for identifying the most important input variables in a BN model and understanding how changes in these variables affect the model’s output. They can also help researchers and decision-makers prioritize which variables to measure or manipulate when optimizing the model’s performance or evaluating its robustness.
Cross-Validation
Cross-validation is a technique commonly used to assess a model’s performance. The fundamental concept of cross-validation is to split the data into training and test sets to evaluate the model’s generalizability ( 55 ). Because BNs are commonly used for prediction purposes, it is essential to evaluate the model’s performance on independent data sets to ensure that it can generalize well. By using cross-validation, one can simulate how the model would perform on new data that were not used during the training phase, thus providing a reliable estimate of its predictive performance.
Two common cross-validation techniques used in BNs are k-fold cross-validation and leave-one-out (LOO). In k-fold cross-validation, the data are divided into k equally sized subsets, and the model is trained on k – 1 subsets while testing its performance on the remaining subset, repeated k times to compute average performance ( 56 ). LOO is an extreme version of k-fold, where k equals the number of observations, and the model is trained on n – 1 observations, testing on the remaining ( 45 , 57 ). Both methods assess generalization performance, with k-fold being computationally efficient and reliable, and LOO is used for small data sets or complex models for more accurate estimates at the cost of increased computational complexity. For comprehensive references about these cross-validation techniques and their mathematical formulas, see James et al. ( 58 ) and Koller and Friedman ( 59 ).
What-If Scenarios
The feature that gives BN its dynamic structure is the What-If analysis. What-If analysis involves diagnostic analyses based on changes in percentages within the network when evidence is set to a specific state of an item (or items). For instance, consider survey results obtained using a five-point Likert scale, from most negative to most positive, on passenger comfort. To answer the question, “What if passenger comfort were maximized, how would other factors change?” the network is updated by setting evidence to the highest level of comfort (i.e., selecting only passengers with the highest comfort level and ignoring others). Therefore, by setting evidence on the desired state of the desired item (or items), various scenarios can be generated and analyzed in-depth. In this study, different What-If scenarios were created by setting evidence on the states of the factors that influence the target item. In general, evidence was set on the lowest and highest states of the factors because this approach better reflects the changes within the network. In addition, to avoid excessive graphical complexity, only the networks related to the most notable scenarios were presented visually. Therefore, 21 scenarios were evaluated in this study, composed of five numerical scenarios presented in each of three tables (Tables 4–6) and two visual scenarios illustrated in each of three figures (Figures 5–7).
Results
Building the Most Appropriate Model
The demographic characteristics and survey questions included in the BN analysis are presented in Table 2. A target item must be determined before the final model is obtained. In this study, satisfaction, number 40 in Table 2, was determined as the target item, focusing on the general satisfaction among passengers with disabilities with Istanbul’s public bus transportation. As given in Table 1, it was originally a five-point Likert-type scale. Because the primary focus of this study is dichotomous—whether or not passengers are satisfied with the public transportation system—the target variable was converted into a binary structure. This process was performed to simplify interpretation and to minimize the effect of imbalanced data when testing the validity of the model ( 60 , 61 ). Researchers often apply collapsing strategies to make categories more balanced and to simplify interpretation. Therefore, many authors have reported that they combined categories according to the structure of their data set and research objectives, which supports the appropriateness of the approach in this study ( 62 – 66 ). Therefore, the first three categories were merged, which are “not satisfied at all”, “not satisfied”, and “neither satisfied nor dissatisfied”, as “dissatisfied/neutral (D/N)”, maintaining the semantic ordering. Similarly, passengers who stated that they were “satisfied” and “completely satisfied” were merged into the “satisfied (S)” category. This categorization provides a clear distinction between the D/N and S groups, making the results more interpretable for both statistical analysis and policy implications. The items between 1 and 39 in Table 2 are considered as the predictors of satisfaction. The primary goal is to identify the items that are not as influential as the others on satisfaction to exclude them from further analysis. Because the primary goal is to seek ways to increase the overall satisfaction level of passengers, the items that most affect satisfaction must be worked with. Otherwise, working with all the variables will create complexity, and this study will go beyond its purpose. Therefore, a network including all items was created using the GTT algorithm in GeNIe (Figure 2) first. As seen in Figure 2, because gender is outside the network, it has no contribution to the network structure or to satisfaction. Therefore, gender could not be associated with any item. In addition, no significant effect was found of gender on any item. All other items were included in the network using the GTT algorithm. After the network was created, considering satisfaction as the target, the sensitivity analysis algorithm proposed by Kjærulff and van Der Gaag ( 67 ) was performed to identify the items in the current network that have the most effect on the target item. When focusing on a specific target item, the algorithm effectively computes a complete set of derivatives for each numerical parameter of the BN for the posterior probability distributions related to that target item. The magnitudes of the derivatives correspond to the importance of the precision of the network’s parameters in determining the target’s posterior probabilities. A large derivative for a parameter suggests that even a minor change in the parameter could result in a substantial change in the target’s posterior probabilities. In contrast, a small derivative indicates that even significant changes in the parameter will have minimal effect on the posterior probabilities. The graph obtained from the sensitivity analysis is shown in Figure 2, where items colored in shades of gray contain parameters important for calculating the posterior probability distributions in satisfaction. White-colored items do not contain any parameters used in calculating the posterior probability distributions over the target items ( 45 ). The more intense the color of a node is, the more it is related to the target item. As can be seen from the graph, the distinct shades of gray start with feeling safe at stops (safe_crime). The items In-vehicle safety (e.g., crime) (in_veh_safe_crime), In-vehicle safety (e.g., falling) (in_veh_safe_fall), Opportunities to use areas reserved for people with disabilities (opp_to_use_areas), Space adequacy for disabled vehicles (space_adequacy), Comfort/cleanliness of seats/areas reserved for people with disabilities in buses (comfort_seat), Adequacy of seats/areas reserved for people with disabilities in buses (seat_adequacy), and Bus frequency (bus_freq) were also determined as the items most related to satisfaction. Therefore, in the rest of this study, these variables will be studied, and interpretations will be based on them.
Items Included in the Bayesian Network Analysis, with Their Abbreviations.
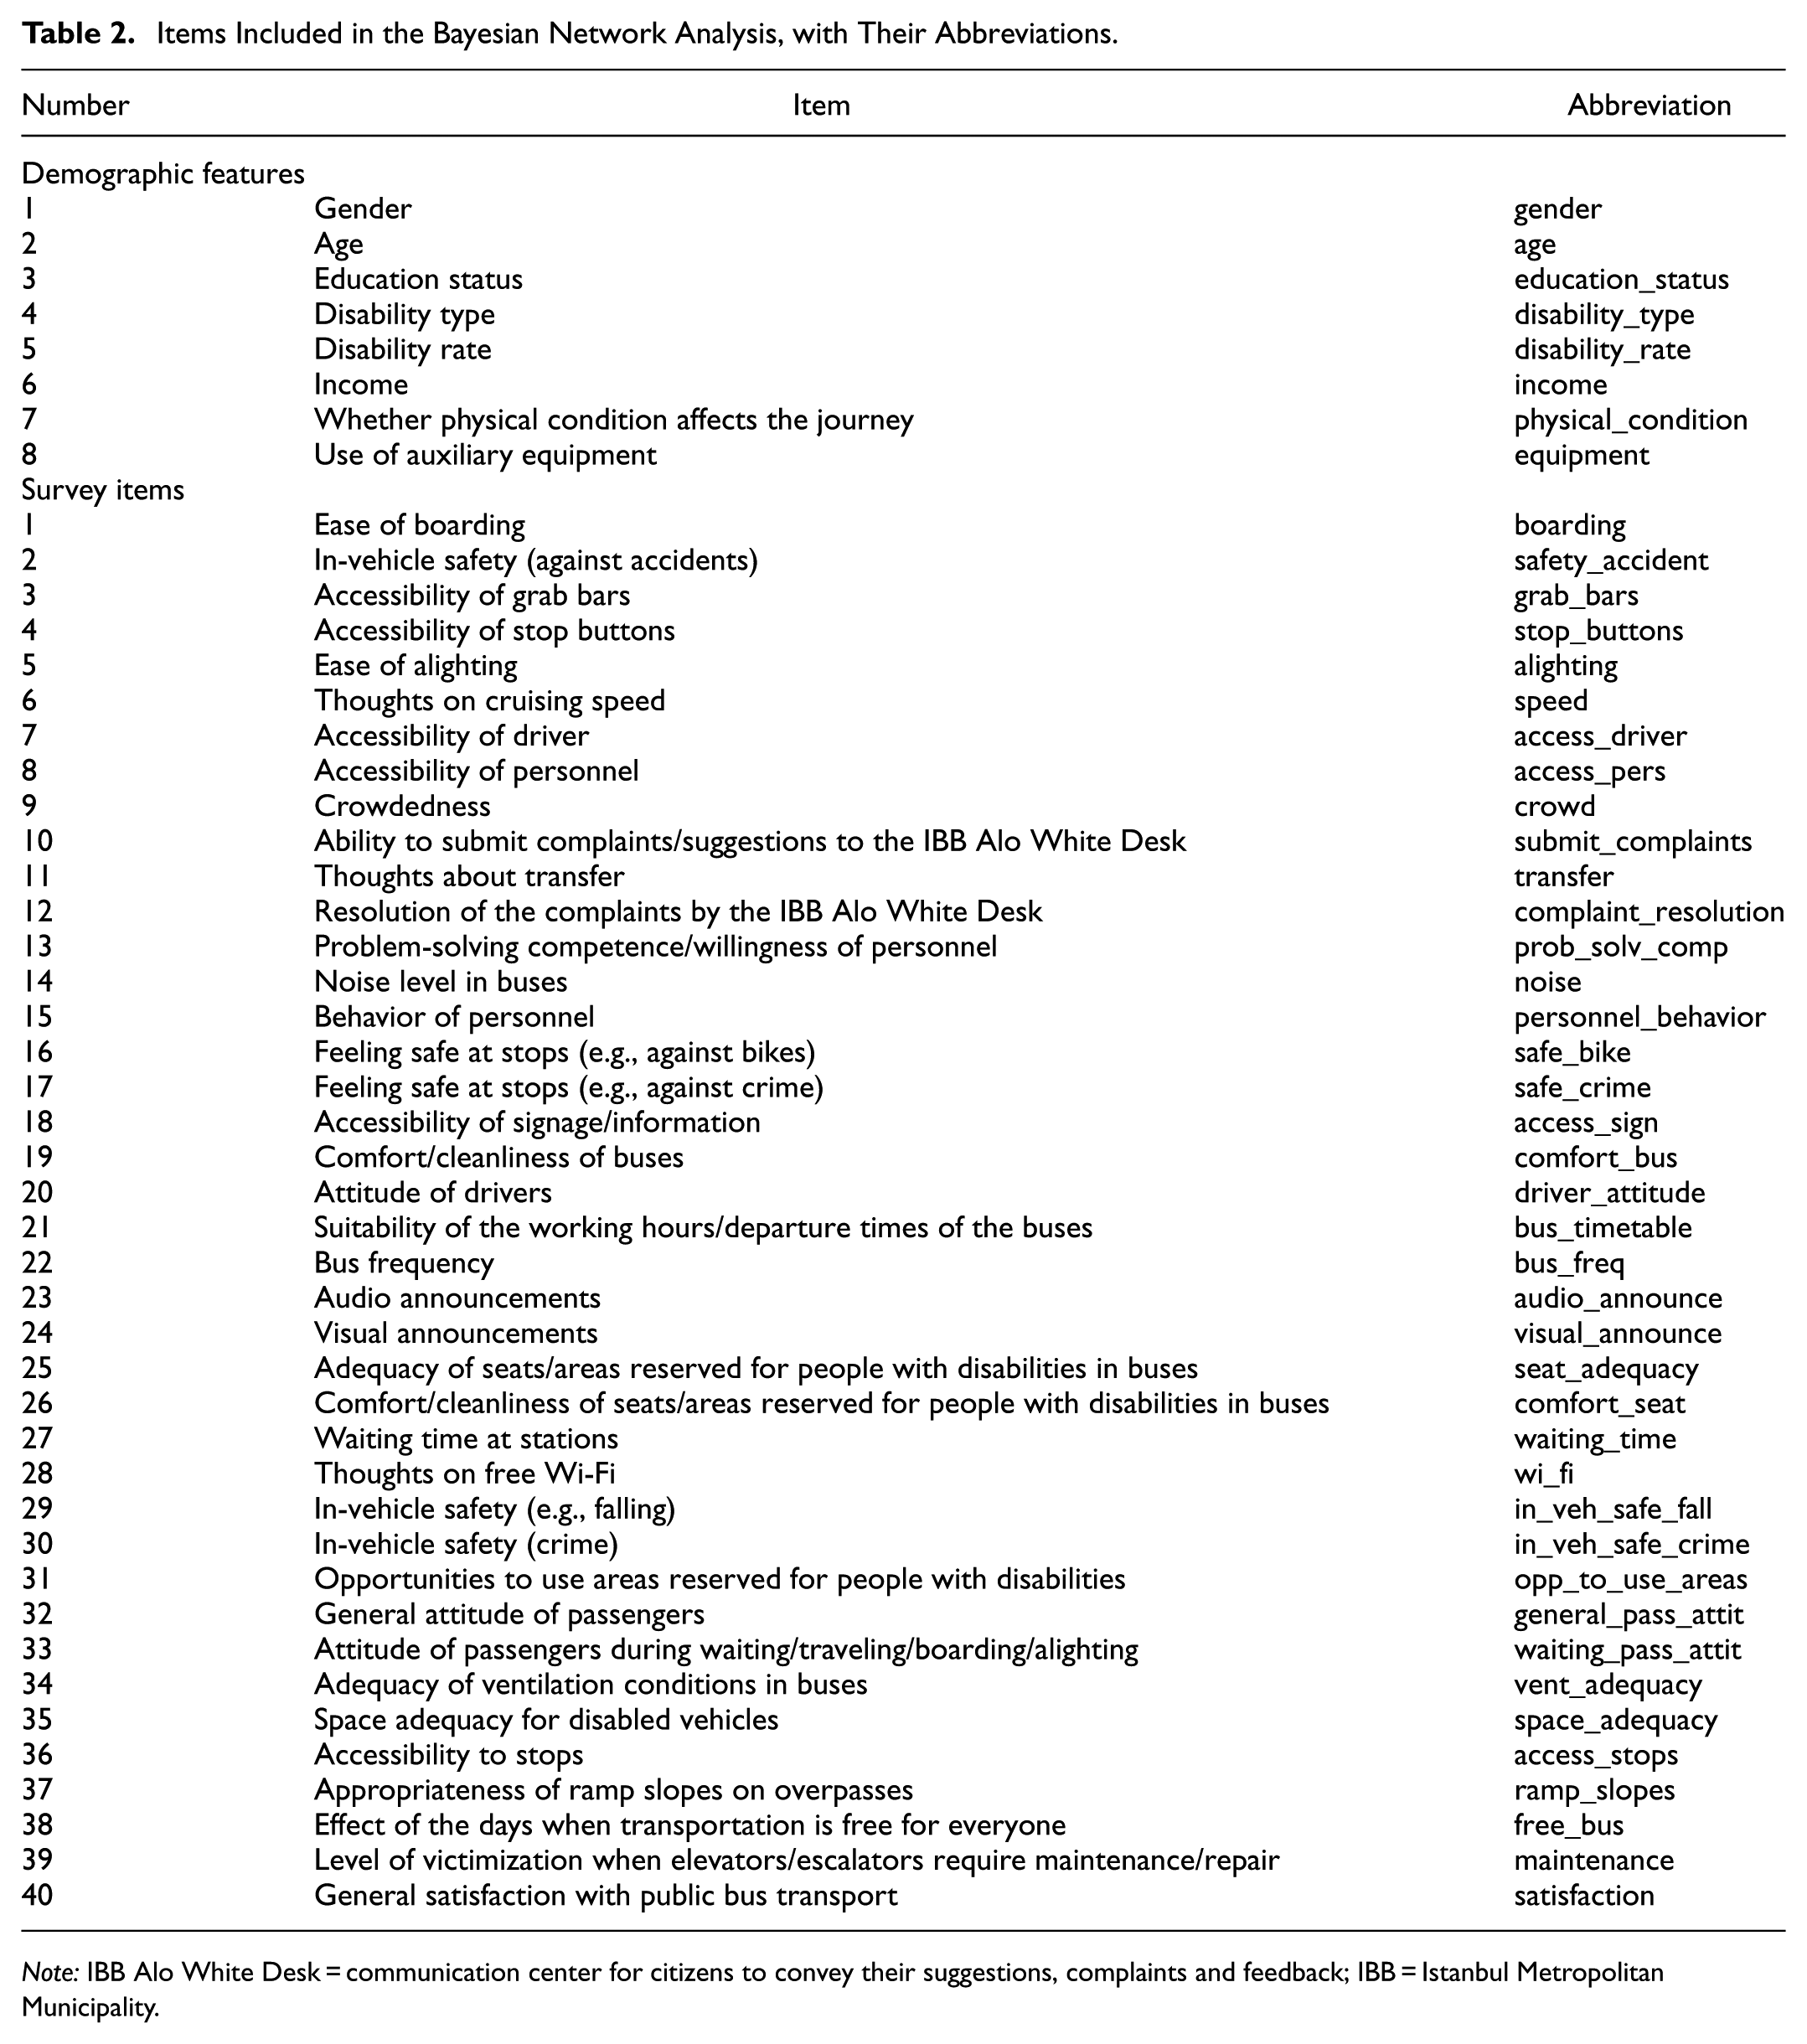
Note: IBB Alo White Desk = communication center for citizens to convey their suggestions, complaints and feedback; IBB = Istanbul Metropolitan Municipality.
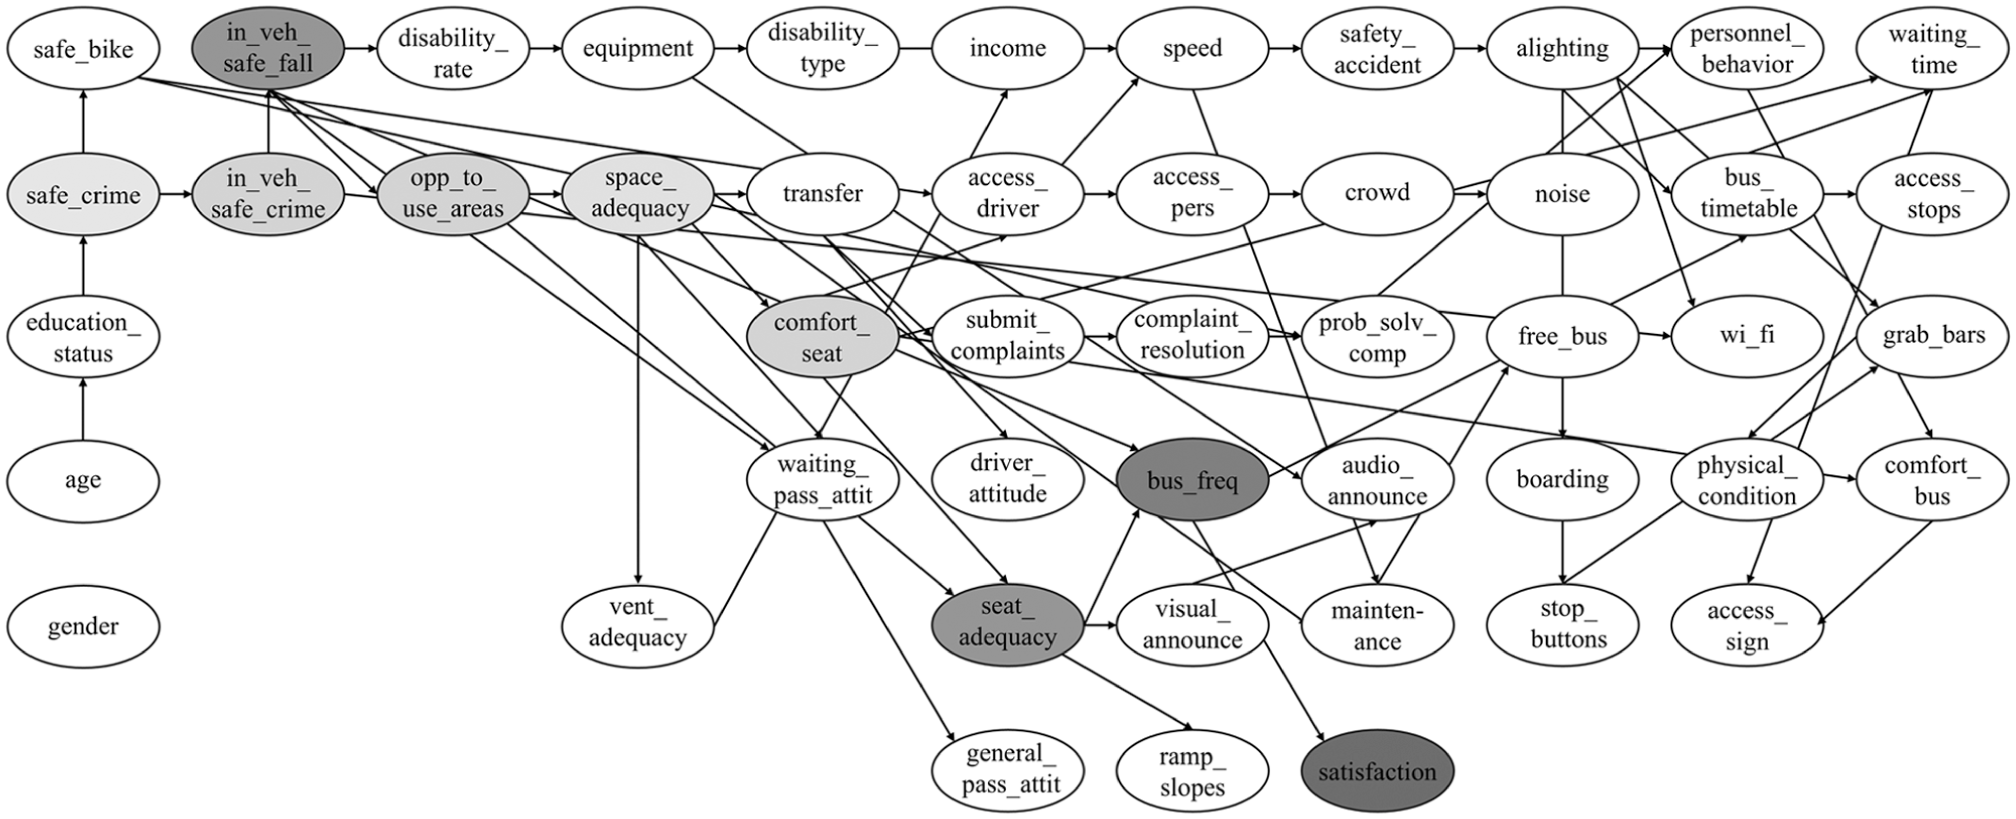
Bayesian network created with the Greedy Thick Thinning algorithm with the sensitivity analysis visualization.
The new BN model, which includes nine items with the target item, was reconstructed using the GTT algorithm and is shown in Figure 3, which was obtained by removing the items that were not influential in the network shown in Figure 2. In addition, percentage values for the categories of the items are shown in Figure 3 and the following figures (Figures 5–7). As seen from the final network in Figure 3, probabilistic reasoning was found:
From safe_crime to in_veh_safe_crime;
From in_veh_safe_crime to in_veh_safe_fall;
From in_veh_safe_fall to opp_to_use_areas;
From opp_to_use_areas to space_adequacy and seat_adequacy;
From space_adequacy to comfort_seat;
From comfort_seat to seat_adequacy;
From seat_adequacy to bus_freq;
From bus_freq to satisfaction.
In this network, it is possible to display the level of satisfaction of disabled passengers for a particular item at a descriptive level. For example, 69% of the passengers with disabilities who participated in the survey were satisfied (State S) with public bus transportation, and 31% were State D/N. In this study, the most likely scenarios will be evaluated to attract passengers from State D/N to State S of satisfaction. The I, II, III, IV, and V values in all items except for satisfaction represent Likert-type responses from the expression “not satisfied at all” to the expression “completely satisfied.”
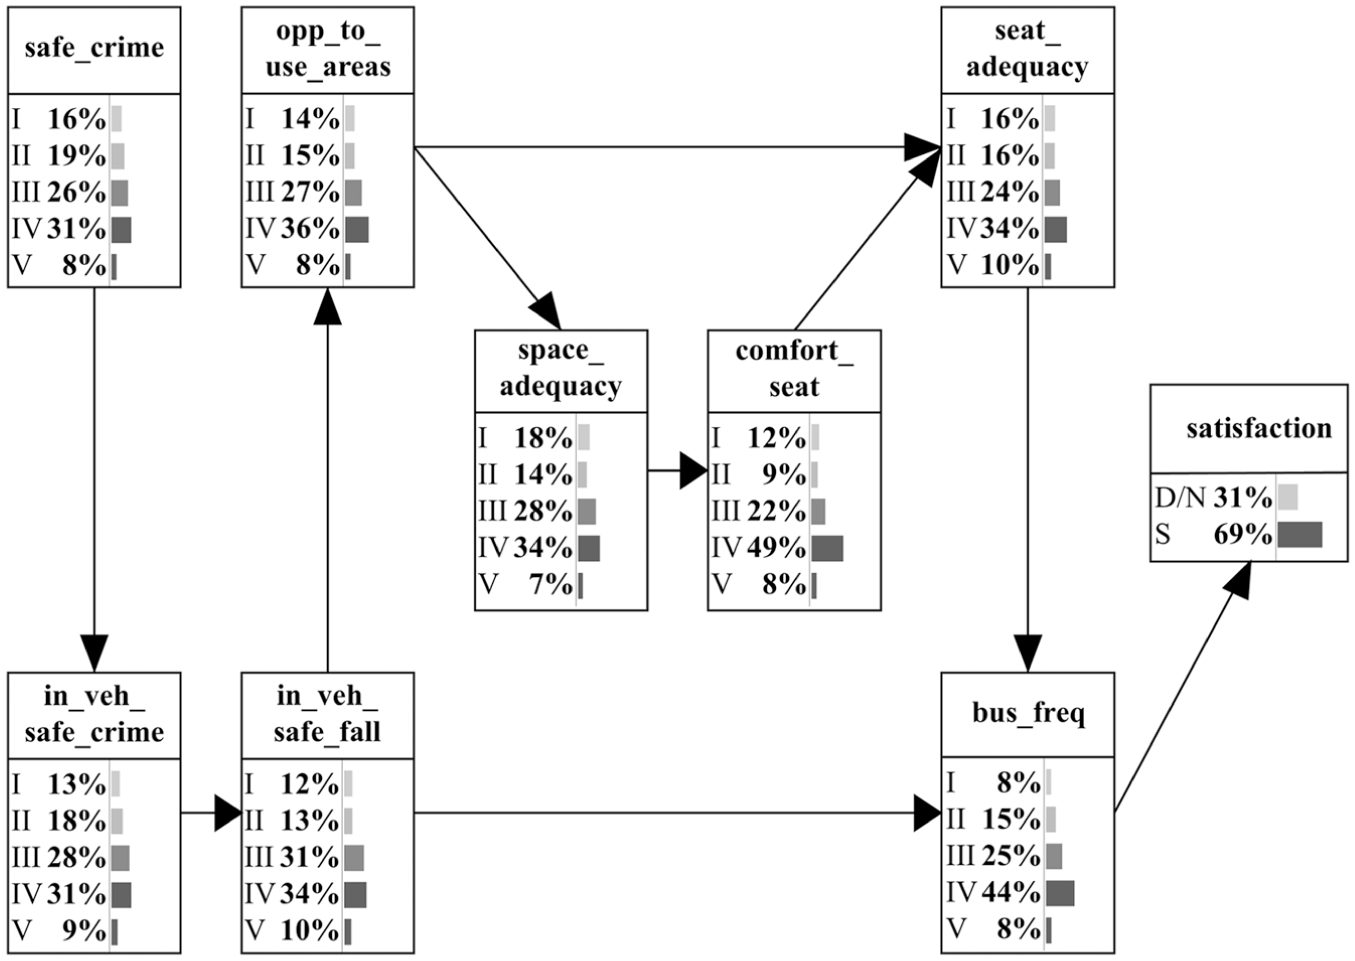
Final Bayesian network.
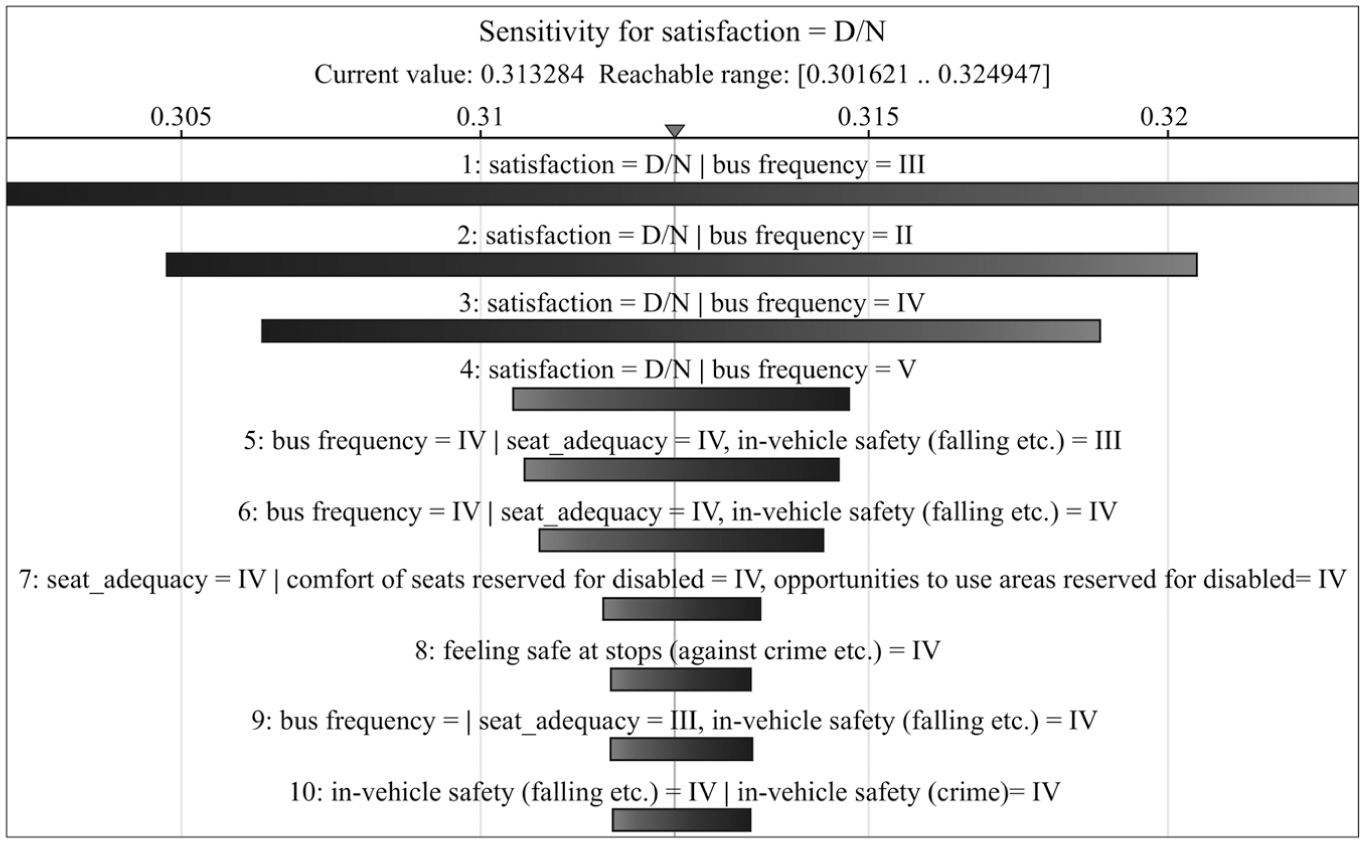
It is understood from the BN structure which items or predictor variables are most influential on the target item or satisfaction level. In addition, by viewing the sensitivity tornado diagram, deeper and more persuasive insights into this result can be obtained. Based on this influence diagram, when evidence is set on the states, it can be easily seen which items have an effect on the state of the target item. The sensitivity tornado diagram shown in Figure 4 was obtained by viewing satisfaction = D/N (parameter spread = 0.1) within the final BN model shown in Figure 3. Because the target item includes two complementary states (D/N and S), and the total value range sums to one, the rankings of item–state pairs remain the same. Therefore, a single tornado diagram sufficiently represents the relationships for both states. The horizontal lines in the diagram are divided into two parts, as if cut in half. The arrow in the upper center of the diagram is in the region representing the percentile value of the target item for the state of interest. The percentage value for State D/N of the target item is shown as 31% in Figure 3. The current value part in the diagram shown in Figure 4 has exactly this value. The reachable range information in the diagram shows how much the selected state of the target item can theoretically be increased or decreased when the parameter spread is 0.1 ( 68 ). Because the aim at this stage is to display the influential items, the default option of 0.1 for parameter spread is selected. The results indicate that a 0.1 change in the bus_freq = III led to the largest effect on satisfaction = D/N, which is represented as the reachable range on the graph because of its wider range of values. In contrast, changes in the safe_crime = IV parameter in the eighth row of the diagram resulted in smaller horizontal bars and had a less significant effect on the target item. The first four scenarios in the diagram relate to bus_freq, which was the most sensitive to satisfaction in the final graph (Figure 3), where it was positioned just before satisfaction. This confirms the importance of bus_freq in determining satisfaction levels. Similar observations can be made for other parameters.
Sensitivity tornado.
In BN learning, it is common practice to apply established validation approaches to examine whether the model can be considered valid ( 69 – 72 ). Therefore, because the number of observations in this study was small ( 73 ), LOO cross-validation was applied. The LOO method was applied after the selection of the target item satisfaction. The confusion matrix and performance matrices for the LOO method are presented in Table 3, and the accuracy of this complex analysis was 71%, with a misclassification rate of 29%. Out of the 46 observations included in State D/N, 27 were correctly predicted, resulting in a precision metric value of 0.59. The sensitivity value, which shows the percentage of observations normally included in State D/N and predicted in State D/N, was 0.28. In addition, the specificity value, which shows the percentage of observations normally included in State S and estimated in State S, was 0.91. Matthew’s correlation coefficient, which measures the quality of binary classifications, was 0.25. For this coefficient, a value of one is interpreted as a perfect prediction, a value of −1 as a completely wrong prediction, and a value of zero as a random prediction. A value of 0.25 indicates that the predictions were not random ( 74 , 75 ). Other performance metrics indicate no issues with overfitting or underfitting. Based on the cross-validation results, the model obtained using the BN created with the GTT algorithm is valid. Because the obtained BN model is valid, proper in-depth inferences can be made by performing What-If analyses.
Confusion Matrix for the Model and Performance Metrics
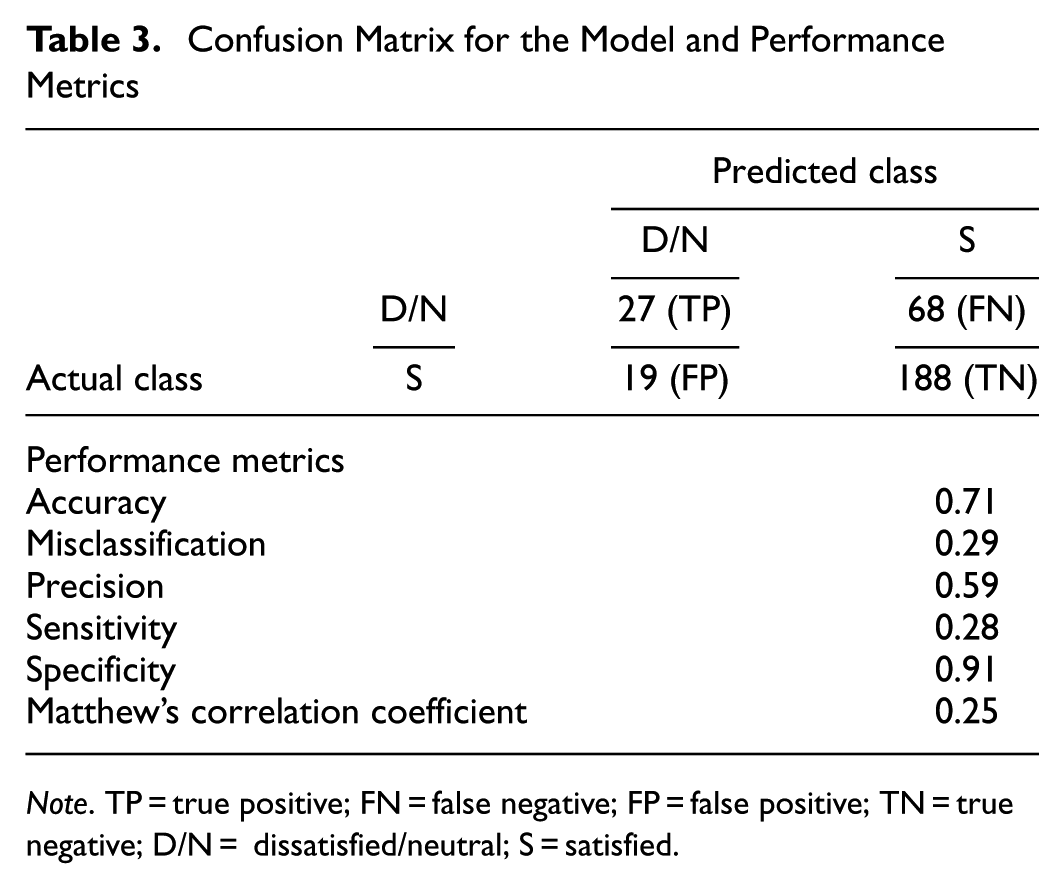
Note. TP = true positive; FN = false negative; FP = false positive; TN = true negative; D/N = dissatisfied/neutral; S = satisfied.
Diagnostic Analysis: What-If Scenarios
To explore how changes in one item may affect the states of other items, various scenarios can be generated by setting evidence on the states of the determined items. For instance, to evaluate the overall satisfaction of passengers who are completely dissatisfied with bus frequency, evidence must be set on the “I am not satisfied at all” state of the bus frequency item (bus_freq = I). This will enable the potential effect of changes in bus frequency on satisfaction to be determined. Using this approach, it is possible to gain insights into the complex interactions between different items and make informed decisions to improve overall passenger satisfaction and experience. Because they are closest to the target item, the What-If scenarios of seat adequacy and bus frequency are examined in detail in Tables 4–6. In addition, the What-If scenarios offering the most noticeable results among the remaining items in the network are shown in Figures 5–7. Table 4 displays the percentage change in states of satisfaction as evidence is set on each state of bus frequency one by one. The findings reveal that 38% of passengers who were completely dissatisfied with bus frequency (bus_freq = I) were also D/N with public bus transportation. In contrast, 91% of those who were completely satisfied with bus frequency (bus_freq = V) were satisfied with public bus transportation. Setting evidence on the “I am not satisfied” response of the bus frequency item (bus_freq = II) yields an interesting result: the proportion of passengers D/N with public bus transportation increases from 38% to 59%. Then, as the level of satisfaction with bus frequency increases, the proportion of D/N passengers decreases. The percentage of D/N passengers, which was 31%, as shown in the final BN model in Figure 3, may drop to 9% in this scenario. Tables 5 and 6 present the effects of setting evidence one by one on the states of “adequacy of seats/areas reserved for disabled people in buses” (seat_adequacy) on bus frequency and satisfaction, respectively. The results show that when referring to States IV and V of bus frequency together as “contented with bus frequency” and States I and II as “discontented with bus frequency”, 50% of the passengers who were completely dissatisfied with seat adequacy (25% for bus_freq = I | seat_adequacy = I + 25% for bus_freq = II | seat_adequacy = I) were not contented with bus frequency (Table 5). Here, the vertical bar “|” denotes a conditional probability, indicating the state of bus_freq given a specific state of seat_adequacy. In contrast, 70% of the passengers (39% for bus_freq = IV | seat_adequacy = V + 31% for bus_freq = V | seat_adequacy = V) who were completely satisfied with seat adequacy were contented with bus frequency. In addition, 44% of the passengers who were completely dissatisfied with seat adequacy were D/N with public bus transportation (satisfaction = D/N | seat_adequacy = I) (Table 6). Table 6 demonstrates that the level of dissatisfaction with public bus transportation decreases as the satisfaction level with seat_adequacy increases. Specifically, 23% of the passengers who reported being completely satisfied with seat_adequacy were still D/N with public bus transportation. Therefore, although the item that satisfaction is most sensitive to is bus_freq, it can be seen how much seat_adequacy can affect satisfaction. The percentage of passengers D/N with public bus transportation, which was 44% for the lowest state of seat_adequacy, drops to 23% for the highest state of seat_adequacy.
Changes in Satisfaction States when Evidence is Set on Each State of Bus Frequency
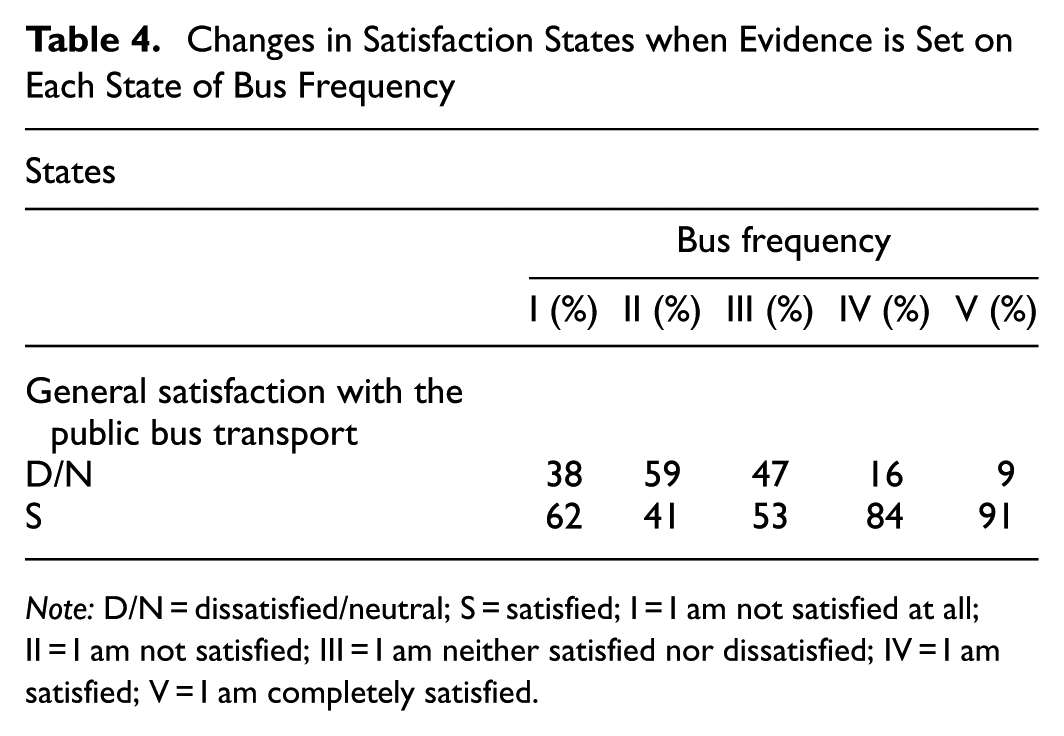
Note: D/N = dissatisfied/neutral; S = satisfied; I = I am not satisfied at all; II = I am not satisfied; III = I am neither satisfied nor dissatisfied; IV = I am satisfied; V = I am completely satisfied.
Changes in the States of the Bus Frequency When Evidence is Set on Each State of the Adequacy of Seats/Areas Reserved for People with Disabilities in Buses
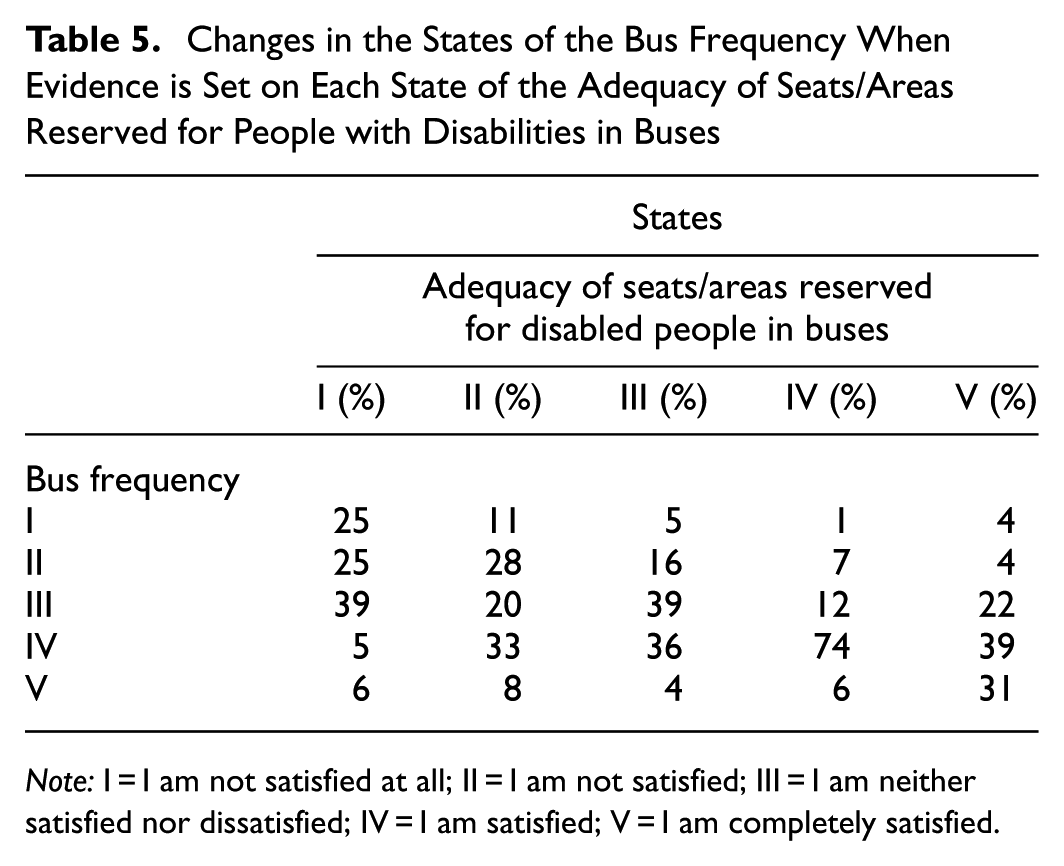
Note: I = I am not satisfied at all; II = I am not satisfied; III = I am neither satisfied nor dissatisfied; IV = I am satisfied; V = I am completely satisfied.
Changes in the Satisfaction States When Evidence is Set on Each State of the Adequacy of Seats/Areas Reserved for Disabled People in Buses
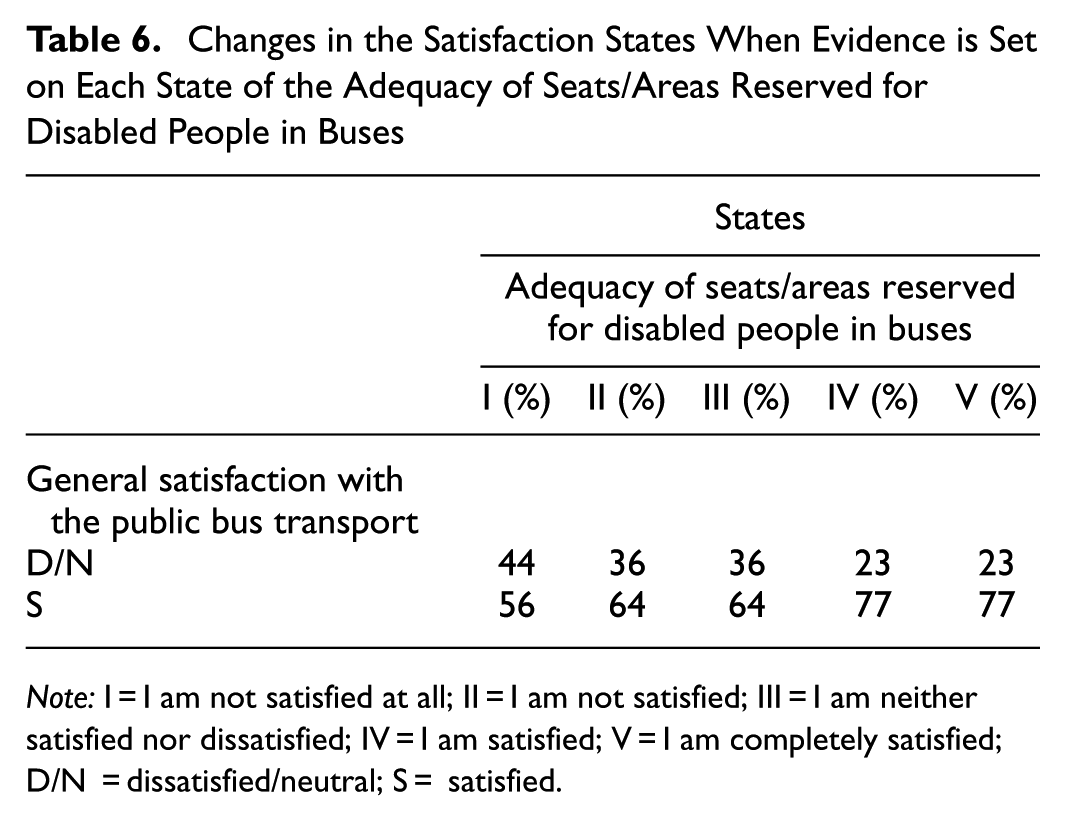
Note: I = I am not satisfied at all; II = I am not satisfied; III = I am neither satisfied nor dissatisfied; IV = I am satisfied; V = I am completely satisfied; D/N = dissatisfied/neutral; S = satisfied.
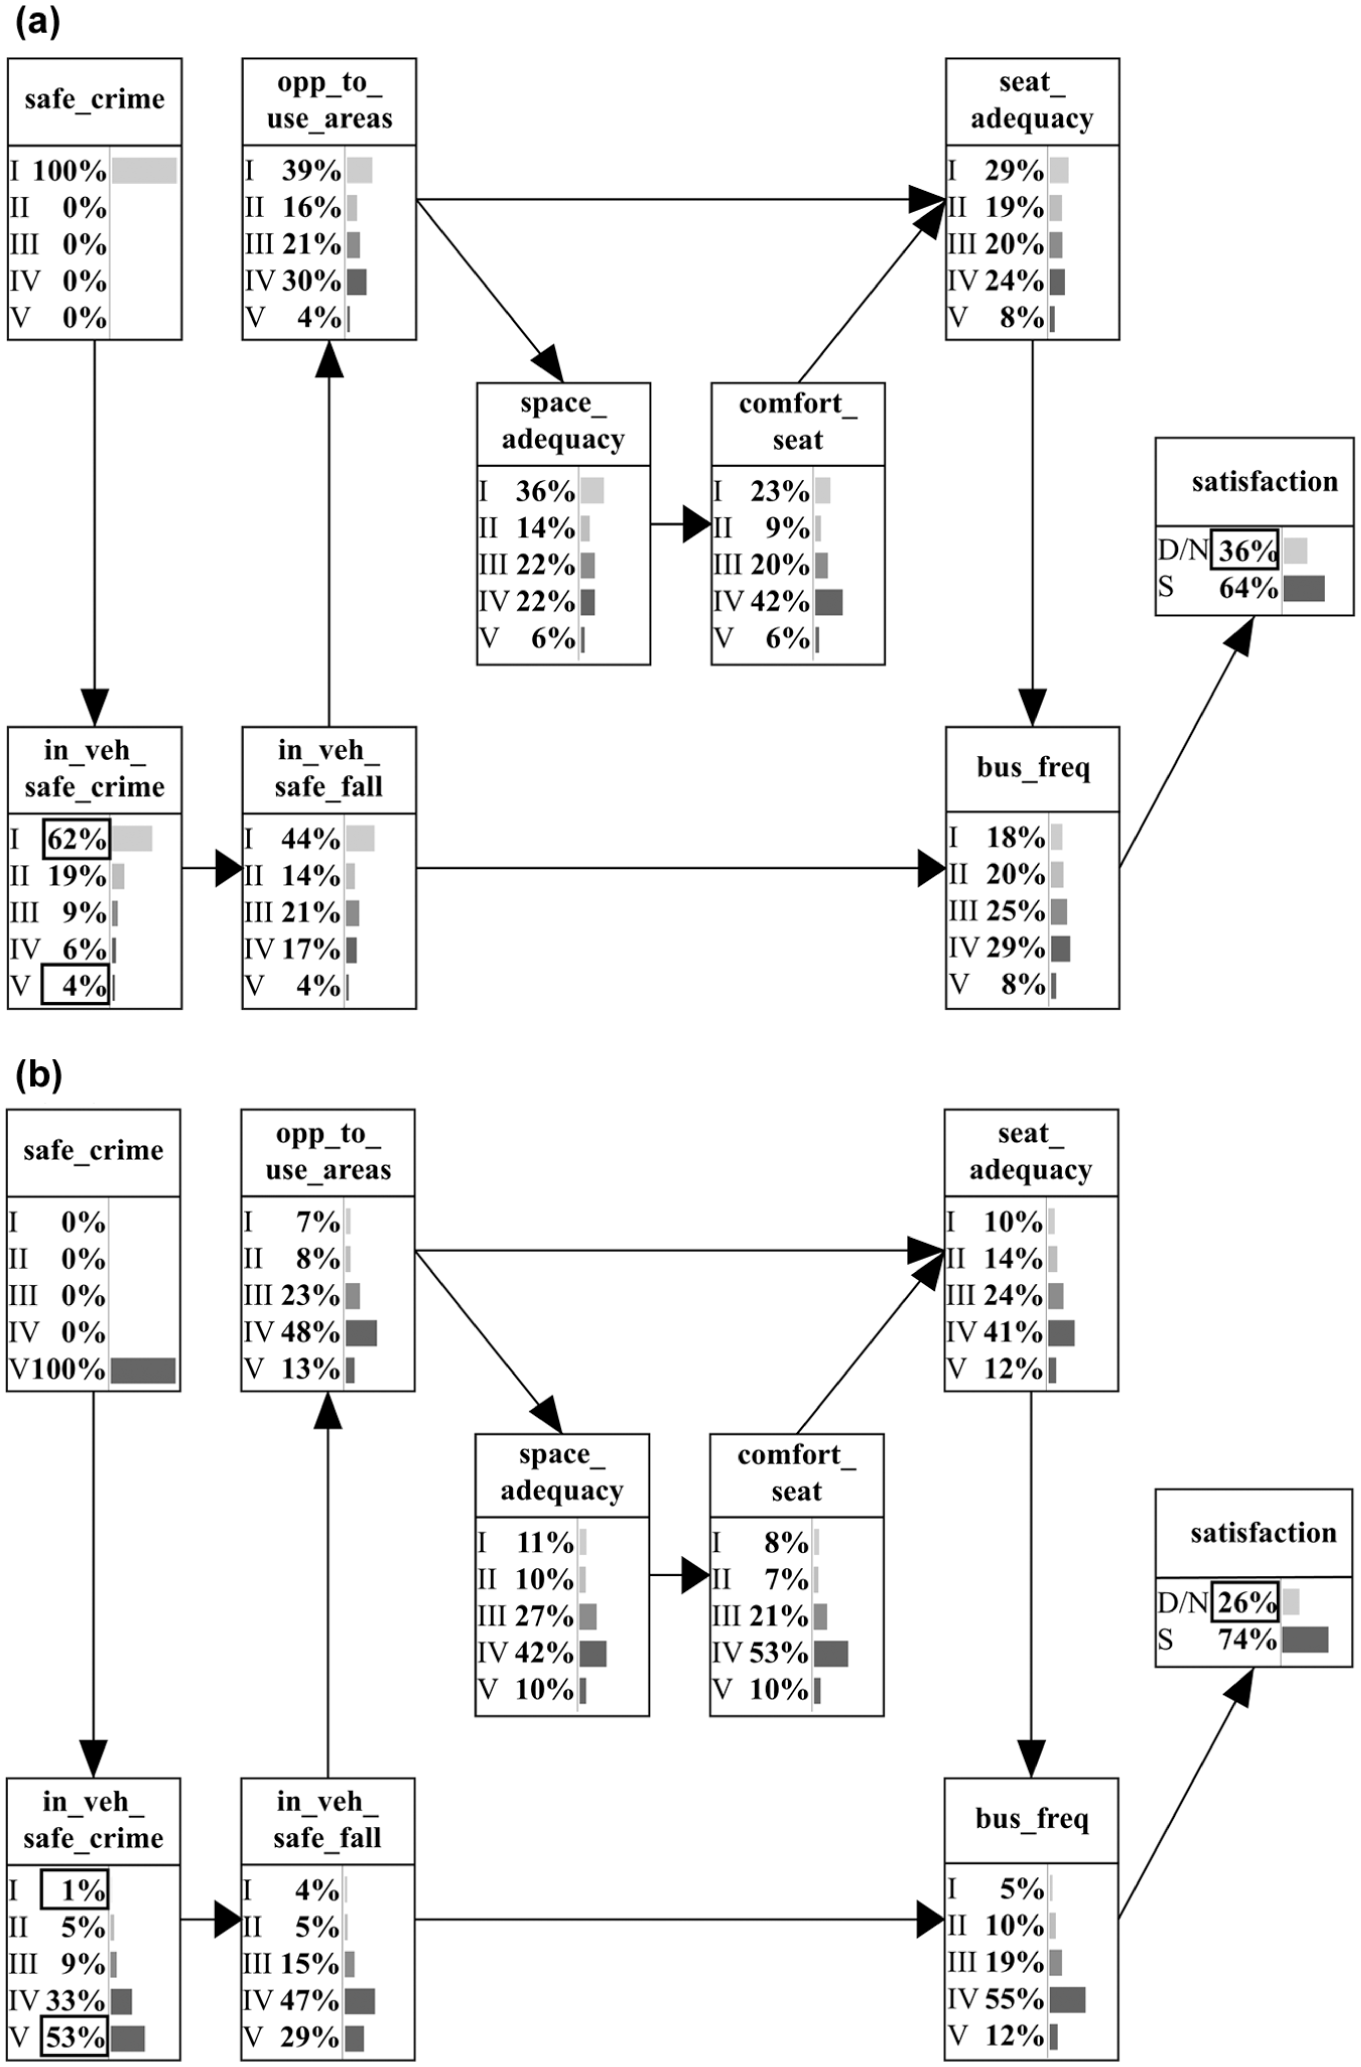
Changes in the network when evidence is set on: (a) the lowest; and (b) the highest states of feeling safe at stops (e.g., against crime).
Changes in the network when evidence is set on: (a) the lowest; and (b) the highest states of the opportunities to use areas reserved for people with disabilities.
Changes in the network when evidence is set on: (a) the lowest; and (b) the highest states of the space adequacy for disabled vehicles.
Tables 4–6 display the effect of multiple pieces of evidence related to a single item on other given items. Since BNs allow at most one piece of evidence per item, graphical representation is not used in this case. Instead, examining the effects of each piece of evidence can be performed more efficiently from the tables. Note that significant results will be presented graphically in the remainder of the results section. Specifically, the analysis will explore the extent to which the percentages of all other items change under worst-case and best-case scenarios for a given item. To avoid too many figures, only representative items were chosen. For example, between safe_crime and in_veh_safe_crime, the first was selected because it is further from the target item. Then, between in_veh_safe_fall and opp_to_use_areas, the second was retained, because both variables are closely related and showing both would not give new information. From space_adequacy and comfort_seat, one variable was also chosen.
Figure 5 shows how the percentages in the final BN network shown in Figure 3 change when the evidence for feeling safe at stops (e.g., against crime) item (safe_crime), which is the item furthest from satisfaction in the network, is set to its lowest and highest states. Figure 5a shows the effect when safe_crime is at its lowest state (I am not satisfied at all); Figure 5b shows the effect when it is at its highest state (I am completely satisfied). Of note, setting evidence on safe_crime = I has a significant effect on the in-vehicle safety (crime) item (in_veh_safe_crime). Specifically, the initial value of in_veh_safe_crime = I, which was 13% in the network shown in Figure 3, increases to 62% when evidence is set on safe_crime = I (Figure 5a). In contrast, setting evidence on safe_crime = V reduces in_veh_safe_crime = I to 1% (Figure 5b). In addition, setting evidence on safe_crime = I decreases the initial value of in_veh_safe_crime = V from 9% to 4% (Figure 5a); however, setting evidence on safe_crime = V increases it to 53% (Figure 5b). In conclusion, this analysis suggests that implementing additional security measures against crime at stops can significantly improve passengers’ perception of safety in the vehicle. Figure 5 shows insights into how passengers’ perception of safety from crime at bus stations can affect the target item. Setting evidence on safe_crime = I increases the percentage of D/N with public bus transportation from the initial value of 31%–36%, as shown in Figure 5a. Although safe_crime is the furthest item from the target item in the network, it increases satisfaction = D/N by 4%. In contrast, when evidence is set on safe_crime = V, State D/N of the target item reduces to 26% (Figure 5b). This implies that the State D/N of the target item decreases by about 5% compared with its initial value. Therefore, these findings revealed that safe_crime alone can improve passenger satisfaction perceptions of public bus transportation by up to 5%.
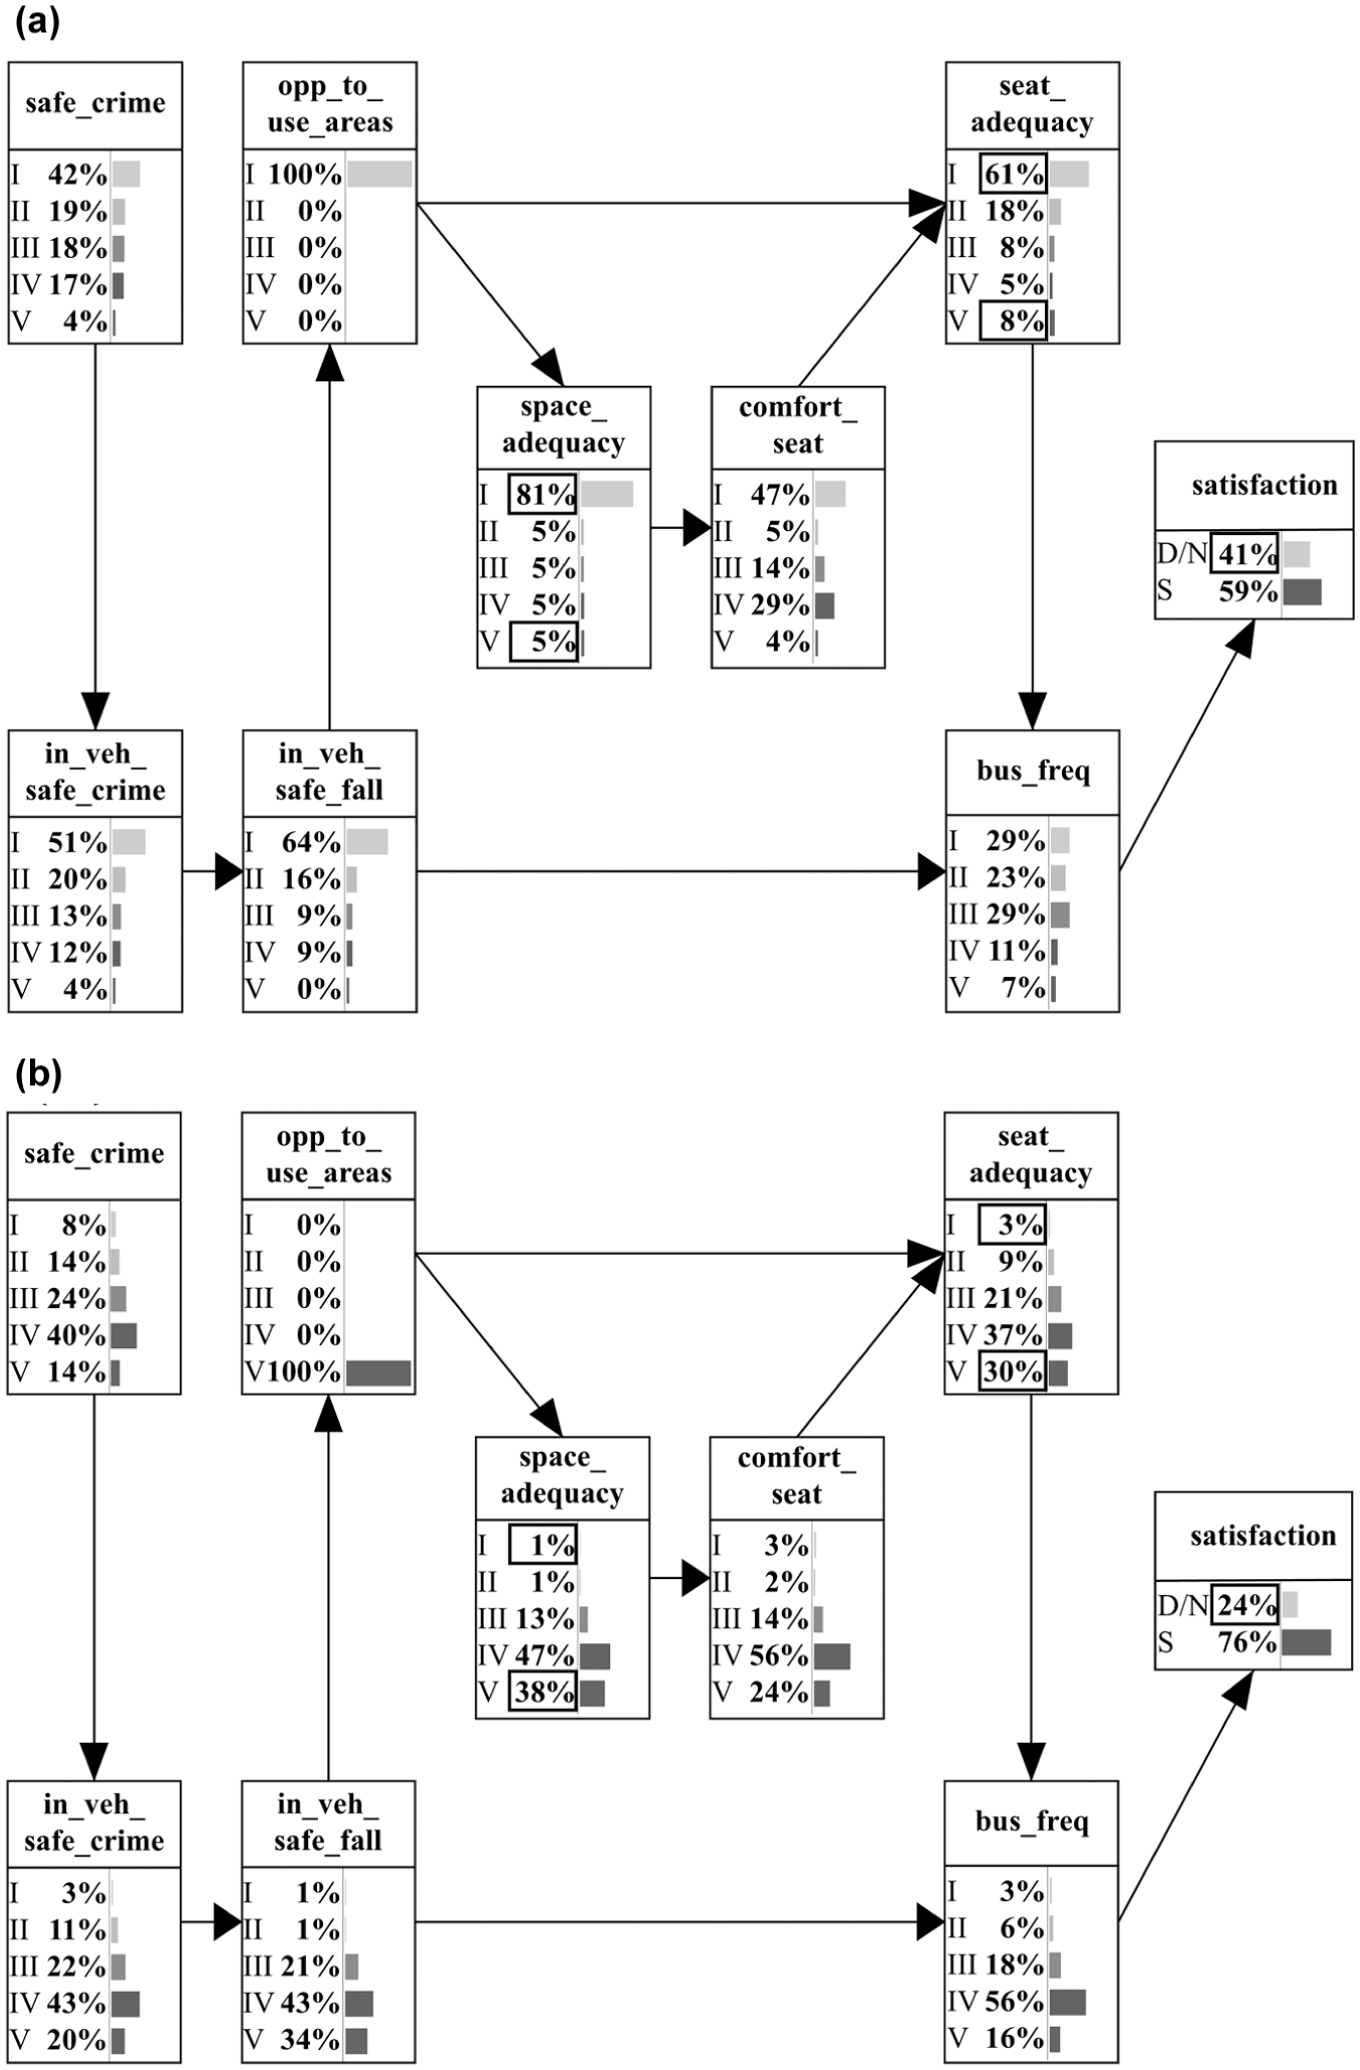
Figure 6 shows the changes in the percentages of the final BN network from Figure 3 when evidence is set to the lowest and highest states of the opportunities to use areas reserved for people with disabilities (opp_to_use_areas) item. The effect of setting the evidence set on the lowest and highest states of opp_to_use_areas on the network can be seen in Figure 6a and b , respectively. Of note, when evidence is set on opp_to_use_areas = I, changes in space adequacy for disabled vehicles item (space_adequacy) and seat_adequacy become prominent (Figure 6a). For space_adequacy, States I and V, which originally constituted 18% and 7% of the network, respectively, become 81% and 5%, respectively, when evidence is set on opp_to_use_areas = I. Similarly, when evidence is set on opp_to_use_areas = V, States I and V of space_adequacy are 1% and 38%, respectively (Figure 6b). For the adequacy of seats/areas reserved for people with disabilities in buses item (seat_adequacy), States I and V, which were 16% and 10% in the initial network, respectively, become 61% and 8%, respectively, when evidence is set on opp_to_use_areas = I (Figure 6a). Similarly, States I and V of seat_adequacy are 3% and 30%, respectively, when evidence is set on opp_to_use_areas = V (Figure 6b). These findings suggest that enhancing passenger satisfaction with the availability of areas reserved for individuals with disabilities can have a significant positive effect on their perception of seat and space adequacy. Figure 6 also shows how passengers’ perception of using the areas reserved for people with disabilities can affect their satisfaction with public bus transportation. When evidence is set on opp_to_use_areas = I, the percentage of dissatisfaction with public buses increases from an initial value of 31% to 41%, as shown in Figure 6a. This suggests that setting evidence on opp_to_use_areas = I increases satisfaction = D/N by approximately 10% (Figure 6a). However, when evidence is set on opp_to_use_areas = V, State D/N of the target item decreases to 24%, representing a 7% decrease from the initial value (Figure 6b). Therefore, from this example, opp_to_use_areas alone can increase the general satisfaction percentage of passengers by 7%.
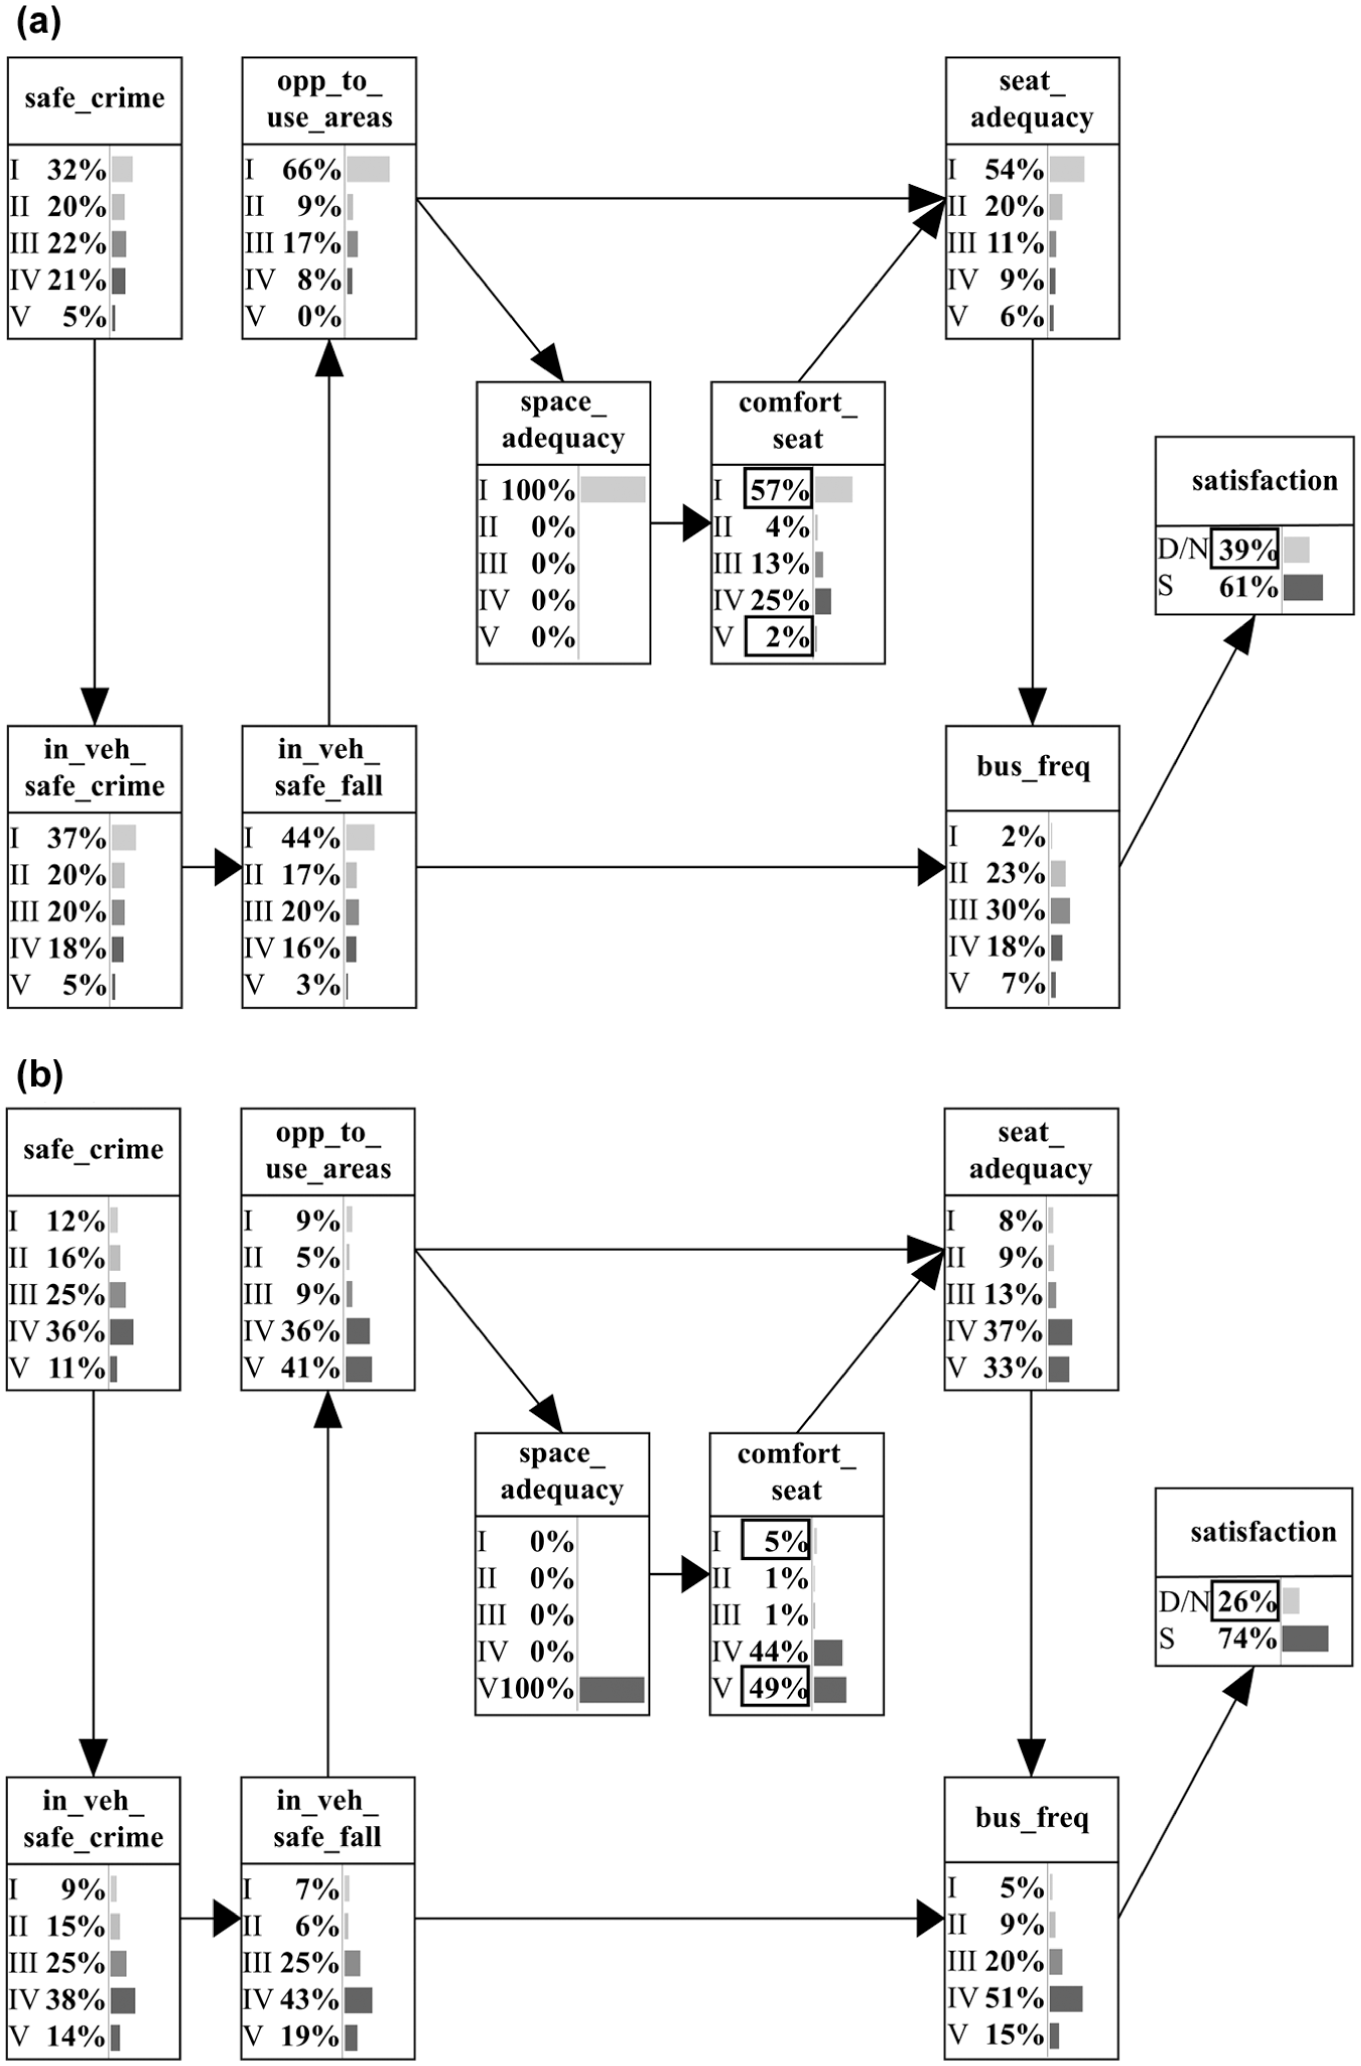
Figure 7 shows the changes in the percentages of the final BN network from Figure 3 when evidence is set to the lowest and highest states of the space adequacy for disabled vehicles (space_adequacy) item. The effect of setting evidence on the lowest and highest states of space_adequacy on the network is shown in Figure 7a and b , respectively. Taking a closer look at the lowest state of the comfort/cleanliness of seats/areas reserved for people with disabilities in the buses item (comfort_seat = I), which had an initial value of 12%, a significant increase to 57% is observed when evidence is set on space_adequacy = I (Figure 7a). In contrast, setting evidence on space_adequacy = V results in a sharp drop in comfort_seat = I to 5% (Figure 7b). These findings indicate that the perceived adequacy of space can have a significant effect on the perceived comfort of the seats, as shown by the substantial changes in comfort_seat = I. Then, comfort_seat = V was analyzed, which had an initial value of 8%. When evidence is set on space adequacy = I, comfort_seat = V drops to 2% (Figure 7a). However, when evidence is set on space_adequacy = V, comfort_seat = V increases to 49% (Figure 7b). Therefore, implementing additional security measures against crime at stops can significantly enhance passenger perception of safety in the vehicle. In addition, improving passenger satisfaction with space adequacy for disabled vehicles will have a positive effect on their satisfaction levels with the comfort of seats or areas reserved for passengers with disabilities. As shown in Figure 7, the effect of passengers’ perception of space adequacy for disabled vehicles on the target item can be assessed. Initially, the percentage of D/N with public bus transportation was 31%, but this value increased to 39% when evidence was set on space_adequacy = I (Figure 7a). This indicates that satisfaction = D/N increased by approximately 8% when the evidence was set on space_adequacy = I. However, when evidence was set on space_adequacy = V, satisfaction = D/N decreased to 26%, indicating a 5% decrease compared with the initial value (Figure 7b). Therefore, space_adequacy alone has the potential to improve overall passenger satisfaction by 5%.
Conclusion
Public transportation plays a significant role in benefiting the environment and providing convenient transportation options for people. However, people with disabilities face numerous barriers when using public transportation, such as inaccessible infrastructure, inadequate seating arrangements, and narrow aisles that pose significant challenges for wheelchair users and those with mobility impairments. These barriers range from physical to social, resulting in discomfort, dissatisfaction, and exclusion ( 76 ). The IBB implemented several measures to ensure that individuals with disabilities have equal access to public transportation, such as buses and trams with wheelchair ramps and low floors ( 7 ). However, it is crucial to examine the level of satisfaction among passengers with disabilities, identify the factors that influence their satisfaction levels, and determine their most common complaints to enhance their travel experiences and ensure social equality.
This study introduces a BN model that visualizes the probabilistic reasoning between the factors that affect the general satisfaction of passengers with disabilities with public bus transportation the most, enabling policymakers and transportation providers to better understand the complex interplay between them and develop more effective interventions to enhance the travel experiences of passengers with disabilities. In addition, this study provides scenarios that can reduce the dissatisfaction levels of passengers with disabilities with public bus transportation, which can serve as a roadmap for policymakers and transportation providers to improve the satisfaction levels of passengers with disabilities. Finally, this study identifies the key factors that have the most significant effect on the overall satisfaction levels of passengers with disabilities in Istanbul, including the joint role of accessibility, safety, and bus frequency—dimensions often examined separately but less frequently studied together. This integrated perspective offers useful insights for developing more holistic interventions. In addition to these contributions, this study provides valuable insights for policymakers and public transportation providers for designing and implementing more effective policies and strategies to improve the travel experiences of passengers with disabilities using public bus transportation.
Specifically, the results obtained from the BN model and What-If scenario evaluations form a coherent analytical sequence that directly addresses this study’s objectives. To achieve these goals, this study analyzed the level of satisfaction of passengers with disabilities using public bus transportation in Istanbul, Türkiye, using a questionnaire survey. Including the survey items, a BN model was created by using the GTT algorithm. The BN sensitivity analysis was employed to determine the most relevant items in increasing general passenger satisfaction. Each analytical step—BN modeling, sensitivity evaluation, and scenario testing—was used to confirm and interpret the statistical relationships identified in the network, ensuring that the findings were directly derived from the proposed methodology.
According to the findings, the most relevant items in increasing the general satisfaction of passengers with disabilities using public bus transportation in Istanbul are the items related to feeling safe at stops or in the vehicle (safe_crime, in_veh_safe_crime, and in_veh_safe_fall) and using the areas reserved for people with disabilities (opp_tu_use_areas, space_adequacy, comfort_seat, and seat_adequacy), as well as bus frequency. In the BN model, the connections through bus frequency not only provide satisfaction but also are regarded as a solution by passengers with disabilities to solve the problems related to special needs, such as accessibility/adequacy of spaces reserved for people with disabilities and enhanced safety/security. In addition, What-If scenarios were utilized by setting evidence for the states of the items. These scenarios allowed the effect of items to be calculated that most affect passengers’ satisfaction as a percentage. This alignment between the analytical results and the research goals demonstrates that the proposed methodology was fully implemented and the objectives were successfully met. This approach revealed concrete ways to improve the satisfaction levels of passengers with disabilities using public transportation in Istanbul. The What-If scenarios indicate that meeting the special needs of people with disabilities can noticeably boost the satisfaction level of passengers with disabilities.
Based on all the findings, the most effective way to increase the overall satisfaction of passengers is to increase bus frequency. The What-If scenarios reveal that enhancing bus frequency could boost overall satisfaction by approximately 22%. Similarly, improving the perception of the passengers to feel safe at stops and/or in the vehicle is one of the factors that most affect their overall satisfaction. According to the What-If scenarios, enhancing this perception could independently increase overall satisfaction by 5%. These findings agree with the literature focused on non-disabled people ( 10 , 77–80). Finally, increasing satisfaction with the areas reserved for people with disabilities could raise overall satisfaction by around 7%.
Based on the results and conclusions of this study, policymakers and transport operators should prioritize the following recommendations to improve the satisfaction levels of passengers with disabilities using public bus transportation in Istanbul: (1) increase bus frequency: increasing the frequency of buses can significantly reduce the dissatisfaction levels of passengers with disabilities. Therefore, policymakers and transport operators should focus on improving the frequency of buses to meet the demands of passengers with disabilities; (2) improve accessibility and adequacy of spaces reserved for passengers with disabilities; maximizing the perception of the passengers with disabilities on the adequacy and accessibility of spaces reserved for people with disabilities can increase their satisfaction levels. Transport operators should ensure that these spaces are well maintained and accessible to all passengers with disabilities. Accessibility has been shown in numerous studies to influence user satisfaction. Contemporary shifts in the transportation paradigm highlight accessibility, rather than mere mobility, as the central concern ( 81 ). Several studies examine accessibility in transportation for access to facilities, services, destinations, and opportunities ( 82 , 83 ). In the model presented in this study, accessibility could not be measured directly; instead, it is addressed using closely related indicators, such as bus service frequency. Approaches linking accessibility to proximity to stops and service frequency are widely applied in practice ( 84 – 86 ); (3) enhance safety and security measures: improving passengers’ perception of safety from crime at stops or in the vehicle can have a significant effect on their satisfaction levels. Policymakers and transport operators should implement safety and security measures, such as closed-circuit television cameras and security personnel to ensure the safety of all passengers. By implementing these recommendations, policymakers and transport operators can improve the travel experiences of passengers with disabilities using public bus transportation in Istanbul and promote social equality.
The novelty of this study lies in its application of a BN model to analyze and visualize probabilistic relationships between the critical factors affecting satisfaction levels, offering a more nuanced understanding of the complex interplay and the distinct findings it generates. The BN framework is not new; this study’s contribution is significant in its adaptation of the model to address the unique challenges faced by passengers with disabilities in a highly congested urban environment. By providing quantifiable insights, such as how specific interventions (e.g., improving bus frequency or enhancing safety measures) can independently and collectively affect satisfaction levels, this study offers practical solutions that can guide policymakers and transportation operators. In addition, this study is one of the few focused specifically on the experiences of passengers with disabilities in Istanbul, providing valuable insights and practical solutions to enhance the accessibility and quality of public transportation for this underserved population. What-If scenarios represent the outcomes obtained from the case study presented in this study. Implementable scenarios refer to the scenarios that service-providing institutions can apply in practice, based on the What-If scenario results, within their available resources and constraints.
This study has several limitations. It relies on self-reported data, which may be biased and is limited to Istanbul, potentially restricting the generalizability of the findings. The focus on public buses excludes other transportation modes that might affect passengers with disabilities’ experiences. Future studies could address these limitations by expanding into different regions and including various modes of public transportation. Incorporating longitudinal data and qualitative methods, such as interviews, could provide a deeper understanding of passengers with disabilities’ experiences. Developing user-friendly tools and training programs for interpreting BN model findings could also enhance the practical implementation of this study’s recommendations.
Policy Implications
The frequency of buses stands out as one of the most influential factors on satisfaction. The first solution could be increasing the number of buses in operation to ensure higher frequency in a megacity such as Istanbul. However, the frequent and timely arrival of buses at stops can be independent of operations. The most significant factor affecting this is traffic congestion, the biggest obstacle to the planned scheduling. Despite the low car ownership rate in Türkiye compared with other countries ( 87 ), Istanbul ranks third in congestion level and 11th in delay time among 225 European cities. Globally, it ranks ninth in congestion level and 22nd in delay time among 387 cities ( 88 ). Therefore, what administrators can do to increase frequency becomes part of a problem that needs to be addressed from a more general perspective rather than locally. It is recommended that alternative solutions, such as demand-responsive systems for people with disabilities, be put into service by the public. Such systems may include on-demand shuttle services or small-capacity vehicles that operate via pre-booking applications and flexible routing algorithms ( 89 , 90 ). These vehicles can be integrated with Istanbul’s existing public transport network and scheduled to serve areas with high concentrations of passengers with disabilities or limited access to main bus lines ( 91 – 94 ). The issue of increasing frequency should be considered for people with disabilities who still wish to use general public transport systems, depending on the type and level of disability. However, granting this privilege to a special group of people with disabilities will increase overall welfare in a period where shared vehicles and micro transit services are on the agenda ( 95 , 96 ). Identifying routes heavily used by individuals with disabilities and taking local rather than general measures can also be a starting point for improvements. For nations aiming to enhance passenger satisfaction, this study’s recommendations can serve as a framework. For instance, the introduction of demand-responsive transport (DRT) systems for individuals with disabilities, as suggested for Istanbul, can be adapted to cities with similar traffic congestion issues.
Another solution to consider is compensating for the lack of direct solutions related to bus frequency. The results show that passengers directly or indirectly associate accessibility, adequacy of spaces, safety, and security with bus frequency. When bus frequency cannot be increased for the reasons mentioned previously, improving direct and indirect factors related to frequency will have a positive effect on satisfaction. For example, enhancing security at stops and on board will help to eliminate the negative perception of inadequate bus frequency.
The IETT, the public transportation service provider in Istanbul, takes some special measures for individuals with disabilities, such as using the Braille alphabet or the “Where is my bus?” application. Using the application, it is possible to see if the bus to be boarded is suitable for disabled use. However, because of specific issues, such as the ramp in the bus required for wheelchairs not automatically opening and closing because of incompatibility with the curb height, and instead being operated by the bus driver, this can cause temporal and emotional difficulties, such as dealing with reactions from passengers experiencing additional waiting time. Therefore, produce solutions such as ensuring compatibility between ramp and curb height and checking the suitability of overpasses and underpasses.
Another problem affecting satisfaction is the inability of individuals with disabilities to find seating in the spaces designated for them on the bus. It is suggested that strict enforcement be applied without any concessions on this matter. Explaining the concept of disability and the challenges faced by individuals with disabilities in public transportation to society correctly and effectively will provide a positive contribution. People who think disability is only physical may question the disability status of individuals with hearing impairment or chronic illnesses. Educating society and raising awareness to foster empathy will help to eliminate such unpleasantness.
Beyond Istanbul, these findings have broader implications. Many metropolitan areas worldwide face similar challenges, such as congestion, limited accessibility, and insufficient enforcement of disability rights. DRT has been shown to reduce social exclusion when inclusively designed. In Porto, Portugal, DRT frameworks achieved efficiency gains while maintaining service quality ( 97 ). Evidence from South Korea reinforces this view: an analysis of the Nadricol DRT service in Daegu shows that long waiting times increase agitation among passengers with disabilities, and diverse destinations and frequent trips reduce it ( 98 ). This underscores the importance of service reliability and attention to specific mobility needs for long-term inclusivity.
Policymakers should consider the simultaneous needs of non-disabled individuals and individuals with disabilities to ensure inclusivity. For example, safety and security are important for all user groups; they become particularly critical for passengers with disabilities, who may face additional risks, such as difficulties in evacuation during emergencies. Therefore, measures such as accessible emergency exits, priority seating near doors, and staff training on assisting passengers with disabilities can serve as practical steps toward ensuring inclusivity.
Footnotes
Acknowledgements
The authors thank the Yildiz Technical University Scientific Research Projects Coordination Unit for the support given to the project “Istanbul City Bus Transportation Service Quality Measurement for Individuals with Disabilities” (Project Number: 4681).
Author Contributions
The authors confirm contribution to the paper as follows: study conception and design: T. Karadag, G. Golbasi Simsek; data collection: G. Akyildiz Alçura; analysis and interpretation of results: T. Karadag, G. Golbasi Simsek; draft manuscript preparation: T. Karadag. All authors reviewed the results and approved the final version of the manuscript.
Declaration of Conflicting Interests
The authors declared no potential conflicts of interest with respect to the research, authorship, and/or publication of this article.
Funding
The authors disclosed receipt of the following financial support for the research, authorship, and/or publication of this article: This work was supported by Yildiz Technical University Scientific Research Projects Coordination Unit (Project Number: 4681).
Data Accessibility Statement
The raw data underlying this article’s findings can be provided by the authors upon request.