
Abstract
The COVID-19 pandemic has disrupted day-to-day lives and infrastructure across the United States, including public transit systems, which saw precipitous declines in ridership beginning in March 2020. This study aimed to explore the disparities in ridership decline across census tracts in Austin, TX and whether demographic and spatial characteristics exist that are related to these declines. Transit ridership data from the Capital Metropolitan Transportation Authority were used in conjunction with American Community Survey data to understand the spatial distribution of ridership changes caused by the pandemic. Using a multivariate clustering analysis as well as geographically weighted regression models, the analysis indicated that areas of the city with older populations as well as higher percentages of Black and Hispanic populations were associated with less severe declines in ridership, whereas areas with higher unemployment saw steeper declines. The percentage of Hispanic residents appeared to affect ridership most clearly in the center of Austin. These findings support and expand on previous research that found that the impacts of the pandemic on transit ridership have emphasized the disparities in transit usage and dependence across the United States and within cities.
Keywords
The global health crisis brought on by the spread of COVID-19, the disease caused by the SARS-CoV-2 novel coronavirus, has led to widespread disruption in all facets of human life since it was first reported in Wuhan, China on December 31, 2019. A pandemic was declared by the World Health Organization on March 11, 2020. From the first reported case in the United States on January 21, cases in the country grew rapidly. By March 26, the United States led the world with 81,321 reported cases and over 1,000 deaths ( 1 ). In response to the growing outbreak, local, state, and national governments across the world, including in the United States, began implementing restrictive measures to stop the spread of the virus. Starting in January with restrictions on travel from China, the United States began restricting international travel from multiple destinations throughout February and March. As evidence of community transmission mounted, restrictions on large gatherings began in localities across the country. On March 15, the Centers for Disease Control and Prevention advised against gatherings of more than 50 people and the following day, U.S. President Donald Trump recommended that gatherings of more than 10 be avoided ( 2 ). As the crisis mounted, the movements of individuals across the country decreased dramatically, as evidenced by anonymized mobile device location data ( 3 ). The increased precautions enacted by governments to curb the spread of COVID-19 as well as voluntary decreases in movement on the part of individuals resulted in dramatic changes to economic and infrastructure systems.
Among the systems affected by the onset of the COVID-19 pandemic are public transportation systems in every metropolitan area in the United States. According to a report prepared for the American Public Transportation Association (APTA), public transportation ridership across the United States dropped to 80% of 2019 levels in April 2020 and remained at around 60% of 2019 levels for the remainder of the year. This drop was the result of a transition in many workplaces to remote work-from-home arrangements, a jump in unemployment from closed businesses, and decreased mobility in all other aspects of life as individuals were required or encouraged to stay home to prevent the spread of COVID-19 ( 4 ). These steep decreases in ridership coupled with increased costs associated with cleaning, personal protective equipment, and other expenses resulted in large projected budget shortfalls for transit agencies in the United States following the onset of the pandemic. APTA estimated in January 2021 that funding needs for 2021 amounted to $25.2 billion, in addition to nearly $30 billion over the following 2 years, although the American Rescue Plan Act provided an additional $30.5 billion in funding to public transportation systems in March 2021 ( 4 , 5 ).
Like cities across the United States, Austin, TX was greatly affected by the COVID-19 pandemic and its impacts on public transportation. On March 6, 2020, Travis County, which contains Austin, issued a disaster declaration owing to the increasing severity of the COVID-19 outbreak ( 6 ). On March 24, the Travis County Judge issued an order instructing residents of the county to stay home to further curb the spread of the virus ( 7 ). The local transit agency, the Capital Metropolitan Transportation Authority (Capital Metro), began to see a precipitous drop in ridership around this time.
Owing to the severe effects that the pandemic has had on public transportation ridership and budgets, research is increasingly being done to understand the scope of these impacts. Public transportation remains a vital part of urban infrastructure and many continue to rely on it. This study explored how and why transit ridership decreased unevenly across the communities and neighborhoods of Austin, TX. Understanding this distribution is important for transportation planners to better respond to the needs of various communities, particularly as the pandemic and the changes it has brought to transportation systems continue.
This study made use of multiple demographic and spatial variables to explore the varying impacts of the pandemic in Austin and it was hypothesized that certain variables would stand out as having particularly important relationships to the levels of ridership change. The goal of the study then was to indicate which characteristics describe the areas of the city that have experienced the most significant increases or decreases in transit ridership since March 2020. It was expected that certain demographic characteristics would be associated with less severe drops in ridership, such as race, ethnicity, age, income, or employment status.
Literature Review
An increasing amount of research has explored the mobility and transportation impacts of the pandemic since it began in March 2020. A portion of this research has focused on overall changes in mobility as well as changes in the modes of transportation used. Abdullah et al. used a questionnaire both before and after the onset of the pandemic to assess respondents’ mobility changes. The study found significant changes in travel choices, notably a shift from public transportation to private transport and other modes such as walking and biking ( 8 ). Beck and Hensher also used a survey to assess travel activity changes, in this case in Australia during its period of lockdown. The study similarly found large-scale changes in work, school, and other mobility patterns resulting in a decrease in movement, particularly for public transportation ( 9 ). Bucksy found a similar result in Budapest, Hungary by measuring transportation mode usage, with lockdown measures causing significant reduction across all modes but most directly affecting public transportation ( 10 ). In an analysis of survey results from Istanbul, Turkey, Shakibaei et al. came to similar conclusions about the overall transit decline and the particular reduction in ridership and safety perceptions of public transportation ( 11 ). Jiao and Azimian found that survey respondents across the United States showed significant reductions in the number of trips to stores and public trips across multiple demographic and health categories, even several months into the pandemic ( 12 ). In another study, Jiao and Azimian found that increased rates of telework occurred across many demographic categories, implying impacts on mobility ( 13 ). In a separate study, Jiao et al. found that weekly COVID-19 case rates and unemployment claims were associated with lower foot traffic in Houston, TX ( 14 ). In a survey study about the pandemic’s impact on travel behavior in Chicago, Shamshiripour et al. found substantial changes in risk perception as well as the proportion of people using online shopping and teleworking ( 15 ).
Although these studies considered the impacts of the pandemic on public transportation, they were focused on mobility and attitude changes overall. Other studies have considered more directly the changes seen in transportation systems since March 2020. Arellana et al. analyzed ridership data from transportation systems across multiple cities in Colombia; they found major declines were associated with mandatory measures applied by the government as well as individuals’ fear of infection ( 16 ). Tardivo et al. similarly looked at transportation systems as a whole, noting the potentially lasting impacts of the pandemic on railway and urban transportation ( 17 ). Jenelius and Cebecauer found particularly severe impacts on public transportation ridership in the analysis of data from three regions of Sweden ( 18 ). Wilbur et al. specifically investigated changes to public transit ridership in Nashville and Chattanooga, TN, finding both that ridership declined in both cities and across multiple lines following emergency declarations and stay at home orders in those localities. The study also found that ridership declined more in areas dependent on retail and declined less in areas with lower-income populations and higher percentages of Hispanic residents ( 19 ). Carter cites the pandemic as a crisis that has shed light on long-existing inequities in transit and the need to address disparities in access to transportation more directly ( 20 ).
A review of the literature indicated that much of the research related to the impacts of COVID-19 on public transportation relied on either exploratory analysis of survey and ridership data or regression techniques to discover the causal relationships, whereas few studies have made use of spatial analysis techniques to analyze these patterns. For example, Liu et al. used regression models to investigate the factors influencing the rate at which ridership dropped in metropolitan areas across the United States. The analysis showed that certain characteristics of cities resulted in higher or lower ridership low points. Cities with more universities and information sector jobs had higher drops in ridership whereas cities with higher shares of minority communities and older residents had less severe drops, indicating that cities with more essential workers and vulnerable populations maintained a certain level of transit demand ( 21 ). Although few studies related to the impacts of the pandemic on transportation have made use of geographically weighted regression (GWR) models, other studies investigating the widespread effects of the pandemic have employed such models. For instance, Chen et al., Yellow Horse et al., and Karaye et al. each used a GWR model to explore the structural and socioeconomic factors relating to the spread of COVID-19. These studies were focused on New York City, Native American populations in Arizona, and across the United States as a whole, respectively ( 22 – 24 ). This study similarly used the GWR method to spatially analyze the impacts of the pandemic but applied it to changes in transit usage to better understand how transportation systems have been affected.
It is worth noting that previous research has also considered the impact of other virus outbreaks on public transportation usage. Wang investigated the impact of the spread of the SARS-CoV-1 virus in Taipei City, Taiwan, finding that usage of the city’s underground transit system decreased dramatically, with a decline of about 50% of daily ridership, which the study links with the level of perceived fear of infection among residents ( 25 ). In another study, Sung found that the outbreak of Middle East Respiratory Syndrome in Seoul, South Korea in 2015 caused declines in daily rail transit ridership, particularly when the rate of infection was high ( 26 ). Although the scopes of these outbreaks and the COVID-19 pandemic are very different, they provide some insights into the effects of viral transmission on the willingness of commuters to use public transportation, an outcome that this study hoped to explore as well. Additionally, these studies did not explore issues related to transit disparities, which was the focus of this study.
Research Contributions
The present study attempted to go beyond some of the methods and conclusions of the research described above, while drawing on the insights and implications offered. It made use of a combination of models used in various studies on this topic for the purpose of providing multiple perspectives on the data. It also employed variables utilized and suggested across different studies to draw conclusions that are both specific to the reality of Austin, TX but could be applied and extrapolated to other cities and neighborhoods in the United States.
Data
To analyze the scope of transit ridership changes during the pandemic in Austin, TX and their relationship with characteristics of the population and built environment, three kinds of data were collected: public transportation ridership data, demographic data, and spatial characteristics. All data were collected or aggregated at the census tract level. Demographic data were collected for all census tracts in the Austin–Round Rock metropolitan statistical area (MSA) and transportation ridership data were aggregated for all census tracts that had at least one stop and more than 0 riders during the study period.
Austin is a medium-sized city and the state capital of Texas. The geographic unit of analysis for this study was the census tract. Austin has a total of 221 census tracts with an average population of approximately 5,619 people in 2019. Figure 1 represents the study area and its population density at the census tract level. An important characteristic of Austin relating to its transit usage is the presence of the University of Texas at Austin, a large public university in the center of the city, which typically accounts for high levels of ridership, especially in the area around the campus. Data from the 2019 American Community Survey (ACS) 5-year estimates indicate that transit users in the Austin–Round Rock MSA were 42.7% non-Hispanic white, 14.1% Black, and 29.6% Hispanic, compared with 55.1%, 7.1%, and 30.4%, respectively, for car commuters traveling alone. Additionally, 25.6% of transit users were below the poverty line whereas 9.7% of car commuters traveling alone were below the same threshold. The median age of transit riders was 32.1 compared with 39.5 for car commuters ( 27 ).
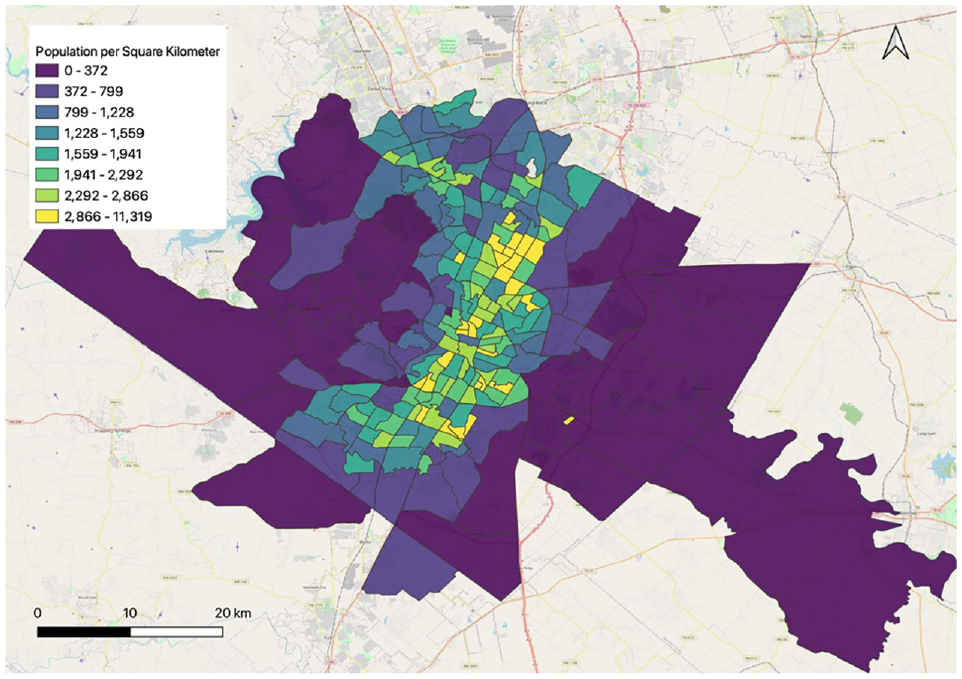
Austin census tract population density (population per square kilometer).
Ridership data were acquired through a data request from Capital Metro, the main transportation agency that operates in the Austin–Round Rock MSA. Capital Metro operates 97 bus routes and one commuter rail line with over 2,300 bus stops, serving a total of 1,300,518 people in the Austin area ( 28 ). The ridership dataset provided by Capital Metro included 2,106,884 rows, each representing the number of riders on a given day for a single route at a single stop across the transit network. The dataset contained ridership counts for each day between March 1, 2019 and January 9, 2021. It should be noted that Capital Metro modified its service levels in response to the pandemic, with most modifications in place between March and August 2020 ( 29 ). To measure the impact of the pandemic on ridership change at the stop level, the number of riders at each stop was aggregated into two categories: total ridership before the Travis County disaster declaration on March 6, 2020 and total ridership after. For each stop, the percent change in ridership from the aggregated total ridership before the start of the pandemic to the aggregated total during the period after March 6, 2020 was calculated. Figure 2 shows the percent change in ridership at the stop level. The total ridership before and after the pandemic for each stop was then aggregated to the census tract level by calculating the percent change in daily ridership from the prepandemic period to the pandemic period. One tract was dropped from the dataset owing to its value for percent change in ridership being an extreme outlier. The tract was dropped because it aggregated a very low number of stops and heavily skewed the data. Figure 3 shows the percent change in ridership before March 6, 2020, and after for census tracts with ridership data. One census tract in the north of Austin showed a slight increase in ridership, although this was the result of the presence of only two stops within the tract that had very low ridership before and after the pandemic period, skewing the percent change value.
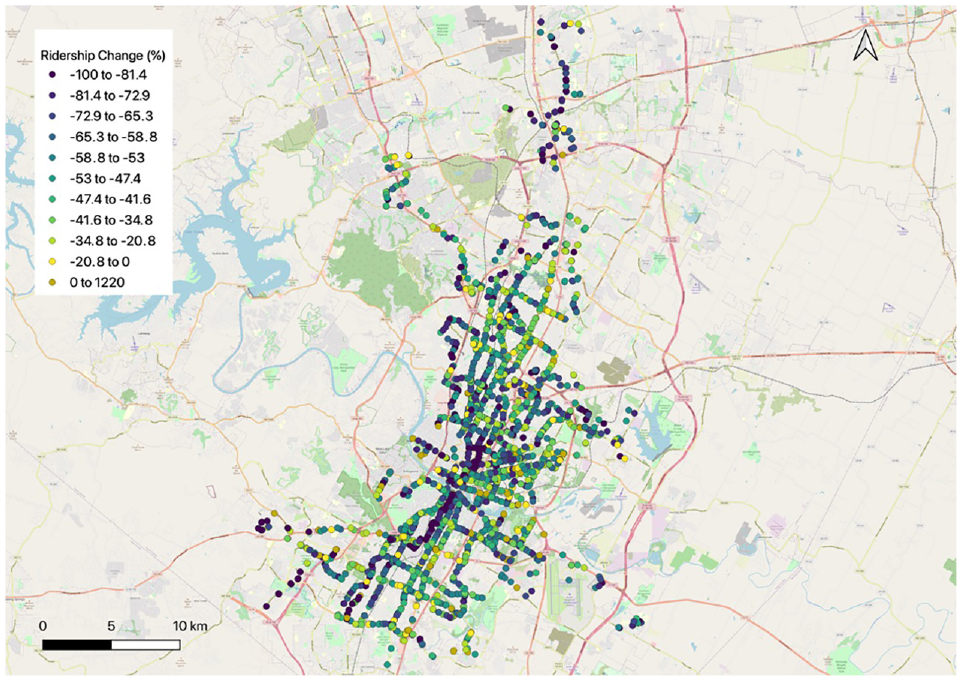
Ridership change (%) by transit stop.
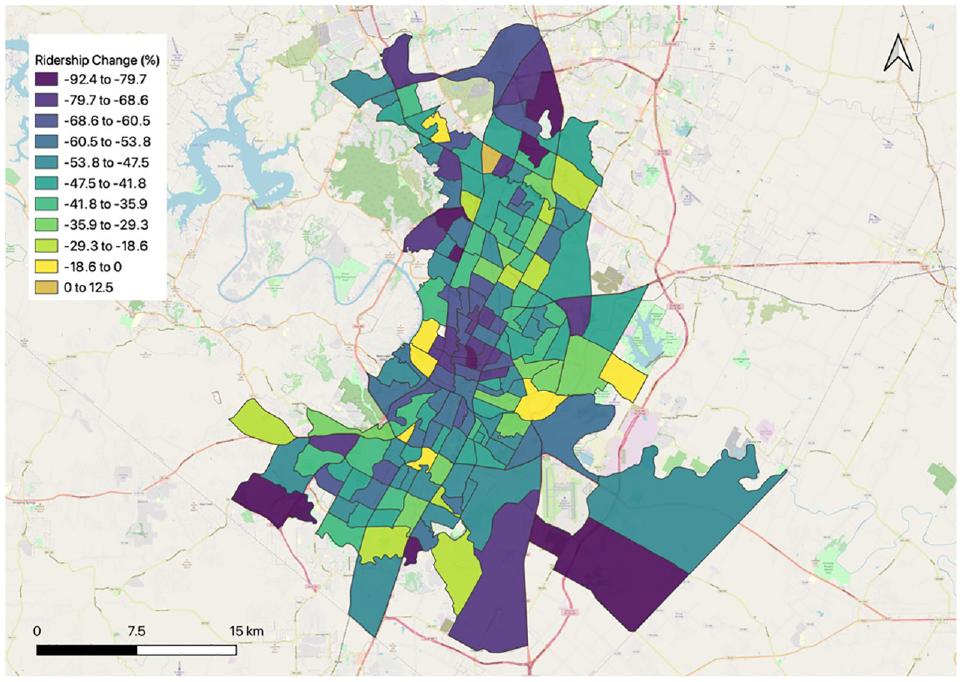
Ridership change (%) by census tract.
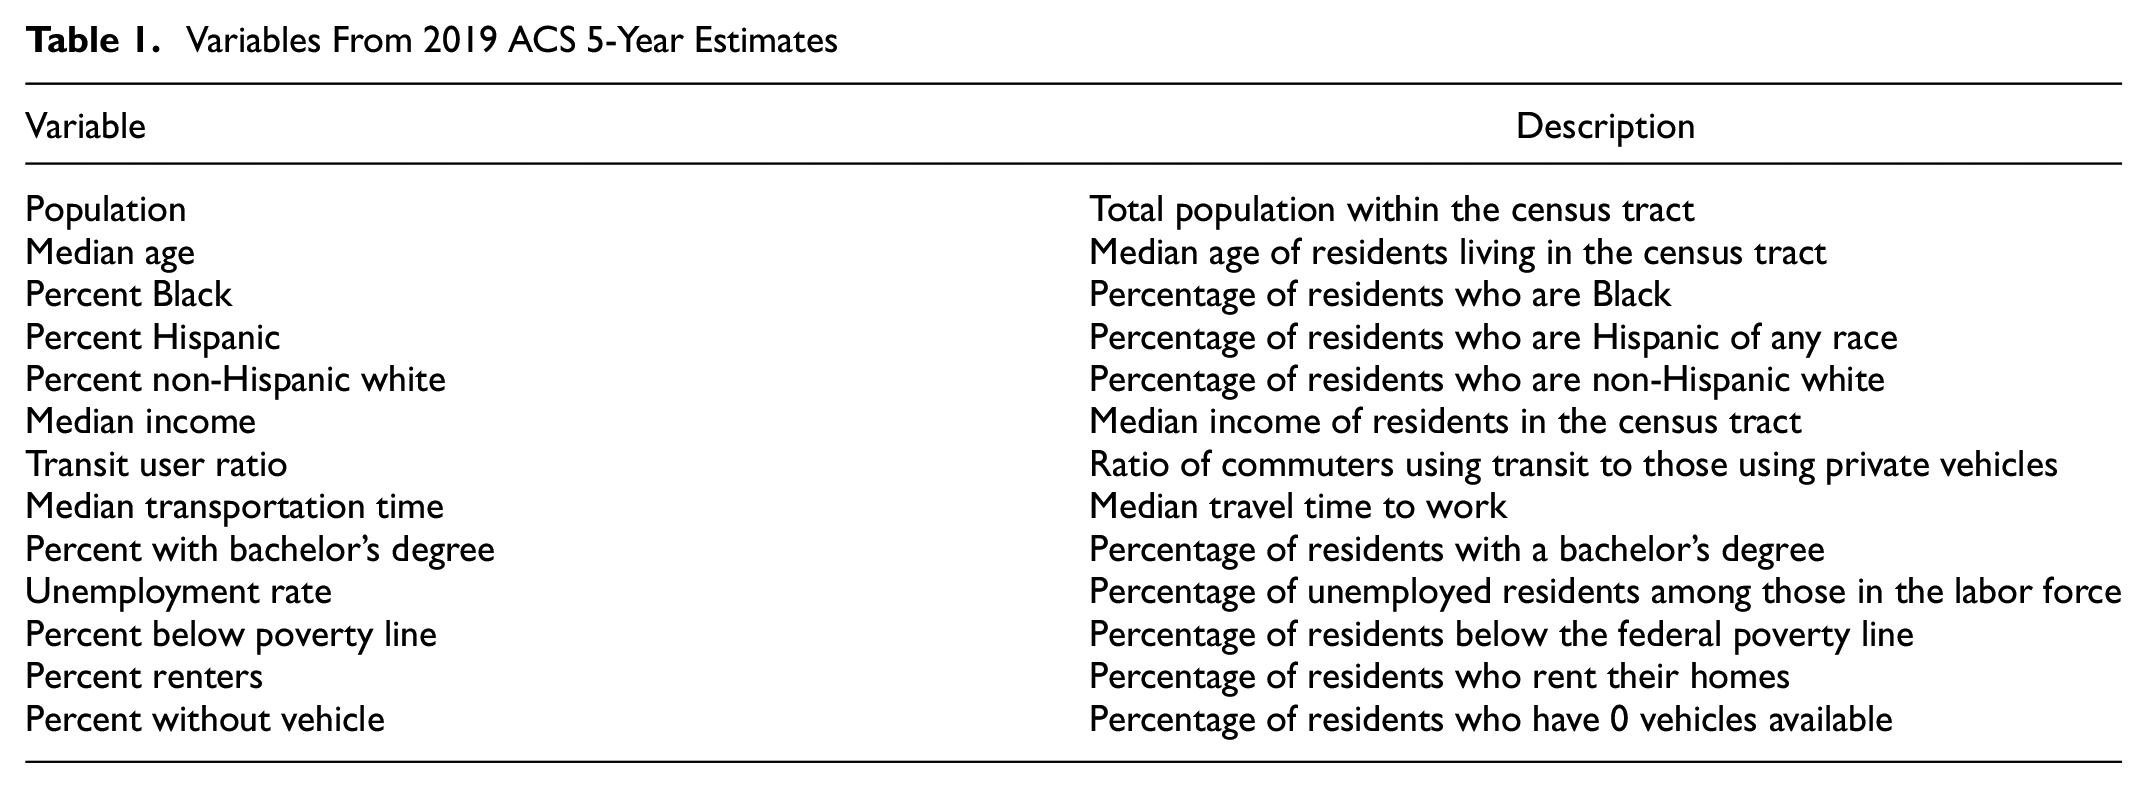
The demographic data used in the analysis were derived the 2019 ACS 5-year estimates from the U.S. Census Bureau. Table 1 indicates the variables included in the analysis derived from this source. The travel time to work variable is provided by the ACS in time intervals. For the purpose of this study, this data were processed to produce a median travel time based on the number of respondents in each time interval bucket.
Variables From 2019 ACS 5-Year Estimates
Two additional variables were derived from spatial characteristics of the census tracts in the study area. The distance from the centroid of the census tract containing the downtown Austin area was calculated as the kilometers from the centroid of a tract to the centroid of the downtown tract. The stop density variable was calculated as the total number of bus or rail stops in every census tract divided by its total area in kilometers squared. Table 2 contains a list of the variables included in the analysis and their characteristics.
Descriptive Statistics of the Variables
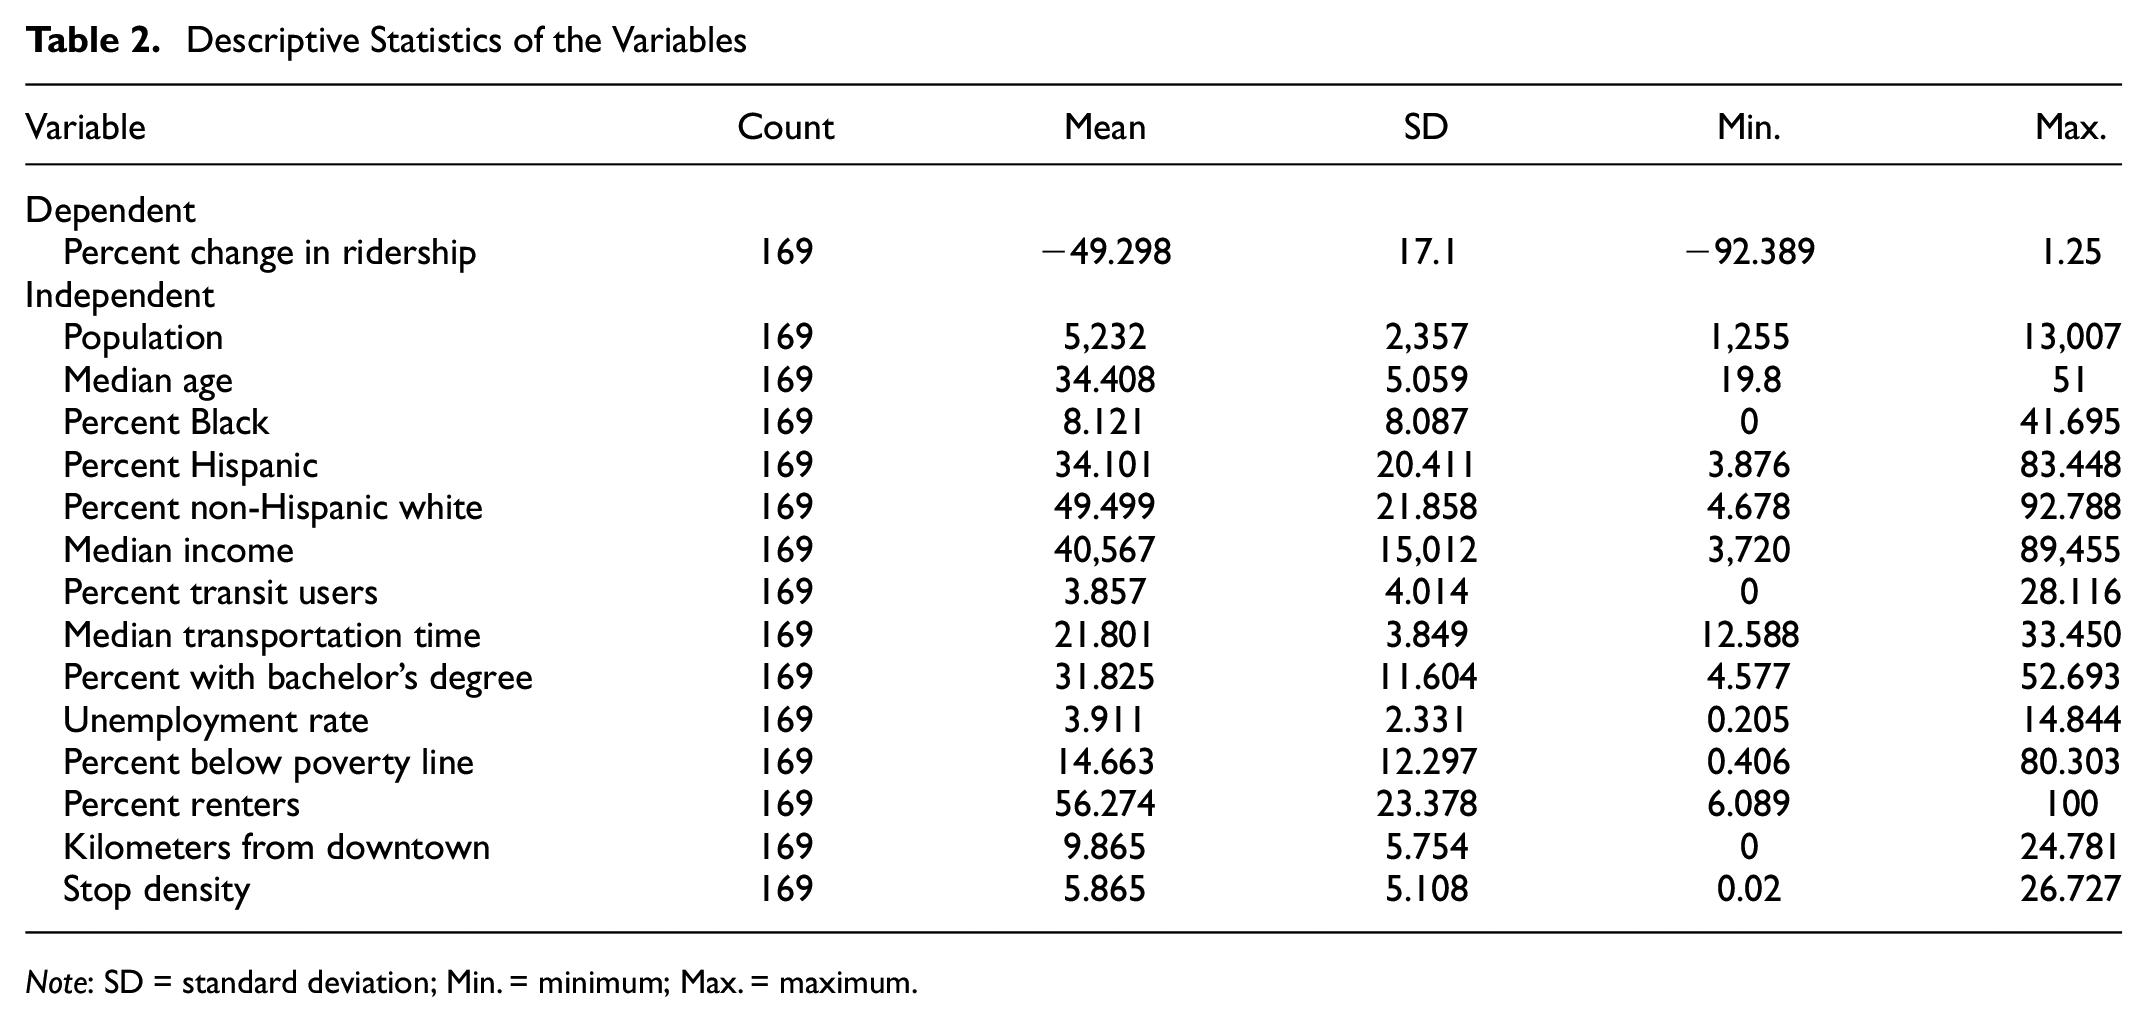
Note: SD = standard deviation; Min. = minimum; Max. = maximum.
The explanatory variables listed were chosen for their various potential impacts on the level of transit ridership change. For instance, it was expected that demographic variables such as the percent of Black and Hispanic residents would be associated with less pronounced declines in ridership owing to non-white populations tending to comprise a larger share of transit users and those that are transit dependent ( 30 ). A higher median age, on the other hand, might be expected to be associated with higher declines in ridership because older populations were at higher risk of severe disease from COVID-19. The other variables in the model were similarly chosen for their their potential impact on the level of ridership change during the pandemic.
Methods
The analysis undertaken to understand the impact of the various socioeconomic and spatial variables described above involved three phases. The first phase was a multivariate clustering analysis, the second phase included two GWR models. The goal of the first phase was to show what general relationships existed between all the variables in the study and what spatial patterns were evident in the data. The purpose of the final phase was to understand the geographic distribution of the impacts of the variables on transit ridership.
Multivariate Clustering
To understand the influence of each variable and their relationship to the other variables being studied, a multivariate clustering analysis was used. The analysis was performed using the multivariate clustering tool in ArcGIS Pro, which employes a K-means clustering algorithm. This method makes use of an unsupervised machine learning model to classify the input data into an optimal number of clusters, determined by calculating the highest Calinski–Harabasz pseudo F-statistic, a measure that describes the ratio between the variance among clusters and variance within a cluster ( 31 ). The pseudo F-statistic for up to 30 clusters was computed and the highest value was chosen as the optimal number of clusters.
GWR
GWR is a more highly specified regression method than an ordinary least squares model owing to how it incorporates the spatial weights of nearby features to measure the heterogeneity of each variable’s impact across space. To determine the variables suitable to include in the model, the correlation between variables was analyzed. From this analysis, the variables describing the percentage of residents below the poverty line, the percentage of residents who are renters, and the percentage of residents with at least a bachelor’s degree were excluded because of their high correlation with other variables. The variable describing the percentage of residents who are non-Hispanic white was also highly correlated with the variable describing the percentage of Hispanic residents. Thus, two models were created, one including the non-Hispanic white percentage variable and one including the percentage Hispanic variable. The variance inflation factor (VIF) matrix of the variables (Table 3) indicated that multicollinearity was not present in either model owing to the removal of correlated variables and because no VIF value was greater than 5 ( 32 ).
VIF Values
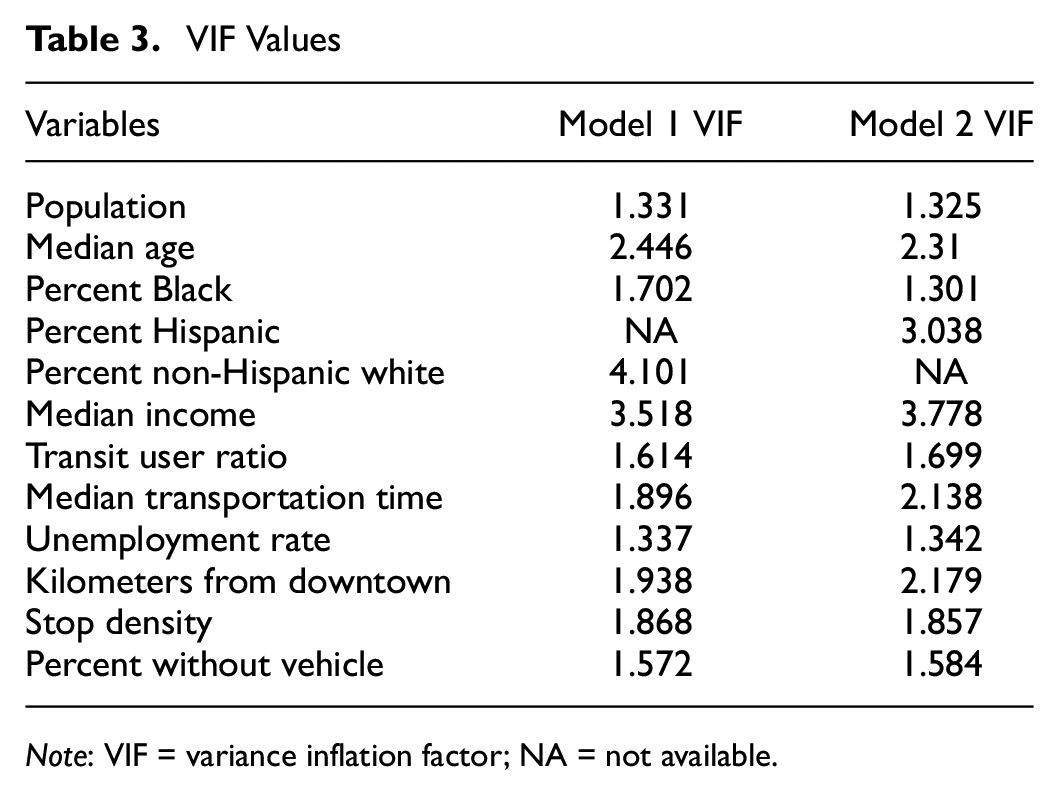
Note
The analysis in this study included two GWR models. The GWR analysis for both models was performed using the GWR tool in ArcGIS Pro, utilizing a Gaussian model that uses a Golden search algorithm to determine the optimal number of neighbors to consider for each observation ( 33 ).
Results
To determine the impact of each of the variables in the study on changes in ridership during the COVID-19 pandemic, the three aforementioned methods were carried out. The multivariate clustering analysis indicated the general classification of each variable, and the two GWR models indicated the more detailed spatial impacts of each variable across the census tracts. The results of each phase of the analysis are described in the following sections.
Multivariate Clustering
The results of the multivariate clustering analysis indicated a clear classification of the variables across two nearly contiguous clusters (Figure 4). The classification indicated that the most significant variables differentiating the two clusters were the percentage of non-Hispanic white residents, the percentage of Hispanic residents, the median income, and the percentage of residents with a bachelor’s degree. Figure 5 shows the classification of each variable in as a box and whisker plot. The clusters reflected several of the historical demographic divisions that exist in Austin, particularly with regard to the variables included in the model. The eastern part of the city tends to have higher percentages of residents who are Black and Hispanic, higher rates of poverty, and a younger population. An important result of the multivariate clustering analysis was the classification of the ridership change variable in the eastern cluster. Although Figure 5 indicates that the standardized value for the eastern cluster was only slightly higher than for the western cluster, the result indicated that ridership declined less in the eastern part of the city than in the west. This finding is reasonable as eastern neighborhoods in Austin are historically known as low- and middle-income communities with a large proportion of non-white inhabitants who are highly dependent on public transportation systems (34, 35). Another notable result of the analysis was the inclusion of the three census tracts containing the area within and around the University of Texas at Austin in the eastern cluster. This was likely to have been the result of the lower median age and income and the residents of these tracts, who are mostly students. However, these tracts differed from most others in the eastern cluster in that they experienced much more severe declines in transit ridership owing to how the university transitioned to a mostly online format throughout the pandemic period. The clustering analysis probably included these tracts in Cluster 2 because of their demographic similarities, despite the differences in the level of ridership change.
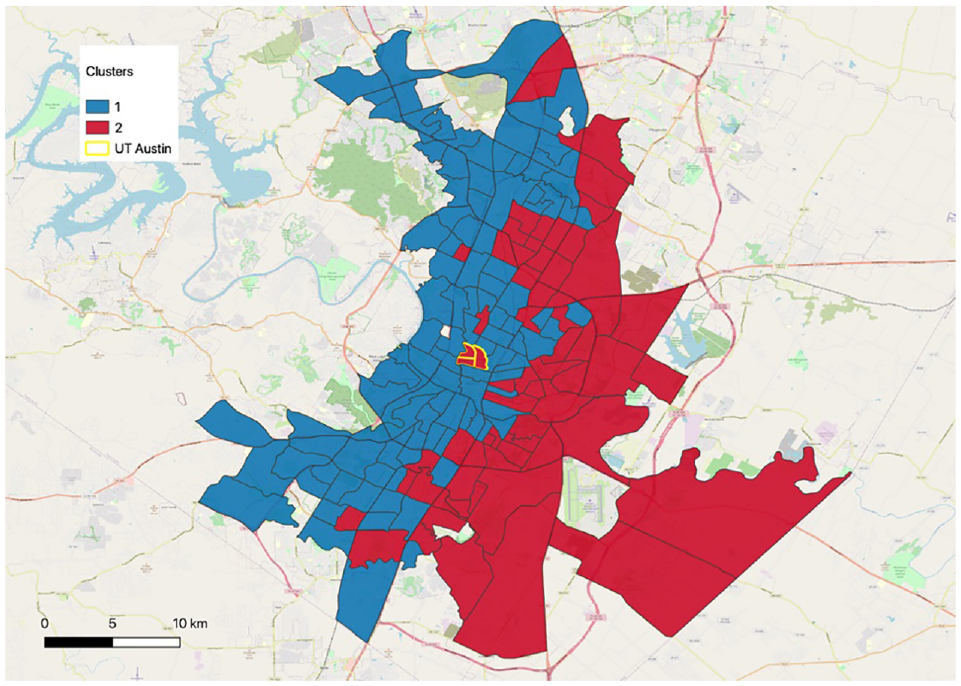
Multivariate clustering results.
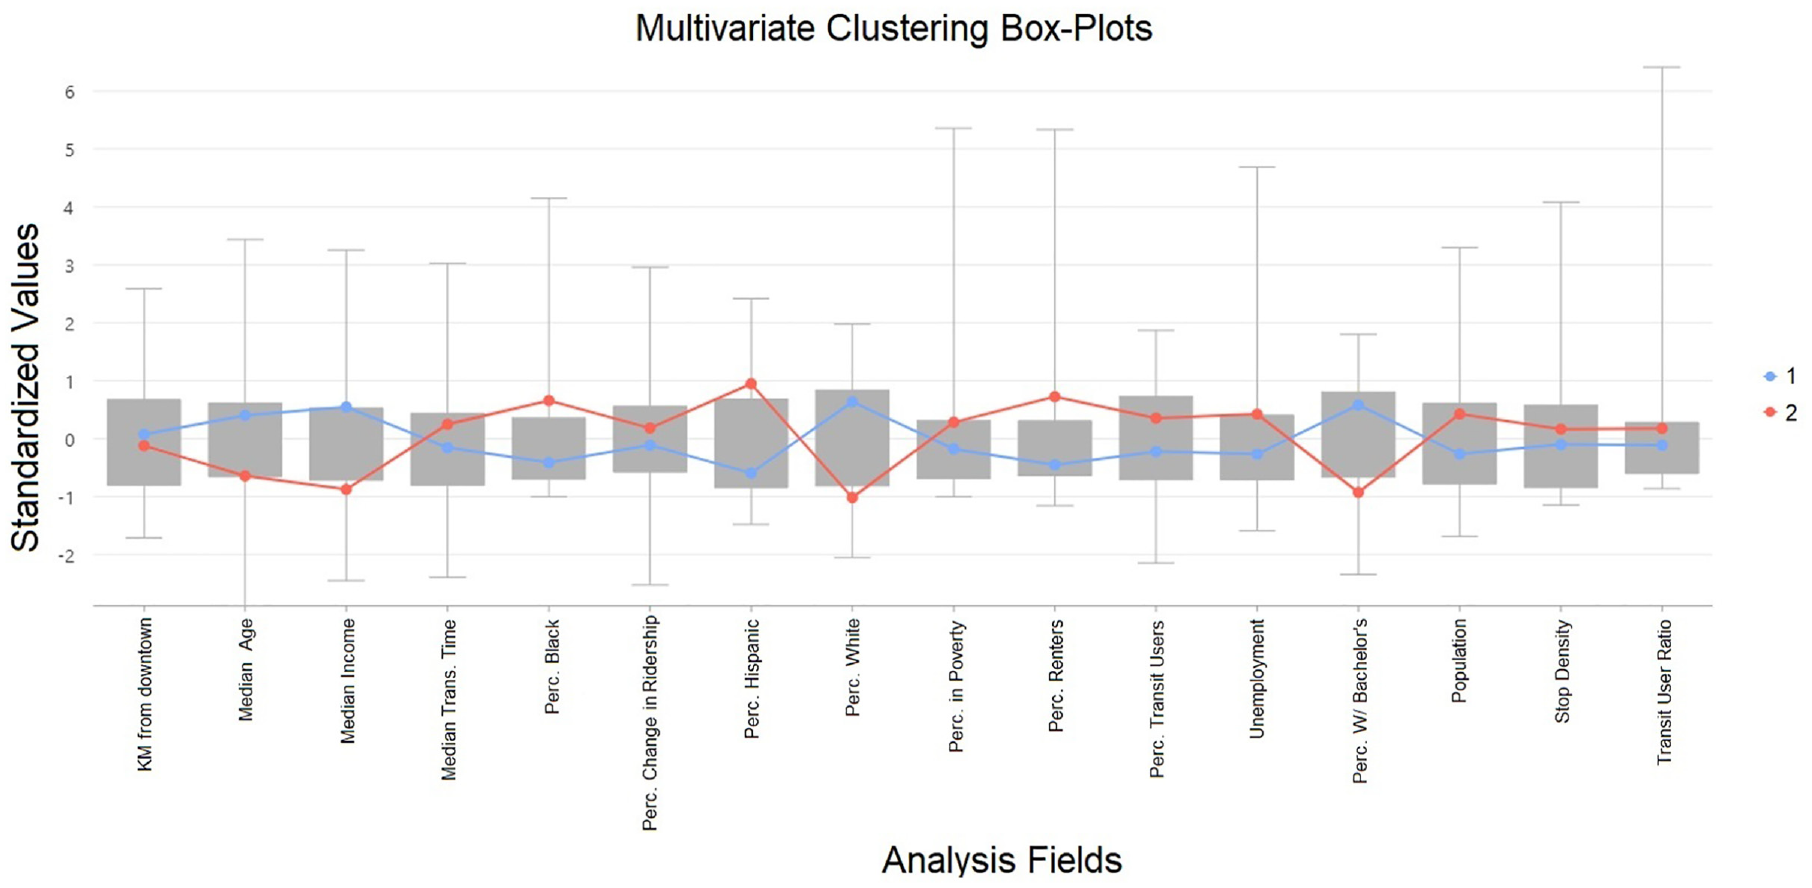
Variable classification plot.
GWR
Running the two GWR models on the dataset produced results that indicated a distribution of the impact of each variable across the study area. The first model, which included the percent non-Hispanic white variable and excluded the percent Hispanic variable, had a Akaike information criterion (AIC) value of −116.7484, whereas the second model, which excluded the non-Hispanic white variable and the percent Hispanic variable, had an AIC value of −117.0446, indicating that the second model performed slightly better than the first. Both GWR models had AIC values of −122.748 and −123.101, respectively. In addition, the R2 values for the two GWR models were 0.2073 and 0.2063, respectively. The local R2 values also varied across space in these models as seen in Appendix I and Appendix II (Figure A1, Figure A2). Among the variables included in both models, population, median income, median transportation time, distance from downtown, and stop density each had little effect on the percent change in ridership across all or most of the study area.
The results of both GWR models indicated that several variables had impacts on the percent change in ridership to varying degrees across the Austin area. Appendix I contains maps of the coefficients of the most impactful variables in Model 1 across all census tracts (Figure A1) and Appendix II contains maps of the coefficients in Model 2 (Figure A2). Table 4 contains descriptive statistics for the coefficients across all tracts for both GWR models. For both models, the median age of a tract was positively correlated with ridership, particularly in the southeastern part of the city, although this variable did not have a large impact. The percentage of Black residents was correlated strongly with higher ridership toward the southeast of the city in the second model, whereas the first model showed a slight negative correlation in the south. In both models, this variable was negatively correlated with ridership in the north, although the second model indicated a much lower negative correlation in this area. Model 2 indicated that the percentage of Hispanic residents was strongly correlated with higher ridership across the whole city although particularly in the center. The first model indicated that the percentage of white residents had a strong negative correlation across the entire city, with the strongest impact in the center and east. These findings were in line with those of Brown who reported that white residents are more likely to work remotely compared with non-white residents ( 36 ). Additionally, the concentration of businesses in central Austin (e.g., downtown area) and well as the change in transit service operations (e.g., increasing the bus frequencies) are potential reasons for the increase in transit ridership among Hispanic residents.
GWR Coefficients
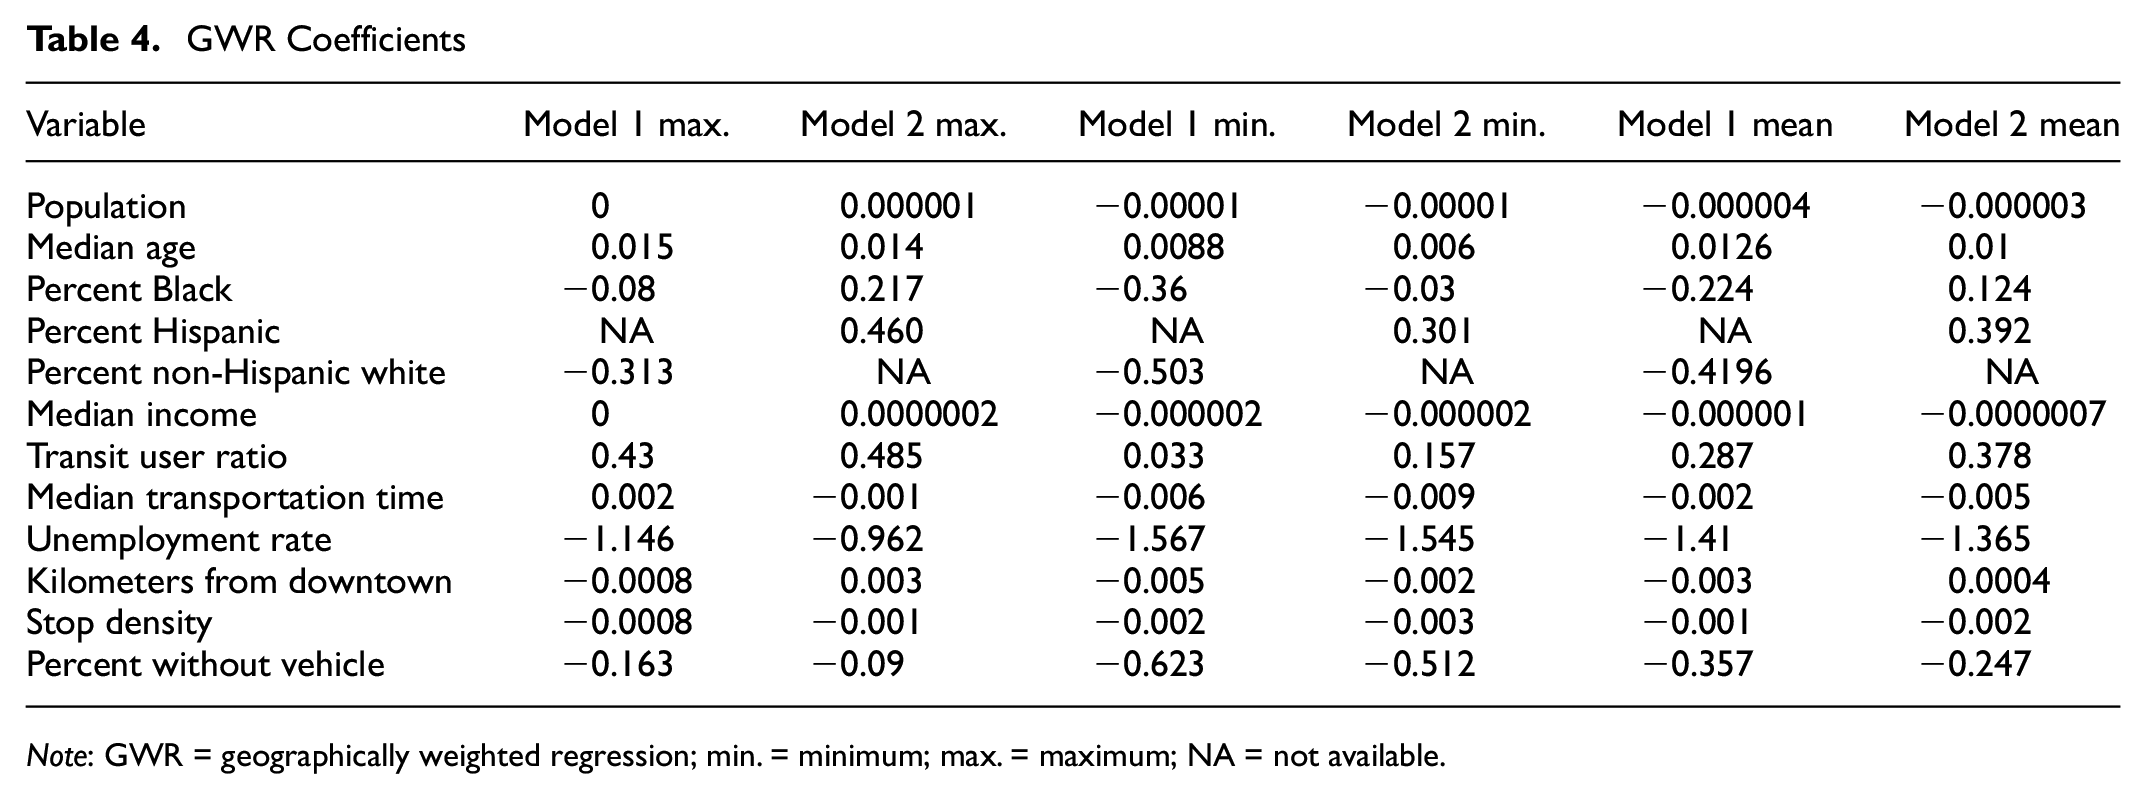
Note: GWR = geographically weighted regression; min. = minimum; max. = maximum; NA = not available.
Both models demonstrated that the ratio of transit users had a strong positive correlation with ridership, especially in the southern portion of the city. Both models indicated that the unemployment rate was very strongly correlated with lower ridership, particularly in the city center and in the southwest, which was consistent with the findings of Azimian and Jiao ( 37 ). Finally, the percentage of residents without a vehicle was negatively correlated with ridership declines across much of the city in both models, particularly in the north.
The spatial distributions of the percent non-Hispanic white variable in the first model and the percent Hispanic variable in the second model were very similar, although their coefficients indicated opposite trends. This suggests that the two variables had opposite effects in the same areas of the city, a result that is potentially related to the spatial separation of these populations within Austin. The results of both models indicated that differences in the declines in transit ridership during the pandemic were explained by different variables in various parts of the Austin area. Lower levels of decline in ridership relative to the rest of the city seemed to be related to the percentage of Black residents as well as to the median age for tracts in the southern part of the city, indicating that in these areas older residents as well as Black residents continued to rely on public transit throughout the pandemic, although higher levels of unemployment also seemed to be related to higher declines in ridership in this area. This finding can be justified by the way the COVID-19 outbreak altered nonwork activities (e.g., shopping behaviors) in unemployed individuals who tended use public transportation before the pandemic.
Discussion
Analysis of the effects of various spatial and demographic variables on changes to public transportation ridership in Austin, TX before and after March 2020 provided important insights into the ways the COVID-19 pandemic has upended normal patterns of transportation. All three analysis methods used highlighted the unevenness of the level of ridership decline. While transit ridership decreased across the city, certain areas saw dramatic drop-offs that were not seen in other areas. Among the methods used, each provided useful insights as well as certain limitations.
The multivariate clustering analysis proved to be an effective means of determining the general relationships between the variables in the study, including the dependent variable. It demonstrated that the impact of the level of ridership change was associated with the demographic divide that exists in Austin, with poorer residents and people of color clustered in the east and white and affluent residents clustered in the west. This portion of the analysis was important in understanding whether spatial disparities in transit ridership change might exist and what demographic and physical characteristics might be associated with these differences. Beyond this association, the multivariate clustering model was limited in that it did not describe the impact or significance of the variables and how they varied across the city.
The GWR models provided the most detailed analysis by shedding light on the differing impacts of the variables across all the census tracts. These models were particularly important in revealing how the pandemic has affected Austin’s transit system unevenly. The results showed that the spatial heterogeneity in the level of change in transit ridership can be explained to some extent by some of the variables in each model. In addition, the percentage of residents who are Black and the ratio of residents who are transit users were associated with less declines in ridership in the south and southeast of Austin, although the variance of these variables across the study area was greater and the first model indicated a negative correlation across most areas for the percentage of Black residents variable. The coefficients for the percentage of Black residents ranged from −0.03 in the north to 0.217 in the southeast for the second GWR model, and coefficients for the ratio of transit users ranged from 0.157 in the north to 0.485 in the south for the same model. These findings also confirmed the broader trend across the United States indicated in research by Liu et al. that higher percentages of Black residents tend to be associated with higher ridership than other groups during the pandemic, indicating continued demand for transit among this population in Austin and nationally ( 21 ). The greatest limitation of the GWR method in this study was the limited number of observations included. A more detailed level of observation would have provided more meaningful and detailed GWR results owing to the level of granularity in the ridership dataset, although the demographic data were most easily accessible at the census tract level.
The interesting results of GWR models are the effect of the median income variable and the percentage of residents without a vehicle variable. Median income appeared to have a very minimal and insignificant effect on the change in ridership. Although the reason for this was not clear, it is possible that this was because higher-income areas already had lower transit usage before the pandemic, so the ridership change was not as pronounced. The percentage of residents without a vehicle was unexpectedly correlated with less of a decline in ridership change.
When taken together, the results of the three methods of analysis used in this study clearly indicated that the extent to which ridership declined during the pandemic in Austin differed by neighborhood and was related to the demographics of each area. The use of three distinct methods in the study provides some perspective and dimension to the data that provides to policy makers various levels of precision when considering the influence of various factors on transit ridership during the pandemic. The overall trend was that ridership declined more severely in the western part of the city, where a larger share of the population is non-Hispanic white, and declined less severely in the east, where a higher proportion of the city’s Black and Hispanic populations live. This reflects the reality that people of color have historically been more dependent on transit and are employed as essential workers at higher rates. In addition to these demographic factors, areas with older populations and higher numbers of transit users before the pandemic also had a positive correlation with ridership change. Although the race and ethnicity variables as well as the unemployment variable were consistent with the initial hypothesis, the median age was in fact associated with less of a decline in ridership than expected, despite the increased risk of severe outcomes from COVID-19 infection.
Research Implications
The findings of this study have numerous implications for transportation planning and policy decisions as we enter the next phase of the COVID-19 pandemic and beyond. The disruption caused by the pandemic has uncovered and emphasized many of the disparities that exist in systems in our society, including our transportation systems.
As cities and transit agencies take steps to recover from lost ridership, attention will need to be paid to the areas where transit ridership has declined the least. Decisions related to budget shortfalls which may result in cuts to service should take into account the populations that are most likely to continue using transit services even when there are severe disruptions. Being conscious of these areas is also important as transit authorities make decisions about where to improve and expand service, as the impacts of the pandemic and the disparities evident from the results of this and other studies indicate that transit-dependent populations stand to benefit from increased access to transit.
A possible response to the evident disparities in transit usage change during the pandemic could be an increase in outreach and service to particular communities that have demonstrated continued demand for transit service throughout the pandemic period. An increase in stops and routes are likely to be needed, especially as demand increases across the city in the future. Increased outreach and communication could also support marginalized communities who rely on transit by ensuring planning decisions that ensure safety and high-quality service.
In addition to these considerations, the results of this study have implications for policy and political decisions about transit. If governments and policy makers hope to make funding- and planning decisions about transit systems that promote equity, special emphasis should be given to the areas and populations that rely on essential transit infrastructure. Providing extra support to transit systems in areas of cities with older populations, higher proportions of transit users, and areas with higher concentrations of people of color will be critical to ensuring transit equity.
For example, further support could be provided to ensure safe transportation options in the context of COVID-19 for the areas and populations that are shown to be reliant on transit systems. This support may translate to increased bus frequency in response to demand and the need for sufficient space for social distancing. Another solution may be providing and promoting other transportation modes, such as walking, cycling, and micromobility, to improve access to transportation in transit-dependent areas.
Conclusions
The ongoing pandemic has represented a significant challenge to transportation systems at all levels, from transit users to planners to agencies. Understanding the scope, extent, and details of these impacts may prove beneficial in understanding how to recover from lost ridership as well as how to plan for future catastrophic events.
The results of this study provide some insights into how the disruptions of the pandemic affected ridership levels in Austin, TX and where continued service has remained important. These findings contribute not only to the work of city officials and transportation planners in Austin but may also be useful to policy makers in cities across the United States, as the disparities that emerged in transit use during the pandemic are likely to be reflected at a national scale. As budget shortfalls, service cuts, and transportation aid are being considered, policy makers could benefit from an understanding of who continues to depend on transit access and where within cities increased investment in public transportation remains vital.
Research could go further to study the impacts of the COVID-19 pandemic on cities and transit systems. While this study considered a single city, future researchers may choose to explore how the distribution of ridership change was similar or different in cities within the same region or across the country. The impact of spatial segregation could also be examined more closely, as the results from Austin indicate that ridership patterns were associated with this phenomenon. Finally, further research could explore the impacts of a wider range of variables on ridership or focus on more granular units of observation, perhaps census block groups or even transit stop level analyses. This would build on the findings of this study, as the aggregation of demographics to the census tract level may have obscured the mobility patterns of lower-income groups living within generally higher-income tracts or vice versa. Future research may also go further to explore this topic by taking into account trip purpose and destination, as this study effectively only considered one end of transit trips rather than how trip destinations may have been afffected in spatially different ways by the pandemic.
As we begin to assess the effects of the pandemic on our lives and infrastructure, detailed information about these impacts and their causes will be essential for ensuring an equitable and robust recovery.
Supplemental Material
sj-docx-1-trr-10.1177_03611981231159906 – Supplemental material for Disparities in the Impacts of the COVID-19 Pandemic on Public Transit Ridership in Austin, Texas, U.S.A
Supplemental material, sj-docx-1-trr-10.1177_03611981231159906 for Disparities in the Impacts of the COVID-19 Pandemic on Public Transit Ridership in Austin, Texas, U.S.A by Junfeng Jiao, Kent Hansen and Amin Azimian in Transportation Research Record
Footnotes
Author Contributions
The authors confirm contribution to the paper as follows: study conception and design: K. Hansen, A. Azimian; data collection: K. Hansen; analysis and interpretation of results: K. Hansen, A. Azimian; draft manuscript preparation: K. Hansen, A. Azimian, J. Jiao. All authors reviewed the results and approved the final version of the manuscript.
Declaration of Conflicting Interests
The authors declared no potential conflicts of interest with respect to the research, authorship, and/or publication of this article.
Funding
The authors disclosed receipt of the following financial support for the research, authorship, and/or publication of this article: This project was supported by the Good System Grand Challenge and the Cooperative Mobility for Competitive Megaregions (CM2) center both at the University of Texas at Austin.
Supplemental Material
Supplemental material for this article is available online.
References
Supplementary Material
Please find the following supplemental material available below.
For Open Access articles published under a Creative Commons License, all supplemental material carries the same license as the article it is associated with.
For non-Open Access articles published, all supplemental material carries a non-exclusive license, and permission requests for re-use of supplemental material or any part of supplemental material shall be sent directly to the copyright owner as specified in the copyright notice associated with the article.