
Abstract
The COVID-19 pandemic forced transit agencies to quickly adapt to new challenges, with service reductions as part of the response to reduced ridership, rising fiscal pressures, and staffing shortages. However, approaches to service adjustment varied significantly across agencies. While pandemic literature often focuses on ridership impacts, less attention has been given to how transit service changes affect accessibility and equity. This study addresses this gap by examining the impacts of pandemic service adjustments on accessibility and equity; it is important to address this, given the absence of formal requirements for equity evaluation of temporary service changes. The analysis explored spatiotemporal patterns in service adjustment and evaluated the equity impacts on job accessibility for three major San Francisco Bay Area transit agencies in the U.S. Using publicly available transit schedule and census data, metrics for transit service levels, job accessibility, and accessibility inequality were used to trace changes from 2020 to 2023. The findings reveal distinct approaches to service reduction and restoration, with agencies prioritizing service differently based on travel needs and racial/ethnic minority populations. While equity briefly improved for some agencies during the pandemic, these changes were temporary, with all agencies returning to their pre-pandemic states of inequity. These insights can guide transit agencies in developing equitable service adjustment strategies and highlight the need for decision-making tools to help transit operators balance competing needs and respond flexibly to disruptions.
The COVID-19 pandemic brought significant disruptions to the U.S. public transit industry, forcing transit agencies to balance safety and mobility amidst great uncertainty. Transit agencies were required to take swift action on various fronts, including implementing public health and safety measures, avoiding workforce layoffs, and dealing with a widening budget gap brought about by escalating operating expenses and plummeting ridership revenue ( 1 – 5 ). Many agencies reduced services in response to decreased ridership, fiscal pressures, and staffing shortages. In March, 2020, 74% of surveyed transit agencies anticipated cutting service because of challenges imposed by the pandemic ( 6 ). By mid-2021, almost 90% of transit agencies in the U.S. had reduced service levels to some degree ( 3 ). However, the approaches to service adjustments and the extent to which equity considerations were integrated into decision-making varied significantly across agencies ( 1 , 7 , 8 ).
Moreover, the pandemic underscored transit’s role as a critical social service, providing access to essential destinations such as healthcare, grocery stores, and jobs ( 5 , 7 , 9 – 11 ). Historically, transit ridership has been disproportionately composed of lower-income individuals, minority groups, and households without vehicle access ( 12 , 13 ). Studies on transit demand during the pandemic have found that travel declined less for essential workers, lower-income populations, people of color, less-educated populations, and those with limited mobility options ( 2 , 9 – 11 , 14 – 16 ). This suggests that these groups continued to rely on transit throughout the pandemic, potentially exacerbating existing vulnerabilities ( 4 , 15 ). A survey of transit riders found that 49% of riders reported being affected by transit service cuts. However, lower-income riders had significantly smaller reductions in travel, indicating that these groups had less discretion over the amount of travel undertaken during the pandemic ( 16 ). While much of the pandemic literature focuses on impacts to ridership, limited attention has been given to transit supply and how changes to transit service may have affected levels of access.
Through Title VI of the Civil Rights Act of 1964 and Environmental Justice guidelines derived from Executive Order 12898 (which was effective from February 11, 1994, to January 21, 2025, and thus governed equity requirements for service changes throughout the study period) the FTA required transit agencies to undertake a service equity analysis for permanent transit service changes to determine whether they may result in disparate impacts on minority populations or disproportionate effects on low-income populations ( 17 , 18 ). However, under FTA Circular 4702.1B, temporary service changes (lasting less than 12 months) implemented during the pandemic were exempt ( 17 ). Given the lack of formal requirements for equity considerations for temporary service changes made during the pandemic and the potential for disproportionate impacts on vulnerable populations, it is important to undertake a retrospective analysis to understand what impacts these service adjustments may have had to inform future transit disruption management strategies.
This work builds on a previous study by the authors, which analyzed pandemic service adaptations and their impacts on job accessibility for the Bay Area Rapid Transit (BART) agency alone ( 19 ). The current analysis updates and extends the analysis framework to encompass multiple Bay Area transit agencies, allowing for comparative evaluation of service adjustment impacts. This paper contributes to the literature on pandemic transit service impacts by characterizing spatiotemporal patterns of service changes and evaluating equity impacts based on changes to job accessibility. We quantify and compare service changes implemented by three major transit operators in the San Francisco Bay Area: the Alameda-Contra Costa (AC) Transit district, the San Francisco BART district, and the San Francisco Municipal Transportation Agency (MUNI). Changes are traced across four distinct phases of the pandemic, from disruption to recovery, over a 3-year study period from 2020 to 2023. The findings reveal the three agencies had distinct approaches to service reduction and restoration, with uneven impacts across sociodemographic groups. Accessibility inequities did not significantly change, although there were some temporary improvements during the pandemic. Ultimately, this study adds to the discussion around how lessons learned from the pandemic could be used to develop equitable service adjustment strategies for future disruptions.
Literature Review
Table 1 presents an overview of the literature on the COVID-19 pandemic response of North American transit agencies. Transit agencies adapted quickly to pandemic challenges, employing a range of strategies to protect employees and riders. Health and safety were a top priority for agencies. Many agencies increased vehicle and facility cleaning, instated requirements for mask-wearing, implemented back-door boarding, implemented social distancing measures, and suspended fare collection ( 2 , 5 , 7 , 8 ). Service adjustments were also a common strategy, although the extent varied significantly across agencies. At the onset of the pandemic, some agencies implemented major service reductions, while others applied a combination of reductions and additions or intentionally sought to maintain service levels for essential workers ( 7 ). Bus agencies tended to adopt weekend schedules or suspend routes, while rail agencies modified existing schedules by changing operating hours and service frequencies ( 5 ). Some bus operators suspended school and express routes and adopted weekend schedules, while others added additional service to hospitals ( 2 ). Karner et al. found that the degree and duration of aggregate service reductions varied substantially. With the exception of the Chicago Transit Authority, all agencies in the study initially reduced their service levels to between 40%–80% of pre-pandemic levels ( 1 ). By early 2021, four out of the seven agencies were operating at near pre-pandemic levels, with the remaining agencies operating at 70%–80% of pre-pandemic service.
Overview of Existing Studies on North American Transit Agencies’ Pandemic Response
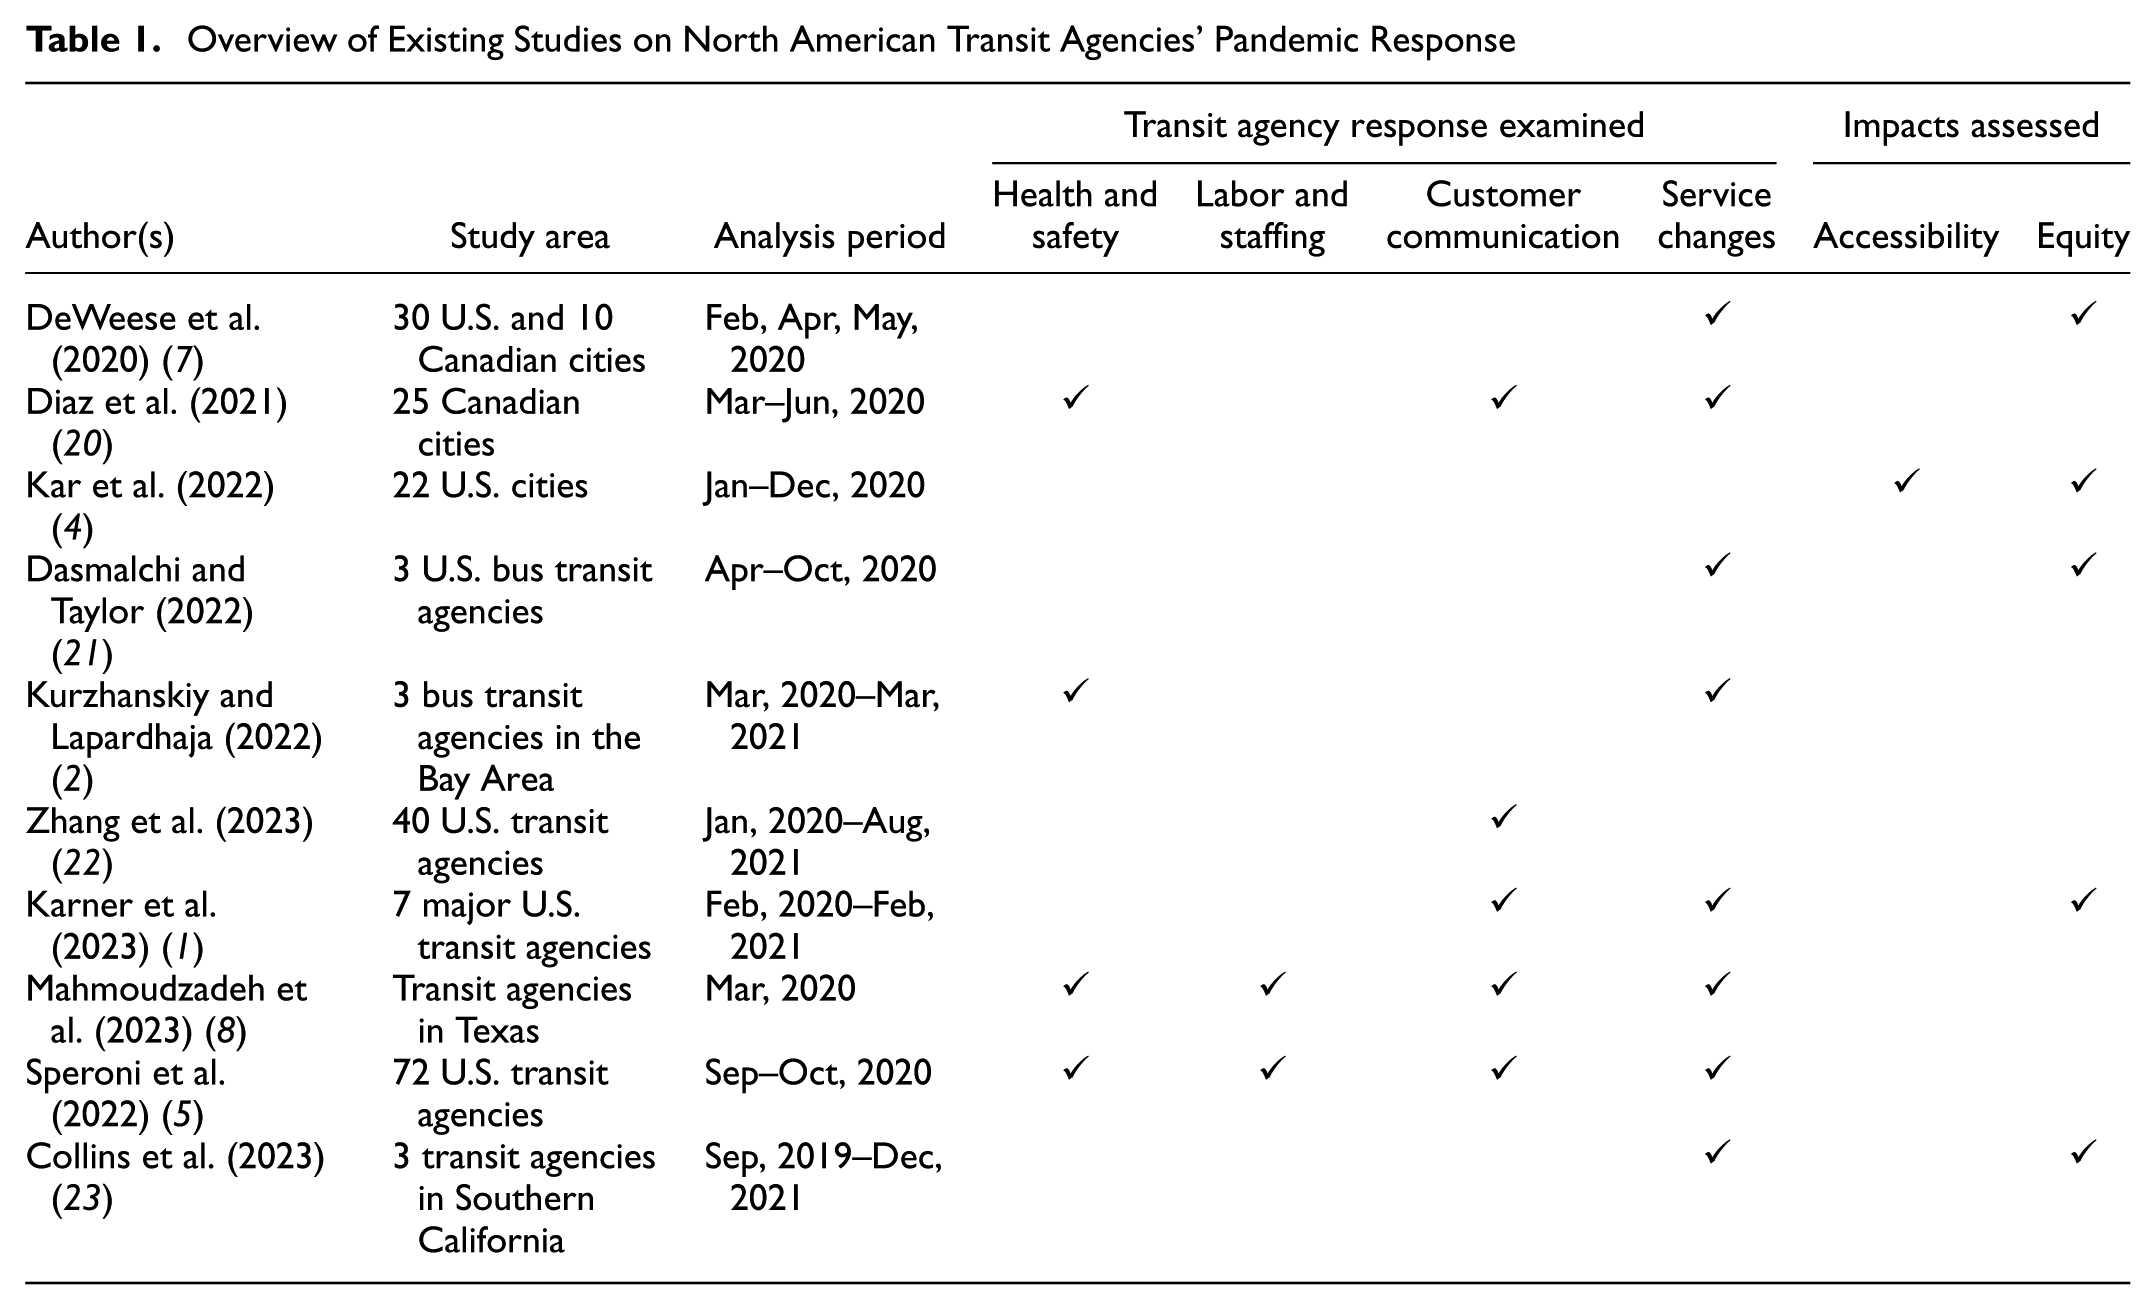
Few agencies had a pre-existing pandemic response plan. Speroni et al. found that only 15% of surveyed transit agencies had a plan, while Mahmoudzadeh et al. found that 35% of Texas agencies had a plan ( 5 , 8 ). Pre-existing plans were not always comprehensive, with some only covering aspects such as increased sanitization ( 5 ). Moreover, much of the guidance available “often focused single mindedly on mitigating viral transmission rather than maintaining access for essential riders” ( 1 ). In the absence of other guiding principles, many agencies used ridership data to inform service changes ( 5 ). Agencies had little guidance on how to adjust and prioritize service during the pandemic, particularly for vulnerable populations, underscoring the importance of retrospective analysis to prepare for future disruptions.
Some studies have begun to explore the equity impacts of pandemic transit service adjustments ( 1 , 4 , 7 ). At the onset of the pandemic, some agencies appeared to account for horizontal equity (distributing benefits based on need) by applying service reductions to a smaller extent in more vulnerable communities, while other agencies applied changes equally across income groups ( 7 ). On the other hand, while Karner et al. found that agencies varied in how they adjusted service, and that changes were comparable across race/ethnicity and income, with the relative ordering of groups consistent throughout the pandemic ( 1 ). Looking beyond the lockdown phases, one study found that bus service in the Inland Empire of Southern California returned to pre-pandemic levels, with levels of inequity reverting to existing levels ( 23 ). To the authors’ knowledge, only one study has looked at the impact of pandemic service adjustments on accessibility: Kar et al. found that pandemic transit service cuts worsened access to healthcare and groceries for communities across multiple social vulnerabilities, especially in areas with high poverty levels, low-income workers, zero-vehicle households, and Black residents ( 4 ). More investigation is needed to understand how equity of transit service adjustments evolved throughout, and beyond, the pandemic.
Most studies focus on the breadth of responses, whether that be examining the full spectrum of response strategies or covering a large geographical region. While this type of analysis is useful for quickly generating insights under rapidly evolving circumstances, specific details unique to each agency may be lost in aggregate analysis. In addition, many studies focus on the initial lockdown period of the pandemic. While some studies quantify aggregate transit service levels by measures such as service frequency, vehicle revenue hours, and functions of service area and available transit capacity, most studies do not report the magnitude of changes, instead focusing on high-level actions such as whether service was increased or decreased and often rely on self-reported survey responses from transit operators ( 1 , 5 , 7 , 8 , 21 , 23 ). Moreover, few studies examine both the accessibility and equity impacts of pandemic transit service changes. The study by Kar et al. quantifies impacts on access to healthcare and grocery stores but does not quantify changes to transit service ( 4 ). There is a lack of detailed case studies that examine specific service adjustment patterns throughout the pre-pandemic, lockdown, and post-pandemic phases, and the implications of these changes on both accessibility and equity.
Overall, more retrospective research is needed to understand how transit agencies responded throughout the pandemic by reducing and restoring services, and what the implications of these actions were. Our specific research questions (RQ) are:
RQ1: How did transit service levels vary spatiotemporally throughout the pandemic?
RQ2: How did changes in service levels vary by sociodemographic groups?
RQ3: What impact did changes in service levels have on job accessibility, and how did this vary by sociodemographic groups?
RQ4: How did the overall equity of transit service allocation change throughout the pandemic?
By addressing these RQs, our study contributes to the existing literature by focusing on detailed service adjustments and accessibility impacts through phases of service reduction and restoration. These findings can inform transit providers on developing equitable service allocation response strategies to better handle future pandemics or other disruptions.
Methods
To answer the RQs, this study employed transit service frequency, accessibility, and equity metrics to explore changes throughout and beyond the pandemic (Figure 1). Using publicly available census and transit schedule data, we examined spatiotemporal patterns in service adjustments, then calculated changes in job accessibility via transit.
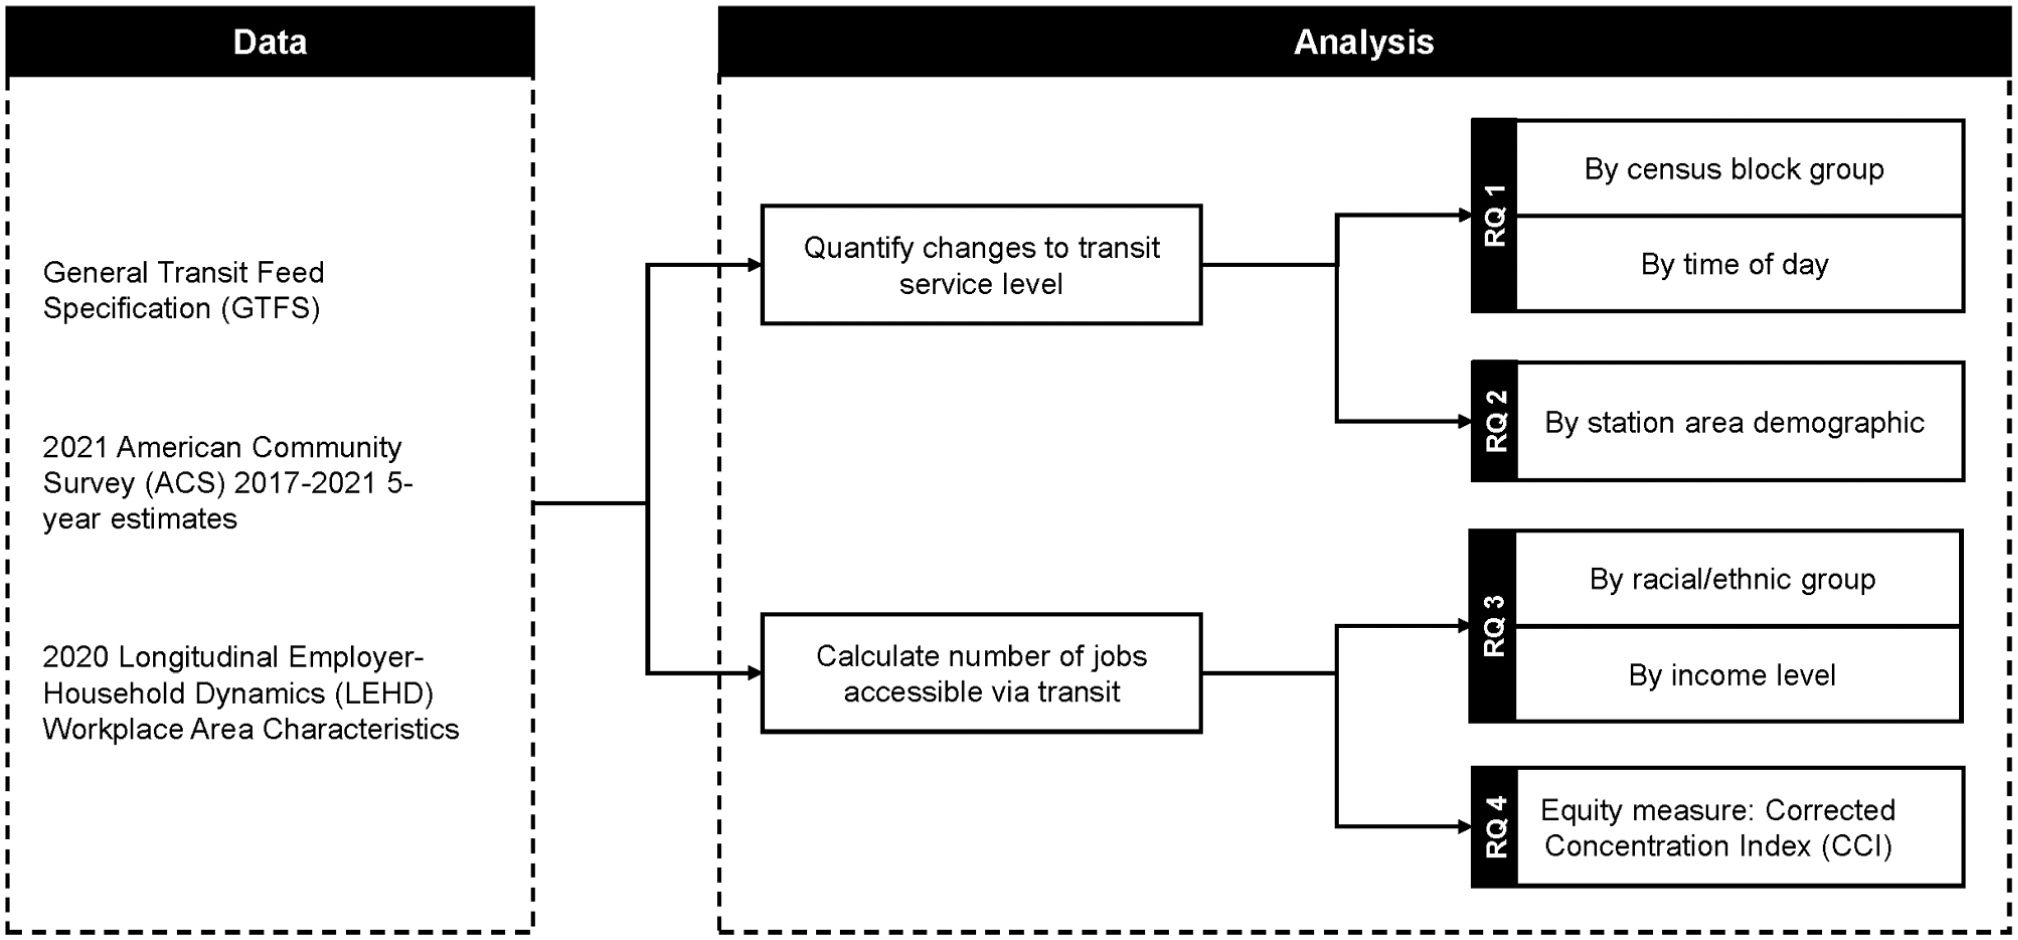
Overview of research process.
Study Area
This case study of the San Francisco Bay Area analyzed three major transit operators—AC Transit, BART, and MUNI—to explore their approaches to pandemic service adjustments. Together, these agencies account for approximately 80% of the region’s transit ridership, as measured by total unlinked passenger trips in 2022 ( 24 ). AC Transit primarily provides bus services, BART operates heavy rail, and MUNI offers a mix of bus, light rail, streetcar, and trolleybus services, with its bus service representing the largest portion of ridership. The geographic coverage for each agency is shown in Figure 2.
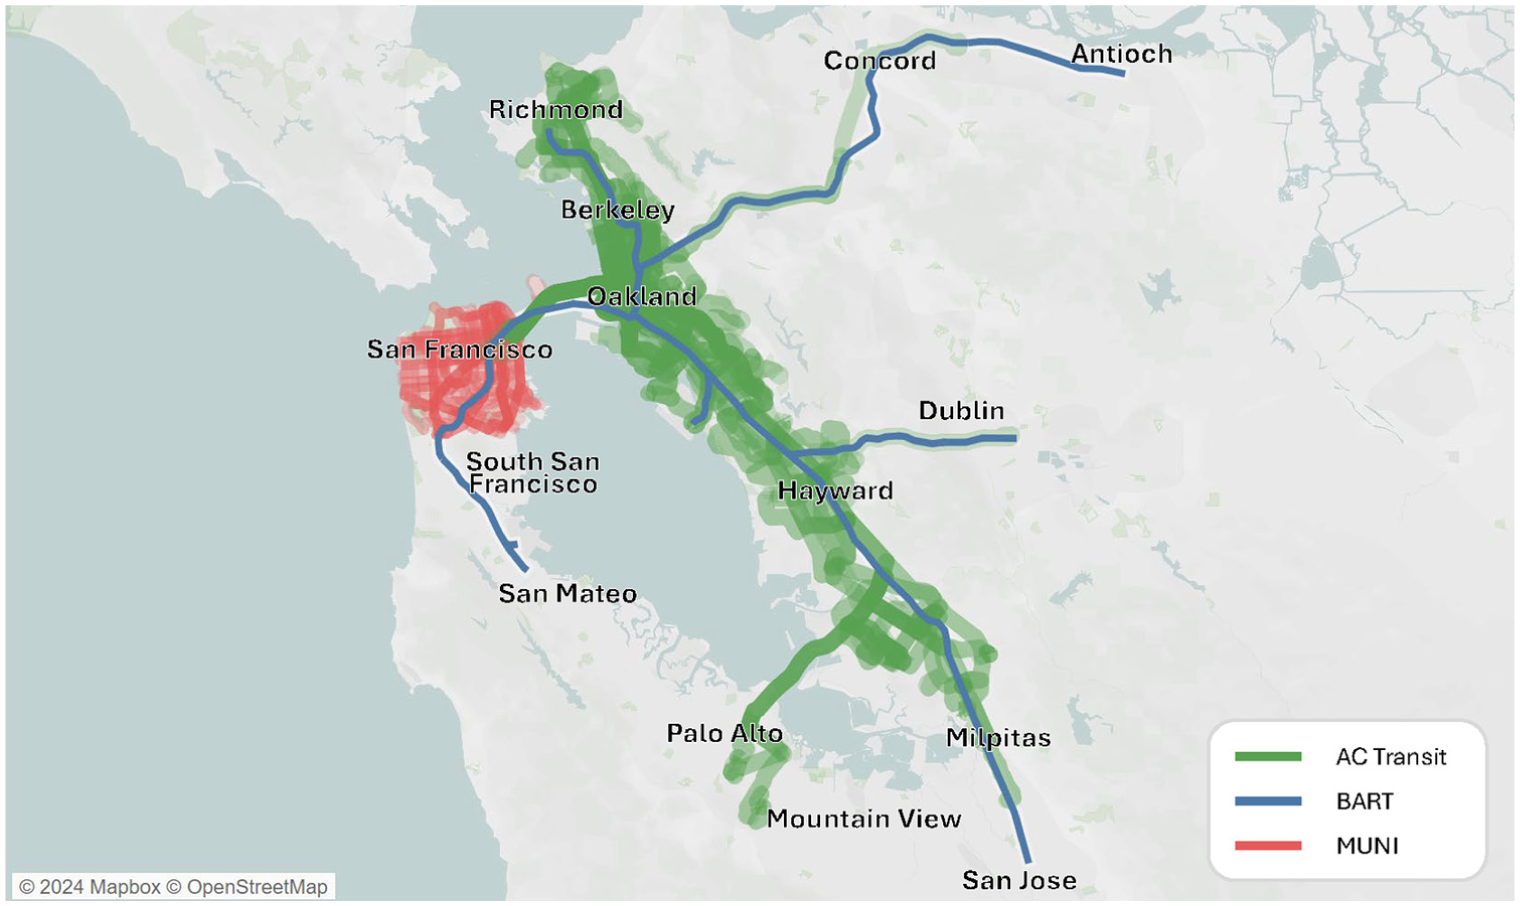
Geographic coverage of routes operated by Alameda-Contra Costa (AC) Transit, Bay Area Rapid Transit (BART), and San Francisco Municipal Transportation Agency (MUNI).
Historically, the Bay Area’s public transit systems have been built on a deeply racialized geography that has led to persistent inequities in service provision ( 25 ). BART was originally designed as a suburban commuter rail service, connecting wealthy suburbs to downtown San Francisco. On the other hand, AC Transit provided local bus services that largely benefited low-income communities of color, while MUNI’s diverse fleet connected San Francisco’s many neighborhoods to support a wide range of travel needs. Funding disparities have also shaped each agencies’ capacities: Golub et al. note that the majority (76%) of the sales tax revenues established under Assembly Bill 1107 in 1977 were allocated to BART, with the remainder distributed between other agencies including AC Transit and MUNI, despite AC Transit and MUNI having substantially higher ridership than BART at that time ( 25 ). The legacy of these transportation planning decisions has shaped each agency’s ridership composition, capacity to support various travel needs, and, potentially, pandemic responses and priorities.
To contextualize the analysis, we also describe more recent pre-pandemic ridership demographics for each agency using onboard customer survey reports from 2018 (AC Transit and BART) and 2016 (MUNI). Follow-up surveys conducted during and after the pandemic also provide insights into how ridership demographics evolved. While differences in survey years and methodologies may limit direct comparisons, these surveys provide a representative snapshot of pre-pandemic ridership for each agency. In 2018, AC Transit’s ridership was over 70% Black, Indigenous, and People of Color (BIPOC), predominantly low-income (median income of $35,000), and over 40% of riders lacked access to a vehicle ( 26 ). Pre-pandemic ridership on BART and MUNI largely mirrored the diversity of the region (65% and 57% BIPOC, respectively). However, compared with AC Transit, both agencies had a much smaller proportion of lower-income riders, with 26% of BART riders and 30% of MUNI riders earning under $50,000 per year ( 27 – 29 ). Throughout the pandemic, all three agencies continued to serve majority BIPOC ridership, with survey data suggesting that the proportion of low-income and BIPOC riders grew for both BART and MUNI, aligning with existing research indicating that vulnerable populations continued to rely on transit throughout the pandemic ( 2 , 9 – 11 , 14 – 16 , 27 , 28 ). These pre-pandemic distinctions provide a baseline for understanding how the pandemic’s service changes may have disproportionately affected different rider groups, as explored in RQ2 and RQ4.
Static transit schedules from the General Transit Feed Specification (GTFS) were used to quantify service changes implemented by agencies during the COVID-19 pandemic ( 30 ). Four key phases of disruption, recovery, and restoration between 2020 and 2023 were identified:
Phase 1: Pre-pandemic service levels (latest available feed before March, 2020)
Phase 2: Initial service reductions at the onset of the pandemic (selecting the feed with the lowest daily service hours between April and June, 2020)
Phase 3: Midpoint during the pandemic indicating intermediate service restoration (latest available feed from late September or early October, 2021)
Phase 4: Current service levels (latest available feed from December, 2023)
One GTFS date was selected to represent each phase for each agency based on the criteria described above, though it was not always possible to select the same date across all three agencies because of data availability. Figure 3 shows the four phases in relation to the number of weekly COVID-19 cases in California. The length of each phase denotes the range of GTFS dates used (e.g., for Phase 1, the latest available feed before March 2020 was August 9, 2019, for AC Transit, and February 18, 2020, for BART and MUNI).
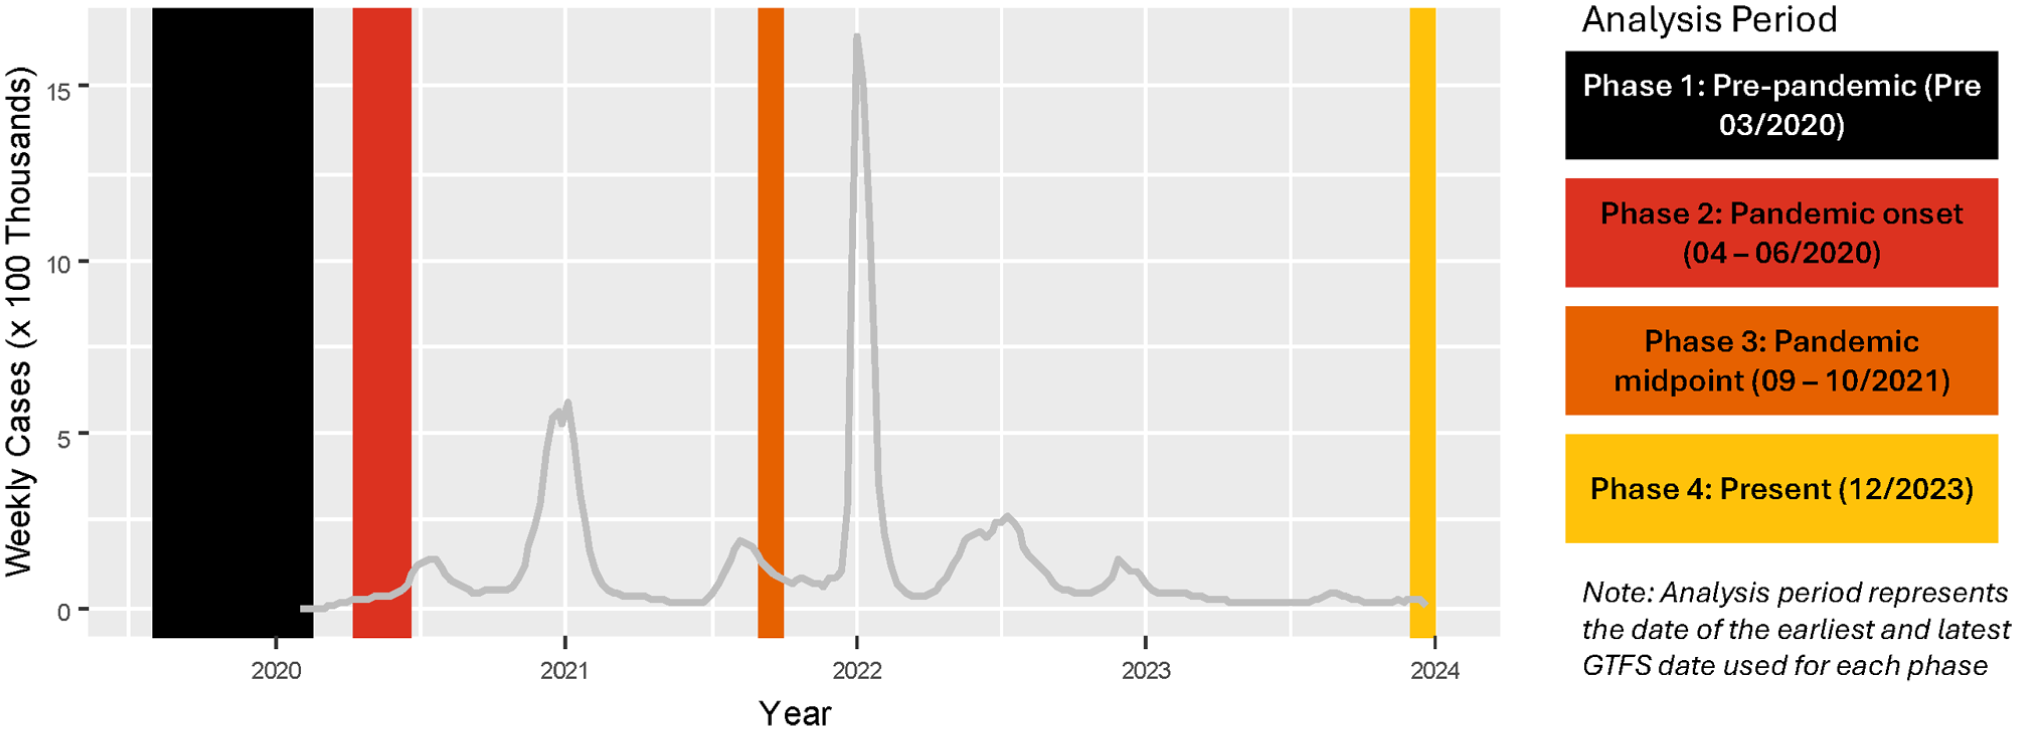
Weekly COVID-19 cases in California and key phases of study.
Quantifying Transit Service Changes
Average service frequency was used to represent transit service levels at the census block group level. To calculate this metric, transit stops located within ¼ mi of the block group boundary were identified. This distance, representing the lower bound of typical walking distances to transit (¼ to ½ mi), was chosen to capture the changes in service levels experienced by each block group while minimizing potential overlap with adjacent areas ( 31 ). A fixed ¼ mi walkshed was chosen to enable comparisons across operators and to avoid double-counting in higher density areas such as downtown San Francisco where MUNI operates. However, we acknowledge that this approach may underestimate coverage for some groups, particularly riders who are willing to walk longer distances for higher frequency services, and suburban corridors that have a high proportion of park-and-ride users (e.g., BART). Future work should revise the walkshed assumption to reflect these behavioral differences unique to each operator and geography. GTFS data was used to calculate the total number of unique trips servicing these stops on a typical Wednesday. This total was then divided by 24 h to obtain the average service frequency, which was used to calculate the percentage change in service levels between each phase. Spatial distributions of changes in service levels were plotted for visual inspection, while temporal patterns were analyzed by calculating the total number of unique trips in the system for each hour of the day.
To compare how service changes varied by sociodemographic, the percentage change in service levels was linked to sociodemographic characteristics of each block group using data from the 2021 American Community Survey (ACS) 2017–2021 5-year estimates. The magnitude of service reduction/restoration was categorized into bins based on quartiles, rounded to the nearest 10%. Each bin was summarized by the sociodemographic characteristics of the block groups, including commute mode, race, ethnicity, zero-vehicle households, and low-income households. Low-income households were identified as those with an income-to-poverty level ratio less than 200% of the Federal Poverty Level. Weighted two-sided t-tests were used to determine if the bin averages were statistically different from the overall average.
Job Accessibility Analysis
To address RQ3, job accessibility via each transit system was calculated for 7–8 a.m. for a typical weekday at each of the four phases. While there are limitations to isolating the impacts for each transit agency (since it does not account for network effects or the coordination across agencies), this analysis provides initial estimates for impacts to accessibility specifically resulting from service changes made by each agency, and enables direct comparison between agencies. Future work will use multimodal networks to better reflect realistic travel choices faced by riders in the Bay Area. A typical weekday was identified as a Wednesday with no special events and the highest number of services. Employment data was obtained from the 2020 Longitudinal Employer Household Dynamics (LEHD) Origin-Destination Employment Statistics Workplace Area Characteristics data set, which provides the number of jobs per census block. Estimates were calculated for census block groups whose centroids fell within the service catchment area, which was defined as the 15 min walking catchment around each transit stop. Given the heterogeneity of BART’s access mode choice across stations, future work should estimate accessibility for both walk and drive access to transit.
It is important to note that job accessibility was estimated using a single LEHD dataset, held constant throughout all analysis periods. This assumption was adopted to isolate the effects of transit services changes on accessibility. Therefore, the results should be interpreted as representing the impact of transit service adjustments to a fixed set of job opportunities, and do not reflect changes in the distribution of jobs that occurred during the pandemic. Future work aims to explore the combined effects of pandemic-induced changes in jobs and transit service.
Travel time matrices were generated using the R library r5r, and accessibility estimates were generated using the companion R library accessibility ( 32 , 33 ). Origin and destination centroids were weighted by population and number of workers, respectively. Based on a previous study showing that most pedestrians are willing to walk up to ½ mi to access stations and using the r5r default walking speed of 3.6 km/h (2.24 mph), a maximum walking time of 15 min was assumed for this analysis ( 34 ). This threshold represents an upper bound on the distances people are willing to walk to transit, capturing the maximum feasible reach of the system.
Accessibility was estimated using the interval-based cumulative opportunities measure, which counts the average number of opportunities that can be reached within a specified travel time interval. The advantage of this metric is that it produces more robust estimates compared with the standard threshold-based measure by considering multiple minute-by-minute cutoff thresholds ( 35 ). The average commute time via transit for the Bay Area in 2018 was 51.4 min ( 36 ). Based on this, an interval threshold of 40–60 min was selected. To address variation in departure times and service levels, travel times were calculated by generating a random departure time within each 1 min interval in the hour, taking the median travel time to calculate the final accessibility estimate ( 37 , 38 ).
Equations 1 and 2 were used to calculate the interval-based cumulative accessibility measure at the block group level. Accessibility for different sociodemographic groups was calculated by weighting estimates by the number of people/households and the proportion of area covered by the service catchment area, based on methods used in the accessibility and equity literature ( 39 , 40 ).

where

where
Changes in access were compared for household income levels and racial/ethnic groups using ACS data. Four income categories were defined using quartiles of the median household income for census block groups in the service catchment area, with thresholds at $8,667, $85,683, $118,083, $158,333, and $249,901.
Corrected Concentration Index (CCI)
The corrected concentration index (CCI), as described by Karner et al., was used to estimate accessibility inequality ( 41 ). The CCI uses the job accessibility estimates to quantify the inequities between different socioeconomic levels. Values range between −1 and 1, with 0 representing perfect equality with respect to socioeconomic position. The main advantage of the CCI, compared with other equity indices, is that it captures both the direction and magnitude of the relationship between accessibility inequalities and socioeconomic position: negative values indicate inequalities favoring lower-income groups, while positive values indicate those favoring higher-income groups. Unlike commonly used indices such as Lorenz curves and Gini coefficients, CCI accounts for socioeconomic ordering, providing a clearer understanding of which groups disproportionately benefit or suffer from transit service changes. The CCI was calculated using Equations 3 and 4:


where
ai = the accessibility for block group
In this analysis, median household income was used for the socioeconomic rank.
Results and Discussion
Spatiotemporal Patterns of Transit Service Adjustments
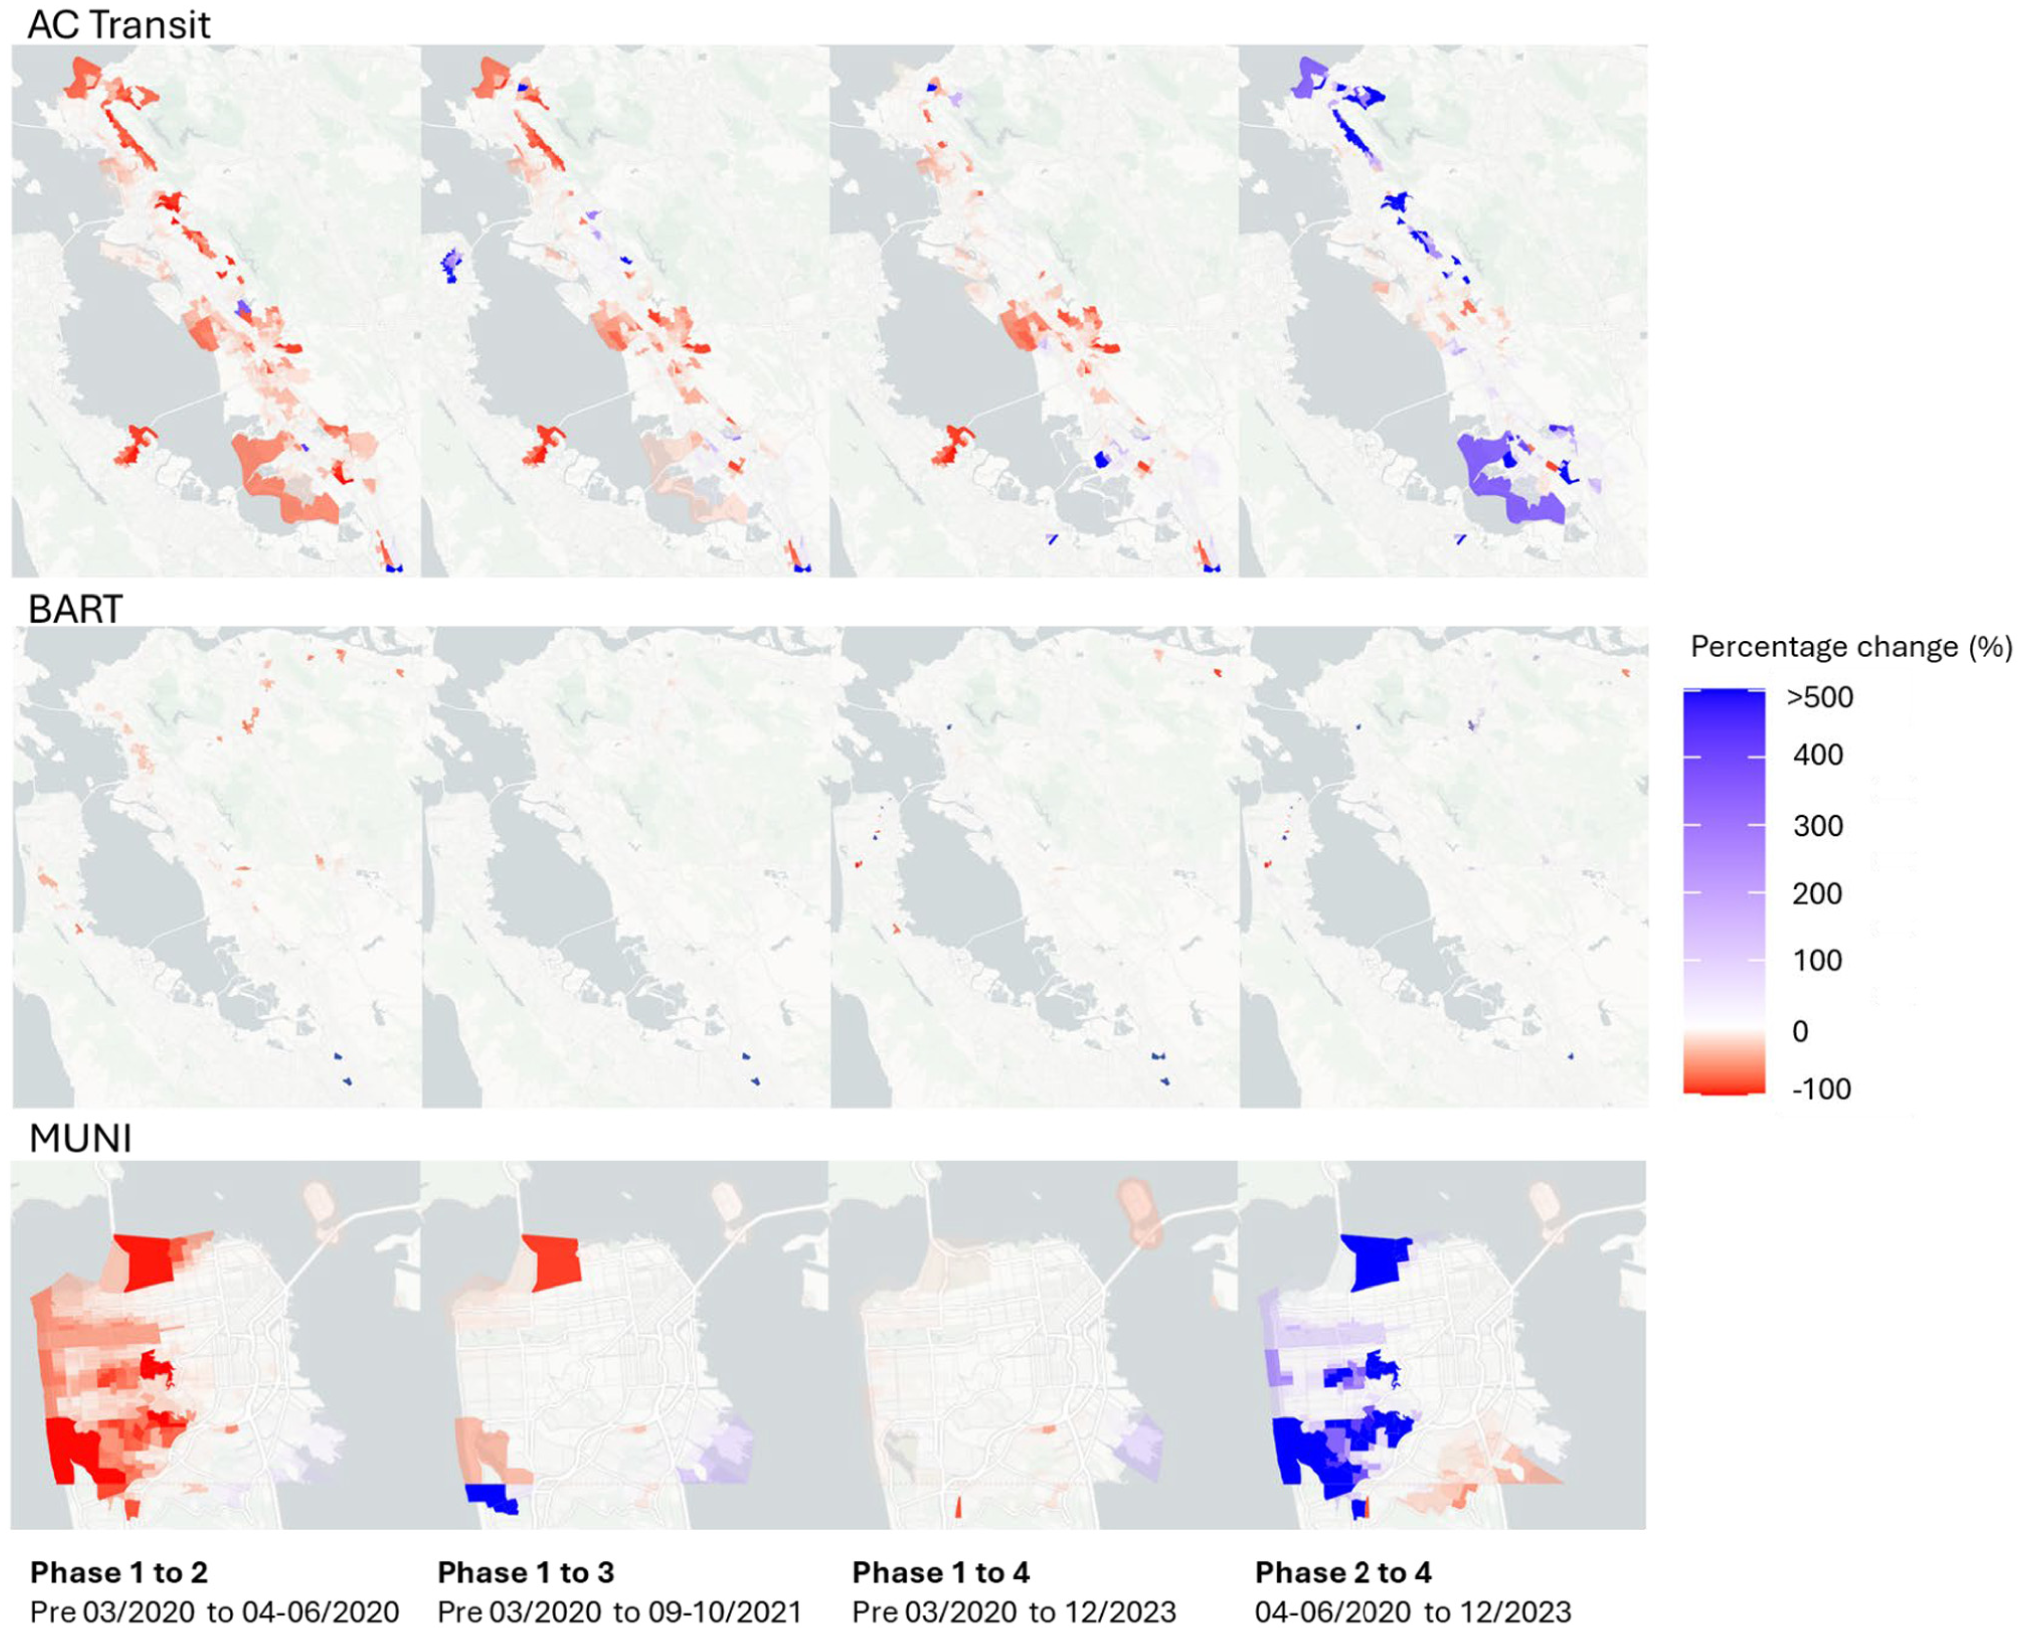
Figure 4 illustrates the geographic distribution of changes in average weekday service levels across the four phases of the pandemic for the three major transit agencies in this study. The first three plots for each agency depict changes in the magnitude of transit service for each block group relative to pre-pandemic levels, while the final plot shows the changes from the onset of the pandemic to current service levels, highlighting the extent of service restoration.
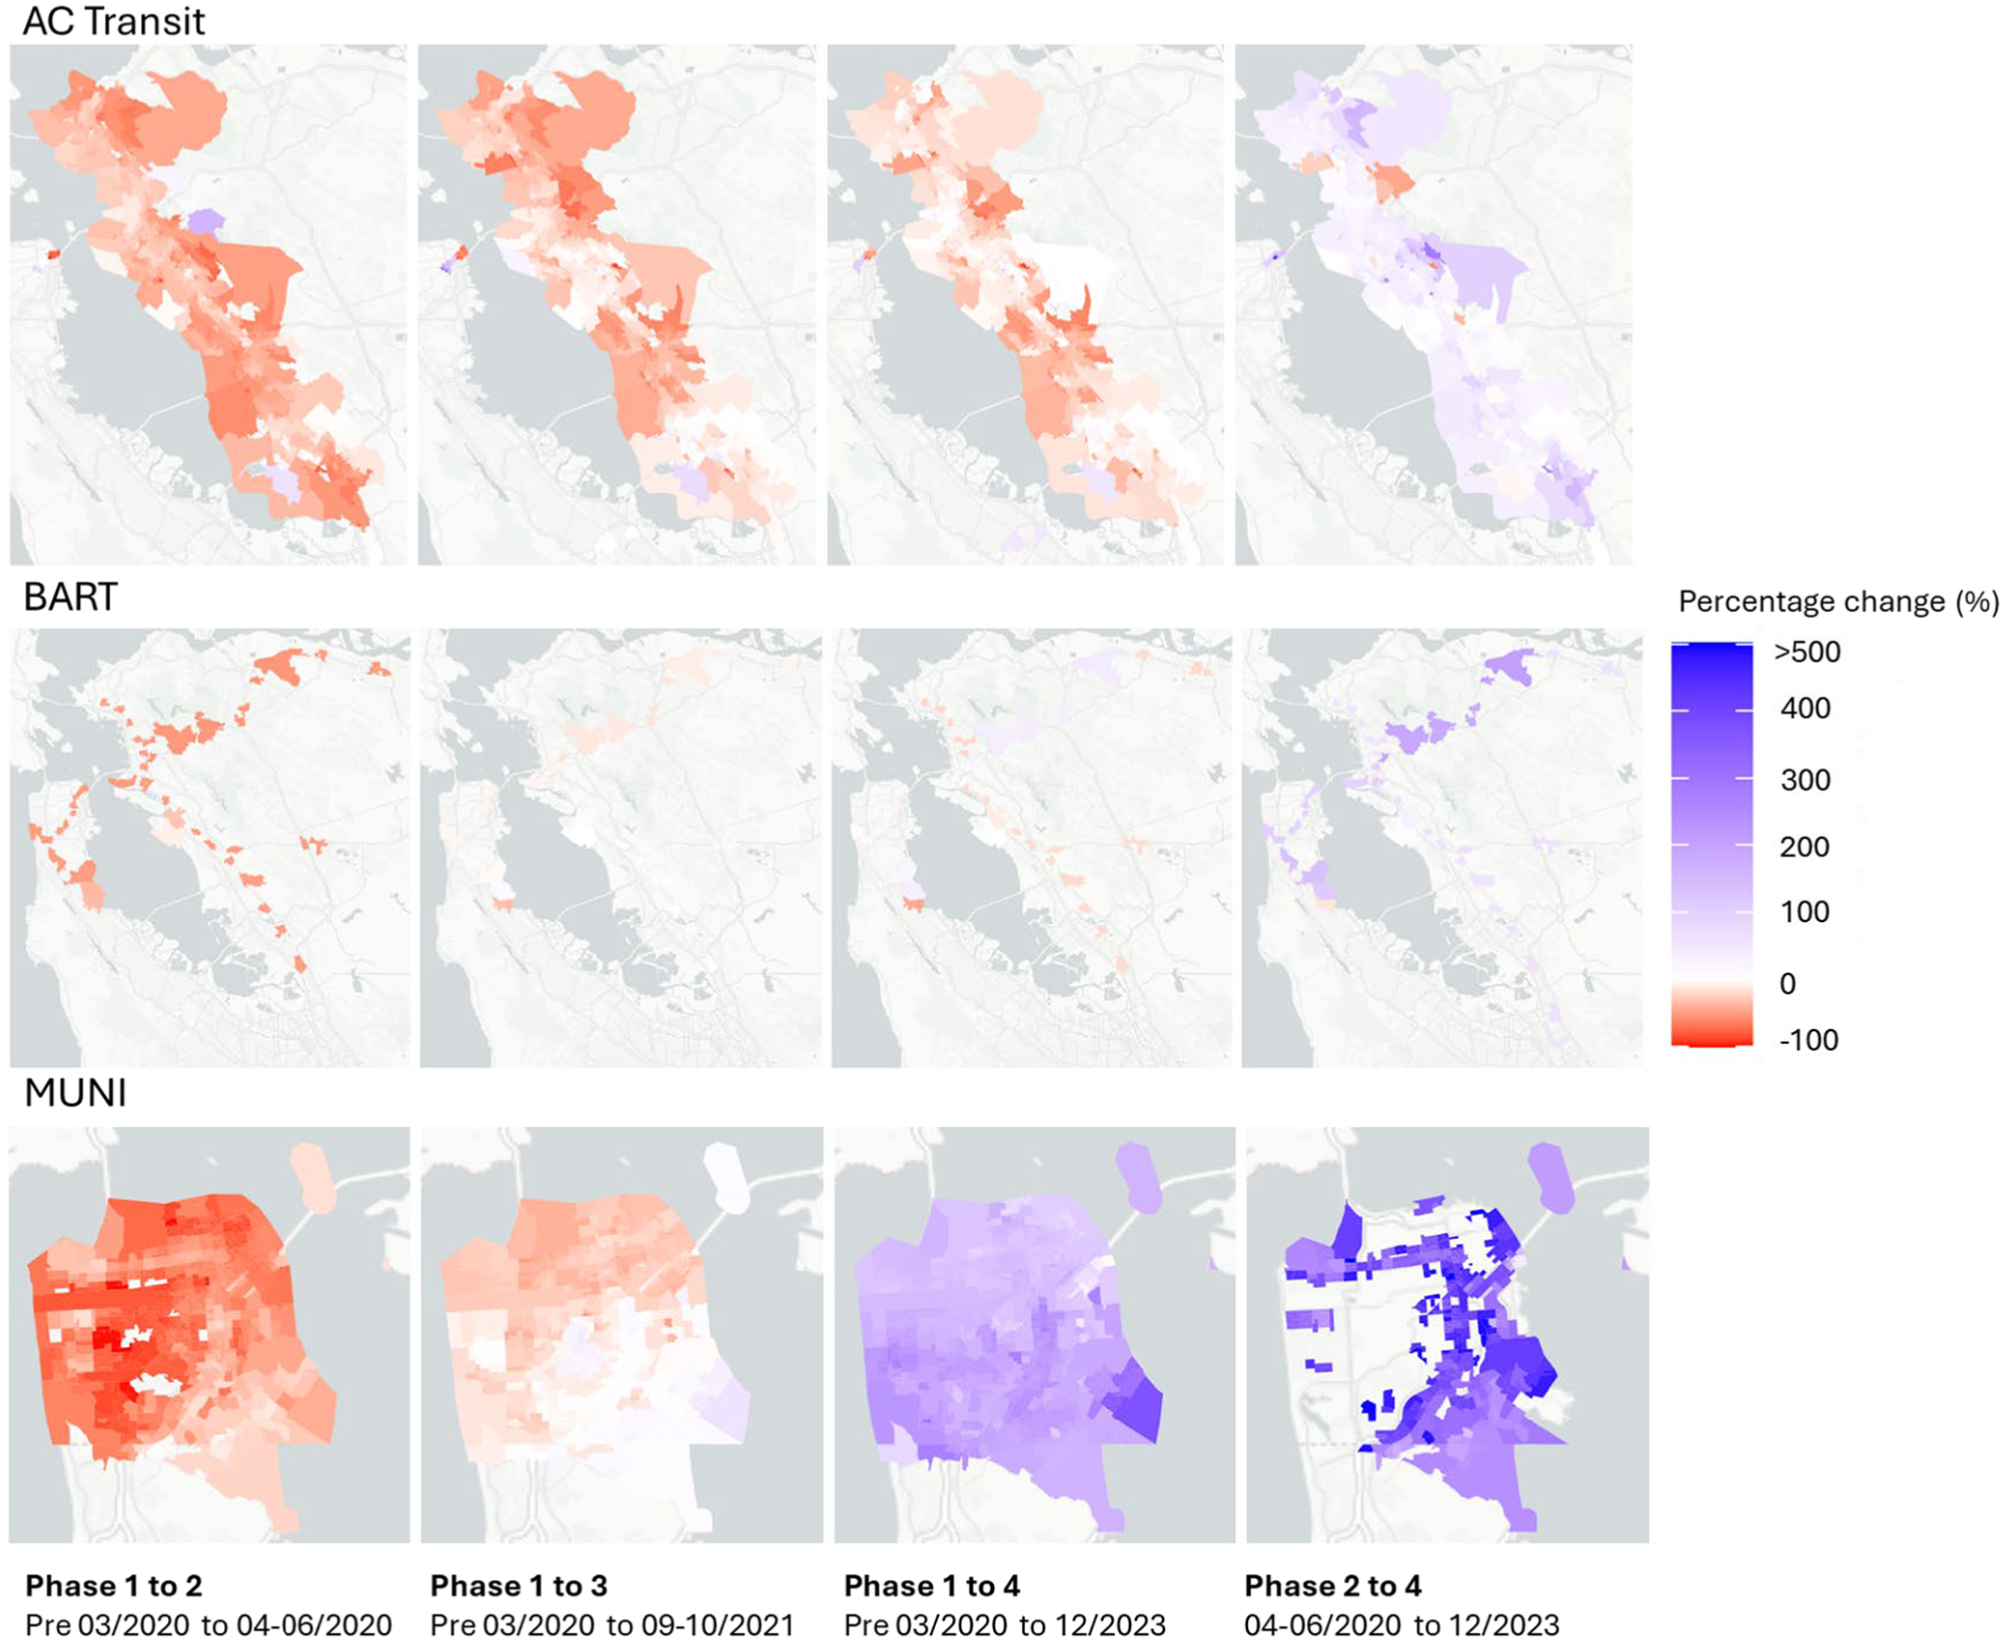
Changes in transit service levels by block group for Alameda-Contra Costa (AC) Transit, Bay Area Rapid Transit (BART), and San Francisco Municipal Transportation Agency (MUNI) between various stages of the pandemic.
The data reveal three distinct approaches to initial service reductions and subsequent restorations. AC Transit prioritized maintaining service in core urban areas. While the agency reduced service levels across their service jurisdiction, smaller reductions were made in areas such as downtown Oakland, which tend to serve local trips made by inner-city residents. Service levels have since gradually been restored to near pre-pandemic levels, though they generally remain slightly below previous levels.
BART initially reduced services uniformly across the system. However, the patterns of service restoration varied by geography. By late 2021, BART had restored services along the north-south corridor along the eastern region of the Bay to pre-pandemic levels. Subsequently, service levels along these lines were reduced again, with increases occurring on the east-west routes between the inland suburbs of East Bay and South San Francisco through downtown San Francisco.
Although MUNI initially reduced service levels between Phase 1 and Phase 3, the reductions varied by area. Smaller reductions were made in the outer suburbs of the Peninsula in Richmond, Sunset, and Mission Districts, as well as neighborhoods south of Interstate 280. MUNI’s post-pandemic approach to service restoration involved major increases in service levels across the board, particularly in areas such as the Sunset and Mission Districts where it not only minimized service reductions but also implemented substantial service increases. On average, MUNI increased service 160% post-pandemic relative to pre-pandemic levels.
Figure 5 shows the evolution in system-wide hourly service levels over the course of the pandemic. Each agency exhibited distinct differences in the provision of peak-hour services. Initially, all three agencies reduced peak-hour services, making service levels more uniform throughout the day. Subsequently, each agency adopted different approaches to service restoration, either reverting to or deviating from original temporal patterns of service. AC Transit adopted a gradual approach, steadily increasing system-wide service levels at each subsequent phase. MUNI drastically increased service across the board, while BART initially restored services to pre-pandemic levels by September 2021 but subsequently scaled back these increases. While AC Transit reverted to a more concentrated peak hour service, BART and MUNI opted to maintain pandemic-era changes in providing more uniform service throughout the day.
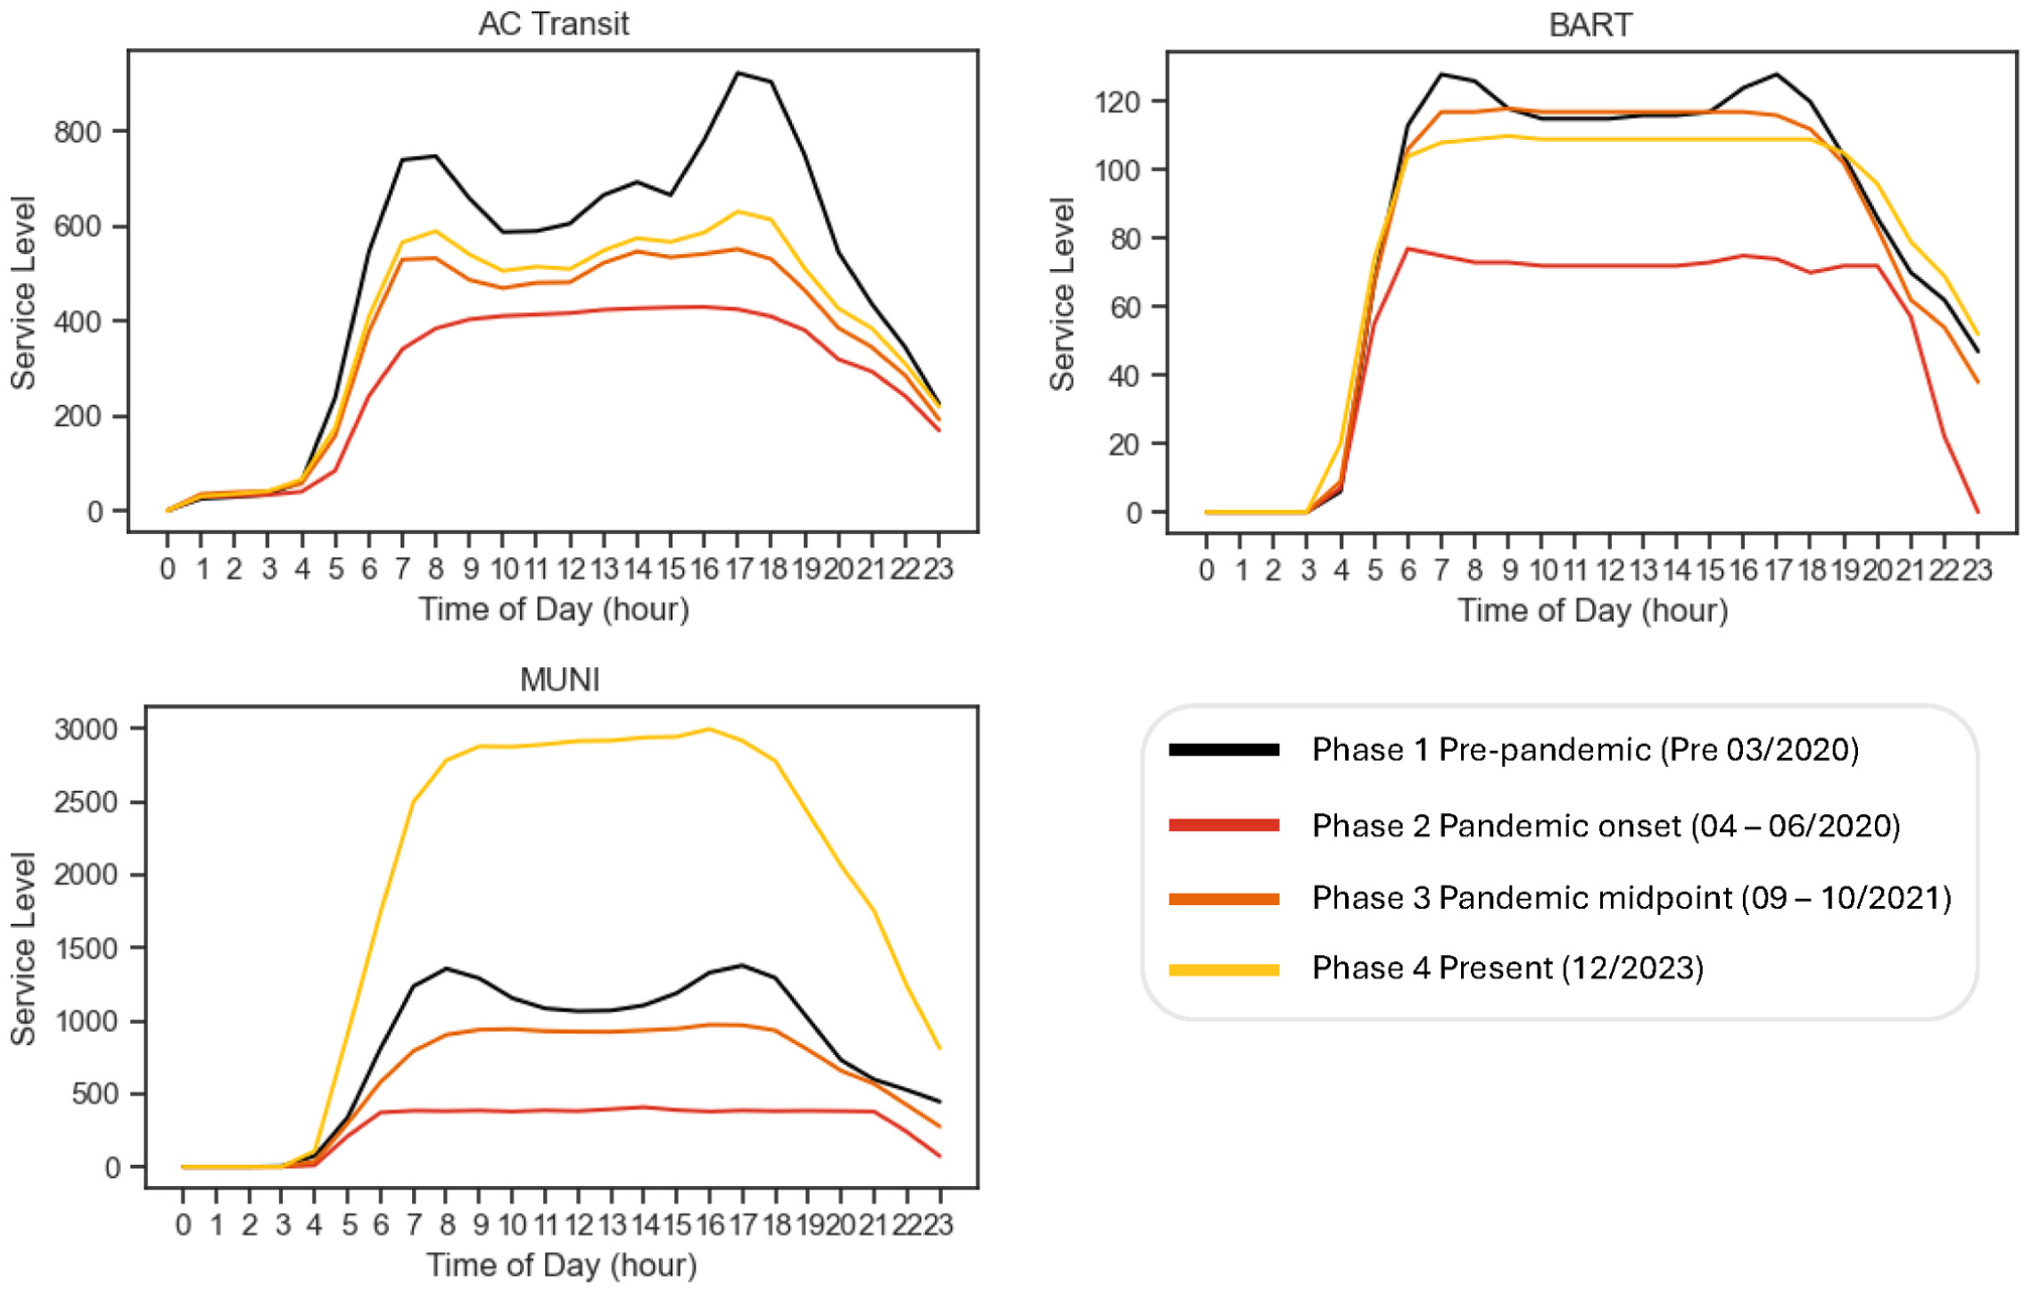
Hourly system-wide service levels for a typical weekday: Alameda-Contra Costa (AC) Transit (top left), Bay Area Rapid Transit (BART) (top right), and San Francisco Municipal Transportation Agency MUNI (bottom left).
Service-Level Adjustments by Sociodemographic Characteristics
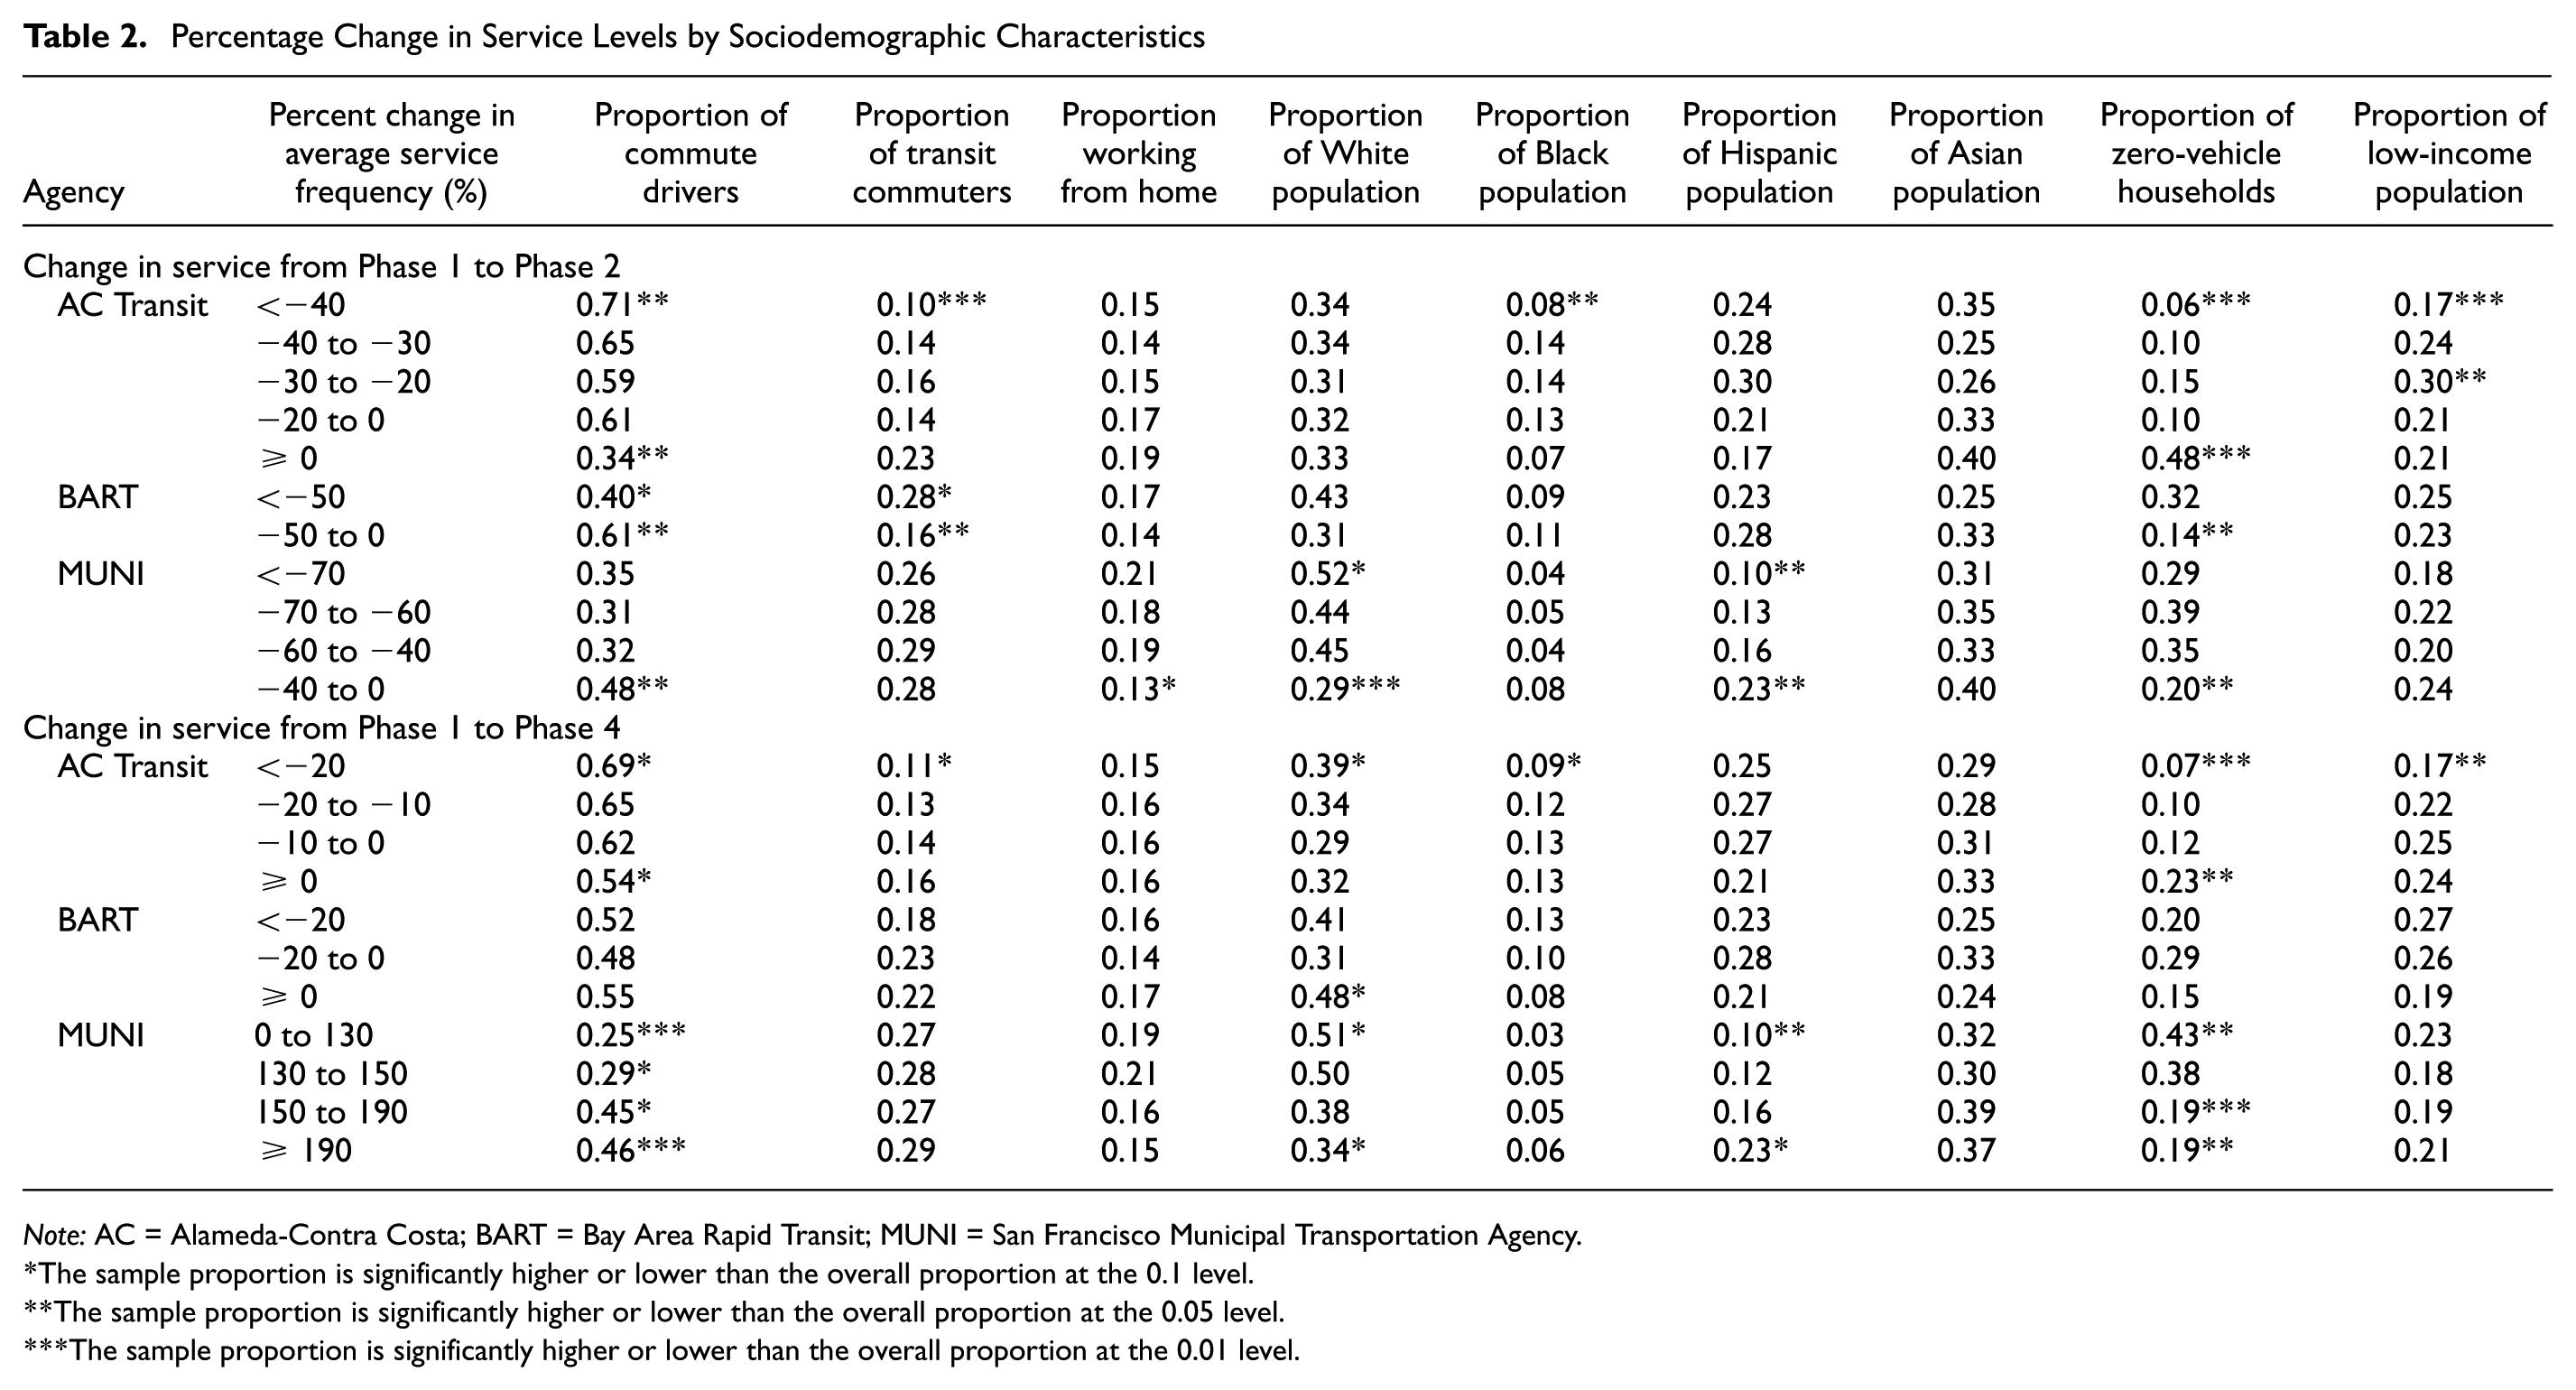
Table 2 shows the changes in service levels by sociodemographic characteristics across Phases 1 and 2 when service was being reduced and Phases 1 and 4 after service was restored.
Percentage Change in Service Levels by Sociodemographic Characteristics
Note: AC = Alameda-Contra Costa; BART = Bay Area Rapid Transit; MUNI = San Francisco Municipal Transportation Agency.
The sample proportion is significantly higher or lower than the overall proportion at the 0.1 level.
The sample proportion is significantly higher or lower than the overall proportion at the 0.05 level.
The sample proportion is significantly higher or lower than the overall proportion at the 0.01 level.
AC Transit implemented more significant service reductions (over 40%) in areas with higher proportions of commute drivers and lower proportions of transit commuters, Black residents, zero-vehicle households, and low-income populations. Conversely, areas with a low proportion of commute drivers and a high proportion of zero-vehicle households experienced no changes or small increases in service, suggesting AC Transit prioritized service for transit-dependent populations.
BART reduced services uniformly, with each block group experiencing an average decrease of approximately 50% (standard deviation of 5%). As Table 2 indicates, slightly larger reductions occurred in areas with a higher proportion of transit commuters and zero-vehicle households and a lower proportion of commute drivers.The reverse was also the case: smaller reductions were observed in areas with a high proportion of commute drivers and lower proportions of transit commuters and zero-vehicle households.These actions suggest that BART’s service reductions potentially affected transit users more significantly than drivers. No significant differences were observed related to race or income.
MUNI’s adjustments appeared to prioritize racial minorities, although the overall changes present a mixed picture. Larger service reductions took place in areas with a higher proportion of White residents, while smaller reductions occurred in areas with a higher proportion of Hispanic residents. This pattern of smaller reductions in areas with a higher proportion of minorities also emerged for Black and Asian residents, though the differences were not statistically significant. Areas with fewer remote workers experienced smaller reductions. However, smaller reductions also took place in areas with more automobile-owning households and areas with higher proportions of automobile commuters. Assuming that areas with higher automobile access may not necessarily rely on transit services, the smaller reduction in these areas suggests there may have been a missed opportunity to redirect resources to areas with greater need for transit by implementing greater reductions in these areas. This mixed result underscores the challenges of balancing service allocation based on travel need (i.e., providing service in areas with limited automobile access and/or reliance on transit to travel to work) and racial equity. Smaller reductions in minority-populated areas suggest that racial equity may have been a significant consideration in MUNI’s service reduction strategy during the pandemic’s onset, highlighting the complexity of balancing different priorities and achieving truly equitable service adjustments.
To assess sociodemographic differences in service restoration, we compared current service levels (Phase 4) with pre-pandemic levels (Phase 1). Although system-wide service levels generally remained below pre-pandemic levels, AC Transit restored service close to pre-pandemic levels in areas with higher proportions of zero-vehicle households and lower proportions of commute drivers. However, larger reductions persist in areas with more commute drivers, fewer transit commuters and zero-vehicle households, and in areas with higher proportions of White residents and fewer Black and low-income residents, indicating priority has been given to restoring service in transit-dependent areas. BART appears to have restored services relatively evenly across sociodemographic groups, though there is some evidence that restoration has been greater in areas with a higher proportion of White residents. MUNI implemented the most significant changes, increasing service levels beyond pre-pandemic levels. Nonetheless, these increases were unevenly distributed, with larger increases in areas with fewer White residents and more Hispanic residents, but also in areas with more commute drivers and those with fewer zero-vehicle households. This suggests that MUNI’s service restoration strategy, like its reduction approach, may have considered racial equity as a determining factor in some areas.
In summary, agencies implemented distinct approaches to service reduction and restoration. AC Transit maintained service for transit-dependent populations, restoring service to near pre-pandemic levels in areas with higher proportions of zero-vehicle households. BART adjusted service relatively evenly across population demographics, while MUNI appeared to prioritize service for racial minorities.
Job Accessibility Impacts
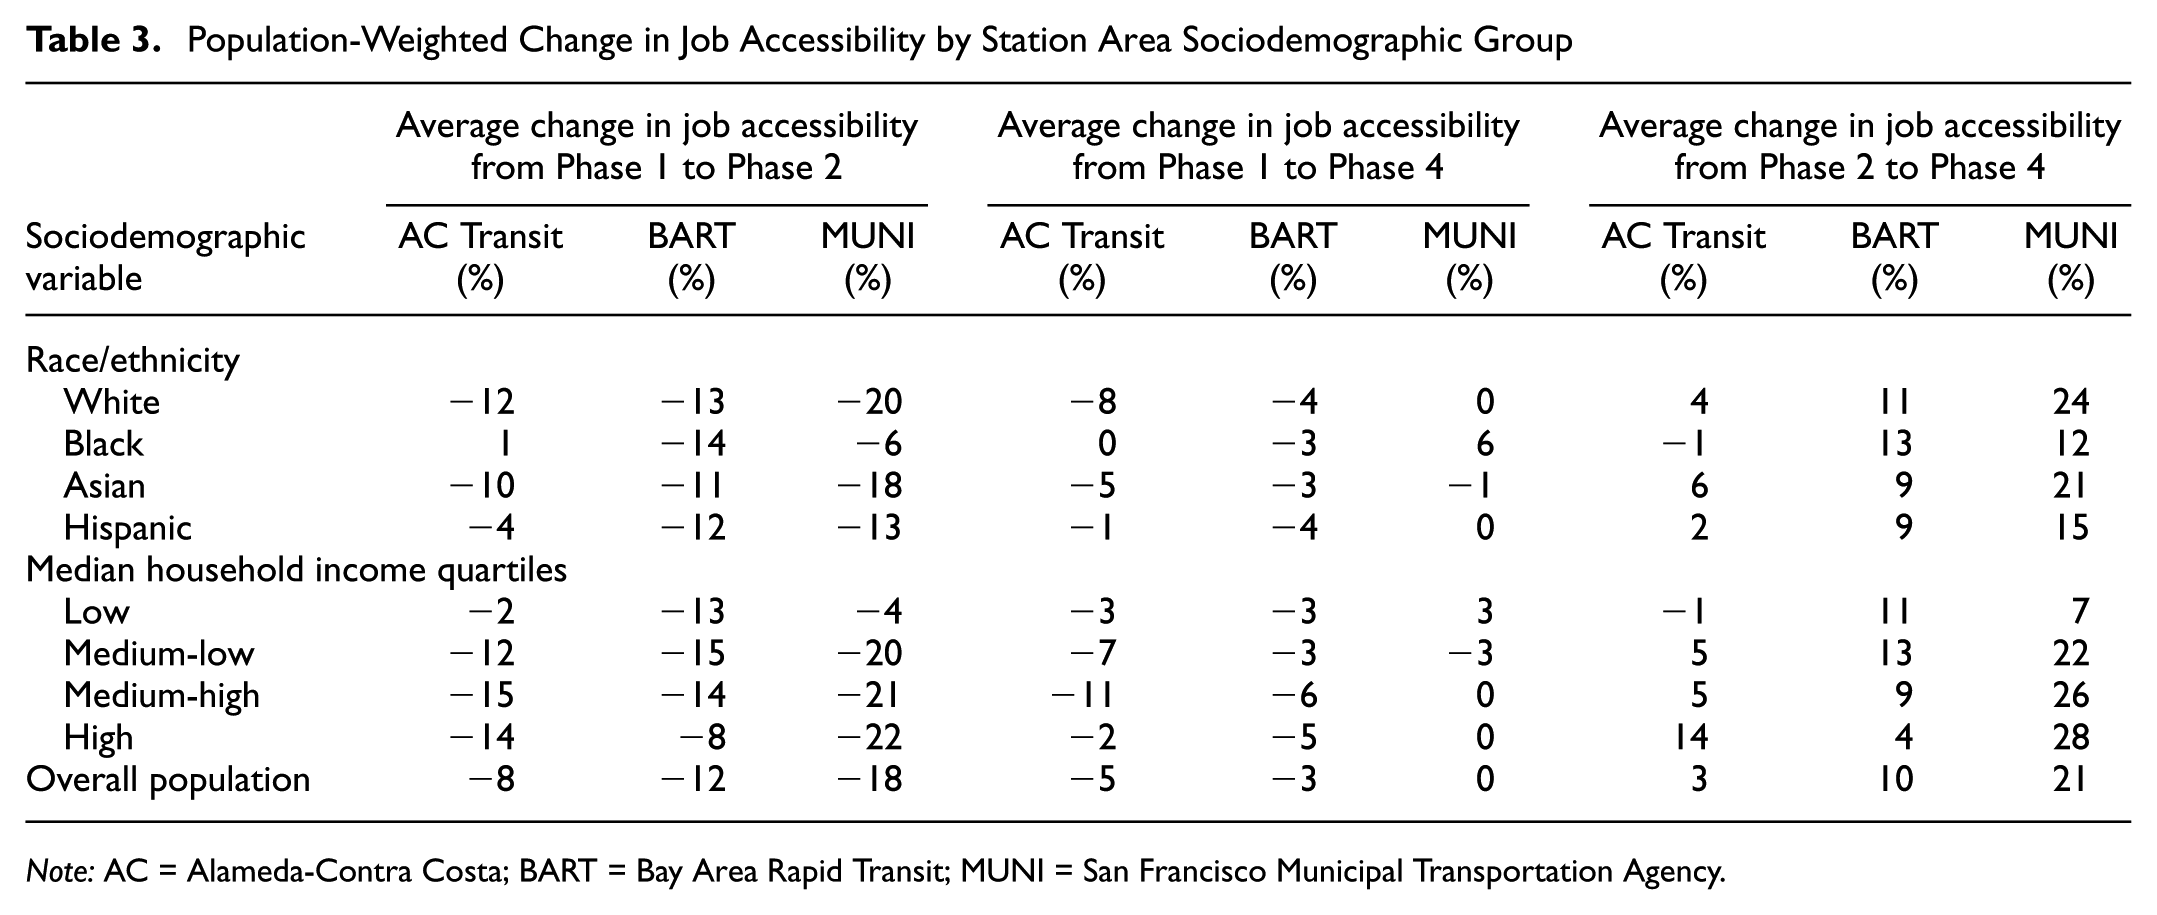
Job accessibility estimates closely mirrored adjustments to service, as areas with reduced service also saw corresponding decreases in job accessibility. We note that these results reflect the effect of transit service adjustments on access to a fixed set of opportunities, rather than changes in access to the actual distribution of employment during the pandemic. At the pandemic’s onset, MUNI implemented the largest service reductions among the three agencies, resulting in an average 18% decrease in job accessibility (Table 3). However, substantial increases in service in the recovery phase did not lead to corresponding improvements in job accessibility. While MUNI service later increased beyond pre-pandemic levels, access generally did not exceed pre-pandemic levels, except in a few locations. As of December, 2023, access for the service areas of BART and MUNI have been restored to pre-pandemic levels, while some areas of AC Transit’s service area, namely San Mateo, Hayward, and Richmond, have yet to see job access fully restored.
Population-Weighted Change in Job Accessibility by Station Area Sociodemographic Group
Note: AC = Alameda-Contra Costa; BART = Bay Area Rapid Transit; MUNI = San Francisco Municipal Transportation Agency.
The spatial distribution of job accessibility changes were largely driven by significant changes in specific regions (Figure 6). Job accessibility in downtown areas of East Bay cities was largely unaffected by service reductions made by AC Transit. However, minor changes to service to key job centers, such as downtown San Francisco, appear to have had a large impact on accessibility. In each phase, service increases for specific routes led to major increases in job access. For example, in Phase 2, increases to express routes serving East Bay commuters to downtown San Francisco drove significant increases in job accessibility. While most of the region served by AC Transit has largely returned to pre-pandemic levels, some areas have lost access because of cancelled services. Notably, the M Line which connected two sides of the Bay across the San Mateo-Hayward Bridge was cancelled during the pandemic, with no plans to restore the service.
Percentage change in job accessibility via transit across different phases of the pandemic.
Overall impacts on job access via BART were generally minor. At the onset of the pandemic, inland suburbs of the East Bay, where service had been reduced more, experienced larger losses in accessibility. However, there were also large increases to job access with the opening of the BART Orange and Green line extensions, with two new stations at Milpitas and Berryessa/North San José.
Initial changes to MUNI service led to decreases in job accessibility in the southwestern neighborhoods of San Francisco near the Sunset district and Ingleside. The agency also made some morning peak service increases at the onset of the pandemic to the neighborhoods around Bayshore Heights and Bayview, which were later reversed. Accessibility throughout most of the city was largely restored by the midpoint of the pandemic. Despite MUNI’s substantial service increase beyond pre-pandemic levels, job accessibility did not improve to the same degree. We acknowledge that accessibility metrics do not capture MUNI’s efforts to enhance service frequency and quality, which are major contributors to the ridership experience.
Pandemic service changes affected job accessibility to varying degrees across sociodemographic groups. While accessibility was reduced to a similar degree (11%–13%) across racial/ethnic groups for BART, reductions were slightly smaller relative to reductions for the overall population for Black and Hispanic populations in the service areas of AC Transit and MUNI. Similarly, low-income populations were least affected by AC Transit and MUNI service reductions, while high-income groups were least affected by BART service reductions. These accessibility estimates offer additional insights into how service changes might have affected groups unevenly, with reductions made by AC Transit and MUNI minimizing impacts to minority and low-income populations.
In line with AC Transit’s patterns for service restoration, job accessibility for Black, Hispanic, and low-income populations was generally maintained at pre-pandemic levels. Other groups who experienced larger initial reductions also received larger increases in access as services were restored. MUNI’s service increases showed similar trends, with average accessibility returning to pre-pandemic levels. However, despite MUNI increasing service levels substantially beyond pre-pandemic levels, corresponding increases in accessibility were not observed, except for Black and low-income populations, whose access increased by 6% and 3%, respectively. Subsequent increases in BART service were slightly larger for Black, White, and lower-income groups, leading to accessibility for all groups being restored to within 3%–6% of pre-pandemic levels of access.
Accessibility Inequity Evaluation
The job accessibility estimates in each phase were used to calculate the CCI (Figure 7). For AC Transit and BART, the direction of inequity remained consistent throughout the pandemic, with access slightly favoring lower-income groups, as indicated by the negative sign. Both agencies experienced minor fluctuations in the degree of inequality. MUNI experienced the largest changes in inequalities. The large reductions in service favoring higher-income populations at the onset of the pandemic surprisingly improved equity, with the magnitude moving to slightly below 0. This could have been part of a conscious effort by the agency to reallocate service to areas with greater need, such as essential workers. However, these improvements were temporary, with the CCI reverting to its positive by the midpoint of the pandemic, and close to its original magnitude by the end.
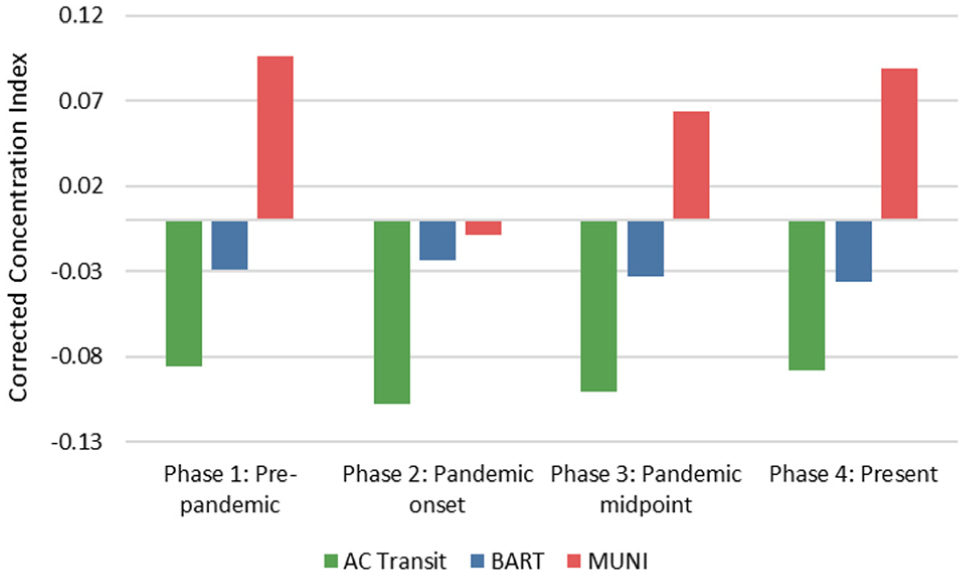
Changes in accessibility inequalities.
Based on the CCI metric, all agencies have returned to their pre-pandemic levels of equity or inequity. For morning peak job accessibility, service adjustments have not led to permanent shifts in either the direction or magnitude of the inequities. This phenomenon was also observed in a study of the Inland Empire in Southern California, where the return of bus routes to pre-pandemic configurations also led to the return to existing inequalities ( 23 ).
Conclusions
Lessons learned from the pandemic era are essential for improving preparedness for future disruptions. This study examined service adjustment patterns and evaluated the equity impacts on job accessibility for three major Bay Area transit agencies. The findings revealed three distinct approaches to service reduction and restoration. The data suggests that AC Transit’s strategy of maintaining local service in core urban areas and prioritizing transit-dependent populations suggests a deliberate effort to support those most reliant on public transportation. On the other hand, MUNI adjusted services in a way that prioritized neighborhoods with higher proportions of racial minorities rather than those with greater travel needs (i.e., areas with a higher proportion of zero-vehicle households and transit commuters). MUNI also substantially increased service levels across the system beyond pre-pandemic levels. BART reduced and restored service relatively evenly across the system, although slightly larger increases were made in areas with a higher proportion of White residents. These different approaches may, in some respects, reflect each agency’s original raison d’être and the historical legacy left by funding disparities and planning decisions ( 25 ). AC Transit’s prioritization of transit-dependent areas, MUNI’s service of diverse San Francisco neighborhoods, and BART’s function as a suburban commuter rail service continue to influence agency decision-making, even as their ridership demographics evolve. In post-pandemic daily service patterns, both BART and MUNI have maintained pandemic-era changes of providing more uniform service levels throughout the day, while AC Transit have returned to concentrating services around the peak hour commute.
Pandemic service adjustments affected job accessibility to varying degrees across agencies and across sociodemographic groups. Agency-specific accessibility analysis showed the largest decreases in accessibility from MUNI, with overall access falling to 18% below pre-pandemic levels. While access in most areas was restored to existing levels by Phase 3 for BART and MUNI, for AC Transit job access has yet to return to pre-pandemic levels in San Mateo, Hayward, and Richmond. Despite substantial service increases made by MUNI and BART to levels exceeding pre-pandemic levels, these increases did not generally translate into significantly higher levels of job access.
Sociodemographic analysis of accessibility impacts offers additional insights into how service might have affected groups unevenly. Results show that impacts generally aligned with each agencies’ patterns of service adjustment. Changes implemented by AC Transit and MUNI tended to minimize impacts to minority and low-income populations, while BART’s impacts were generally more evenly distributed across racial/ethnic and income groups. Finally, using the CCI as a measure of job accessibility inequality, the study found that, while equity briefly improved for MUNI during the pandemic, these changes were temporary, with all agencies returning to their pre-pandemic states.
Key insights from this study can inform the development of equitable transit service allocation for future disruptions. First, sociodemographic analysis of service changes showed that, while each agency appeared to consider equity to some degree in their service adjustments, strategies and priorities varied between agencies. This highlights the need to evaluate the equity impacts of temporary service adjustments, in line with existing requirements for permanent service changes, to protect vulnerable populations during disruptions. Transit agencies should adopt more dynamic mechanisms for monitoring and adjusting service changes to address the needs of vulnerable populations during disruptions. Second, while accessibility and equity metrics, such as CCI, can reveal insights into the potential impacts of service changes, they are limited in their ability to consider factors such as service frequency, safety, and user experience. Results show that, despite MUNI’s substantial service increases in the restoration phase, these increases did not translate to significantly higher levels of access, as measured by accessibility metrics used in this study. Additional information, including qualitative data, could be useful in explaining how transit service relates to employment access and other types of accessibility. Thirdly, balancing financial, operational, and constitutional constraints with equity priorities is complex. For example, MUNI appeared to give higher priority to racial equity over serving areas with possibly greater need to transit services (Table 2). Transit agencies would benefit from clear protocols for identifying equity concerns in addressing riders’ travel needs in inaugurating both temporary and permanent service changes. Last, the reversion to existing accessibility inequalities (Figure 7) highlights a missed opportunity for transit agencies to build on temporary equity improvements as they reformulate their services for post-pandemic riders. By incorporating equity measures into service allocation decisions during future disruptions, agencies can work toward long-term equity goals and improve overall resilience.
There are limitations to this study. First, several elements of the accessibility analysis could be refined to provide a more nuanced picture of the service change impacts. For example, the accessibility analysis focused only on job opportunities within the morning peak hour. Future work should include other destinations and time periods, as well as using both pre- and post-pandemic LEHD employment data to reflect changes to the actual distribution of employment during the pandemic. Job accessibility via transit was calculated for each agency separately to isolate impacts from each agencies’ service changes. Multi-modal accessibility analysis accounting for network effects and inter-agency coordination would provide more realistic estimates although different methods would be required to isolate service changes. Moreover, instead of the fixed ¼ mi walking catchment, distances should reflect operator- and geography-specific differences in access behavior (e.g., park-and-ride access to BART stations in suburban areas). Additionally, qualitative investigation into how transit agencies incorporated equity considerations would provide necessary context for understanding service adjustment approaches. This study analyzed only three Bay Area transit agencies; future studies should extend the sample to include other agencies to compare performance and identify best practices.
In summary, this paper offers new insights into how transit agencies responded to the COVID-19 pandemic with regard to service adjustments and their impacts on job accessibility and social equity. The findings may guide transit agencies in developing equitable service adjustment strategies, highlighting the need for decision-making tools to balance competing needs, incorporate multiple equity dimensions, and ensure long-term resilience in the face of disruptions.
Footnotes
Author Contributions
The authors confirm contribution to the paper as follows: study conceptualization: P. Ho; methodology: P. Ho, J. Zmud, J. Walker; formal analysis: P. Ho; draft manuscript preparation: P. Ho; review and editing: P. Ho, J. Zmud, J. Walker; funding acquisition: P. Ho, J. Walker. All authors reviewed the results and approved the final version of the manuscript.
Declaration of Conflicting Interests
The authors declared no potential conflicts of interest with respect to the research, authorship, and/or publication of this article.
Funding
The authors disclosed receipt of the following financial support for the research, authorship, and/or publication of this article: This work was supported by the National Science Foundation Graduate Research Fellowship (Grant No. 2146752) and the University of California Institute of Transportation Studies 2022–23 Statewide Transportation Research Program.
Any opinions, findings, conclusions, and recommendations express-ed in this paper are those of the authors and do not necessarily reflect the views of the organizations named in this paper.