
Abstract
This study examines the correlates of the Modal Access Gap (MAG) between transit and automobile to employment opportunities in the 45 most populated American metropolitan areas by testing spatial lag regression models and employing the bivariate local indicator of spatial autocorrelation (BiLISA) at the census block group geographical level. Four findings are discerned. First, MAG is positive regardless of the metropolitan area and travel-time threshold and ranges from 0.22 to 0.98. This indicates transit trails automobile in offering access to employment opportunities. Second, millennials and carless households tend to reside in areas with a narrower MAG, while people with disabilities reside in areas with a wider MAG. Third, areas with a high share of carless households and relatively low transit access to employment opportunities are primarily clustered in the suburbs and exurbs of American metropolitan areas. Fourth, the MAG disproportionately affects socially vulnerable populations, including the elderly, people with disabilities, low-income households, Hispanics, and African Americans. Compared with the national average, modal access inequity is prevalent for the elderly in 27, for people with disabilities in 22, for low-income households in 17, for Hispanics in 14, and for African Americans in 12 metropolitan areas. This research is a necessary step forward for instilling social equity into transport planning strategies in parallel with governmental efforts.
Major strides in America’s automobile industry were taken in the early 20th century. Driven by the automobile industry, economic growth associated with the political and social order in advanced capitalism transformed the social and spatial configuration of American cities ( 1 ). Over several decades, auto-centric development has torn cities apart, retrofitted, and codified their structure to accommodate cars. Profoundly ingrained patterns of urban development spread people out to suburban residency, propagating people’s auto-dependency ( 2 ). The promised prosperity of this very American way of moving flipped shortly. Ramifications of auto-dependent modifications appeared: a devastated environment, degraded public transit, and people who could barely reach their destinations without a car ( 3 ). Access or ease of reaching destinations has become a presumed necessity that modern cities are expected to offer to “all dwellers.” However, for socially vulnerable carless people suffering from poor transit services, the glittering world of auto-dependency has been nothing but disappointment, discomfort, increased pedestrian fatalities, and delimited access. This inequity of transport is a product of transport policies and land-use development marked by spatial segregation in urban development and auto-dependency. As a panacea for the adverse consequences of this auto-centric urban development, planners started to put people before cars to provide more access to opportunities, increase social equity, and mitigate the adverse environmental effects of auto-dependency. Efforts are gradually shifting the fashion of transport systems evaluation from measuring mobility to measuring access. Now, access is more rampant in evaluating the social equity of transport systems ( 4 ).
As early as the 1950s, access has been used to understand the association between transport, land use, and urban activity patterns ( 5 ). It has gradually become integrated into urban planning objectives as an indicator to evaluate land-use development, transport services, and their related socioeconomic impacts. With social and spatial dimensions, access is a function of planning and policy. Inapt policies instigate disparity between demand and access, affecting specific locations and vulnerable communities. Literature is evolving to juxtapose automobile access with transit access deliberately to examine the domination of transit service by automobile, narrow their access gap, and advocate for sustainability, equity, and social justice. Different measures for comparing transit access with automobile access have been defined ranging from a simple comparison ( 5 ) and calculating the ratio of access values ( 6 – 11 ) to calculating the standardized ratio of access values known as the modal access gap (MAG) ( 12 ). Measuring the MAG metric offers two advantages. First, it is easy to compute and interpret for planning and policy purposes. It helps planners identify regions in which transit access trails automobile access. Second, it helps instill social equity into transport planning strategies if it is integrated with socioeconomic and demographic measures. For example, the wide gap between transit and automobile access in regions where car ownership is low has different social and economic burdens than where car ownership is high, necessitating different plans and policies.
Research measuring the access gap between transit and automobile suggests the MAG is wide and continues to expand ( 13 ). This large MAG is a policy product and transit advocates are optimistic that the $108 billion allocations for public transport in the $1.2 trillion Infrastructure Investment and Job Acts (IIJA) ( 14 ) might be an antidote for sweeping reform. This bill is expected to advance transit systems through four core priorities: safety, modernization, climate, and equity ( 15 ). The allocated budget for the transit industry might serve as an enabler narrowing the gap between transit and automobile access if the distribution of funds is based on delivering equitable transit infrastructure. The opening gambit for transit advocates is to create a proactive cultural awareness of social inequity induced by imprudent policies on transit infrastructure and land use and identify the priority areas that are in urgent need of transit improvements. This requires the knowledge and tools necessary to examine the gap between transit and automobile access, mobility deserts, and transit-dependent communities. In America, however, major transit investments often favor higher-income choice riders while captive riders, who are on a low income and less likely to own personal cars, are stranded as a result of insufficient transit services ( 16 ).
This study is a natural continuation of existing research on measuring the MAG, and contrast from much of the previous research that only examines the MAG within a city (13, 17) or between a few cities (6, 18). Our contribution is threefold. First, we examine socioeconomic correlates of the MAG between and within the 45 most populated American metropolitan areas. Growing research explores the relationship between transit access and socioeconomic characteristics (9, 19, 20). Yet, few studies explore the nexus of the MAG and socioeconomic characteristics of communities ( 21 ). Second, we employ bivariate local indicator of spatial autocorrelation (BiLISA) analysis to study MAG in tandem with zero car ownership to classify regions into (i) areas with a high share of carless households and a large MAG, (ii) areas with a high share of carless households and a narrow MAG, (iii) areas with a low share of carless households and a large MAG, and (iv) areas with a low share of carless households and a narrow MAG. This classification helps tailor effective policies and plans for each region to improve access to employment. Third, we synthesize the population in each area to determine the extent to which mobility resources are disproportionally distributed across underserved communities.
The remainder of this paper is organized as follows. First, we review previous studies exploring the MAG between automobile and transit. Second, we introduce the data, access measure, and method used for spatial modeling. Third, we discuss the results and elaborate on the findings. Fourth, we conclude the study by suggesting policy implications and presenting the limitation of this work while suggesting future research avenues.
Literature Review
Access is a product of both mobility and land use. It is measured for reaching a destination (e.g., employment) using a mode of travel (e.g., transit) at a particular time of day (e.g., peak hour) for different travel-time thresholds (e.g., 10, 20, 30 min). Application of access is noticed in active transport, public transport, automobile travel, system performance, project evaluation, resilience and crisis, and equity and social justice ( 4 ). In contemporary dialog, equity and social justice are receiving more attention. Research on transport and inequity is burgeoning because of an ever-increasing recognition that social equity needs to be embedded in transport system designs, policies, and investments ( 22 ). It is explained that transport planning and its associated decisions affect communities differently with various benefits or imposed costs ( 23 ). This notion originates from the idea that transport increases the “space–time convergence” as it decreases travel time and brings “places closer” ( 24 ). Consequently, poor transport services affect economic growth, stimulate social exclusion, and create spatial segregation ( 25 ).
A growing body of literature has associated access to transit with racial–ethnic composition and socioeconomic status. Studies reporting the association between race and access to employment examined non-white individuals’ having lower transit access to employment ( 26 ). Studies relying on economic status to examine social inequity as a function of transport access reported a positive association ( 27 ), an insignificant association ( 28 ), or a mixed association between access to transit and the residential location of low-income communities depending on the trip purpose ( 29 ). In addition to race and the income level, studies looking at socioeconomic characteristics have focused on occupation and car ownership as possible correlates of access. Car ownership, as a determinant factor of transit use, has been argued to be one of the correlates of transit access ( 30 ). Inconsistent correlations are observed, however. Carless households were reported to either have lower access to transit than automobile owners (31, 32) or to demonstrate positive and negative associations between car ownership and access to transit contingent on the applied travel-time threshold ( 27 ).
Access is a function of location, travel times, and travel modes, and its variation over space is minimal compared with its variation over travel modes ( 33 ). This perhaps motivated measuring the access gap between two “competitive” motorized travel modes of transit and automobile, known as MAG. MAG was initially introduced to measure and monitor sustainable transport development in urban areas ( 11 ). Still, it has recently been employed as a measure of social equity and urban livability (21, 34). Kwok and Yeh ( 12 ) used this measure to examine sustainable transport development in Hong Kong between 1991 and 1996. Later, MAG was used to offer mobility and land-use policies and to encourage more transit use and modal shifts in areas where transit lagged behind automobile in offering access ( 35 ). Benenson et al. ( 8 ) reported a large access gap between automobile and transit access in Tel Aviv metropolitan area. They argued that the modal shift from automobile to transit requires changes in the transit lines and timetables. Kawabata ( 35 ) measured MAG to examine the spatial variations of access between commuting by automobile and transit near and far from transit stations in Boston and San Francisco, and suggested that reducing the MAG in central and suburban areas encourages transit use. Yang et al. ( 36 ) measured MAG for automobiles and transit in Guangzhou and reported that a larger MAG is associated with larger travel times. They suggested three urban policies to reduce the access gap: (i) increasing residential density and land-use mix, (ii) offering various options for travel mode, and (iii) improving the existing transit system to encourage a modal shift from automobile to transit. The application of MAG has gradually gone beyond the mere measure of urban sustainability and transit use. Maharjan et al. ( 21 ) juxtaposed MAG with the demographic and socioeconomic characteristics of residents in the city of Chicago. They reported that areas with a high access gap and a high share of carless households include a higher share of African Americans and low-income households. Guan et al. ( 34 ) measured MAG while evaluating the characteristics of transit riders. They used MAG to propose a framework for urban and transport planning to promote social equity and livability for the City of Shanghai. Table 1 shows a summary of studies measuring the gap between transit access and automobile access.
Summary of Studies Assessing Modal Access Gap
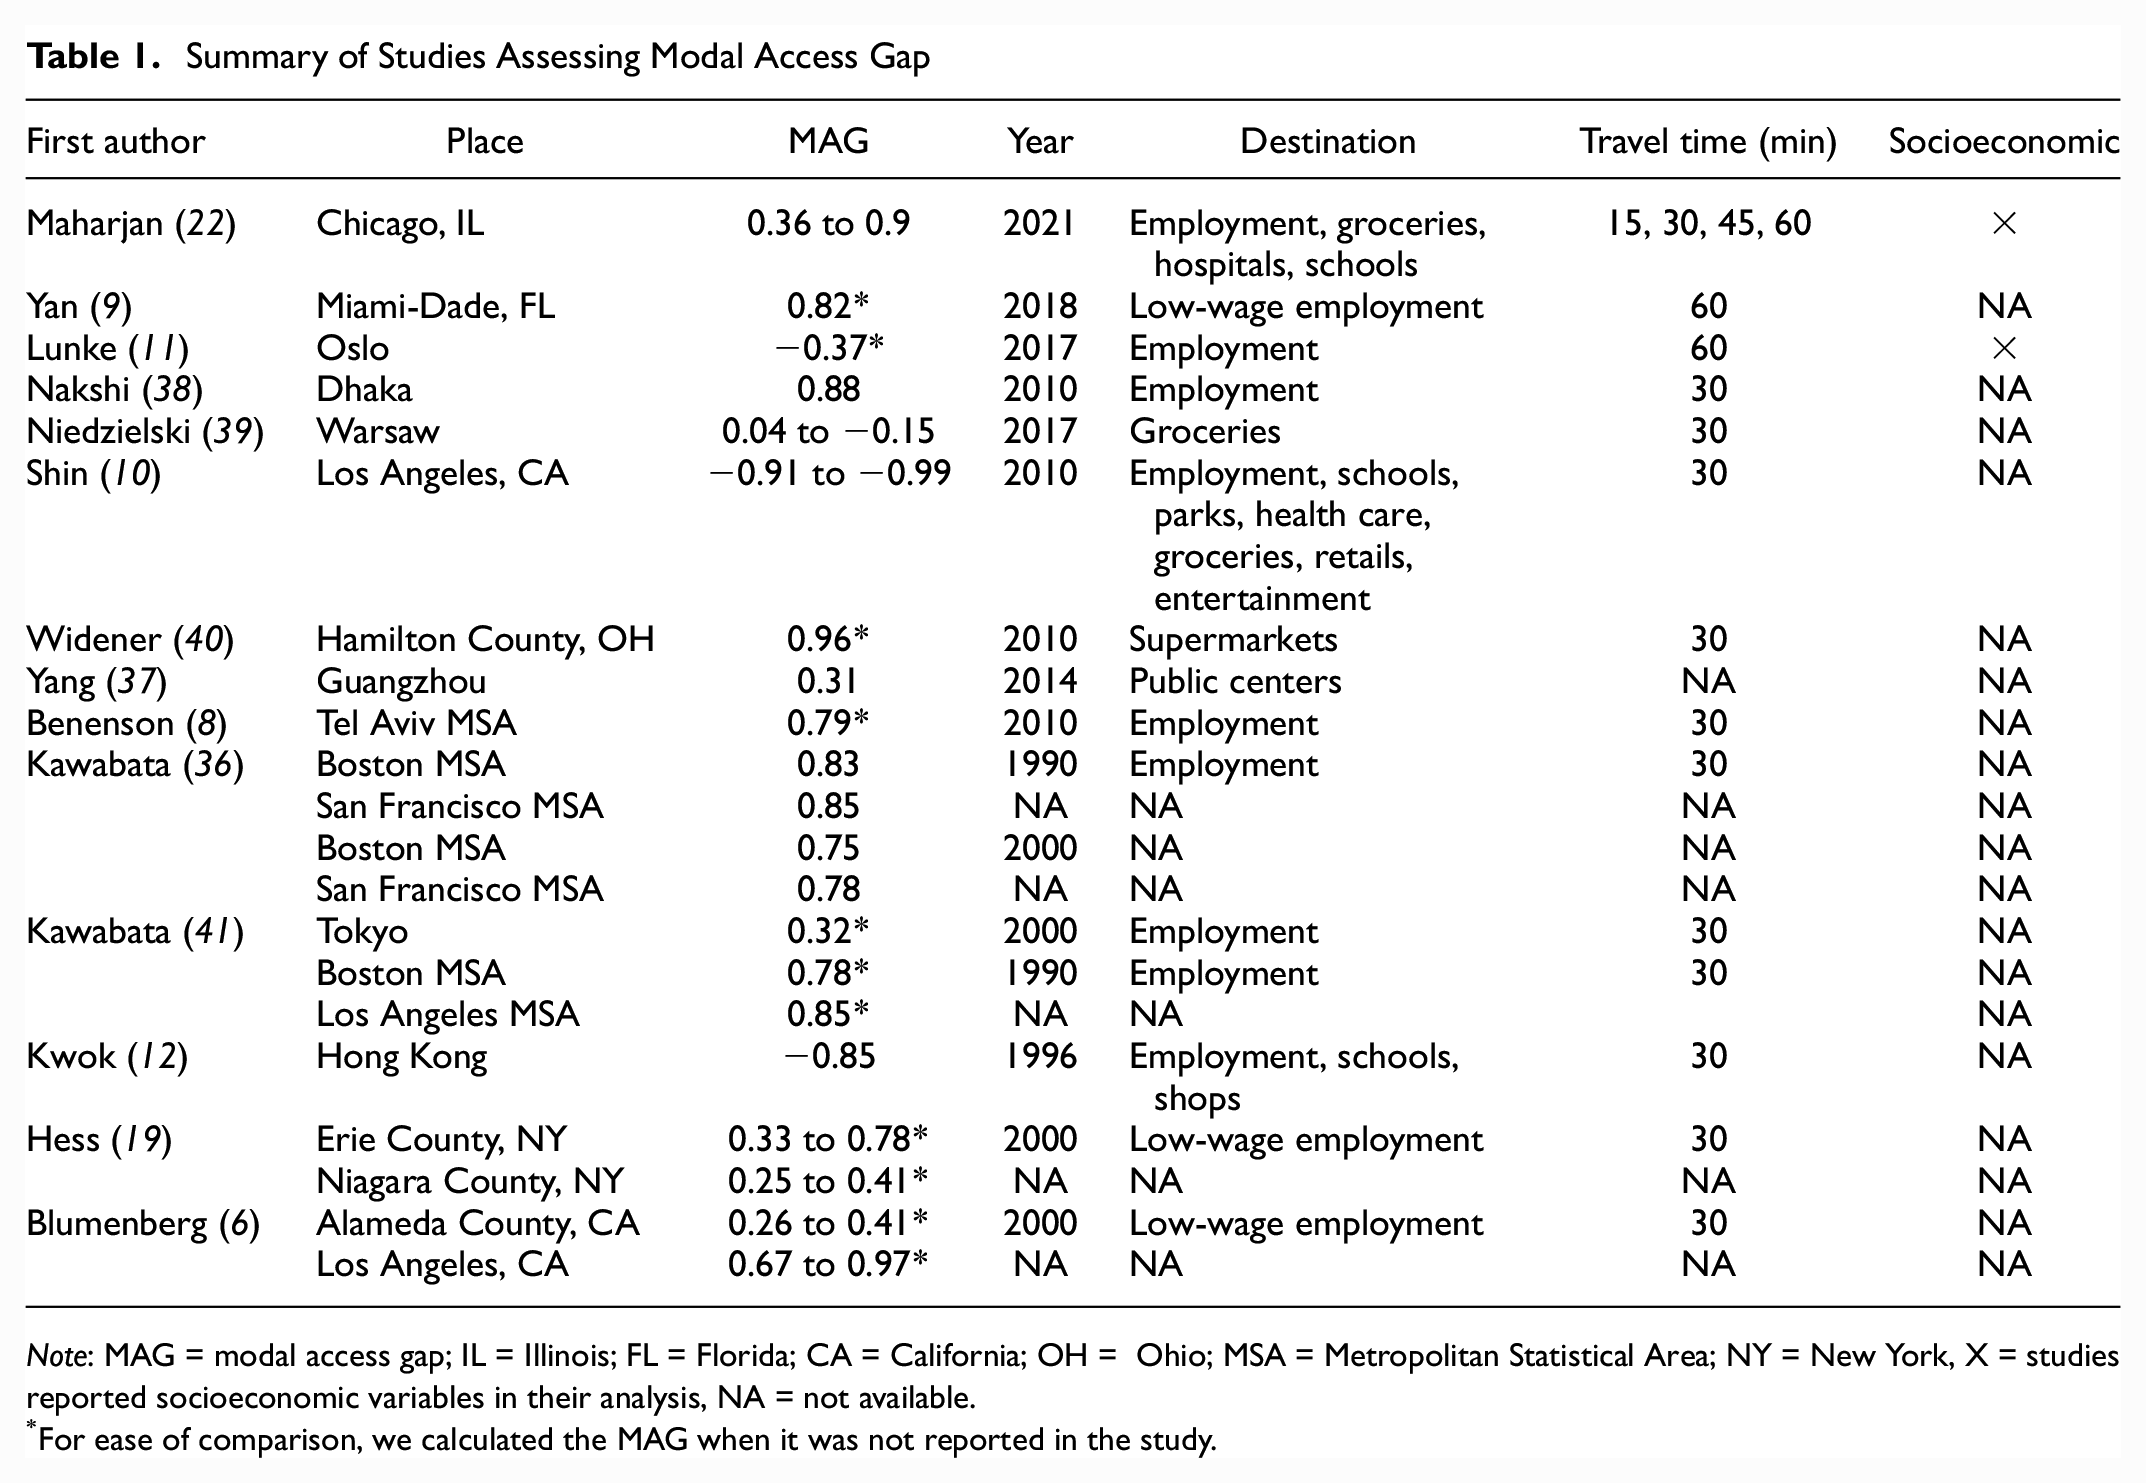
Note: MAG = modal access gap; IL = Illinois; FL = Florida; CA = California; OH = Ohio; MSA = Metropolitan Statistical Area; NY = New York, X = studies reported socioeconomic variables in their analysis, NA = not available.
For ease of comparison, we calculated the MAG when it was not reported in the study.
Studies measuring demographic, socioeconomic, and built environment correlates of MAG are still relatively scarce. Yang et al. ( 36 ) offered insight into how built environment characteristics correlate with MAG in Guangzhou, China. They developed four spatial regression models to investigate the built environment correlates of travel-time disparity between transit and automobile. The built environment characteristics included distance to city public centers, residential density, land-use mix, bus-stop density, metro-station density, and road-network density. Their findings indicated that increasing residential density, land-use mix, bus-stop density, and metro-rail-station density reduces the MAG defined by travel time. Maharjan et al. ( 21 ) added to the knowledge by examining the socioeconomic correlates of MAG in the city of Chicago. Their results suggested that (i) the automobile has an advantage over transit in providing access to opportunities regardless of the travel-time threshold, (ii) block groups with low MAG are concentrated and clustered in the central business district, (iii) millennials and carless households are more likely to reside in areas with lower MAG, and (iv) areas with a high access gap and a high proportion of carless households are occupied by a higher share of African Americans and low-income households. This helps identify communities that are underserved or well-served by transit and informs decision-makers to enact policies and propose more targeted interventions to close the access gap, particularly for underserved population.
Method and Model
MAG Measure
The cumulative opportunities measure formulated in Equation 1 was employed to measure transit and automobile access to employment opportunities at the census block group level using the longitudinal employer–household dynamics (LEHD) origin–destination employment statistics dataset.

where

The Rapid Realistic Routing on Real-world and Reimagined networks (r5r) package ( 41 ) was used to calculate transit access and automobile access to employment for 12 travel-time thresholds ranging from 5 min to 60 min at the census block group level. Road networks and pedestrian infrastructure data were retrieved from OpenStreetMap (OSM) on September 1, 2021, in osm.pbf format, and transit data were obtained from the General Transit Feed Specification (GTFS). Transit access includes access and egress for walking, in-vehicle, transfer, and wait times for rail and bus. The access to employment data were augmented by socioeconomic and demographic information including age, ethnicity, level of income, car ownership, disability, and population density. This was extracted from the 2019 American Community Survey (ACS) 5 year estimate. The census block group was used as the geographical level of analysis because of the availability of ACS data at this geographical level ( 42 ).
The access gap between automobile and transit can be measured with the simple ratio of automobile to transit access at the census block group level. This measure, however, could produce unusually large values that are difficult to compare and interpret. This study calculates the MAG index introduced by Kwok and Yeh ( 12 ) for measuring the MAG in 45 American metropolitan areas. MAG is a standardized difference between automobile access and transit access and is calculated by Equation 3.

where
Average of MAG over Metropolitan Areas in Different Travel-Time Thresholds
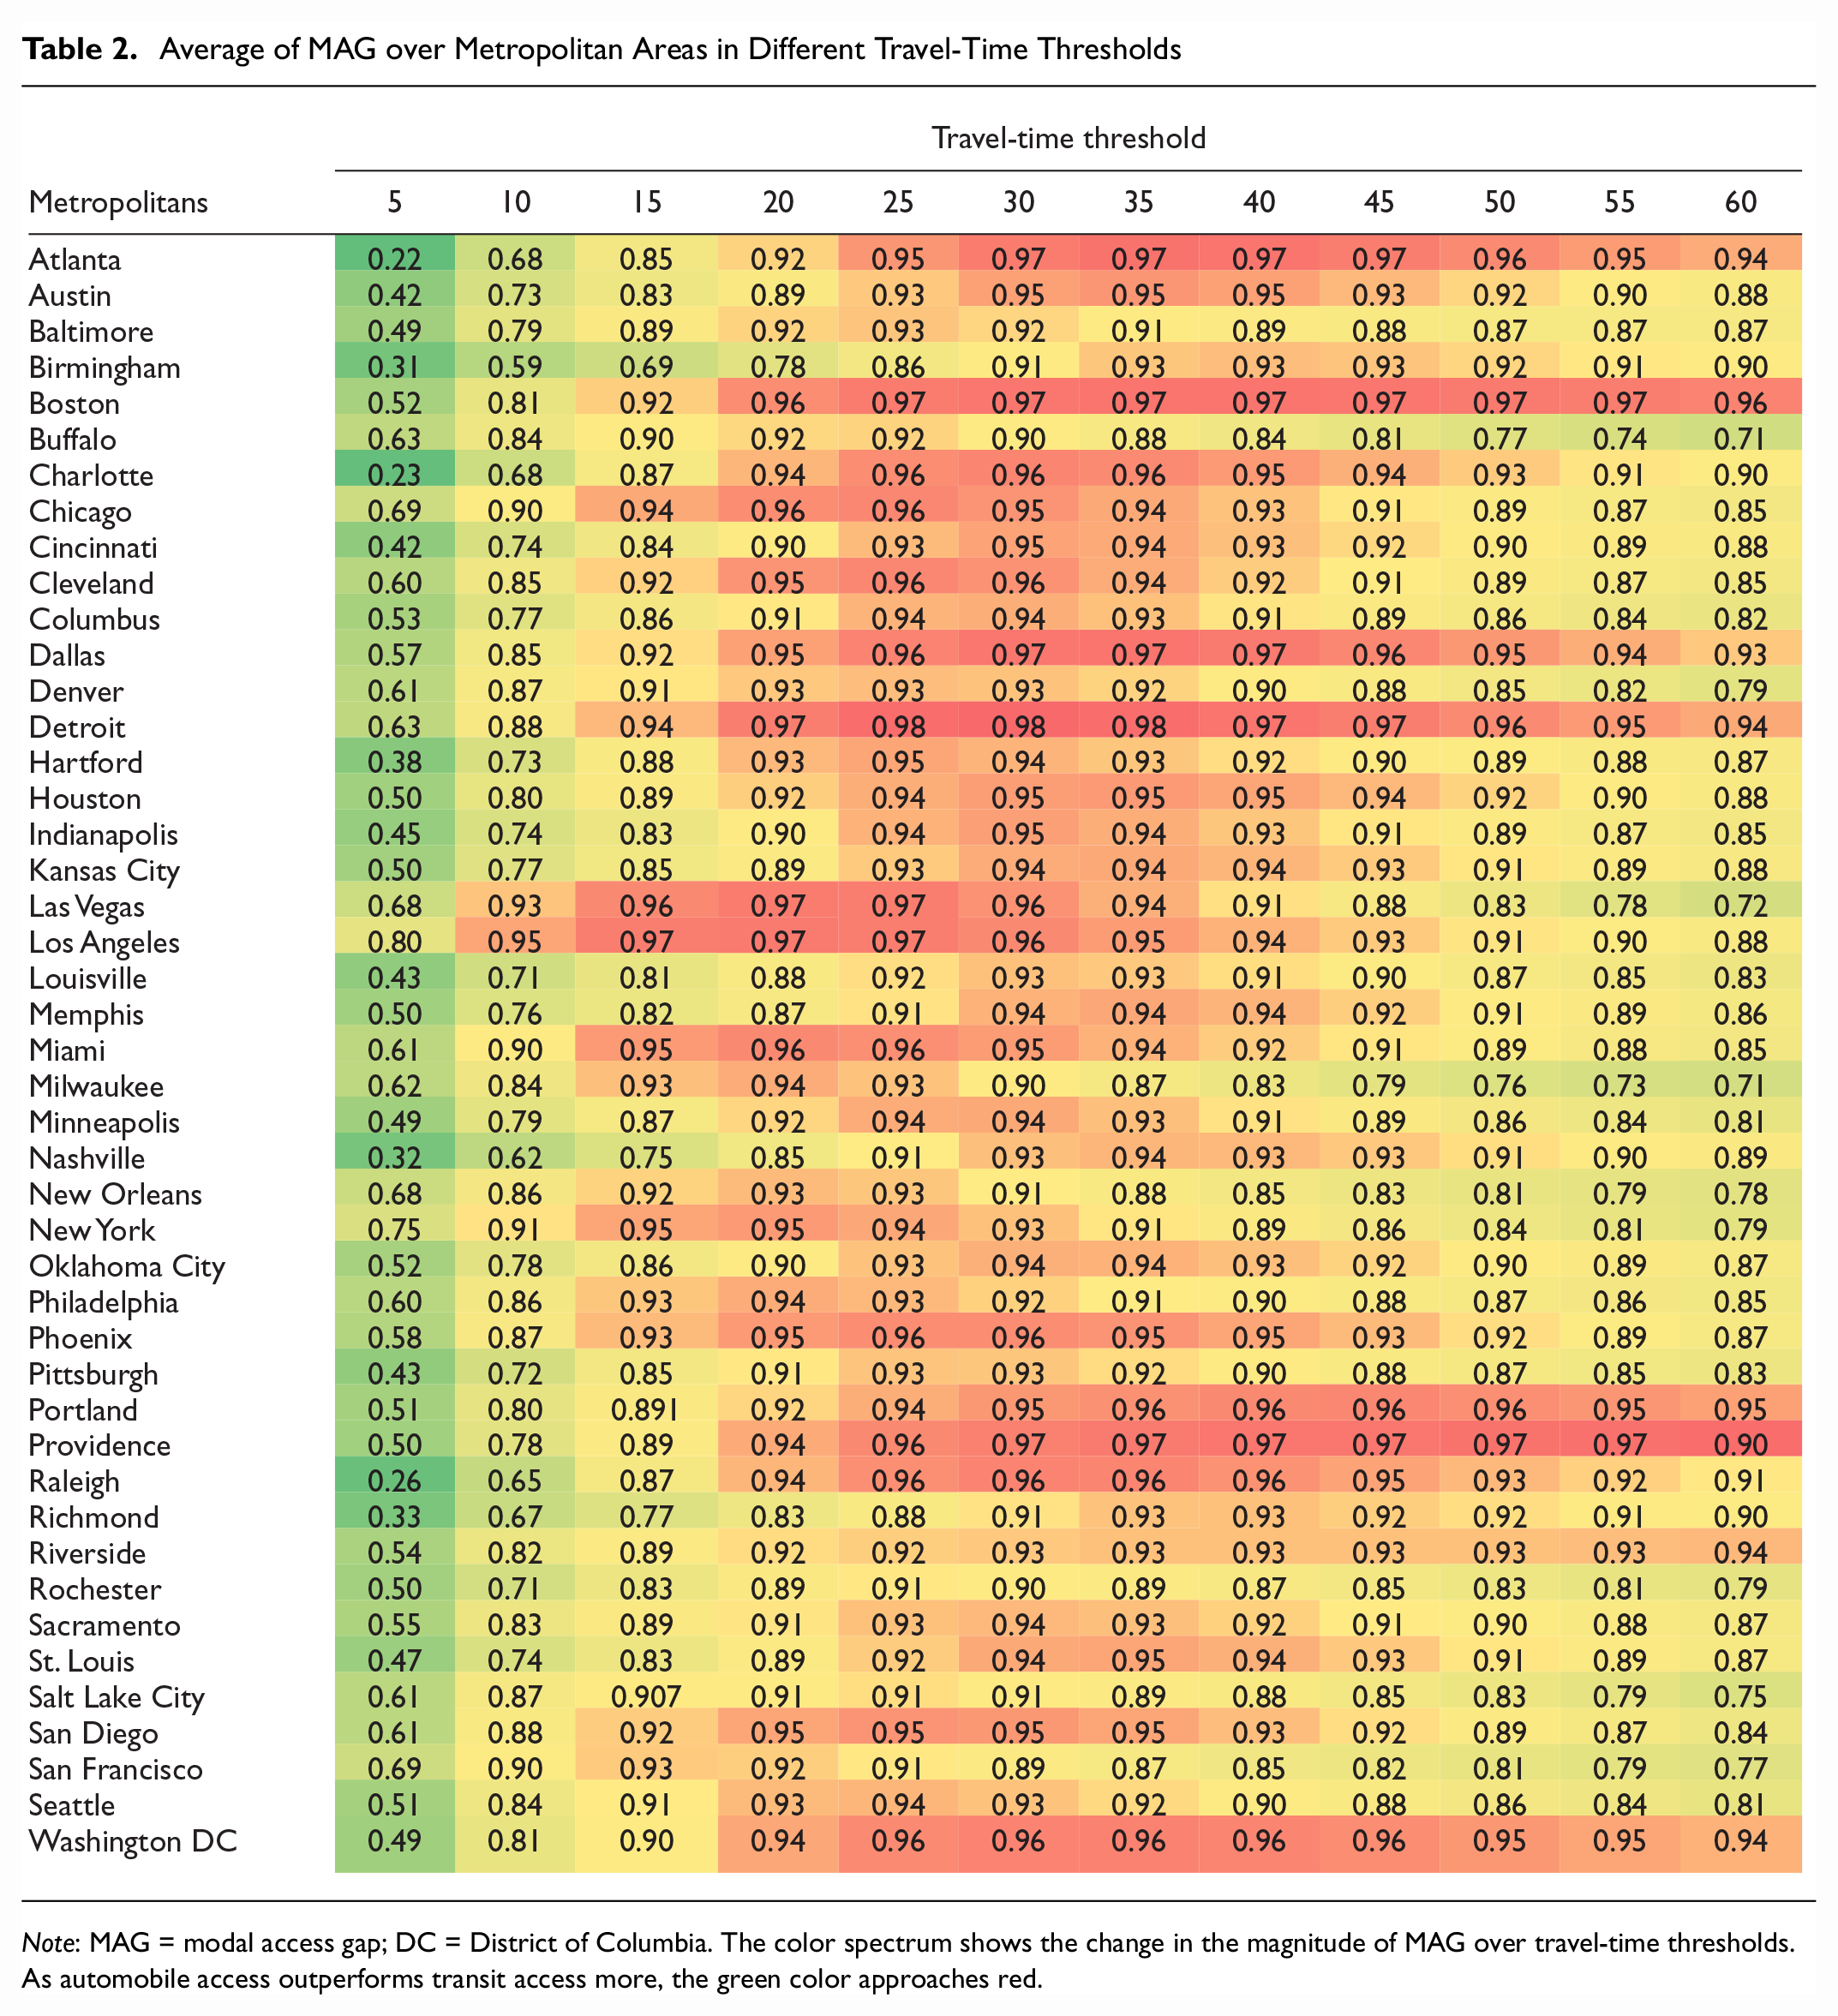
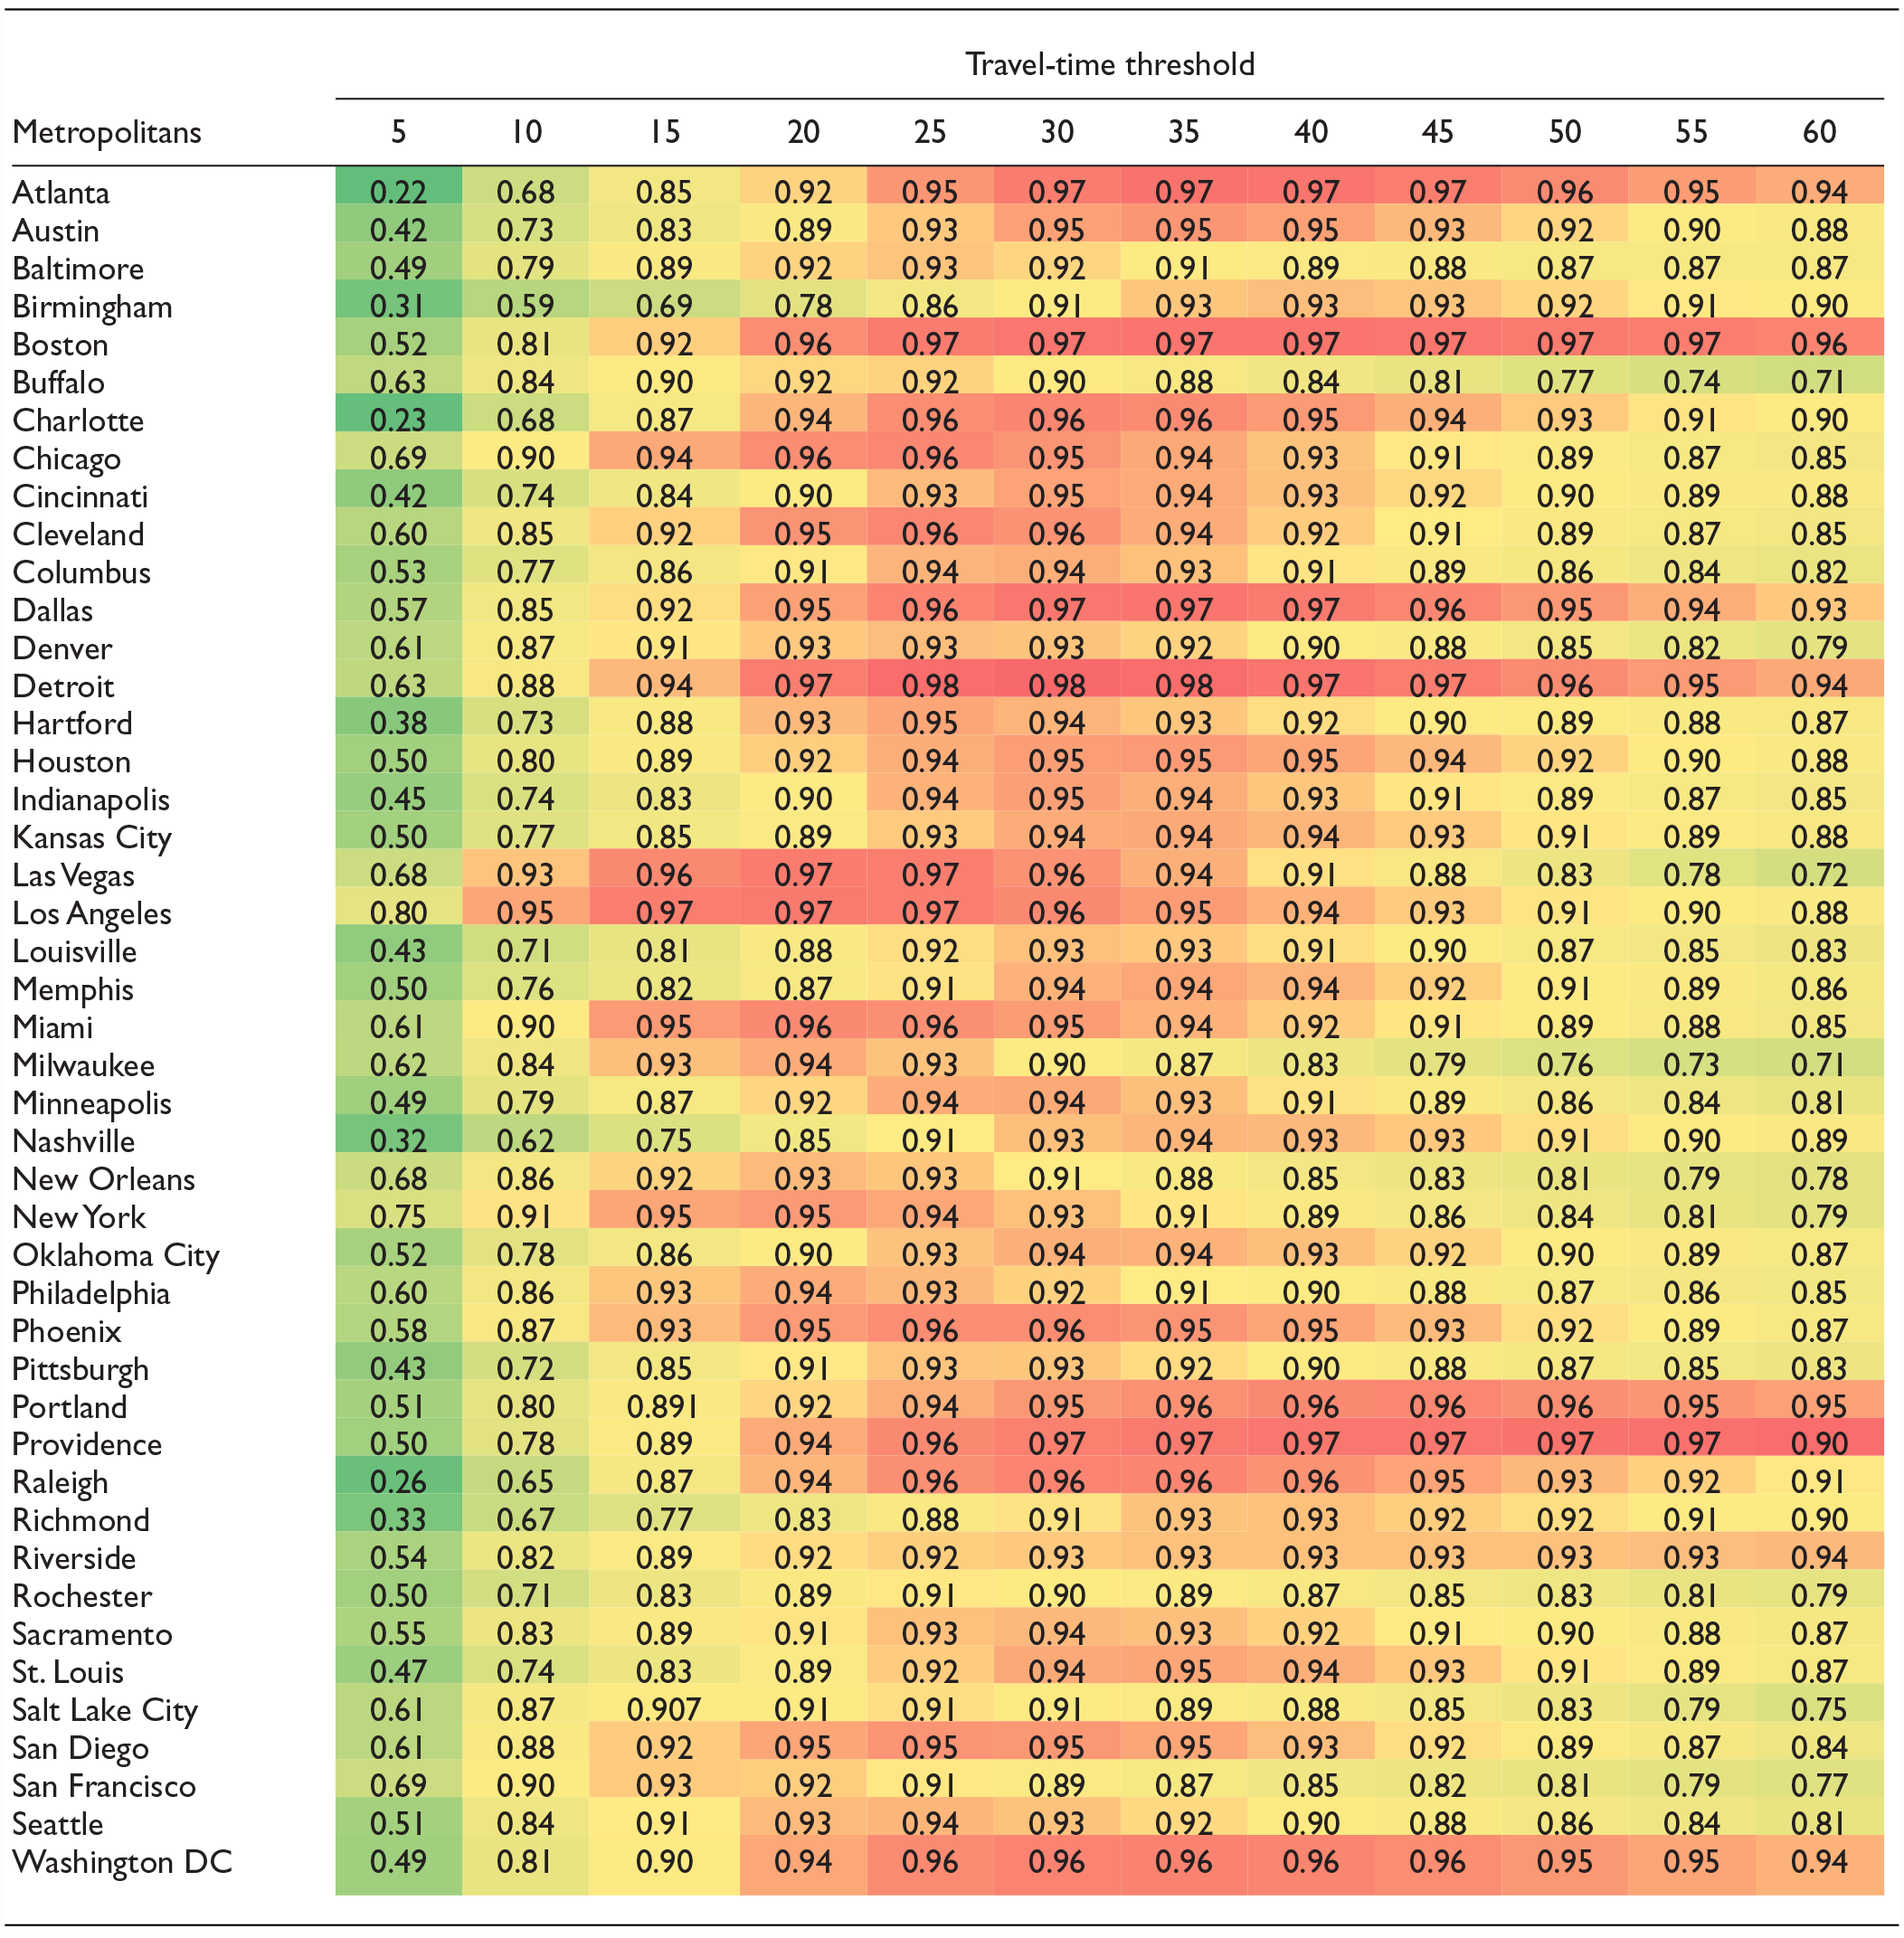
Note: MAG = modal access gap; DC = District of Columbia. The color spectrum shows the change in the magnitude of MAG over travel-time thresholds. As automobile access outperforms transit access more, the green color approaches red.
Our data shows MAG is positive regardless of the metropolitan area and travel-time threshold. This indicates transit trails automobile in offering access to employment opportunities in American metropolitan areas. We noticed three patterns of MAG variation over travel time. First, MAG values remain roughly the same after certain travel-time thresholds. These areas include Boston and Portland where the gap between transit access and automobile access remains large after surpassing certain travel times. Second, MAG values ascend. Examples are Providence and Riverside where travel-time increments make them more auto-access-oriented. Third, MAG values decline. This category composes most regions including Buffalo, Las Vegas, Milwaukee, New York, Philadelphia, Miami, Cleveland, Chicago, Baltimore, Salt Lake City, and San Francisco. Among metropolitan areas demonstrating this trend, New York, Philadelphia, Miami, Cleveland, Chicago, Baltimore, and San Francisco have extensive metro transit systems. We speculate that the increase in transit access in these areas could be a result of the competitiveness of metro systems with automobile in providing access at longer travel-time thresholds. Comparing MAG with previous research conducted in Boston and San Francisco metropolitan areas for a 30 min travel-time threshold we noticed an increase in MAG. Kawabata ( 35 ) reported MAG values of 0.75 and 0.78 for Boston and San Francisco, respectively, while our analysis indicates MAG equals 0.97 in Boston and 0.89 in San Francisco for the same travel-time threshold.
Spatial Diagnostic Test
To test the presence of spatial autocorrelation and select a proper spatial regression model, we used Moran’s I and the Lagrange multiplier (LM) test ( 43 ). The LM test includes LM lag and LM error components. The LM lag test determines whether the lagged dependent variable should be considered, and the LM error test determines whether the lagged residual should be included in the model. If both tests are significant then robust LM tests are undertaken. Here, if robust LM lag is more significant than robust LM error, spatial lag dependence is considered in the model while spatial error dependence is ignored. If, however, both the robust LM lag and robust LM error are significant, the model with the largest value of test statistic is chosen ( 44 ). As LM lag and LM error tests were significant in all the models, we looked at the robust LM lag and robust LM error test and chose the spatial model with a low p-value and largest t-statistic value. Results of spatial diagnostic tests are reported in Table A1 of Appendix A.
Following a specific-to-general strategy of model determination ( 45 ), we estimated the spatial lag model (SLM). SLM incorporates spatial dependence in the dependent variable, expecting that the observations of the dependent variable among neighboring areas are mutually dependent. Equation 4 represents the model:

where
Summary of Variables Used in the Study at the Block Group Level across 45 Metropolitan Areas
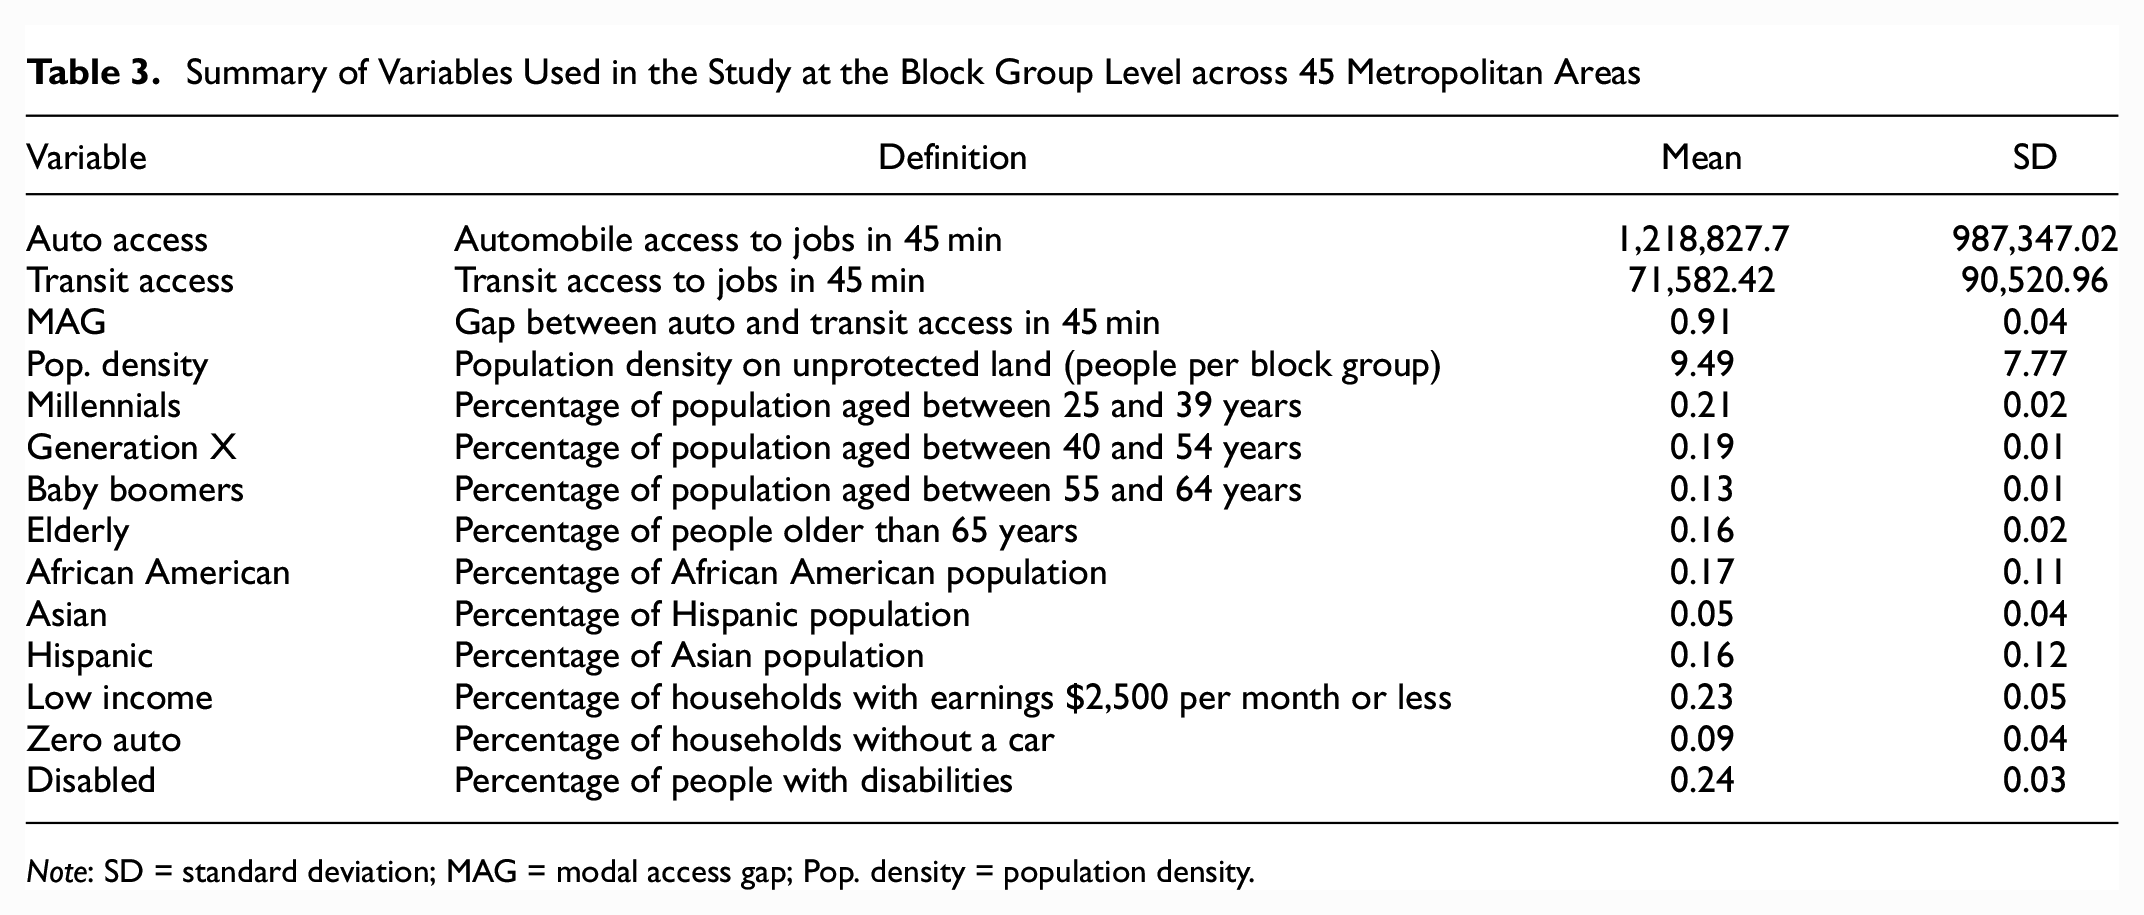
Note: SD = standard deviation; MAG = modal access gap; Pop. density = population density.
Bivariate Local Spatial Autocorrelation
A BiLISA analysis was performed in GeoDa software (
46
), where carless households were the observation variable and MAG was the lagged or neighboring value variable. The BiLISA identifies the extent of spatial clusters by computing the cross product of the standardized values of one variable at location

where
Results and Discussion
Spatial Variation of the MAG
Here, we discuss the results of the SLMs regressing MAG at a 45 min travel-time threshold against socioeconomic characteristics. The purpose of this model is to measure the spatial dependency between MAG and socioeconomic and demographic variables. We selected the 45 min travel-time threshold for our analysis as it is almost the average commute time by transit across America (
47
). We report both adjusted
Results of Spatial Lag Regression Model
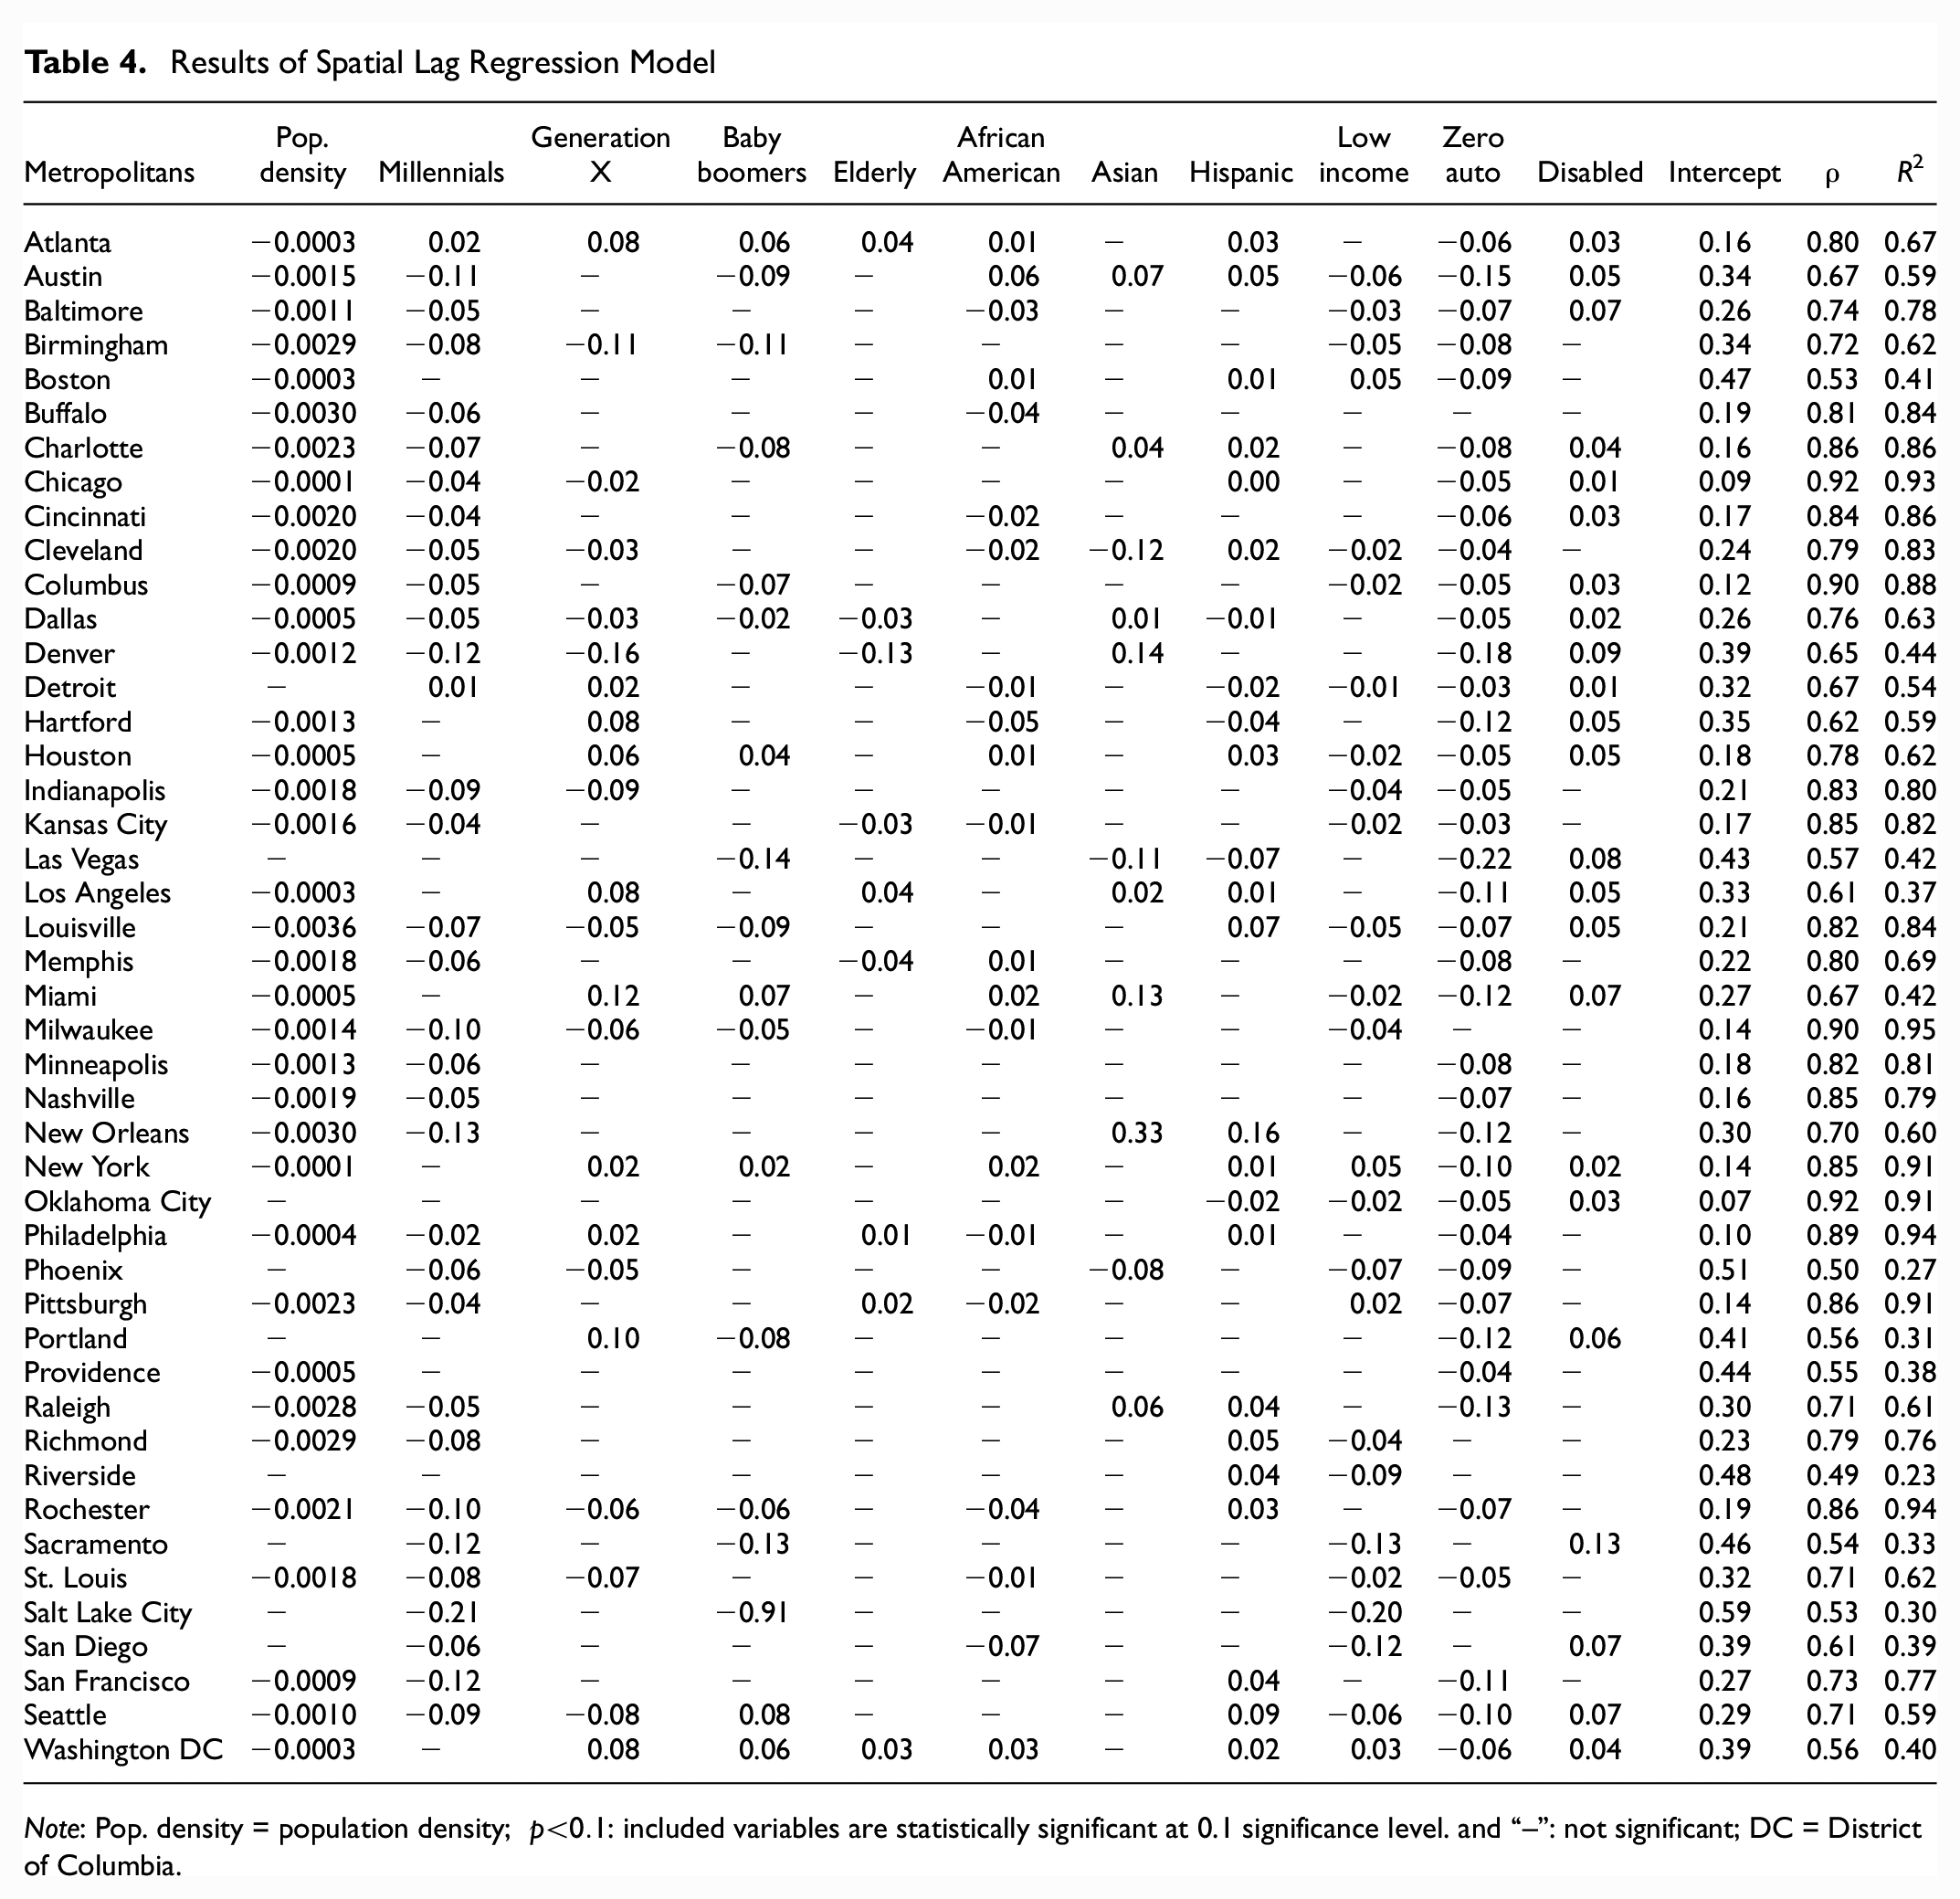
Note: Pop. density = population density;
Looking at the goodness-of-fit of models, it is noted that socioeconomic correlates of MAG explain its variation within metropolitan areas with a magnitude ranging from 0.23 in Riverside to 0.95 in Milwaukee. The spatial lag value is positive and has a similar value in adjacent metropolitan areas. For instance, Chicago and Milwaukee, with 0.90 and 0.92 respectively, have significant positive
Overall, we can conclude that in most of the American metropolitan areas transit underserves socially vulnerable cohorts including low-income, carless, and non-white populations. This conclusion raises a concern that transit development planning has failed to protect vulnerable communities in fragile or conflict-affected situations. Properly inhabiting the nexus between societal and infrastructural developments must be a primary means for governments to provide quick and direct support to affected underserved communities.
Spatial Clusters of Carless Households and MAG
Policies and plans to improve the equity of access are effective only if they are targeted at areas in need of improvement. Here, we use spatial cluster analysis to identify areas with a high rate of carless residences and a high MAG. Figure 1 depicts the results of the BiLISA analysis, where each metropolitan area is classified into HH, LL, LH, HL, and not significant regions. Figure 2 depicts a more detailed image for selected metropolitan areas with the highest (Detroit and Providence) and lowest (Milwaukee and Buffalo) MAG values in 45 min travel-time threshold.
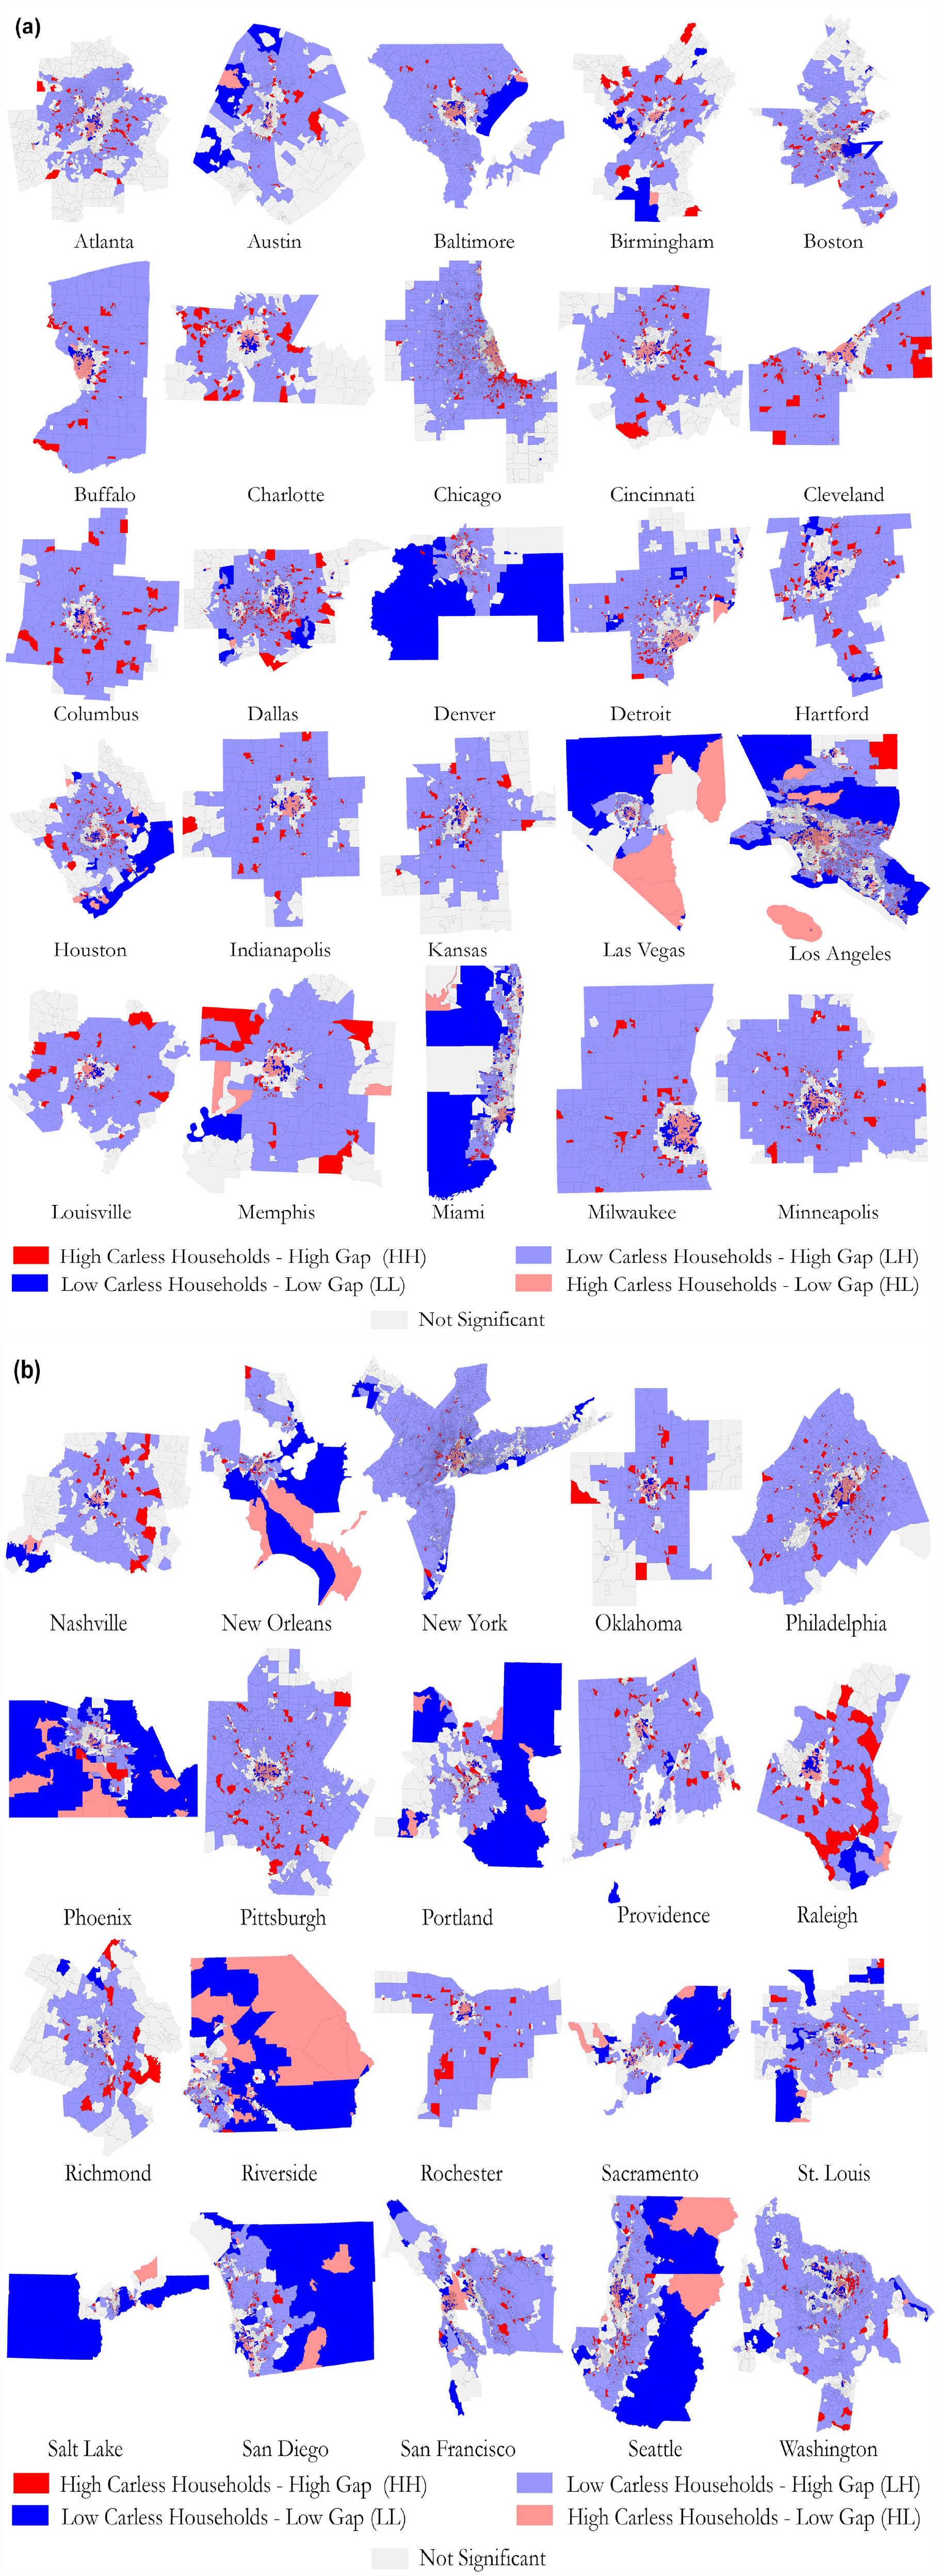
Spatial clusters of carless households and MAG in 45 min travel-time threshold across 45 metropolitan areas: (a) Atlanta to Minneapolis and (b) Nashville to Washington.
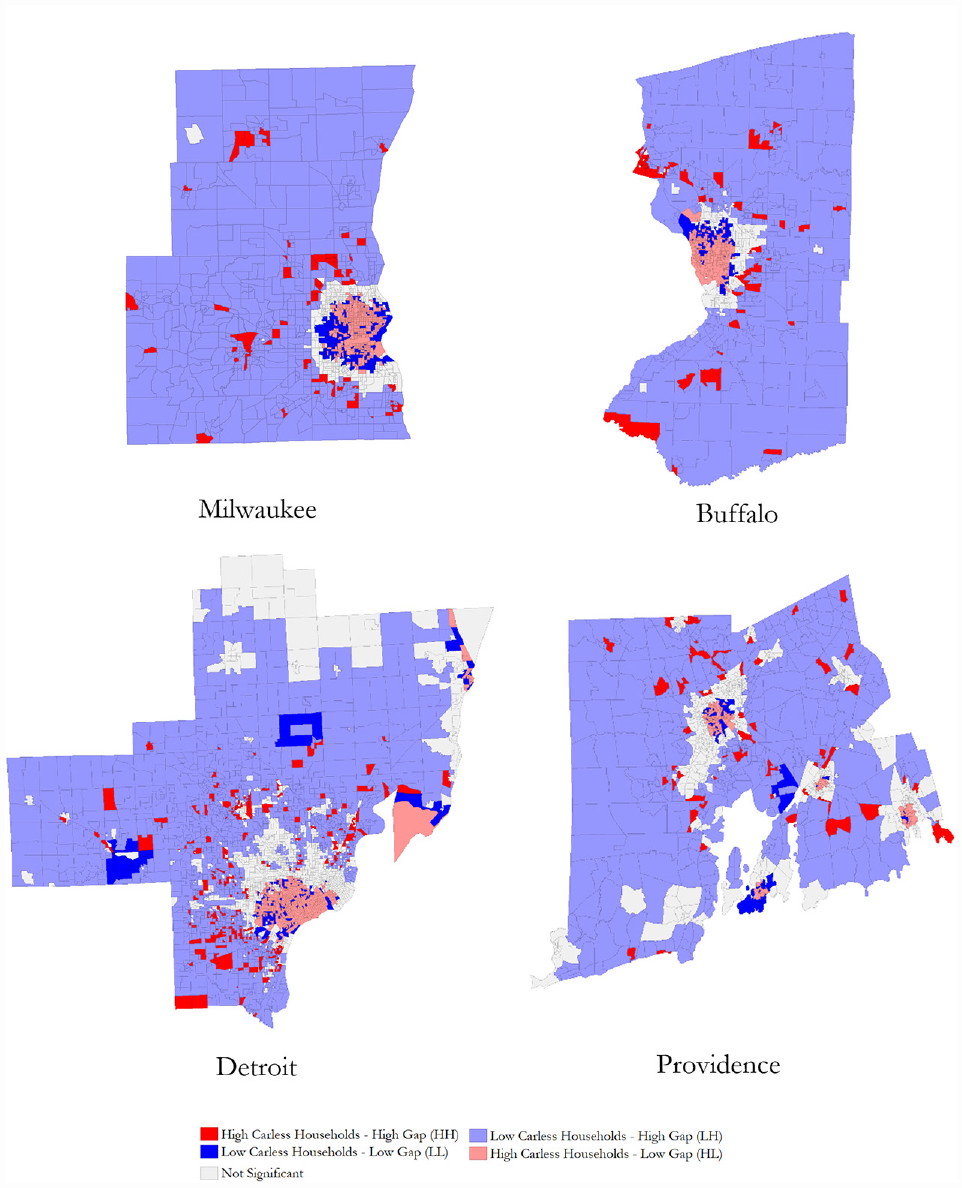
Spatial clusters of carless households and MAG in 45 min travel-time thresholds for metropolitan areas with the lowest (Milwaukee and Buffalo) and the highest (Detroit and Providence) MAG values.
From the visual inspection, we notice that metropolitan areas demonstrate distinct patterns of clusters both within and between metropolitan areas. While the predominant cluster within most metropolitan areas is the LH cluster, there are some exceptions such as Denver, Miami, and Portland dominated by the LL cluster, or Las Vegas, New Orleans Riverside, and Seattle with a prominent area covered with the HL cluster. The most noticeable similarity between metropolitan areas is the pattern in their central and suburban areas; metropolitans’ central areas mainly fall in HL and LL clusters. This means that MAG in city centers is usually small and closer to 0. Suburbs and exurbs, however, are mainly classified as HH clusters. Suburb and exurb residents experience low car ownership in addition to low transit access to employment and suffer from higher commuting costs, poor transit service, and limited information about distant job opportunities ( 50 ). The HH cluster regions are those in need of service improvement.
Inequity of MAG
Assuming that transit should be more accessible to socially vulnerable populations, we define inequity of MAG as the lack of transit service for the carless vulnerable population. Access improvement policies, depending on the metropolitan areas and their equity objectives, can be tailored for communities. Carless households living in HH clusters comprise different socially vulnerable populations including the elderly, African Americans, Hispanics, low-income households, and households with at least one individual with a disability. The percentage of each of these carless vulnerable populations affected by the high MAG is disproportionate and nonhomogeneous across the metropolitan areas. To prioritize equity plans, for each cohort separately, we calculate the share of the vulnerable population living in the HH cluster in proportion to the total population of the metropolitan area of the same cohort living outside the HH areas. Figure 3 ranks 45 metropolitan areas in descending order for the relative share of the socially vulnerable carless populations experiencing MAG inequity compared with the rest of the population. Results are reported for each cohort separately. Each category is compared with America’s national average. Metropolitan areas that are placed above the national average in each category indicate high inequity of MAG compared with those that fall below the national average.
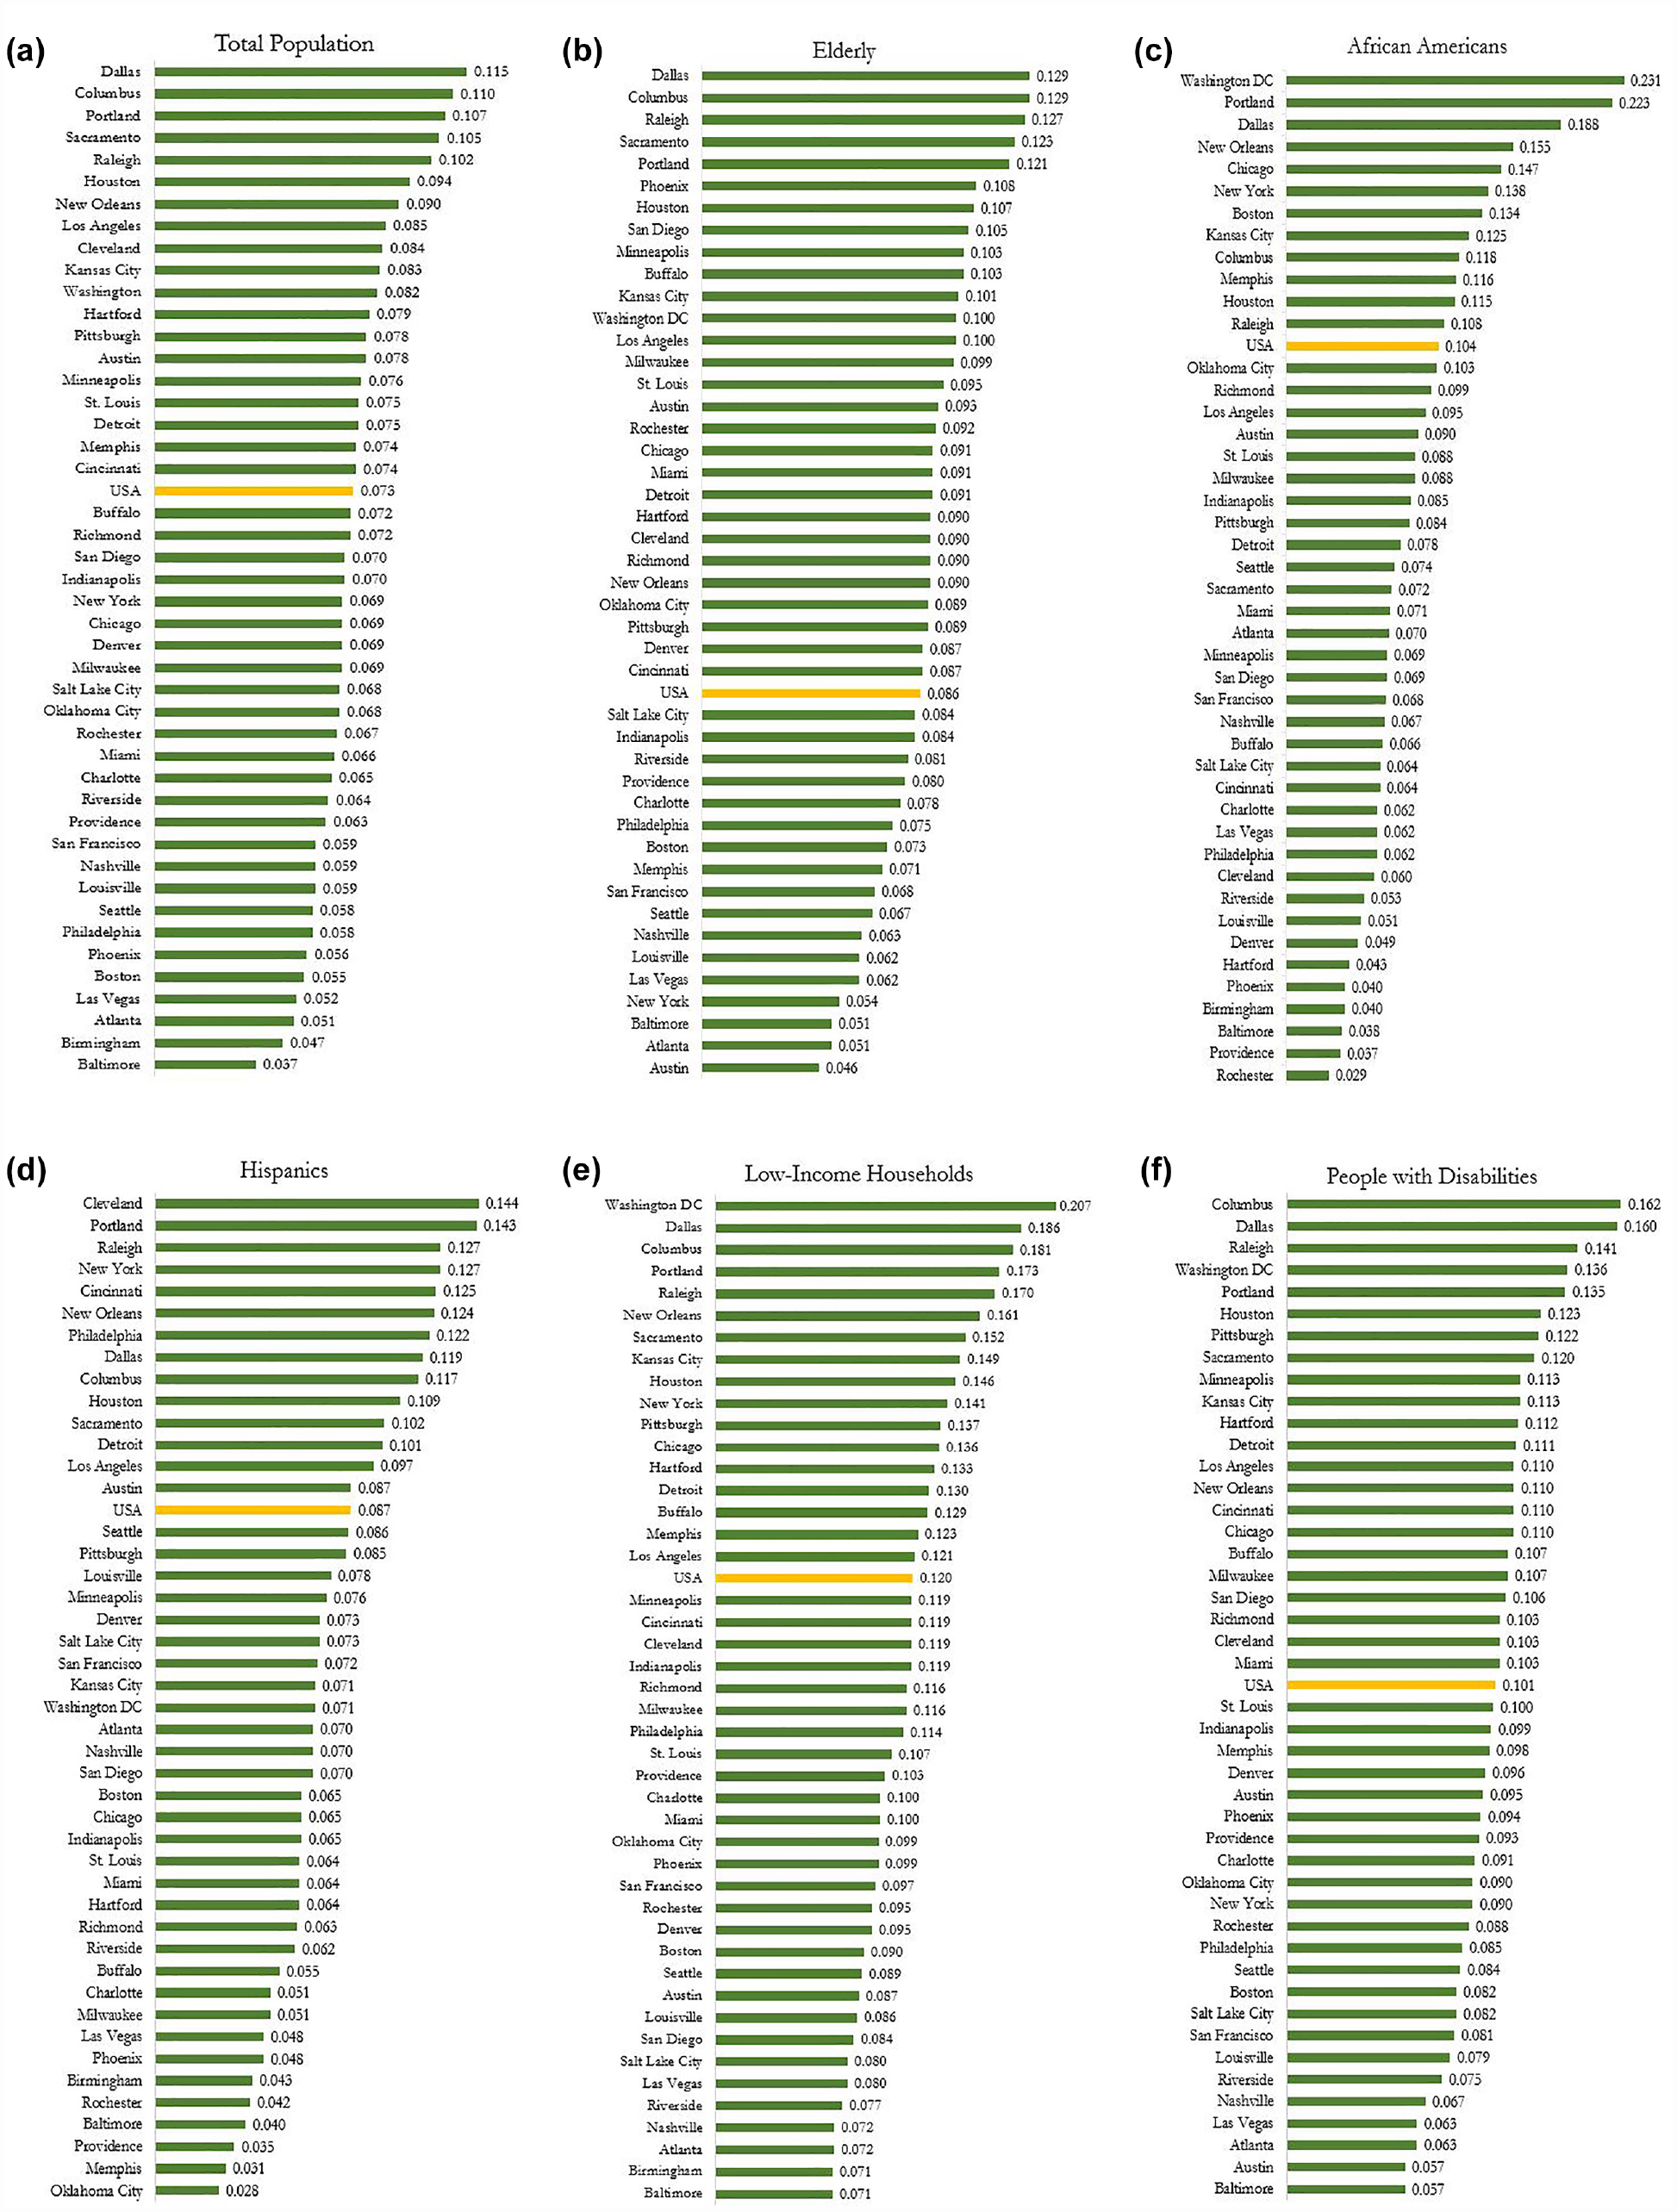
Ratio of the carless vulnerable population affected by inequity of the modal access gap illustrated per: (a) total population, (b) the elderly, (c) African Americans, (d) Hispanics, (e) low-income households, and (f) people with disabilities.
We look at the ratio of the population in HH areas to the total population in non-HH areas for all social cohorts. For the total population, the ratio ranges from 0.037 in Baltimore to 0.115 in Dallas, with an average national value of 0.073. This range varies between different social cohorts. The highest variation between metropolitan areas belongs to African Americans ranging from 0.029 in Rochester to 0.231 in Washington DC. African Americans residing in Washington DC also possess the highest ratio among all cohorts. This calls for attention and action to augment the equity of access for African Americans in America, particularly in Washington DC. On the flip side, carless Hispanics seem to be in a better condition and benefit from relatively better equity of access. For Hispanics, the ratio of the population in HH areas to those in non-HH areas has the narrowest range, varying from 0.028 in Oklahoma City to 0.144 in Cleveland. Hispanics living in Oklahoma City experience the lowest inequity of access compared with other social cohorts and the total population in America.
We also look at the metropolitan areas’ ranking between cohorts. Dallas, Columbus, Portland, Sacramento, and Raleigh are the top five metropolitans with the highest ratio of total population living in HH areas as opposed to non-HH areas. At the same time, the bottom five are Baltimore, Birmingham, Atlanta, Las Vegas, and Boston. It can be observed that Dallas and Portland remain among the top five in almost all social cohorts. This is an indicator of relatively higher inequity of access in these metropolitan areas than in others. Similarly, Baltimore and Birmingham constantly remain among the bottom five areas possessing the lowest ratios. This observation offers a snapshot of the inequity of access between American metropolitan areas. It suggests which metropolitan areas must prioritize equity objectives to improve their relative transit equity for carless households. The MAG disproportionately affects socially vulnerable populations, including the elderly, people with disabilities, low-income households, Hispanics, and African Americans. Compared with the national average, access inequity is prevalent for the elderly in 27 metropolitan areas, for people with disabilities in 22, for low-income households in 17, for Hispanics in 14, and for African Americans in 12.
Conclusions
The spatial composition of employment and residential locations in American metropolitan areas makes access to employment for carless households especially difficult ( 51 ). If the transit system fails to fill the gap between transit access and automobile access for carless households, a series of economic, social, and transport problems arise. Urban transport policies and plans neglecting the importance of transit access may increase the gap between transit and automobile access. An increased MAG degrades transit service, making it an unfavorable mode of travel and putting more strain on socially vulnerable populations. To prioritize and justify transit investments, areas needing service improvement have to be identified ( 52 ). Mere area identification may not be enough for targeted plans and policies. This identification must seek to mitigate inequities by recommending equitable transport policies. Recommendations, however, often lack specificity and are rarely beneficial for the populations in need. This, in part, is a result of the focus on mobility measures of access for equity assessment rather than associating equity with group-specific consequences. Deficient transport infrastructure, for instance, undermines the government’s equity objectives in improving employment, education, welfare, and health for citizens ( 53 ). This calls for a shift in focus from merely measuring access concerning sufficiency to extending it to differences in human demographics and socioeconomic features ( 54 ). A detailed assessment of access for particular populations can unmask within-group variations while appealing to the critical question of what constitutes a sensible standard of access for the whole society with the populations’ distinct traits and needs ( 55 ). It is, therefore, important to offer targeted policies and plans to improve transit service based on the demographic and socioeconomic characteristics of the affected people. Urban transport policies could have a wide range of impacts. They may even pose social challenges where they are incommensurable and could affect communities differently ( 56 ). Measuring the MAG concerning the socioeconomic characteristics of communities can be a useful determinant for equity of access and can eventually lead to more equitable transit service development.
This study explored how the modal access gap between transit and automobile could be used to evaluate the spatial equity of access for socially vulnerable communities across the 45 most populated American metropolitan areas. In retrospect, we summarize the principal understandings from our research to overcome the colossal inadequacy of public transit in America and offer urban policies for each finding. First, we examined socioeconomic correlates of the MAG. We concluded that socially vulnerable cohorts (e.g., low-income, carless, non-white populations) in most American metropolitan areas suffer from a high MAG. Population density, however, had a significant negative impact on MAG in all metropolitan areas. Second, we clustered metropolitan areas based on their share of carless households and MAG. In suburb and exurb regions of all metropolitan areas we noticed scattered areas with a concentration of carless households suffering from a lack of equitable transport options. Detecting these areas can be taken as a potential approach for future equitable transit improvement plans. These areas might also benefit from land-use zoning and regulations to attract new opportunities; increasing economic opportunities or workforce development and manipulating effective land-use plans in areas further away from the city center will improve access in transit desert areas. Third, different metropolitan areas and communities are disproportionately affected by the high MAG across metropolitan areas. In general, Dallas, Columbus, and Portland have the highest share of the population living in transit desert areas, while this share in Atlanta, Baltimore, and Birmingham is the lowest. Specific to communities, carless populations, and African Americans are greatly affected by MAG inequity, while the elderly and Hispanics are less affected. Equitable transit access plans can be further advanced by prioritizing metropolitan areas in need of service improvement or focusing on populations suffering from MAG inequity.
This study sought to instill social equity into transport planning strategies. This approach can be used for planning in areas needing service improvement through long-term and short-term planning. Short-term plans could focus on increasing transit services’ temporal availability in particular areas. This can be achieved through increased frequency and regularity of headways, especially when transit is in high demand. Long-term plans could be focused on increasing the spatial availability of service. This can be achieved by adding transit routes, building new stations, and increasing the number of fleets. However, this approach can be augmented as this study had some limitations. First, we only used access to employment opportunities to measure the MAG. This does not provide inclusive information on how populations may suffer from the inequity of the MAG when accessing other important destinations, including hospitals and schools. Future studies can also compare the spatial equity of the MAG for non-employment destinations, particularly health and education services. Second, we defined low-income households as those with income equal to or less than $2,500 per month. The definition of low income could vary depending on the state. We suggest that future studies define the low-income margin exclusive to each state. Third, future work could also benefit from measuring MAG using observed transit travel times ( 57 ). This approach could be beneficial in assessing transit service with a more accurate yet equitable view.
In response to concerns about meeting the needs of socially vulnerable communities, governments and decision-makers often enact policies to rectify inequity. In the transport context, access has the potential to address equity challenges. When evaluating a transport system, the number of opportunities people can reach within a specific time threshold can be measured as an equity indicator. It will then be possible to assess whether people in socially vulnerable communities experience better or worse access than the general population. If access is low for socially vulnerable populations, there is an equity concern. A well-designed transit system should provide equitable levels of access based on the needs of the populations being served, especially those traditionally underserved. The U.S. Department of Transportation has proclaimed that it will follow a program aimed at increasing access to transit for all with a focus on “racial,”“underserved,”“overburdened,” and “disadvantaged” communities ( 58 ). Despite enacted policies and financial efforts, the full inclusion of equity in transport planning and practice has not yet been achieved. Government is not solely to blame, as this can also be associated with transport planning and urban design in American metropolitan areas. Post-war urban development patterns have contributed to residential stratification and decentralized accommodation in American cities. This spatial dispersion also underpins employment. The composition of centralized employment and transit with decentralized residential areas makes accessing employment without a car difficult, particularly for vulnerable communities. To fully engage equity in transport goals, more exploratory rather than mere formal processes are needed. This might be achieved by pushing forward the idea of equitable access to opportunities in research in parallel with governmental efforts (59, 60). This study is a step toward achieving this goal.
Supplemental Material
sj-docx-1-trr-10.1177_03611981231171914 – Supplemental material for Spatial Inequity of Transit and Automobile Access Gap across America for Underserved Population
Supplemental material, sj-docx-1-trr-10.1177_03611981231171914 for Spatial Inequity of Transit and Automobile Access Gap across America for Underserved Population by Sanju Maharjan, Fatemeh Janatabadi and Alireza Ermagun in Transportation Research Record
Footnotes
Author Contributions
The authors confirm contribution to the paper as follows: study conception, design, and supervision: A. Ermagun; data collection: S. Maharjan; analysis and interpretation of results: F. Janatabadi, and A. Ermagun; draft manuscript preparation: F. Janatabadi, A. Ermagun, and S. Maharjan. All authors reviewed the results and approved the final version of the manuscript.
Declaration of Conflicting Interests
The author(s) declared no potential conflicts of interest with respect to the research, authorship, and/or publication of this article.
Funding
The author(s) received no financial support for the research, authorship, and/or publication of this article.
Supplemental Material
Supplemental material for this article is available online.
References
Supplementary Material
Please find the following supplemental material available below.
For Open Access articles published under a Creative Commons License, all supplemental material carries the same license as the article it is associated with.
For non-Open Access articles published, all supplemental material carries a non-exclusive license, and permission requests for re-use of supplemental material or any part of supplemental material shall be sent directly to the copyright owner as specified in the copyright notice associated with the article.