
Abstract
The leading pedestrian interval (LPI) provides pedestrians with a head start to cross intersections before vehicles, enhancing safety by improving pedestrian visibility and increasing driver awareness. While effective, the LPI reduces vehicle signal duration and can lead to longer delays, potentially causing driver resistance. To mitigate these challenges, some countries restrict LPI implementation to No-Turn-on-Red environments, because allowing Right-Turn-on-Red (RTOR) may exacerbate conflicts between pedestrians and vehicles. This study investigates the operational impacts of LPIs at intersections where RTOR is permitted, focusing on right-turn vehicle delay and user acceptance. Microscopic traffic simulation was used to model delays under LPI conditions at selected intersections in Changwon-si, South Korea. In addition, a roadside survey was conducted to assess delay tolerance among regular users of these intersections. The simulation results show that LPI-related delay varies depending on intersection geometry and the proportion of right-turning traffic. In one case, LPI implementation was associated with lower vehicle delay at a site with high pedestrian volume. Survey responses indicated that most participants were willing to tolerate up to 10 s of additional delay. These findings highlight the need to consider site-specific traffic characteristics and user acceptance when implementing LPIs in RTOR environments.
Introduction
As the demand for sustainable transportation grows, ensuring pedestrian safety has become a critical priority. Traffic control devices play a vital role in mitigating crashes; however, their effectiveness is often limited by their reliance on voluntary driver compliance ( 1 ). A significant challenge at intersections arises when drivers decide whether to turn right at a red signal, despite the legal obligation to yield to pedestrians ( 2 ). Therefore, the leading pedestrian interval (LPI) has emerged as an effective countermeasure to reduce conflicts between pedestrians and vehicles ( 2 – 5 ). The LPIs enhance pedestrian safety by increasing pedestrian visibility and alerting drivers to their presence, granting pedestrians a head start to begin crossing before vehicles are permitted to turn ( 1 , 3 , 6 , 7 ). In general, the pedestrian phase of an LPI is from 3 to 7 s, varying according to local requirements ( 2 , 7 – 9 ). This early crossing opportunity aligns with the principle of temporal separation, which is widely regarded as an effective strategy for minimizing pedestrian–vehicle conflicts at signalized intersections. By reducing the temporal overlap between pedestrian phases and vehicle movements, the LPIs enhance visibility and create safer crossing conditions ( 6 , 7 ).
Right-Turn-on-Red (RTOR) policies, which allow vehicles to make right turns at red signals, are commonly implemented to improve traffic efficiency ( 10 ). However, RTOR can significantly increase the risk of pedestrian–vehicle conflicts, particularly when high pedestrian activity coincides with right-turn traffic ( 11 ). To mitigate these risks, some countries only allow No-Turn-on-Red (NTOR), especially at intersections where pedestrian safety is a concern ( 7 , 12 ). Therefore, many international guidelines recommend against implementing LPIs at intersections permitting RTOR due to the elevated risks of pedestrian–vehicle conflicts ( 8 , 9 ).
Implementing LPIs poses additional challenges, such as their impact on traffic flow. The reallocation of signal time to prioritize pedestrian crossings can reduce the duration of green lights for vehicles, potentially increasing traffic congestion ( 2 , 12 ). One critical factor influencing the success of LPI implementation is the volume of right-turning traffic, especially at intersections where RTOR is allowed. High right-turn traffic volumes exacerbate delays caused by LPIs, increasing vehicle queues and reducing traffic flow efficiency ( 7 , 13 , 14 ). These delays can lead to driver frustration, reduced compliance with traffic signals, and negative perceptions of the LPI system. The operational challenges of LPIs are further amplified in RTOR contexts, where traffic efficiency is often prioritized over pedestrian safety. These issues underline the importance of assessing the relationship between right-turn traffic volumes and delays to maintain a satisfactory level of service (LOS) for drivers, ensuring the intended safety benefits for pedestrians.
In addition, despite its importance, the role of right-turning traffic volumes in LPI implementation remains underexplored in existing guidelines. The FHWA in the US recommends the implementation of LPIs at intersections with high pedestrian and turning vehicle volumes as part of the Manual on Uniform Traffic Control Devices (MUTCD) ( 7 , 9 ). Some cities, such as New York City, US, and Toronto, Canada, have implemented additional policies that prohibit RTOR with LPIs to minimize conflicts between pedestrians and vehicles ( 7 , 9 ). However, these guidelines lack clear and specific criteria for right-turn traffic volumes, resulting in inconsistent application across intersections. The absence of standardized thresholds for acceptable delays further complicates the decision-making process for traffic engineers and policymakers.
The effect of LPIs at intersections permitting RTOR remains a subject of considerable debate. Some studies have identified RTOR as a potential impediment to fully realizing the benefits of LPIs ( 2 , 7 , 12 , 15 ), others have demonstrated that LPIs can reduce pedestrian crashes even in the presence of RTOR by providing drivers with clearer visual cues of pedestrian activity ( 3 , 6 ). The effectiveness of LPIs with RTOR is further influenced by contextual factors such as traffic volume, pedestrian density, and enforcement measures ( 3 , 16 ). The conflicting findings highlight the necessity for context-specific evaluations to better understand the conditions under which LPIs are most effective in RTOR environments.
This study examines the effects of LPIs at RTOR intersections, specifically focusing on variations in right-turn traffic volumes. This study is conducted in Changwon, South Korea, a vehicle-centric city with a population of approximately 1 million. An RTOR is standard practice in transportation systems across South Korea; however, Changwon has been piloting LPI systems at several intersections since 2020. This study aims to address the following research questions: (1) How does the delay introduced by LPIs at RTOR intersections vary with right-turn traffic volumes?; (2) What levels of delay are acceptable to drivers in these settings?; and (3) What threshold values of right-turn traffic volume ensure the effective implementation of LPIs at RTOR intersections?
To answer these questions, traffic flow simulations and delay analyses were conducted at selected LPI intersections in Changwon, South Korea. In addition, a roadside survey was administered to assess driver acceptance of delays caused by LPIs. Based on the findings, this study provides recommendations for right-turn traffic volume thresholds in the study areas and offers insights into the implementation of LPIs within RTOR systems.
Methods
This study employs a microscopic simulation approach to model vehicle flow within urban road networks, enabling detailed analyses of traffic scenarios and the evaluation of short- and long-term road network improvements. Microscopic simulation-based techniques are effective for assessing traffic conditions and testing potential interventions ( 17 ). The PTV VISSIM software (Version 2022) was utilized as the primary simulation tool.
Figure 1 shows the research workflow used in this study to evaluate the effects of LPIs at RTOR intersections. The process begins with field data collection and classification of intersections based on geometric characteristics. The model calibration and validation steps ensure that simulated traffic volumes and travel times align with field observations. Once validated, the model is used to run simulations across various right-turn traffic percentage scenarios. The results are analyzed to assess vehicle delays and traffic congestion levels, complemented by a roadside survey to capture driver perceptions of delay. Finally, the findings contribute to the development of guidelines for acceptable levels of service and inform recommendations for LPI implementation at RTOR intersections.
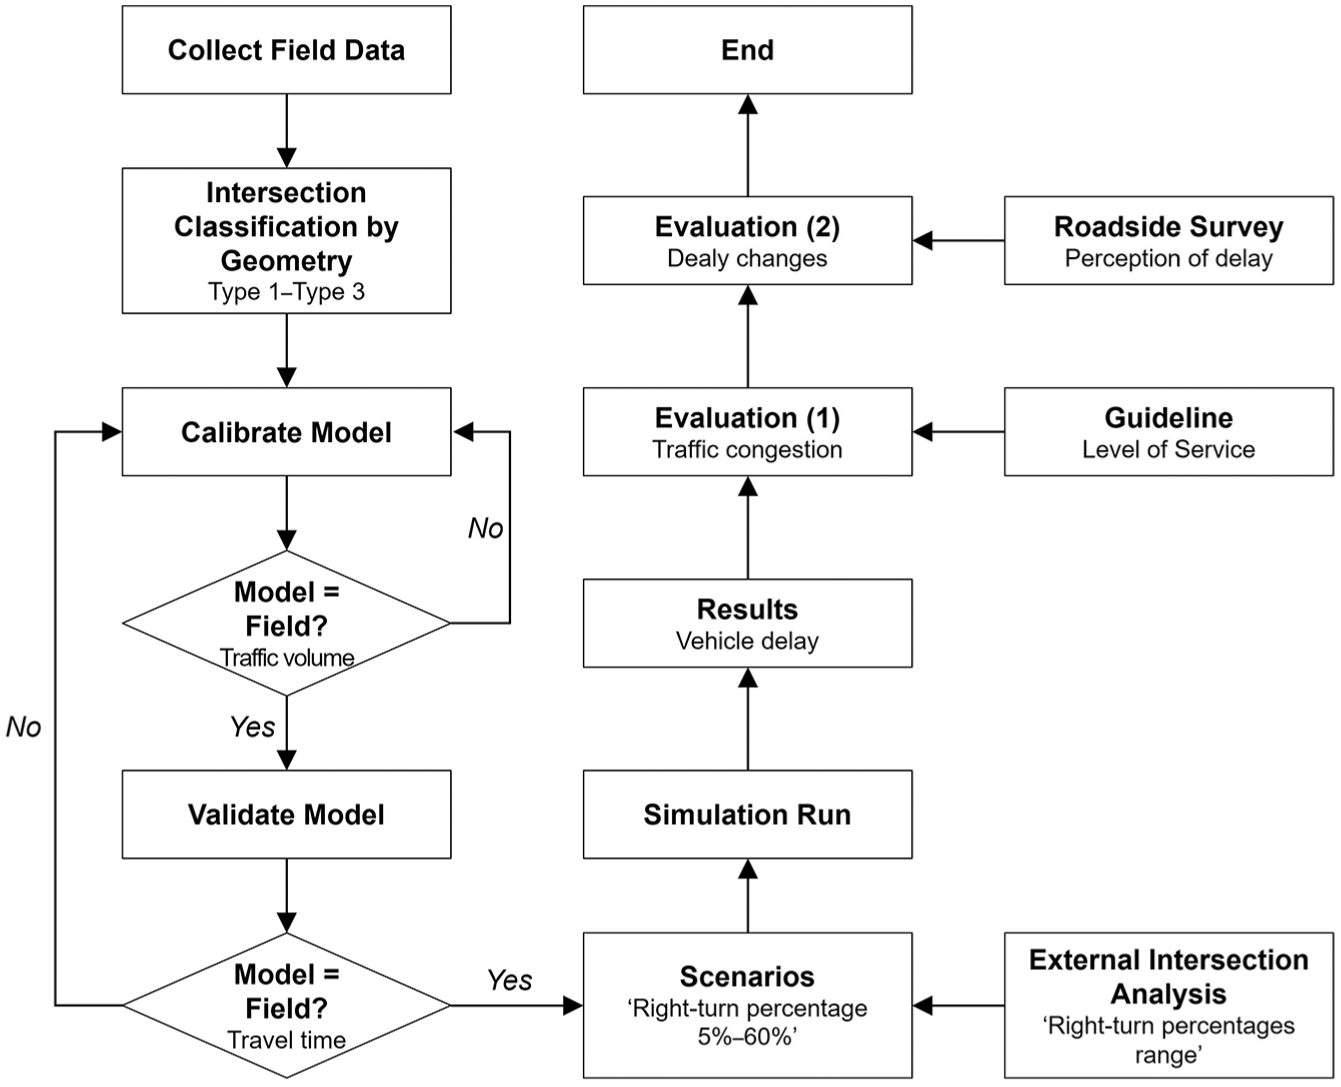
Research workflow for evaluating leading pedestrian interval Right-Turn-On-Red intersections.
Study Area and Data Collection
This study was conducted in Changwon, South Korea, a city at the forefront of LPI implementation since 2019. As of November 2023, the Korea Road Traffic Authority (KOROAD) reported that 99 out of 1,156 signalized intersections in Changwon were equipped with LPI functionality. Satellite imagery from the V-World platform, provided by the Korean Ministry of Land, Infrastructure and Transport, was used to obtain accurate geometric data on these intersections. Additional details, such as traffic volumes, were obtained from on-site field surveys and operational records from the Changwon City Traffic Information Center. Before data collection, the research team secured Institutional Review Board approval from the corresponding author’s university to ensure compliance with ethical standards.
At the time of this study, none of the selected intersections had formal NTOR restrictions. In South Korea, RTOR is typically permitted unless explicitly restricted. The national traffic signal manual does not specify a standardized NTOR sign. Although red right-turn arrow signals were introduced in 2023 to clarify right-turn control, their implementation was rare and not present at any of the study sites. In addition, an amendment to the Enforcement Rules of the Road Traffic Act took effect in January 2023, requiring drivers to come to a complete stop before turning right at a red light. However, this regulation does not constitute a formal NTOR condition. All LPI operations in this study therefore functioned under permitted RTOR conditions.
Criteria for Intersection Selection
The selection process considered the duration of LPI operation, the purpose of LPI deployment, and whether an LPI was addressing specific traffic safety issues. Intersections were included only if they had operated LPIs for at least 2 years to ensure that driver behavior had stabilized. In Changwon, where LPI deployment is still in its early stages, the city has adopted a selective implementation strategy by applying LPIs to only one approach per intersection. Each LPI was installed on the approach identified as the most critical conflict point by local police authorities. Of the 31 early-implemented LPI intersections in Changwon, 23 were excluded because they primarily addressed unprotected left turns. The remaining eight intersections were then assessed using the LPI worksheet developed by the City of Toronto ( 7 ). This tool evaluates factors such as abnormal geometric structures, large turning radii, and poor pedestrian visibility ( 2 ). Other considerations included downhill gradients, Y-shaped intersections with obtuse angles, and limited pedestrian waiting areas. After these reviews, six intersections were deemed suitable for this study (Table 1).
Geometric and Traffic Characteristics by Intersection Type
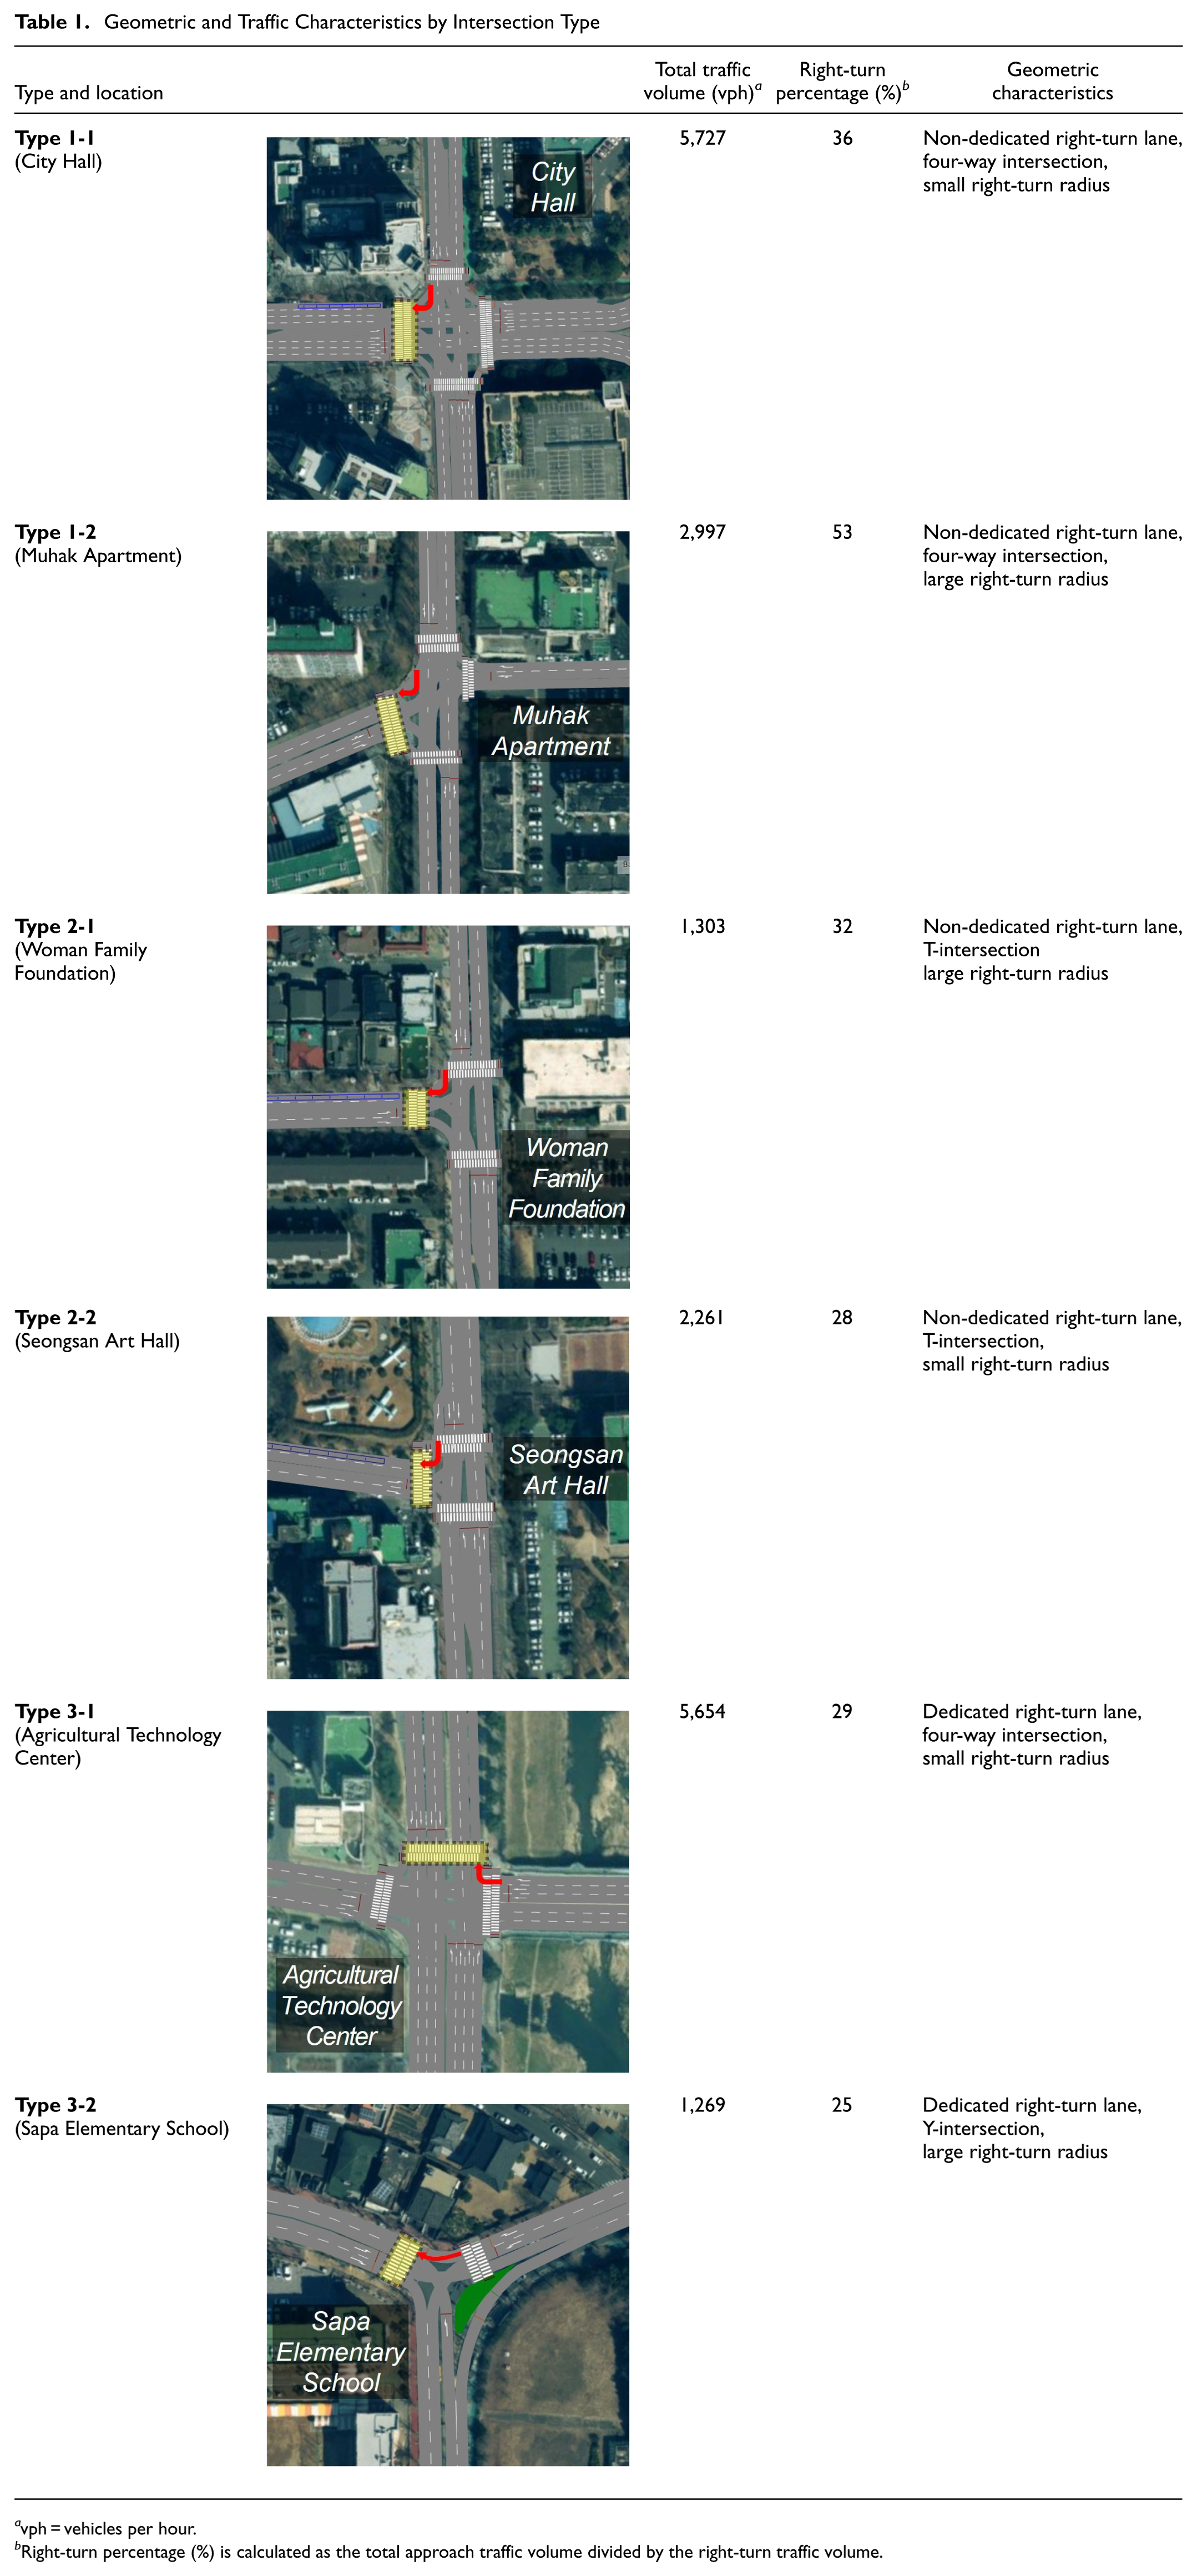
vph = vehicles per hour.
Right-turn percentage (%) is calculated as the total approach traffic volume divided by the right-turn traffic volume.
Geometry and Traffic Characteristics of the Studied Intersections
The six selected intersections were classified into three geometric types, each potentially affecting driver’s behavior and traffic flow.
Type 1: Four-way intersections without a dedicated right-turn lane, where right-turning vehicles merge into through traffic, causing greater signal time losses and longer queues ( 9 ).
Type 2: T-intersections with a high risk of pedestrian collisions when vehicles turn right without a dedicated right-turn lane ( 2 ).
Type 3: Four-way or Y intersections with a dedicated right-turn lane, which can reduce congestion by separating right-turning vehicles from through traffic ( 15 ).
Key inputs for the simulation model—such as lane widths, speed limits, turning radii, and turn lane configurations—were sourced from field surveys and KOROAD traffic signal records. All intersections permitted RTOR, allowing vehicles to turn right at a red signal. In addition, the model accounted for specific on-site conditions, including illegal parking that forces right-turning vehicles into inner lanes, as observed at the Type 2-1 intersection. In addition, although Type 2-2 was classified as a T-intersection without a dedicated right-turn lane, field observations showed that some drivers occasionally used the lateral clearance near the curb, which was marked as a bicycle lane to turn right when the vehicle queue was short. To reflect this behavior, a right-turn link was added in the VISSIM model.
Data Collection
Traffic volume counts were carried out at the six intersections on a single typical weekday in September 2023, avoiding adverse weather and unusual traffic conditions. Observations were conducted during three peak periods: (1) AM peak hour (08:00–09:00 a.m. [APH]); (2) midday hour (noon–01:00 p.m. [MH]); and (3) PM peak hour (06:00–07:00 p.m. [PPH). Pedestrian and vehicle volumes from the hour of highest pedestrian traffic were used to generate simulation scenarios (Table 2). Traffic signal parameters—cycle length, signal splits, and offsets—were verified against operational data from KOROAD. The LPI durations were set to 4 or 5 s, depending on the intersection.
Pedestrian and Vehicle Traffic Characteristics at Study Intersections
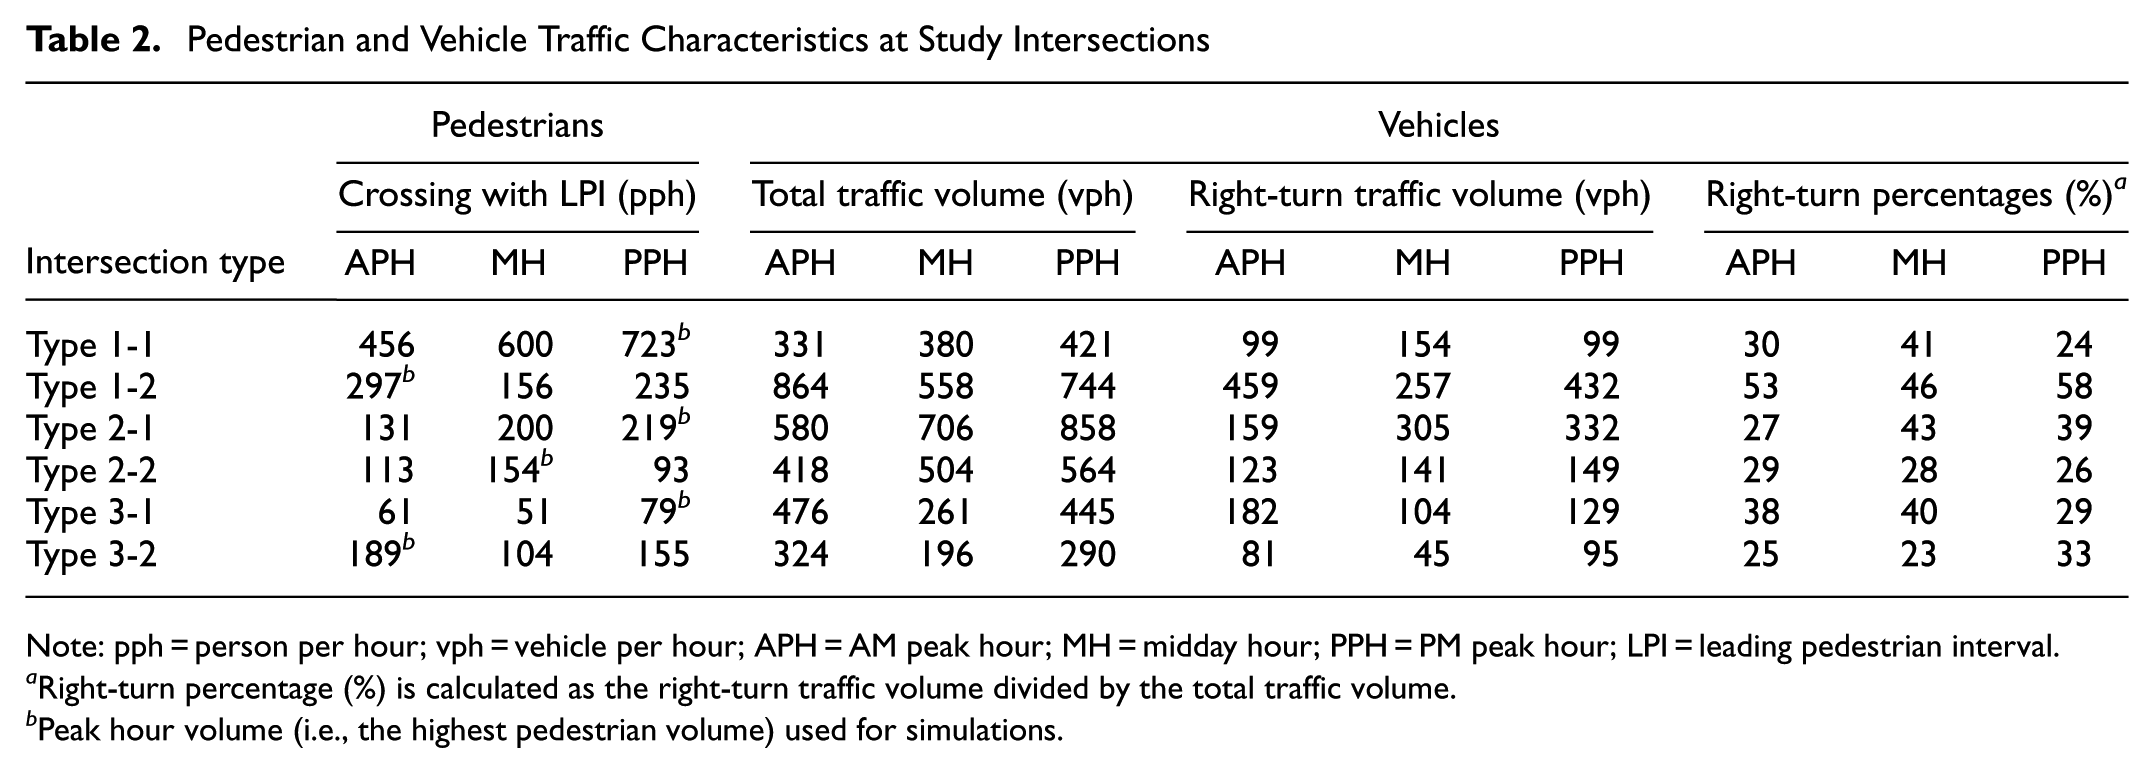
Note: pph = person per hour; vph = vehicle per hour; APH = AM peak hour; MH = midday hour; PPH = PM peak hour; LPI = leading pedestrian interval.
Right-turn percentage (%) is calculated as the right-turn traffic volume divided by the total traffic volume.
Peak hour volume (i.e., the highest pedestrian volume) used for simulations.
Survey Procedures
To account for potential differences between driver perceptions of delay and objective LOS measures, a roadside survey was conducted in Changwon among individuals who frequently use intersections equipped with LPIs ( 18 ). The survey was administered between January 1 and March 31, 2024, targeting road users aged 19 years or older at intersections where LPI signals were operational. The survey was conducted in areas near the selected intersections, including nearby shops, institutions, and corporate campuses, where both pedestrians and drivers who regularly used the intersections could be approached. A total of 350 responses were collected.
The questionnaire included separate sections for pedestrians and drivers. Participants were first asked about their driving frequency, and only those who reported regular driving (i.e., at least once per week) were presented with questions concerning delay tolerance and driving behavior. Based on this criterion, 320 responses were retained as the valid sample for the delay-related analysis. This structure ensured that delay-related responses reflected driver perspectives specifically. In addition, all 320 retained responses, regardless of driving frequency, were included in the analysis of questions concerning LPI awareness, perceived safety effects, and general intersection experience. This design allowed for differentiated analysis based on travel behavior while maintaining clarity in the interpretation of delay-related findings.
Data collection took place at shops, institutions, and corporate campuses located near the LPI intersections. Participants were invited to complete the questionnaire either via a QR code or a paper form. The purpose of this study, participant expectations, and potential discomforts were clearly communicated, and individuals were given the option to decline participation. To encourage participation, a small token of appreciation, such as wet wipes, was provided on completion of the survey.
The survey, which took approximately 10 min to complete, evaluated participants’ perceptions of LPIs and their tolerance for additional delays. Respondents indicated the maximum additional waiting time they found acceptable for pedestrian safety. Responses were recorded using a seven-point scale, ranging from “not tolerable” to “more than 40 s is acceptable,” with increments of 5–10 s, including options such as “5 s or less” and “40 s or less.” In addition, participants answered basic demographic questions, including their gender and age.
Model Development
Base Model Construction
A base model was constructed in PTV VISSIM by coding fundamental network elements, such as entrances, exits, merging/diverging sections, and lane configurations. Each simulation run comprised a 1,000-s warm-up, a 1-h active simulation, and a 1,000-s cool-down period ( 19 , 20 ). To account for probabilistic variation, every scenario was replicated 30 times ( 3 , 21 , 22 ).
Driving behavior parameters were adjusted during calibration using the Wiedemann 74 car-following model ( 21 , 23 , 24 ). These parameters included the average standstill distance and the additive and multiplicative safety distances. For RTOR conditions, clearance parameters were modified to capture observed yielding behaviors toward pedestrians. Pedestrian walking speeds were set at 4.2 ft/s, based on national averages in South Korea ( 25 ).
Calibration and Validation
Calibration ensured the simulated conditions closely mirrored field observations. Primary measures of effectiveness (MOE) for calibration included traffic volume and travel time. The Geoffrey E. Haver (GEH) statistic was employed to compare simulated versus observed traffic volumes; a GEH value below five was deemed acceptable ( 21 , 26 , 27 ). The GEH is defined as shown in Equation 1.

where
Validation was based on comparing simulated and observed right-turn travel times across 30 simulation runs ( 22 ). The correlation coefficient (CC) was used to gauge accuracy, with a threshold of 0.85 considered satisfactory ( 20 ). The CC is calculated as shown in Equation 2.
where
Test Scenarios by Right-Turn percentage
To assess the effect of the varying right-turn percentages on intersection delay, 12 scenarios were developed for each intersection, with right-turn traffic proportions from 5% to 60% in increments of 5%. These ranges were determined based on KOROAD data for comparable intersections, which indicate right-turn percentages of 13%–50% for Type 1 intersections, 17%–55% for Type 2, and 8%–60% for Type 3. In total, 144 scenarios were analyzed, derived from six intersections, two signal conditions (with and without LPIs), and 12 right-turn percentage levels. Each scenario was simulated 30 times to minimize variability and ensure robust analysis.
LOS and Delay Assessment
A PTV VISSIM simulation layout incorporating vehicles, pedestrians, and signal timings was used to measure vehicle delays before and after the LPI implementation ( 23 ). This study focused on vehicle delay as the primary operational metric, and pedestrian delay was not modeled. The quality of traffic operations was categorized using LOS A–LOS F ( 23 , 28 ). The delay thresholds for each LOS range are as follows.
LOS A: delay < 10 s
LOS B: delay ≥ 10 s and < 20 s
LOS C: delay ≥ 20 s and < 35 s
LOS D: delay ≥ 35 s and < 55 s
LOS E: delay ≥ 55 s and < 80 s
LOS F: delay ≥ 80 s
Simulation outputs were analyzed using LOS criteria, ranging from minimal delays (LOS A) to severe congestion (LOS F) ( 23 , 28 ). The delay and LOS assessments reflect only the approach where the LPI was implemented at each intersection, as these movements are directly impacted by the modified signal timing. In many jurisdictions, LOS E or better is considered acceptable for intersection operations ( 28 ). Therefore, this study adopted LOS E or better as the performance criterion for evaluating intersection efficiency. To supplement the quantitative findings, insights from a roadside survey were incorporated to evaluate public perceptions of delay acceptability in relation to pedestrian safety benefits.
Results
Calibration Results
The calibration process aimed to ensure that the VISSIM model accurately reflected observed traffic conditions at the six selected intersections. Six key parameters were iteratively adjusted.
Look-ahead distance: 20–50 m
Look-back distance: 10–40 m
Average standstill distance: 1.5–2.5 m
Additive part of desired safety distance: 1.0–2.0 m
Multiple part of desired safety distance: 0.5–1.0 m
Safety distance reduction factor: 0.5–0.8
These parameters were fine-tuned when monitoring traffic volume as the primary MOE for calibration. Manual adjustments were made until calibration targets were achieved, with visual checks on queue length, lane utilization, and bottleneck locations to confirm consistency with the field observations ( 21 , 23 , 24 ).
Table 3 presents the calibration results, indicating that over 85% of the links across all intersections achieved GEH values below five, meeting established acceptability criteria. Although a few high-volume links at Type 1-1, Type 1-2, and Type 3-1 intersections exhibited relatively higher GEH values, they remained within the acceptable threshold (GEH < 5). In addition, strong correlations between observed and simulated volumes (coefficient of determination, R2 > 0.94) further support the validity of the calibrated model. These findings confirm the reliability of the base model in replicating actual traffic patterns.
Calibration Results for Base Scenario Traffic Volumes at Study Intersections
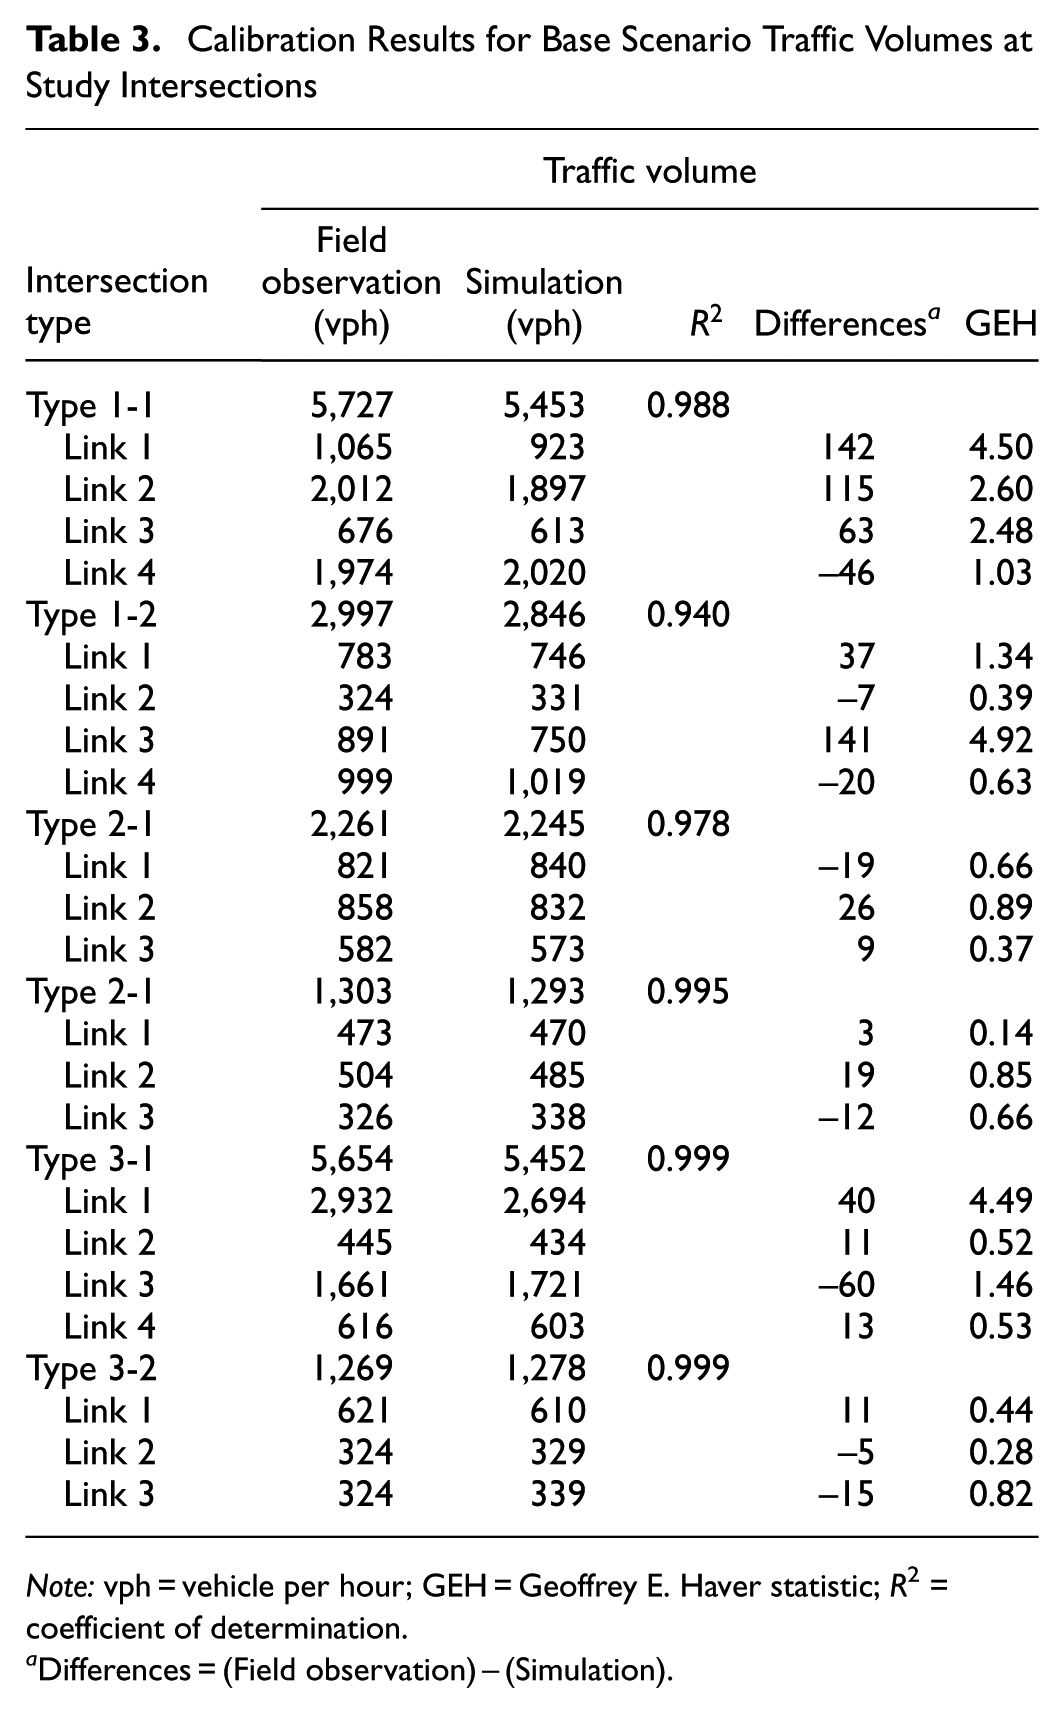
Note: vph = vehicle per hour; GEH = Geoffrey E. Haver statistic; R2 = coefficient of determination.
Differences = (Field observation) – (Simulation).
Validation Results
Model validation was conducted using travel time as the MOE. Simulated right-turn travel times—averaged over 30 simulation runs—were compared with observed travel times at each intersection. The resulting CC of 0.947 significantly exceeds the threshold of 0.85, confirming strong alignment between simulated and observed travel times.
Figure 2 shows the validation results by comparing observed and simulated travel times across intersections. Each data point represents an observed travel time on the x-axis and the corresponding simulated travel time on the y-axis. For example, at the Type 1-1 intersection, the observed travel time was 17.7 s, and the simulated time was 19.53 s. Similarly, at the Type 2-1 intersection, the shortest observed travel time was 4.3 s, compared with a simulated time of 5.47 s. This close alignment demonstrates the model’s ability to accurately replicate temporal traffic dynamics and supports the reliability of the simulation outputs used in subsequent analyses.
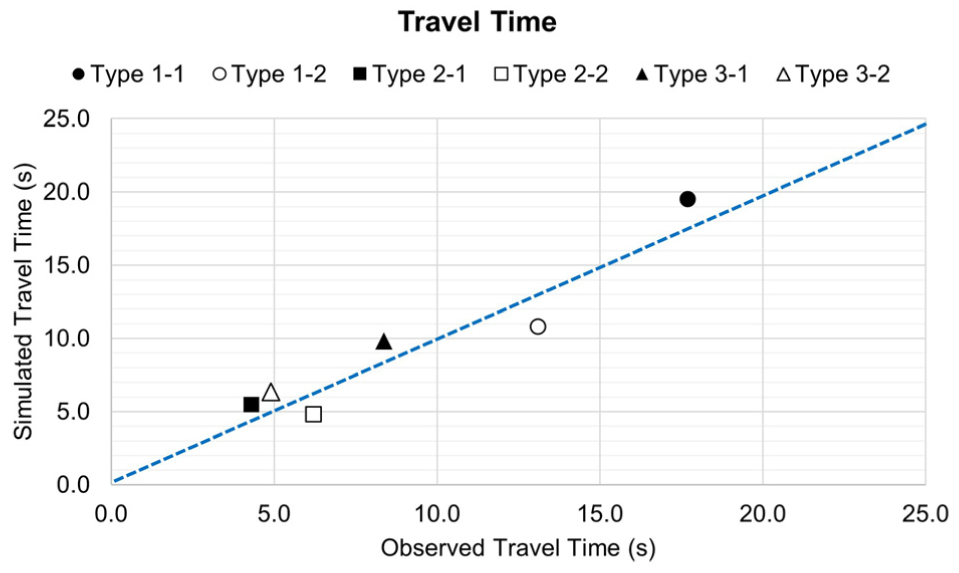
Validation of simulated travel times against field observations at study intersections.
Survey Results
The survey, conducted with 320 participants, assessed the public’s tolerance for additional vehicle delays when the LPI signal system was used or pedestrian safety and their demographic characteristics (Table 4). The gender distribution of the survey was nearly balanced, with 165 female and 155 male participants, suggesting that preferences regarding delay tolerance were consistent across genders. The survey also captured responses from a diverse range of age groups, ensuring that the results are representative of a broad cross section of the population.
Descriptive Statistics of Survey Sample
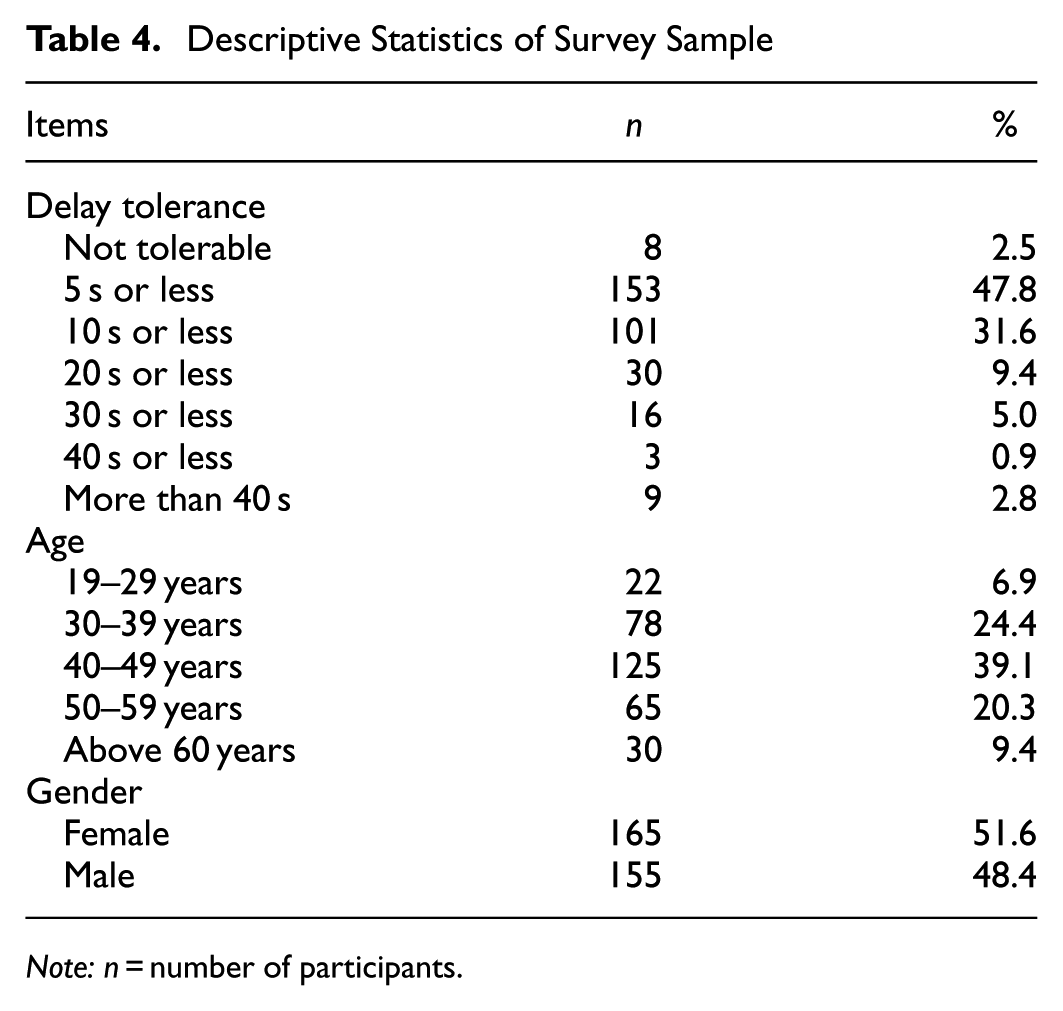
Note: n = number of participants.
The findings highlight a strong preference for minimal delays, with tolerance decreasing significantly as delay durations increased. A majority of participants (n = 153) found delays of up to 5 s acceptable. As delays increased, acceptance dropped, with 101 participants tolerating delays of up to 10 s, 30 participants accepting delays of 20 s or less, and only 16 participants tolerating up to 30 s. Very few participants found longer delays acceptable, with only three willing to tolerate delays of up to 40 s and nine participants accepting delays beyond 40 s. Taken together, the survey results show a clear preference for delays of 10 s or less, aligning with the majority of respondents’ tolerance levels. Acceptance of delays beyond 10 s was limited, with only a small subset of participants willing to tolerate extended waiting times. Based on these findings, this study defines additional delay differences of less than 10 s as acceptable, aligning with the majority preference.
Delay Assessment by LOS and Driver Acceptance
Traffic congestion under LPI operation was evaluated by examining delays and corresponding LOS while incrementally varying the right-turn percentage from 5% to 60% (Table 5). The results reveal that Type 1 intersections are most prone to reaching LOS F (i.e., delay ≥ 80 s). At Type 1-1, delays under the LPI condition exceed 80 s when the right-turn percentage reaches 10%; however, delays under the non-LPI condition remain below this threshold until approximately 15%–20%. Once the right-turn percentage surpasses 25%, the LPI consistently results in lower delays compared with non-LPI, although delays under both conditions continue to increase within LOS F. At Type 1-2, delays remain below 80 s under LPI until approximately 25%–30% right-turn percentages, after which they climb steadily, surpassing 300 s at a right-turn percentage of 60%. Additional LPI-related delays at Type 1-1 remain within the driver-acceptable limit of 10 s across all right-turn percentages; Type 1-2 exceeds this threshold when right-turn percentages rise beyond approximately 30%–35%. Of note, once the right-turn percentage at Type 1-1 exceeds 25%, the additional delay becomes negative, indicating that the LPI consistently reduces overall delay despite the conditions remaining within LOS F.
Delays and LOS Variation by Right-Turn Percentage Across Intersections
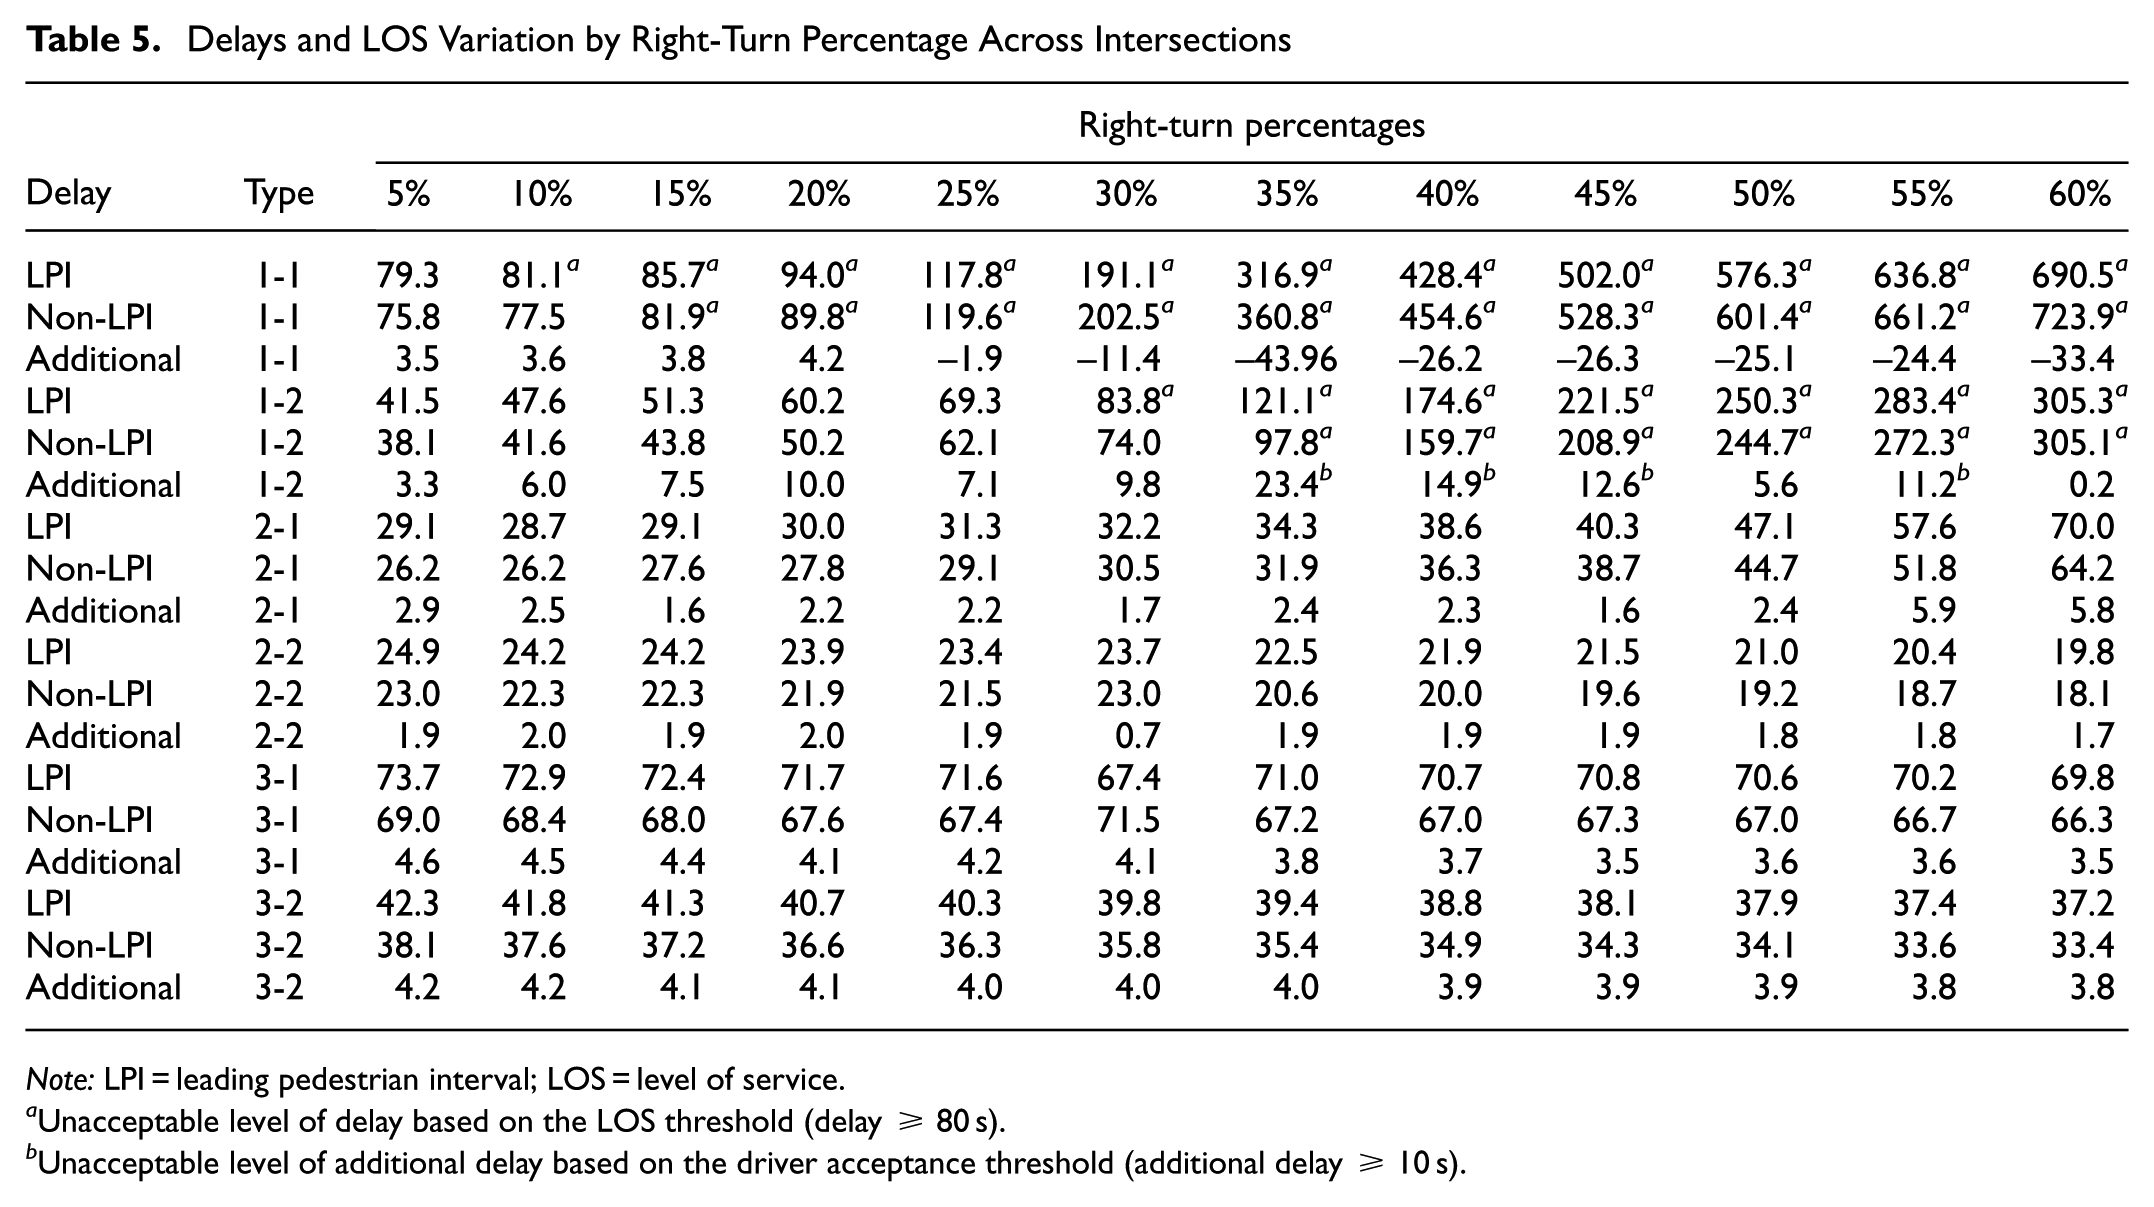
Note: LPI = leading pedestrian interval; LOS = level of service.
Unacceptable level of delay based on the LOS threshold (delay ≥ 80 s).
Unacceptable level of additional delay based on the driver acceptance threshold (additional delay
Type 2 intersections generally experience lower delays, remaining at or below LOS E even as right-turn percentages increase. At Type 2-1, delays under LPI increase from 29 s at a 5% right-turn percentage to 70 s at 60%, with non-LPI delays showing a similar pattern within LOS C–E. The additional LPI delays remain minimal, consistently below the 10-s driver-acceptable threshold. A similar trend is observed at Type 2-2, where delays under both LPI and non-LPI decrease slightly as right-turn percentages increase, between LOS B and C at a 60% right-turn percentage. Additional delays are minimal, indicating that LPI implementation at these intersections poses negligible inconvenience to drivers.
Type 3 intersections show limited sensitivity to increasing right-turn percentages, maintaining LOS levels between C and E. At Type 3-1, delays under LPI remain between 70 and 74 s across right-turn percentages from 5% to 60%, and non-LPI delays are slightly lower by just a few seconds. Similarly, delays at Type 3-2 remain between 40 and 45 s under LPI and around 35 s under non-LPI, with neither scenario approaching LOS F. As with Type 2 intersections, the additional delays caused by LPI at Type 3 intersections remain well below the 10-s threshold, posing minimal impact on driver acceptance.
Overall, the findings indicate that only Type 1 intersections experience severe congestion (i.e., LOS F) at higher right-turn percentages, particularly at Type 1-1. However, despite the severe congestion, the additional LPI-related delays at Type 1-1 remain within the driver-acceptable limit of 10 s across all right-turn percentages. In addition, beyond a 25% right-turn percentage, the LPI consistently reduces overall delays compared with non-LPI conditions, even as both continue to operate within LOS F. In contrast, Type 1-2 presents more significant challenges, as additional delays exceed the 10-s threshold once right-turn percentages surpass 30%–35%, eventually reaching delays beyond 300 s at higher percentages. Meanwhile, Type 2 and Type 3 intersections never approach LOS F and exhibit minimal differences between LPI and non-LPI conditions, with additional delays consistently remaining well within acceptable bounds.
Discussion
This study demonstrates that intersection geometry, pedestrian volume, and right-turn traffic percentages collectively determine the effectiveness and public acceptance of LPIs in RTOR contexts. Increasing traffic volumes commonly correlate with longer delays and lower driver acceptance of signal modifications ( 3 , 5 , 7 ); many intersections can maintain acceptable LOS despite higher delays ( 3 ). Consistent with these observations, most intersections examined in this study retained similar LOS levels following LPI implementation, with some even exhibiting reduced congestion at higher right-turn percentages ( 29 ). These findings highlight the importance of tailoring LPIs to the specific geometric and volumetric characteristics of each intersection to optimize efficiency and user support.
Type 1 intersections—four-way configurations without dedicated right-turn lanes—are particularly susceptible to congestion due to the shared use of lanes by right-turning and through vehicles. At Type 1-1, the LPI effectiveness improves once right-turn ratios exceed approximately 25%, as the reduced vehicle-pedestrian conflict offsets the initial delay caused by the exclusive pedestrian phase ( 7 , 13 , 14 ). Of note, the Type 1-1 intersection recorded substantially higher pedestrian volumes 723 person per hour (pph) compared with other study sites (79–297 pph), which may have contributed to this unexpected reduction in vehicle delay. This interesting outcome suggests that high pedestrian volumes can meaningfully influence driver–pedestrian interactions. Conflicts between turning vehicles and pedestrians often stem from differential attentional demand ( 29 ), and an appropriately timed LPIs may mitigate these disruptions by consolidating pedestrian movement. An effective LPI duration can enable pedestrians to clear the path of turning vehicles ( 29 ), facilitating smoother crossings and indirectly reducing vehicle delays—particularly in RTOR environments, where vehicles may proceed during the remaining clearance time. However, Type 1-2 experienced substantial congestion at higher right-turn percentages, with LPI implementation resulting in delays that exceeded the 10-s threshold commonly considered acceptable by drivers. This is probably because of its more constrained lane configuration, which exacerbates queuing, and its lower pedestrian volume, which may limit the conflict-reducing benefits of the LPI. These contrasting outcomes highlight that, beyond geometric design, pedestrian volumes can significantly influence the LPI effectiveness. This finding aligns with recommendations that prioritize LPI deployment at pedestrian-heavy intersections ( 7 , 9 ) and suggests the importance of incorporating pedestrian-based metrics—alongside vehicle-based measures—into future evaluations of LPI performance.
In contrast, Type 2 intersections, characterized as T-intersections, generally present higher pedestrian conflict risks, making them suitable candidates for LPI implementation ( 7 , 9 ). Unlike Type 1 intersections, Type 2 sites in this study showed moderate delay increases and consistently maintained LOS E or better, even as right-turn percentages increased under LPI operations. For example, Type 2-1 delays increased from 29 s at a 5% right-turn percentage to 70 s at 60%, and additional LPI delays remained below the 10-s threshold. In addition, Type 2-2 saw a slight decrease in overall delay as right-turn percentages increased, with delays remaining between LOS B and C under LPI and non-LPI conditions. The relatively small delay increases at these intersections suggest that fewer conflicting movements contribute to stable traffic flow, even at higher right-turn volumes, allowing for broad LPI deployment without significant disruption.
Type 3 intersections, which include either four-way configurations with dedicated right-turn lanes or Y-shaped designs, demonstrated limited sensitivity to increased right-turn percentages. Both Type 3-1 and Type 3-2 maintained delays within LOS C–E, with minimal differences between LPI and non-LPI scenarios. The presence of dedicated right-turn lanes effectively segregates turning vehicles from through traffic, minimizing vehicle–pedestrian conflicts ( 10 , 30 ). Therefore, additional delays under the LPI remain negligible and well within driver-acceptable limits, highlighting the value of geometric features that naturally mitigate congestion during LPI phases.
Beyond LOS assessments, this study underscores the crucial role of driver perception. Surveys revealed that nearly 80% of respondents were willing to accept additional delays of up to 10 s if pedestrian safety improved. However, delays beyond this threshold risk diminishing public support, even when the LOS metrics remain within acceptable ranges ( 3 , 5 , 7 ). This finding highlights the importance of balancing safety enhancements with acceptable traffic performance to maintain community trust and support.
A context-sensitive design approach is, therefore, critical for successful LPI implementation. At intersections with high pedestrian volumes or shared lanes, LPIs can reduce vehicle–pedestrian conflicts sufficiently to offset the added signal time. However, because RTOR was permitted at all sites in this study, pedestrian protection was only partial. The LPIs are intended to provide a temporal buffer between pedestrian and vehicle movements; however, the concurrent allowance of RTOR may limit the full realization of their safety benefits. Although this study focused on operational efficiency rather than safety outcomes, the coexistence of RTOR and LPI warrants further investigation, particularly in environments with high pedestrian volumes.
Intersections with a greater number of signal phases, such as four-way configurations, tend to be more sensitive to reductions in vehicle green time resulting from LPIs, due to longer cycle lengths and multiple conflicting movements. Although LPIs in this study were implemented as a head start within the pedestrian phase and did not involve a change to the number of signal phases, they effectively shortened the time available for vehicle movements. At intersections with more complex phase sequences, even minor adjustments to pedestrian timing can lead to amplified vehicle delays. Compared with simpler T or Y intersections, complex sites are more likely to experience disproportionately higher delays from the same timing adjustments. Where feasible, upgrading intersections to designs that separate right-turn traffic, such as Type 3 layouts, could further enhance safety and traffic flow. Monitoring driver perception, especially at high-volume sites, should be prioritized to proactively address any dissatisfaction.
Overall, these findings demonstrate that balancing technical performance with user-centered considerations is key to ensuring the sustainable success of LPIs in RTOR environments. Even when LOS remains within acceptable ranges, driver acceptance ultimately determines whether local communities support or resist changes aimed at enhancing pedestrian safety.
Conclusion
This study examined the impact of varying right-turn traffic percentages on the effectiveness and acceptance of LPIs at intersections permitting RTOR. Using a combination of microscopic simulation modeling and driver acceptance surveys, the findings reveal that intersection geometry, pedestrian volume, and right-turn traffic percentages collectively influence LPI performance. Of note, Type 1 intersections experienced sharp increases in delays once right-turn percentages exceeded 25%–30%, although high pedestrian volumes occasionally mitigated these delays under LPI conditions. In contrast, Type 2 and Type 3 intersections exhibited a more stable LOS across a broad range of right-turn percentages, suggesting that LPIs can be more widely implemented at these intersections with minimal adverse effects on traffic flow. These findings demonstrate the importance of targeted LPI strategies to the unique operational and geometric characteristics of each intersection.
Despite its contributions, this study has certain limitations. The analysis was confined to six intersections in the study areas. However, the specific geometric, cultural, and traffic conditions in Changwon, Republic of Korea, may not fully represent other urban environments. Future research should include a larger and more diverse sample of intersections to enhance the generalizability of the findings. In addition, the simulation model was based on prevailing traffic volume compositions at the selected sites. Intersections with significantly different traffic mixes, peak hour dynamics, or multimodal demands could yield distinct outcomes. Further investigations should explore the robustness of LPI strategies under various traffic and pedestrian flow scenarios. The driver acceptance survey captured current attitudes toward LPIs; however, these perceptions may evolve over time as pedestrian-focused infrastructure becomes more widespread. Longitudinal studies are needed to assess how prolonged exposure to LPIs and evolving cultural norms influence tolerance for delays. Although delay-related questions were only analyzed for respondents who reported regular driving, the survey was conducted in pedestrian-accessible areas near LPI-equipped intersections. This recruitment strategy may have introduced slight sample bias toward pedestrians or multimodal travelers. Future studies should consider complementary recruitment strategies to better isolate driver-specific perspectives. In addition, this study considered basic geometric differences and right-turn percentages; however, more complex intersection designs—such as multi-legged junctions or adaptive signal timing schemes—may introduce additional performance dynamics. In addition, intersections with high pedestrian volumes in this study corresponded to Type 1 geometric configurations, meaning that pedestrian demand and intersection type could not be independently evaluated. Therefore, the observed effects reflect the combined influence of these two conditions. Future work should attempt to disentangle these interrelated factors to determine whether their impacts on delay and LPI performance are additive, compounding, or independent. Finally, because LPI deployment in the study area was limited to a single approach per intersection, the effects on other traffic movements, such as left turns or opposing approaches, were not explicitly modeled. This partial implementation may influence overall intersection dynamics and should be considered when interpretating the simulation results.
As cities strive to promote sustainable and pedestrian-friendly mobility solutions, adapting LPI implementation to local intersection characteristics remains critical. By integrating simulation findings with real-world driver feedback, this study advances the understanding of how cities can simultaneously enhance pedestrian safety and maintain acceptable traffic flow. Continued refinement of LPI strategies—and their interaction with emerging transportation technologies—will be critical to fostering equitable, safe, and efficient urban transportation systems.
Footnotes
Acknowledgements
Portions of the text were refined using the OpenAI ChatGPT (GPT-5, 2025 version) language model to improve clarity, grammar, and consistency in English expression. The authors verified all generated content for accuracy, technical validity, and contextual appropriateness, and they take full responsibility for the final manuscript.
Author Contributions
The authors confirm contribution to the paper as follows: study conception and design: UY, JH; data collection: UY; analysis and interpretation of results: UY, JH; draft manuscript preparation: UY, JH. Both authors reviewed the results and approved the final version of the manuscript.
Declaration of Conflicting Interests
The authors declared no potential conflicts of interest with respect to the research, authorship, and/or publication of this article.
Funding
The authors disclosed receipt of the following financial support for the research, authorship, and/or publication of this article: This research forms part of Ukseok Yang’s master’s thesis. This work was supported by the Safety Facilities Division of the Korea Road Traffic Authority (KOROAD); the National Research Foundation of Korea (NRF) grant funded by the Korea government (Ministry of Science and ICT) (No. RS-2024-00333264); and Global—Learning & Academic research institution for Master’s·PhD students, and Postdocs (LAMP) Program of the National Research Foundation of Korea (NRF) grant funded by the Ministry of Education (No. RS-2023-00301938).
Data Accessibility Statement
The data that support the findings of this study are owned by the Korea Road Traffic Authority (KOROAD) and are not publicly available due to institutional data ownership and confidentiality agreements. The authors do not have permission to share the data. Researchers interested in accessing the data may contact KOROAD directly through its official data request platform, subject to the agency’s data access policies and approval procedures.