
Abstract
Dockless bike-sharing has emerged in recent years as a sustainable mode of transportation, offering convenience and environmental benefits. However, its rapid growth has given rise to challenges such as indiscriminate parking. To tackle this issue, mandatory parking zones enforced through the use of virtual geofences have been widely adopted by governments and bike-sharing companies. Despite their widespread implementation, the impact of such regulations on bike-sharing demand remains largely unexplored. This case study examines whether the introduction of parking regulations influences users' demand for bike-sharing in a medium-sized city in China. Furthermore, the relationships between demand and various potential influencing factors were analyzed using four district-specific negative binomial regression models. To verify the robustness of these findings and assess overall policy effects, a pooled model incorporating all grid cells across the city was also constructed. The results indicate that virtual geofence density is a significant factor in areas where demand changes were observed. Downtown areas are less affected because of their higher virtual geofence density, whereas suburban areas experience a greater negative impact. The findings suggest that increasing the virtual geofence density in suburban areas could mitigate the negative effects of parking regulations. Additionally, implementing a one-size-fits-all approach by transitioning from a dockless mode to a virtual-geofenced mode across all areas may not be optimal. Instead, a hybrid approach, with both parking schemes coexisting in the city, is recommended.
Keywords
The sharing economy has gained immense popularity in recent years, with bike-sharing systems being implemented worldwide. Bike-sharing, as a green and sustainable transportation option, has been proven to mitigate climate change, primarily by reducing carbon emissions ( 1 , 2 ). This reduction is achieved through the substitution of motorized vehicles with bike-sharing or by integrating bike-sharing with public transport systems ( 3 ). Mode substitution not only lowers emissions but also promotes public health ( 4 – 7 ). While motorized transport negatively affects health from pollution and physical inactivity ( 6 , 8 ), bike-sharing provides an opportunity for exercise while improving air quality. The extent of mode substitution significantly determines the magnitude of benefits brought by bike-sharing ( 8 ), underscoring the critical and urgent need for its broader promotion.
There are two primary types of bike-sharing systems in practice: docked and dockless. The conventional docked systems provide bike-sharing services through physical stations and docking infrastructure ( 9 ). In contrast, the dockless model allows users to park bikes anywhere, eliminating the need for fixed locations for obtaining and returning bikes ( 10 ). The availability, flexibility, and convenience of dockless bike-sharing has increased its popularity in recent years ( 9 , 11 – 14 ).
China has become the largest market for dockless bike-sharing globally ( 15 ), with the number of users growing from 220 million in 2017 to 300 million in 2021 ( 16 ). While the rapid expansion of dockless bike-sharing has introduced new forms of urban mobility, it has also raised concerns about improper parking and public space management. Media reports and public discourse have often emphasized indiscriminate parking, citing issues such as obstruction of sidewalks, blocked metro entrances, and diminished urban aesthetics ( 17 ). Improperly parked bikes can also pose safety risks and interfere with pedestrian rights-of-way ( 18 ). However, empirical studies suggest that the prevalence of truly obstructive or inappropriate parking is often overstated. Field investigations in San Jose ( 19 ), Washington D.C. ( 20 ), and other cities ( 21 ) found that a majority of dockless vehicles were parked acceptably, and outright violations were relatively rare. These findings imply that while parking regulation is a legitimate concern, its actual severity may be lower than perceived, highlighting the importance of balanced responses that preserve user convenience while maintaining order in the urban environment. Nevertheless, concerns around clutter, perceived disorder, and system sustainability continue to drive regulatory interventions in many cities. As such, understanding both the real impacts and perceived problems remains essential for developing effective and proportionate policy responses.
To address indiscriminate parking, mandatory parking zones enforced through virtual geofences have been introduced as a regulatory mechanism within dockless bike-sharing systems. Virtual geofenced parking zones serve as virtual boundaries that leverage technologies such as Bluetooth signals, Global Positioning Systems (GPS), and Radio Frequency Identification Devices (RFID) to function as an integrated system and the system ensures compliance by preventing users from locking bikes outside designated parking areas, continuing to charge them until the bikes are parked correctly ( 17 ). As a result, parking regulations with virtual geofences effectively guide users to designated zones ( 5 ).
While the shift from dockless to electrically fenced parking aims to resolve parking issues, it could potentially reduce user convenience and satisfaction ( 9 ). Additionally, the regulation may lead to mismatches between parking capacity and demand ( 22 ) or inadequate bike supply ( 23 ). Recent studies have highlighted these concerns. For instance, a field study across Stockholm, Gothenburg, and Malmö found that parking bans led to user dissatisfaction and unintended behavioral changes, such as reduced usage or modal shifts ( 24 ). Similarly, on a U.S. university campus, mandatory e-scooter parking corrals significantly reduced ridership in the short term, suggesting a behavioral deterrent effect ( 25 ). Conversely, some studies suggest that such regulations might only redistribute bikes without significantly affecting overall demand ( 26 ).
The research gap lies in the lack of empirical evidence on how parking regulations enforced with virtual geofences influence bike-sharing demand. While previous studies have explored the benefits and challenges of bike-sharing systems, including docked and dockless models, as well as the operational impacts of parking regulations, there is limited understanding of the specific demand-related effects of transitioning from dockless systems to electrically fenced parking. This includes the need to investigate whether such regulations enhance or undermine the overall goals of bike-sharing systems, such as increasing usage, promoting sustainability, and improving urban mobility. Additionally, the key factors influencing bike-sharing demand under these regulations remain unclear.
To address the identified research gap, this study aims to answer the following questions:
Does bike-sharing demand change after the implementation of parking regulations enforced with virtual geofences?
What are the key factors influencing bike-sharing demand, and how do they impact it?
If the implementation of parking regulations with virtual geofences does affect bike-sharing demand, in what ways does it manifest?
This study examines the HelloBike program in Huai’an, China, as a case study. Hereafter, Huai’an City is abbreviated as HAC to distinguish the prefecture-level city from its subordinate district, Huai’an District (HAD), a district-level administrative unit defined later in the Study Context section. Located on the south-north border of China, HAC offers a climate conducive to year-round cycling, making it an ideal research subject. HelloBike was launched in HAC in January 2018. To address the issue of indiscriminate parking, the Huai’an Urban Management Bureau established electrically fenced parking sites since April 2021.
This study contributes to the literature by providing an empirical analysis of the impact of implementing virtual geofenced parking zones on bike-sharing demand, focusing on the HelloBike program in HAC, China. First, it addresses the pressing question of whether parking regulations enforced with electric fences affect bike-sharing demand and explores the mechanisms through which these changes manifest. Second, the study identifies and evaluates the key factors influencing bike-sharing demand in the context of virtual geofence deployment, offering insights into their relative importance. Lastly, by focusing on a real-world case in HAC, this research provides practical implications for policymakers and urban planners to design effective parking management strategies that balance operational efficiency, user satisfaction, and sustainable urban transportation goals.
The remainder of this paper is structured as follows: Literature review highlighting the contributions of this study; Methodology detailing the data collection process and input data; Results presenting the findings and analysis; Discussion of the results and policy implications; Conclusion.
Literature Review
Bike-Sharing: From Dockless Mode to Virtual Geofenced
The characteristic of docklessness creates significant distinctions between dockless and virtual geofenced bike-sharing services. Bike-sharing systems with virtual geofences resemble the physically docked model, as both require users to park bikes within designated areas. Consequently, existing studies on station location planning for docked bike-sharing systems can offer valuable insights and guidance for planning virtual geofence deployments ( 17 ). Therefore, the impact of transitioning from a dockless model to a virtual geofenced system can be understood by comparing the advantages and disadvantages of docked and dockless bike-sharing systems.
Comparisons between docked and dockless bike-sharing have been conducted in previous studies. Docked bike-sharing is often considered to deliver superior redistribution efficiency ( 12 ), predictability ( 13 ), improved turnover rates ( 27 ), and operational cost savings ( 9 ). First, redistributing dockless bikes is more challenging than redistributing station-based bikes because dockless bikes are spatially scattered and require redistribution over a larger geographical area compared to bikes in fixed docking stations ( 12 ). Second, in docked systems, all bikes are located at designated stations, making their locations more predictable for users. Conversely, dockless systems distribute bikes more sparsely, creating uncertainty about the availability of nearby bikes ( 13 ). As predictability is critical for bike-sharing users, introducing virtual geofences to dockless systems may positively impact ridership. Third, virtual geofences can improve the efficiency of bike deployment by enabling centralized storage and management, thereby enhancing turnover rates ( 27 ). Finally, the implementation of virtual geofenced parking zones has been shown to reduce redistribution mileage, leading to decreased demand for frontline workers and therefore lower operational costs ( 9 ).
On the other hand, implementing parking regulations may negatively affect the convenience of bike-sharing services, as the dockless mode offers users greater flexibility, availability, and accessibility ( 11 – 14 ). Docked systems lack the flexibility and availability of dockless systems, as users cannot pick up and return bikes anywhere within the service area ( 28 ). Additionally, the number of bikes at a station is restricted by its capacity, often leading to mismatches between parking availability and demand during peak hours ( 12 , 22 ). Uneven spatial-temporal distribution of bikes can also result in some areas being undersupplied ( 23 ). Furthermore, forced rerouting for bike returns were found to increase time per trip for docked systems ( 13 ). The additional travel time reduced accessibility and user satisfaction, potentially driving users to switch to alternative transportation modes ( 5 , 14 ).
Therefore, the implementation of virtual geofenced parking zones has both positive and negative impacts on bike-sharing demand. It remains unclear whether parking regulation implementation will significantly alter demand. Therefore, empirical studies are essential to explore bike-sharing demand for these two schemes.
Influencing Factors for Bike-Sharing Demand in Virtual Geofence Deployment
Recent research has examined the impact of the built environment on bike-sharing demand ( 5 , 7 , 29 – 34 ). Among the various components of the built environment, cycling infrastructure has been consistently shown to have a positive correlation with bike-sharing demand ( 29 , 32 , 35 ), and its development is widely regarded as a prerequisite for increasing cycling rates ( 36 ). Furthermore, the built environment and associated infrastructure play a crucial role in determining optimal station or fence locations to meet travel demand ( 37 ). As a relatively new form of cycling infrastructure, virtual geofences are designed to address indiscriminate parking. However, their influence on bike-sharing demand remains unexplored.
On the other hand, while numerous factors influence bike-sharing demand, this study focuses specifically on those directly related to the establishment of virtual geofenced parking zones. These factors, which are integral to virtual geofence planning, include elements that affect both operational efficiency and user satisfaction, thereby impacting bike-sharing demand ( 9 , 16 , 22 ). In fact, these factors affecting bike-sharing demand in the context of virtual geofence deployment have been taken account into multiple evaluation criteria in previous planning studies. Consequently, a multi-criteria decision-making model (MCDM) has been frequently applied to determine optimal locations for docked stations ( 36 – 41 ) and virtual geofences ( 18 ).
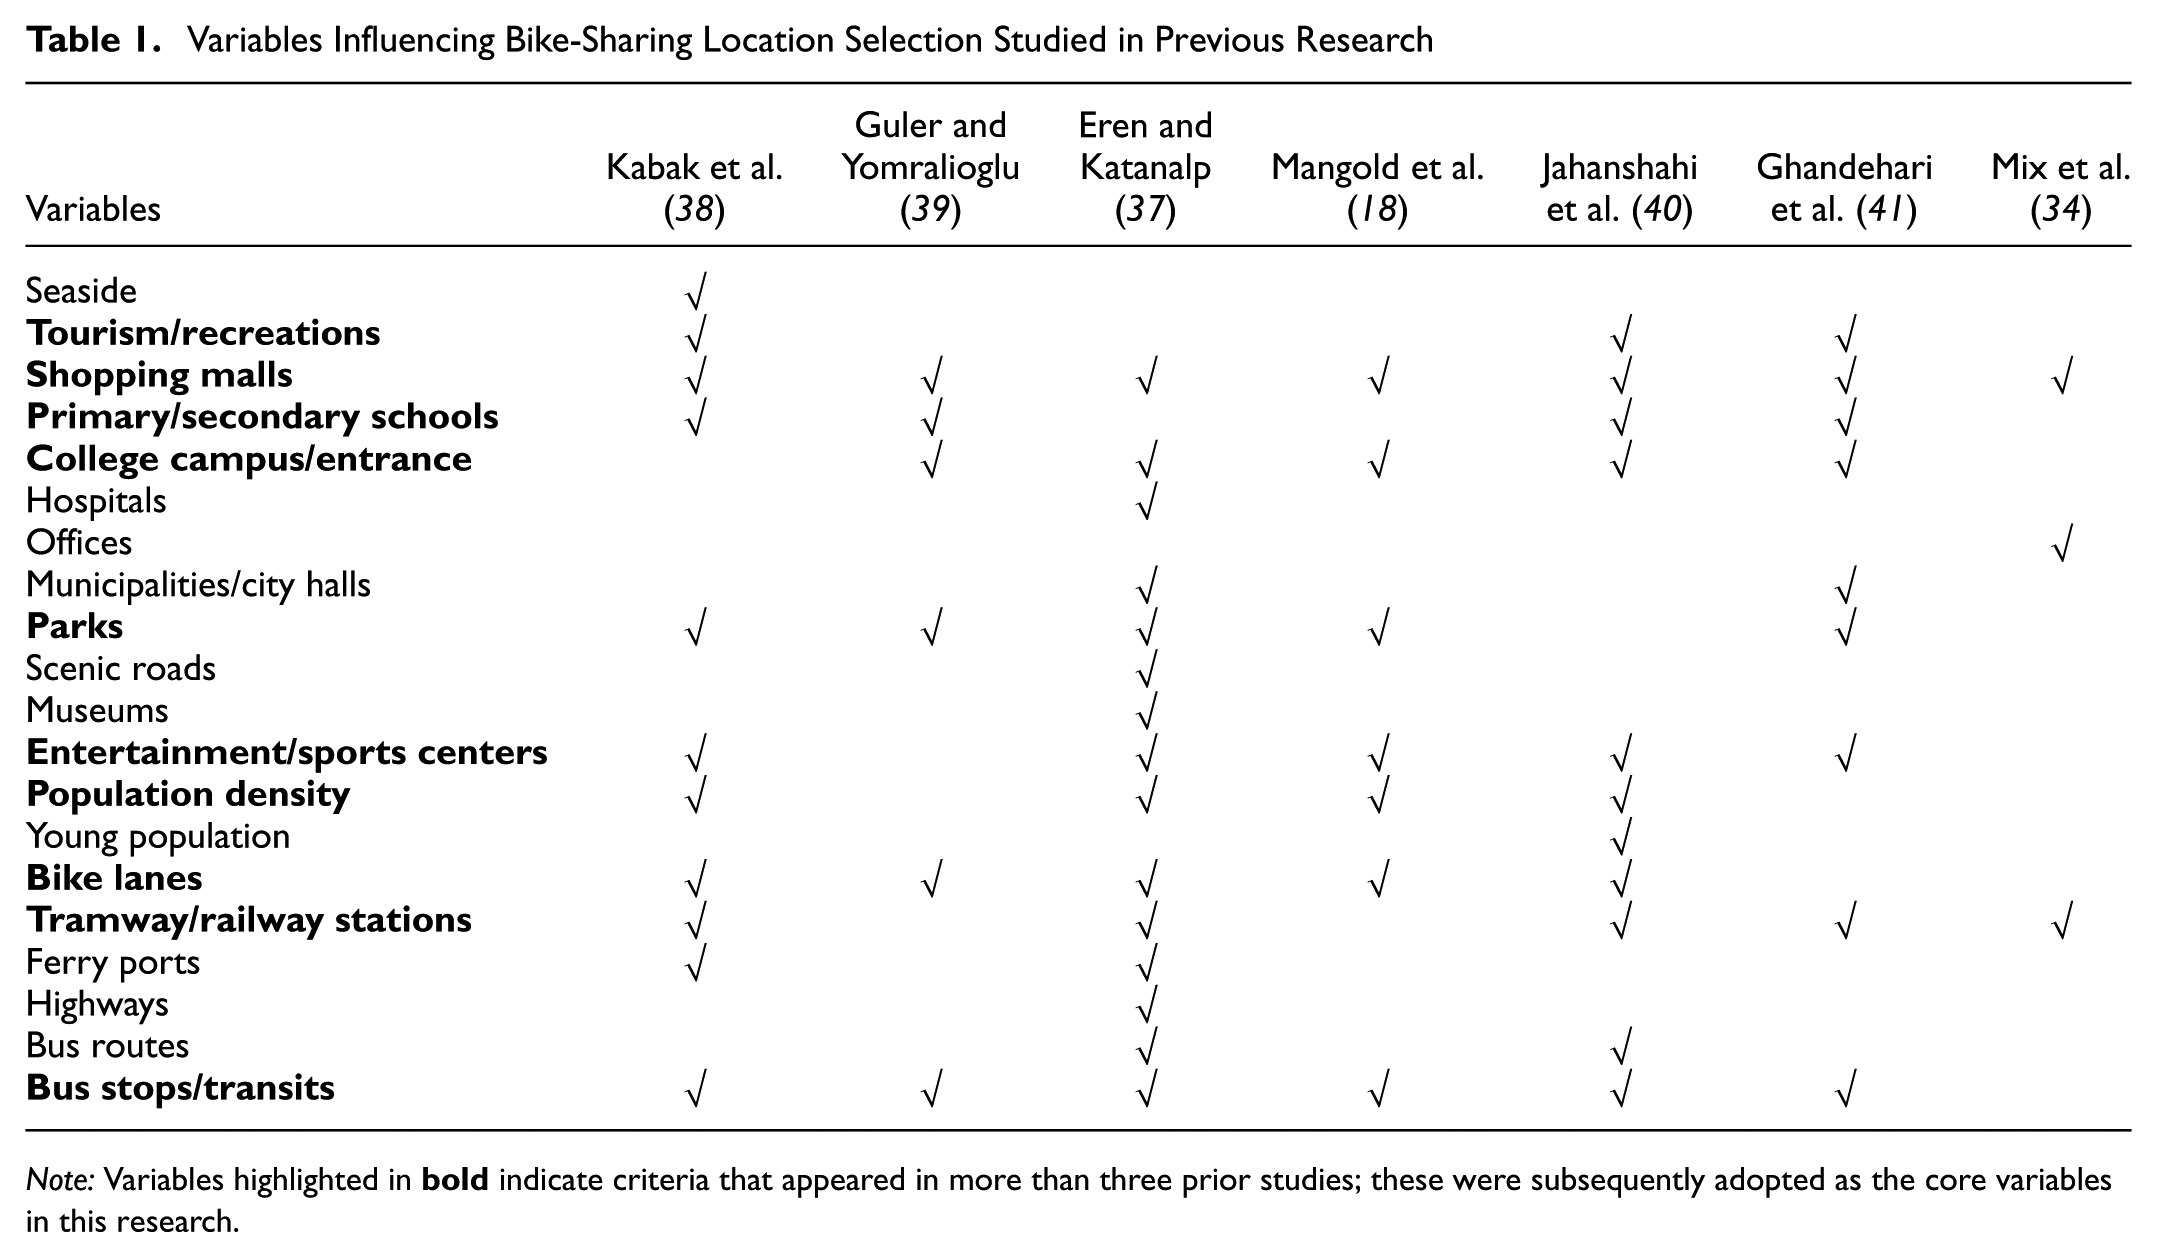
For virtual geofence planning, Mangold et al. ( 18 ) identified eight criteria for optimization and demonstrated that the optimized virtual geofence locations achieved better demand coverage than existing bike-sharing stations. In the context of docked station planning, Kabak et al. ( 38 ) proposed 12 criteria for suggesting alternatives to existing stations, highlighting their superiority in addressing demand. Guler and Yomralioglu ( 39 ) identified 9 effective criteria for planning bike-sharing system stations and cycling lanes. Eren and Katanalp ( 37 ) consulted literature and experts to select 21 decision criteria for evaluating the suitability of existing and potential station locations. Their findings revealed varying significance levels of criteria across different land-use types. Recent research further supports this connection. Meng et al. ( 42 ) found that in cities with shared e-scooter systems, denser parking infrastructure was associated with higher parking compliance, and that this relationship was strongly moderated by surrounding land uses. This suggests that spatial planning of parking infrastructure, such as virtual geofences, must account not only for general demand coverage but also for the functional context of different land parcels. Jahanshahi et al. ( 40 ) emphasized widespread coverage as a priority over proximity in station location planning, while Ghandehari et al. ( 41 ) identified 4 main factors significantly influencing station location. Mix et al. ( 34 ) selected 11 variables across 3 categories, namely cumulative variables, local non-cumulative variables, and accessibility variables, to model bike-sharing demand for 6 different types of trips. The criteria considered in these studies are presented in Table 1.
Variables Influencing Bike-Sharing Location Selection Studied in Previous Research
Note: Variables highlighted in
To investigate the potential impact of parking regulations enforced via virtual geofences on bike-sharing demand, it is essential to consider factors associated with virtual geofences. Previous studies have highlighted that the proximity and density of bike-sharing stations significantly affect user convenience and system success. For instance, Ma et al. ( 26 ) argued that stations should be located close together to facilitate easy access to and return of bikes, which can increase user ridership. Similarly, living close to a bike-sharing station has been associated with higher usage rates ( 4 , 43 ). Shu et al. ( 44 ) emphasized that the distance between stations should be a crucial consideration when planning their locations, while Conrow et al. ( 45 ) identified station location and density as critical determinants of bike-sharing system success. Nikiforiadis et al. ( 46 ) further reinforced this notion, noting that the optimal number and placement of stations are pivotal for ensuring effective system operations. Practical evidence also supports these claims; high-density station networks have been shown to correlate with increased ridership ( 47 ). Importantly, recent research on dockless micromobility systems, such as e-scooters, confirms that riders are unwilling to walk long distances to access or park vehicles. For instance, Buehler et al. ( 25 ) found that the introduction of mandatory parking corrals for e-scooters led to reduced convenience and a sharp decline in usage. Similarly, Reck et al. ( 48 ) observed that access distance is a key factor in users’ mode choice behavior, and that shared micromobility users show strong sensitivity to walkable proximity. Given that virtual geofenced systems share similar parking location requirements with docked bike-sharing schemes, the virtual geofence density is likely to have a comparable influence on bike-sharing demand. A limited number of virtual geofences could reduce the flexibility and convenience offered by dockless systems, making it harder for users to locate and park bikes ( 17 ). Therefore, we posit that the virtual geofence density is a significant factor impacting bike-sharing demand.
Despite extensive studies on docked station planning, research explicitly examining the effect of virtual geofence deployment on bike-sharing demand remains scarce. To our knowledge, no existing studies have comprehensively analyzed the changes in demand following virtual geofence implementation. This gap highlights the need for further empirical research to assess the impact of virtual geofences on user behavior and demand dynamics in bike-sharing systems. While some recent studies have begun to examine the effects of similar parking regulations on dockless e-scooter systems, such as those in Sweden ( 24 ) and on U.S. university campuses ( 25 ), these studies are relatively limited in scope and do not directly address shared bicycles. Nevertheless, they suggest that restrictive parking policies can influence user behavior, and they highlight the importance of context-specific investigations in the micromobility domain.
Methodology
This section outlines the methodological framework employed to analyze the impact of virtual geofence deployment on bike-sharing demand and to identify key factors influencing this relationship. The approach consists of two primary stages. First, a comparative analysis of bike-sharing demand before and after the implementation of virtual geofences, using trajectory data from HelloBike, is conducted to assess changes in usage patterns. Second, the most frequently used factors from previous research on virtual geofence location planning are selected. These selected factors are then used to construct a model analyzing the relationship between the implementation of virtual geofences and bike-sharing demand. The model aims to identify which factors significantly influence bike-sharing demand in the context of virtual geofence deployment. The flowchart illustrating the research methodology is shown in Figure 1.
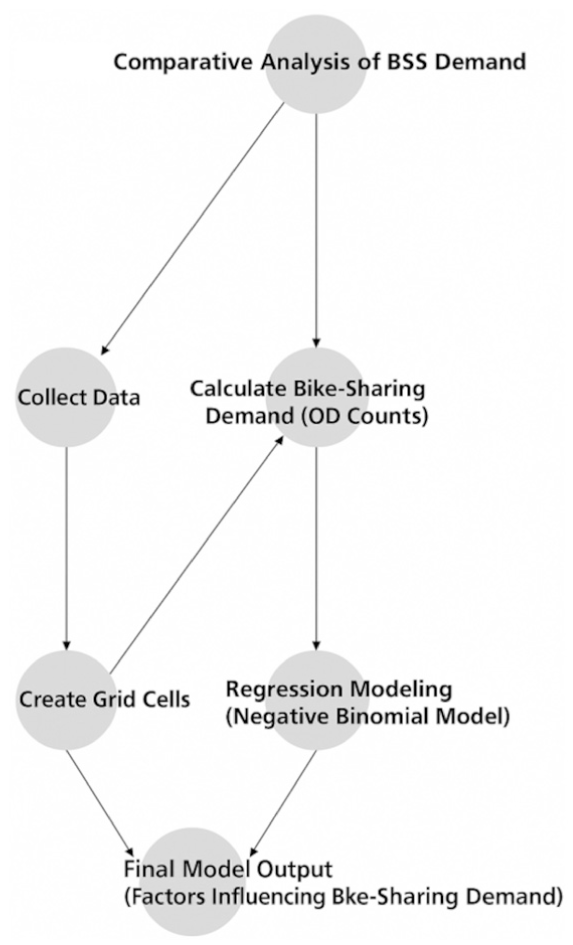
Flowchart of research methodology.
Study Context
HAC, a medium-sized city located on the southern-northern border of China, spans an administrative area of 900 km2 and had a population of 4.5 million in 2021, the year parking regulations were implemented. The first commercially operated bike-sharing system in HAC, HelloBike, was launched in January 2018 ( 49 ). To manage bike-sharing parking and maintain order, HAC introduced parking regulations in April 2021 by deploying more than 1,200 virtual geofences throughout the city. In June 2021, when the origin–destination (OD) trajectory data for bike-sharing was first collected following the introduction of parking regulations, a total of 1,489 electrically fenced parking sites had been established. HAC comprises several administrative districts. Among them, HAD is one of the core urban districts, covering 59.39 km2. The spatial distribution of parking sites, along with three other districts—Qingjiangpu (68.4 km2), Huaiyin (52.5 km2), and the Economic Development Zone (EDZ) (48.2 km2)—is illustrated in Figure 2. Notably, the EDZ contains a large proportion of suburban land with lower population density, more dispersed land-use functions, and limited public transport coverage, making it representative of typical suburban environments in medium-sized Chinese cities.
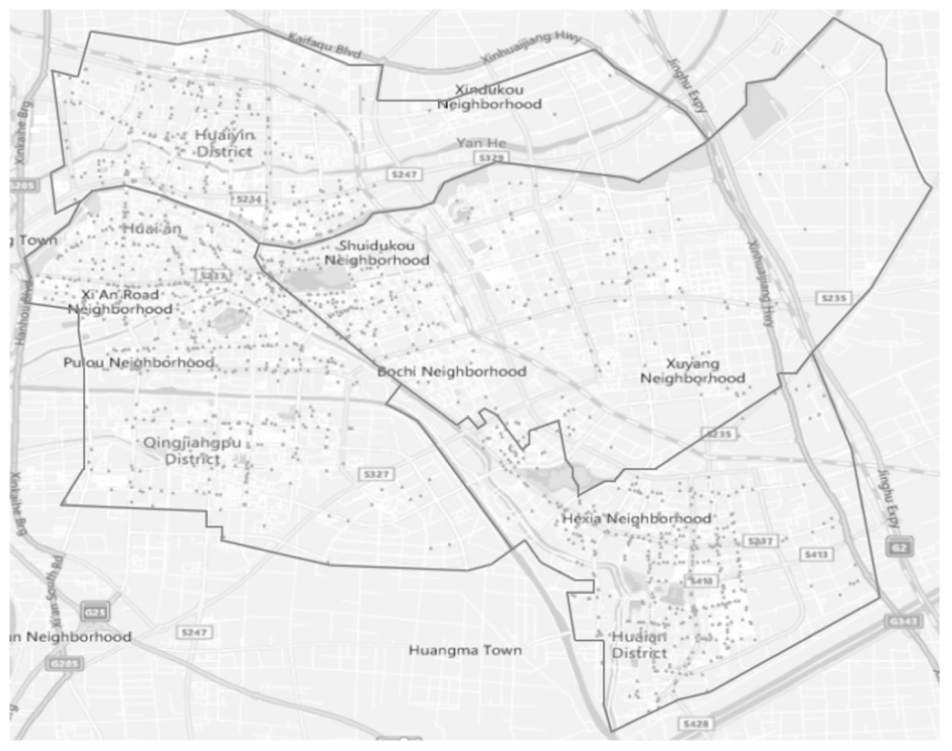
Distribution of virtual geofenced parking zones in the bike-sharing service area in Huai’an.
Analyzing bike-sharing demand and policy effects at the district or zone level is critical for several reasons. First, the urban form and demographic composition vary substantially between downtown and suburban districts, directly influencing bike-sharing usage patterns. Downtown areas such as HAD and Qingjiangpu district exhibit higher population and facility densities, more mixed land use, and more comprehensive public transport services. In contrast, suburban areas—especially in the EDZ—feature fragmented spatial layouts, lower accessibility, and more car-dependent lifestyles.
Second, the deployment strategy and density of virtual geofences differ markedly across districts. As shown in Figure 2, downtown areas tend to have denser and more evenly distributed virtual geofences, while suburban districts often have sparse deployments. This discrepancy plays a key role in shaping user convenience and thus influences demand responses to parking regulations. Evaluating policy effects without accounting for these spatial differences may obscure meaningful variations in user behavior and lead to misleading conclusions.
Therefore, this study adopts a district-level analytical framework to reveal spatial heterogeneity in bike-sharing demand and to evaluate the differentiated impacts of virtual geofence policies across zones. This approach enables a more nuanced understanding of how urban form, infrastructure deployment, and user characteristics jointly shape mobility outcomes, providing valuable evidence for the targeted refinement of micromobility governance strategies.
Bike-Sharing Data
This study uses origin–destination (OD) trajectory data to analyze spatial demand variations and the effects of parking regulations. OD data allow for continuous and granular observation of actual trip patterns, making them particularly suitable for evaluating dynamic changes in bike-sharing usage across different urban zones.
To assess the effect of virtual geofence deployment, the analysis focuses on two time windows immediately before and after the implementation in April 2021. Selecting time intervals closer to the deployment date allows for a more direct examination of the effects of the virtual geofences while minimizing the influence of external factors. For instance, over longer periods after the deployment, demand could be influenced by changes such as variations in the number of sharing bikes deployed or the emerging introduction of electric sharing bikes. These factors might alter user preferences and obscure the causal relationship between virtual geofence installation and bike-sharing demand. By narrowing the scope to periods near the deployment, this study ensures that the observed changes in demand are primarily attributable to the virtual geofences, providing a more accurate assessment of their impact. In this study, trajectory data for dockless bike-sharing provided by the Huai’an Urban Management Bureau were utilized. The dataset comprises data for two consecutive five-day working periods: from 15 to 19 March 2021, before the implementation of parking regulations, and from 7 to 11 June 2021, following the implementation of the regulations. Only weekdays were selected for analysis, as bike-sharing usage patterns tend to be consistent across these days, providing a more accurate reflection of demand ( 50 ). The selected days were free from rain and extreme temperatures, conditions considered suitable for cycling, ensuring that the data represents typical bike-sharing usage. In total, 691,607 trajectory records were obtained. Each record contains eight fields: order ID, bike ID, start and end times, and the latitude and longitude coordinates of both the origin and destination points (ODs). In addition, the latitude and longitude coordinates of the virtual geofences were provided by the Huai’an Urban Management Bureau.
To explore the spatial characteristics of bike-sharing demand, the service area in HAC was divided into a latitude–longitude grid using ArcGIS version 10.8 (Esri. Inc, Redlands, CA, USA). Studies suggest that most bike-sharing users are willing to walk a maximum distance of 200 meters, making a 200 m × 200 m grid cell size appropriate ( 51 , 52 ). However, with 1,489 virtual geofenced parking zones deployed in the service area, excessively small grid cells would result in some cells having no fences. Conversely, it is recommended that the maximum acceptable distance should not exceed 500 meters ( 51 ). Based on this recommendation, the grid cell size was set to the maximum distance of 500 meters. Following this configuration, the 228.4 km2 service area in HAC was divided into 914 grid cells, with each cell containing, on average, multiple virtual geofenced parking zones. Accordingly, the number of grid cells across the districts is as follows: 237 cells in HAD, 274 in Qingjiangpu District, 210 in Huaiyin District and 193 in the EDZ. For each grid cell, demand is defined as the number of trips generated from and attracted to the cell ( 51 ). The daily average number of ODs after the implementation of virtual geofences was calculated to represent the demand within each cell ( 52 ). To ensure compatibility with count regression modeling requirements, these daily average OD values were rounded to the nearest integer before being used as the dependent variable in the negative binomial regression model. This preprocessing step follows established practices in transport-demand studies, where resampled or reconstructed trip counts are routinely rounded to meet the integer requirements of count models ( 53 , 54 ). Given the relatively stable OD volume across weekdays, this rounding method retains the core spatial pattern of demand.
Regression Analysis
Different forms of negative binomial regression model were employed in Stata version 15.1 (Stata Corp., College Station, TX, USA) to analyze the relationship between bike-sharing demand and its influencing factors after the implementation of parking regulations.
Count data models were deemed appropriate, with the Poisson regression model and the negative binomial regression model being common choices. Compared to Poisson regression, which assumes equal mean and variance (equidispersion), negative binomial regression models are suitable when the data exhibit overdispersion—that is, the variance of the dependent variable exceeds its mean. The presence of overdispersion in our count data was confirmed by the significance of the estimated dispersion parameter (α), which was consistently greater than zero across all models. This suggests that the variance substantially exceeds the mean and supports the use of the negative binomial regression model ( 55 – 57 ).
Additionally, although zero-inflated count models were considered as alternatives, they were ultimately not adopted. This decision was based on the observation that the proportion of zero OD counts was relatively low (less than 20%) and primarily concentrated in peripheral or parkland areas. These zero values likely reflect localized service boundaries or land-use types, rather than a structural absence of demand and therefore a standard negative binomial model was deemed sufficient to capture the variation in demand.
Regional-Wise Negative Binomial Regression Analysis
As extensively demonstrated in travel behavior research ( 32 , 58 – 60 ), this model establishes a functional relationship between bike-sharing demand and various influencing factors within each latitude and longitude grid cell.
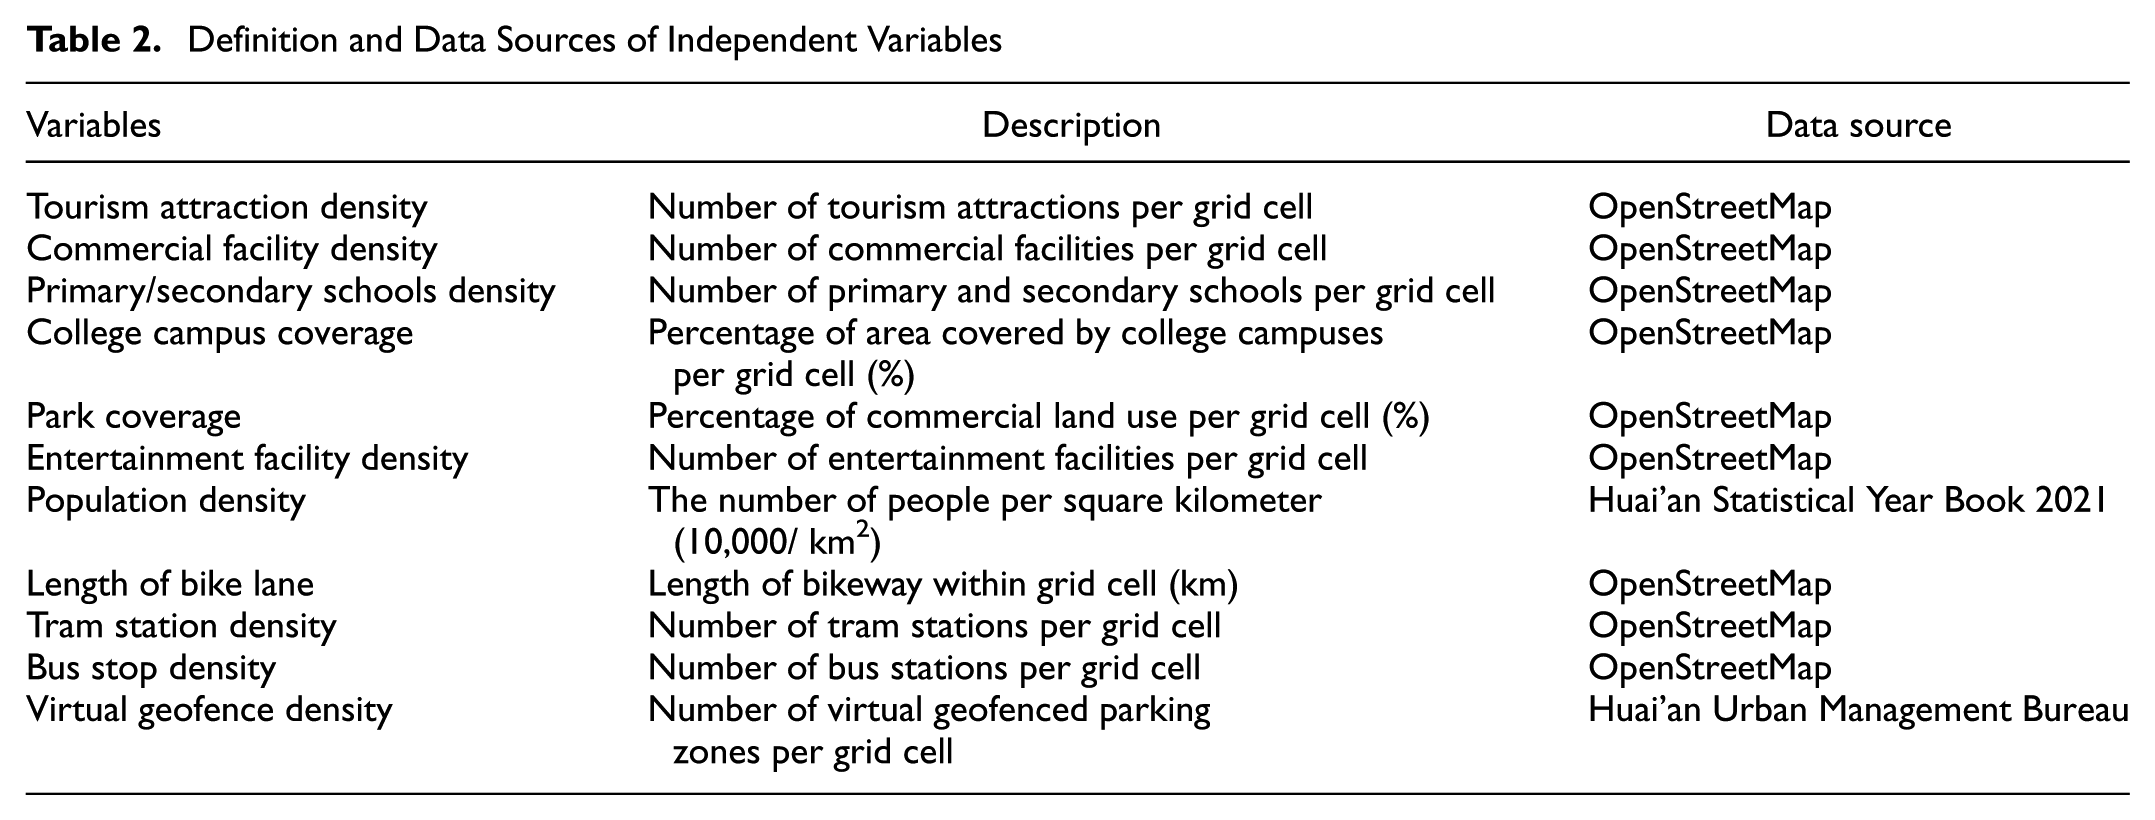
Based on literature reviews and expert opinions, the influencing factors were selected from the criteria used in studies that employed multi-criteria decision-making (MCDM) methods for planning docked stations. From the identified literature, criteria used more than three times were selected, resulting in 11 factors: population density, tourism attractions density, primary/secondary schools density, commercial facilities density, percentage of area covered by college campuses, percentage of land used for parks, Entertainment facility density, length of bike lanes, tram station density, bus stop density and vitual geofence density. The data sources for these variables are summarized in Table 2.
Definition and Data Sources of Independent Variables
The negative binomial regression model quantifying the relationship between bike-sharing demand before and after the implementation of parking regulation and its influencing factors has the following form:
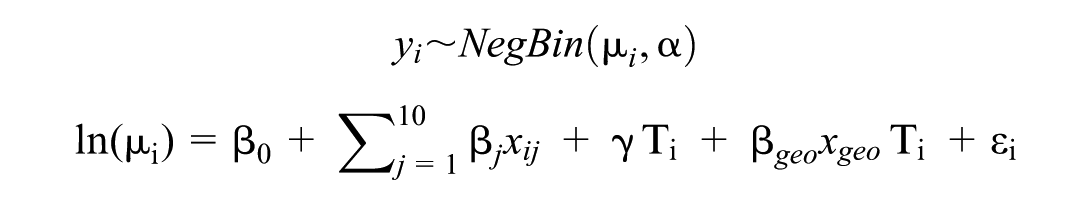
Specifically, the dependent variable y i is the number of bike-share trips in cell i at time t, where i refers to one particular cell of the latitude-longitude grid (i = 1, 2, … ). The dataset consists of a balanced panel including both pre- and post-regulation periods, with each service area cell observed twice (once before and once after implementation). The independent variable x i,j (i = 1, 2,. . . ; j = 1, 2, … , 10) represents the factor j (excluding the virtual geofence density) in the cell i and xgeo represents the variable of virtual geofence density. Ti is a binary dummy variable indicating whether the observation corresponds to the post-regulation period (Ti = 1) or the pre-regulation period (Ti = 0), and x geo Ti are interaction terms between virtual geofence density and post-regulation dummy. β0 denotes the intercept term, the scalar βj represents the regression coefficient of the independent variable x j in the regression equation, and finally, the scalar εi denotes the error from the potential omission of unknown variables in our model.
Crucially, virtual geofence density (x geo ) is introduced only through its interaction with the post-regulation dummy (x geo Ti). This specification reflects the institutional reality that geofences were structurally absent in the pre-regulation phase, where a value of zero indicates non-existence rather than “low density.” By contrast, in the post-regulation phase, a zero value represents the existence of geofencing as a regulatory instrument but no deployment in a given grid cell. Thus, this interaction ensures that the effect of geofence density is estimated only in the post-regulation period, avoiding any conflation of structural zeros in the pre-period with meaningful variation in the post-period.
In this specification, α represents the overdispersion parameter of the negative binomial model, which captures the extent to which the variance exceeds the mean. A statistically significant α value confirms the appropriateness of using a negative binomial model over a Poisson model, which assumes equality between mean and variance.
It should be noted that because it was only possible to obtain the average population density for each administrative district and not for each grid cell at the scale of interest, the population density in each grid cell is represented by the average population density of the administrative district to which the grid cell belongs.
Pooled Negative Binomial Regression Analysis
To complement the district-specific models presented in Section 3.3.1 and assess the robustness of the findings, we constructed a pooled negative binomial regression model using data from all four administrative zones. This model includes both pre- and post-policy implementation data and features a post-regulation dummy variable, district dummies, and interaction terms between spatial variables and district identifiers.
This pooled modeling strategy is intended to address the reviewer’s concern about the limited sample size in individual districts and to provide generalized estimates that are more applicable to citywide decision-making. Rather than running separate models, we capture heterogeneity by including interaction terms, allowing us to assess both general effects and district-specific deviations.
The model structure is defined as follows:
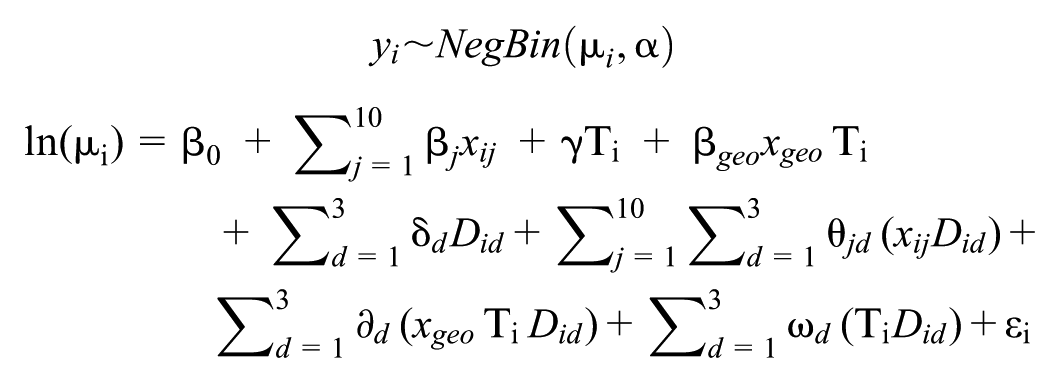
Where:
yi is the OD count in grid cell i;
Ti is a dummy variable indicating whether the observation is from the
post-regulation period;
Ti
α is the overdispersion parameter of the negative binomial distribution.
Results
Descriptive Statistics
The spatial distribution of bike-sharing trips in HAC displays notable imbalances even before the implementation of parking regulations. Demand was heavily concentrated in downtown districts—HAD, Qingjiangpu, and Huaiyin—which together accounted for the majority of system usage. In contrast, the suburban EDZ exhibited substantially lower trip volumes, reflecting its limited accessibility, more dispersed built environment, and lower baseline ridership.
These differences are further reflected in the characteristics of the built environment. Table 3 presents the descriptive statistics of 11 spatial variables measured across 914 grid cells (500 m × 500 m). The values of these variables show considerable variation across the study area—for example, population density ranges from 500 to 12,000 persons/km2, and commercial facility density ranges from 0 to 10 facilities per grid. These wide ranges suggest substantial heterogeneity in land-use intensity, accessibility, and infrastructure provision across different urban zones. Such variation may underlie the observed spatial differences in bike-sharing demand and will be formally examined in the subsequent regression analysis.
Descriptive Statistics for Independent Variables Based on 500 m × 500 m Grid Units (N = 914)
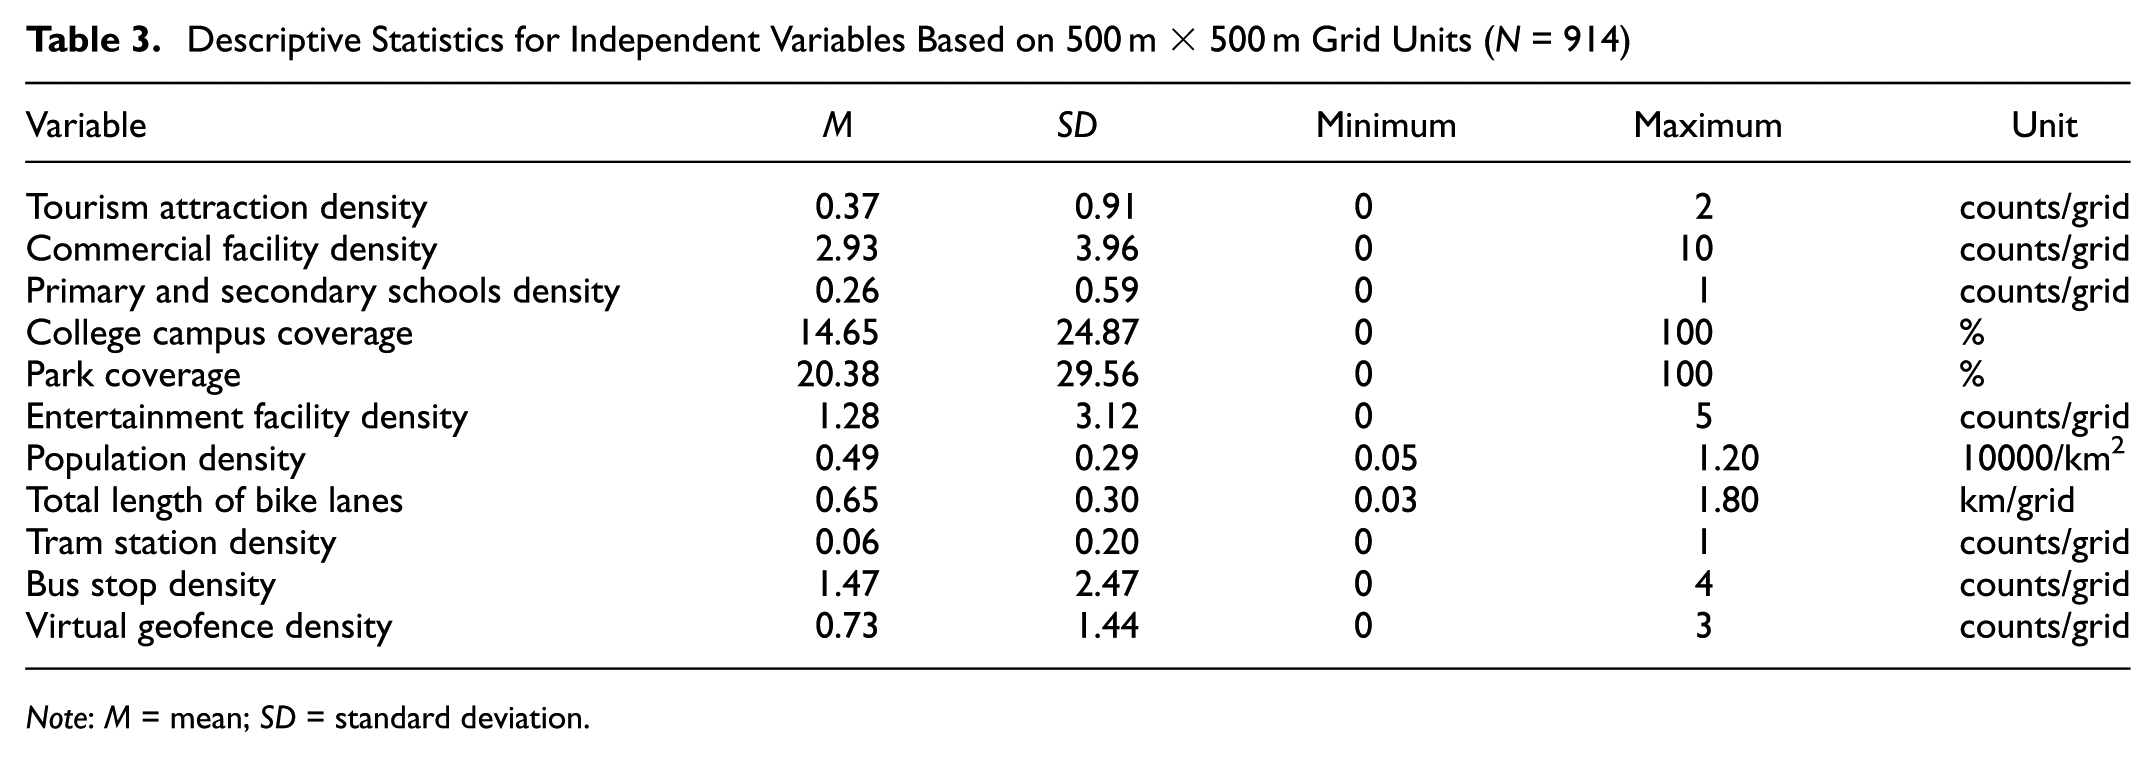
Note: M = mean; SD = standard deviation.
Specifically, the average tourism attraction density was 0.37 counts/grid (SD = 0.91), ranging from 0 to 8 counts/km2. Commercial facilities showed a mean density of 2.93 counts/grid (SD = 3.96), with a maximum of 10 counts/grid, reflecting the moderate urban commercial activity in the study area. Primary and secondary school densities averaged 0.26 counts/grid (SD = 0.59), with a maximum of 1 counts/grid. Coverage of college campuses and parks varied widely, averaging 14.65% (SD = 24.87) and 20.38% (SD = 29.56), respectively, with some grid cells fully covered (100%).
Entertainment facilities had a mean density of 1.28 counts/grid (SD = 3.12), indicating moderate recreational infrastructure. Population density varied considerably across the study area, with a mean of 4,900 persons/km2 (SD = 2,987), ranging from 500 to 12,000 persons/km2. The total length of bike lanes per grid cell averaged 0.65 kilometers (SD = 0.30), consistent with urban mid-level cycling infrastructure.
Transit accessibility showed low tram station density (mean = 0.06 counts/grid, SD = 0.20, max = 1), while bus stops were more frequent, averaging 1.47 counts/grid (SD = 2.47). Virtual geofence density averaged 0.73 counts/grid (SD = 1.44), with notable variation across grid cells.
These spatial variables are relatively static over the short policy intervention period, and as such, they help explain baseline differences in bike-sharing demand across districts, specifically, why the EDZ had lower usage levels than downtown areas even before the regulation. Understanding these built environment patterns provides necessary context for interpreting how different areas responded to policy changes, as analyzed in the next sections.
Variations in Demand Before and After Parking Regulation
To further illustrate the temporal change in bike-sharing demand, Figure 3 presents the daily number of OD trips recorded in each of the four districts—HAD, Qingjiangpu, Huaiyin, and the EDZ—during two five-day periods before and after the implementation of the parking regulation. After the implementation of the parking regulation, disparities in bike-sharing demand became more visible across districts. As shown in Figure 3, all four districts exhibited a slight downward trend in OD trip counts following the policy change. However, the magnitude of this decline varied notably. The EDZ displayed a particularly sharp and consistent drop in daily demand, while the decreases observed in HAD, Qingjiangpu, and Huaiyin were relatively modest and fluctuated within a narrower range. This visual pattern suggests that the differences in infrastructure density and baseline accessibility in the EDZ meant it was more strongly affected by the new parking requirements.
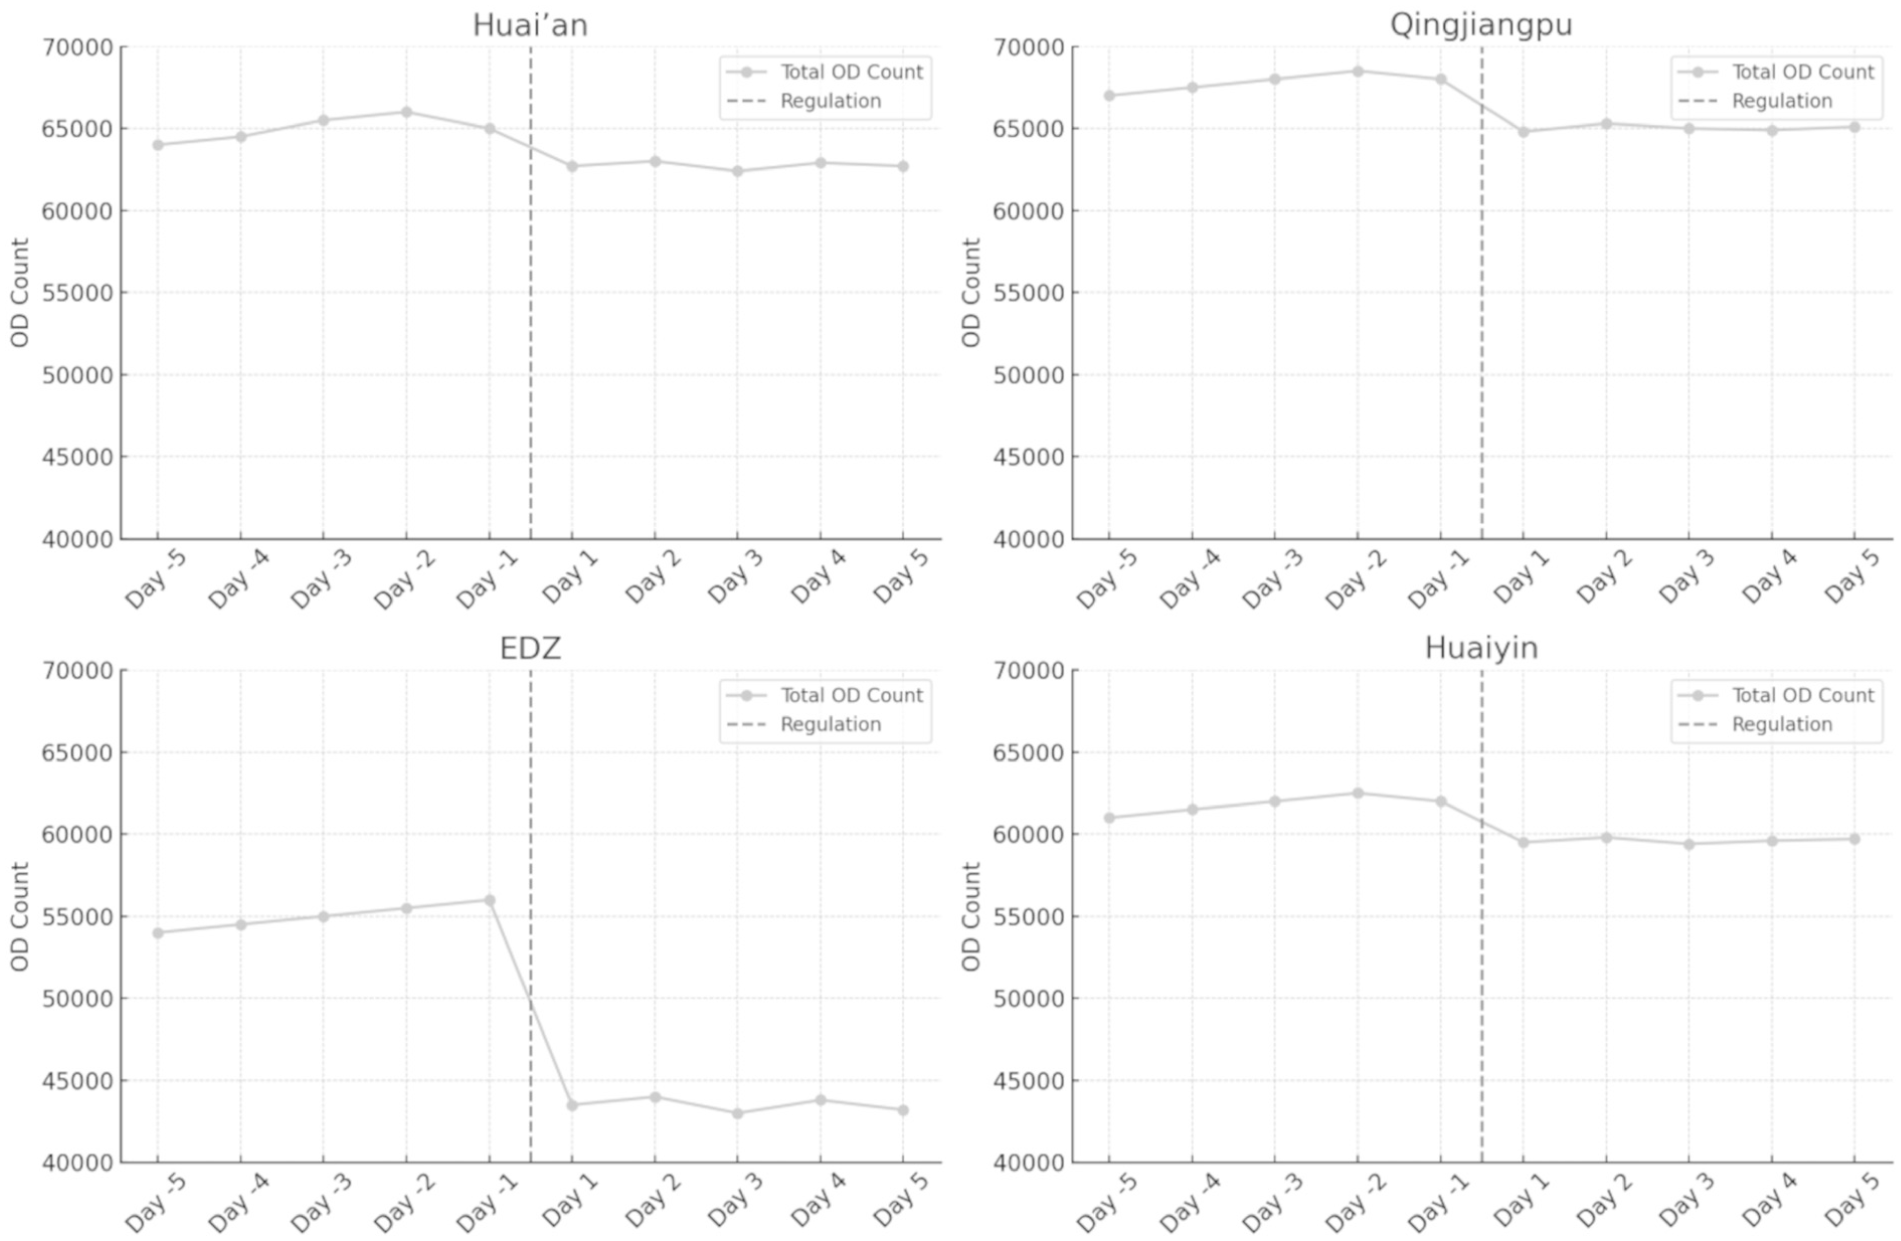
Temporal variation in district-wise bike-sharing OD counts before and after regulation.
In addition to visualizing these temporal trends, the subsequent regression analysis formally assesses whether the observed changes are statistically significant and attributable to policy intervention. Specifically, we incorporate a post-regulation dummy variable in both the regional-wise and pooled negative binomial regression models (see Sections 4.3.1 and 4.3.2) to capture the average treatment effect of the regulation. This allows us to quantify and compare how demand changed across districts in response to the new parking requirements, and whether such changes were consistent with expectations based on spatial characteristics.
Modeling results
Regional-wise Negative Binomial Regression Analysis
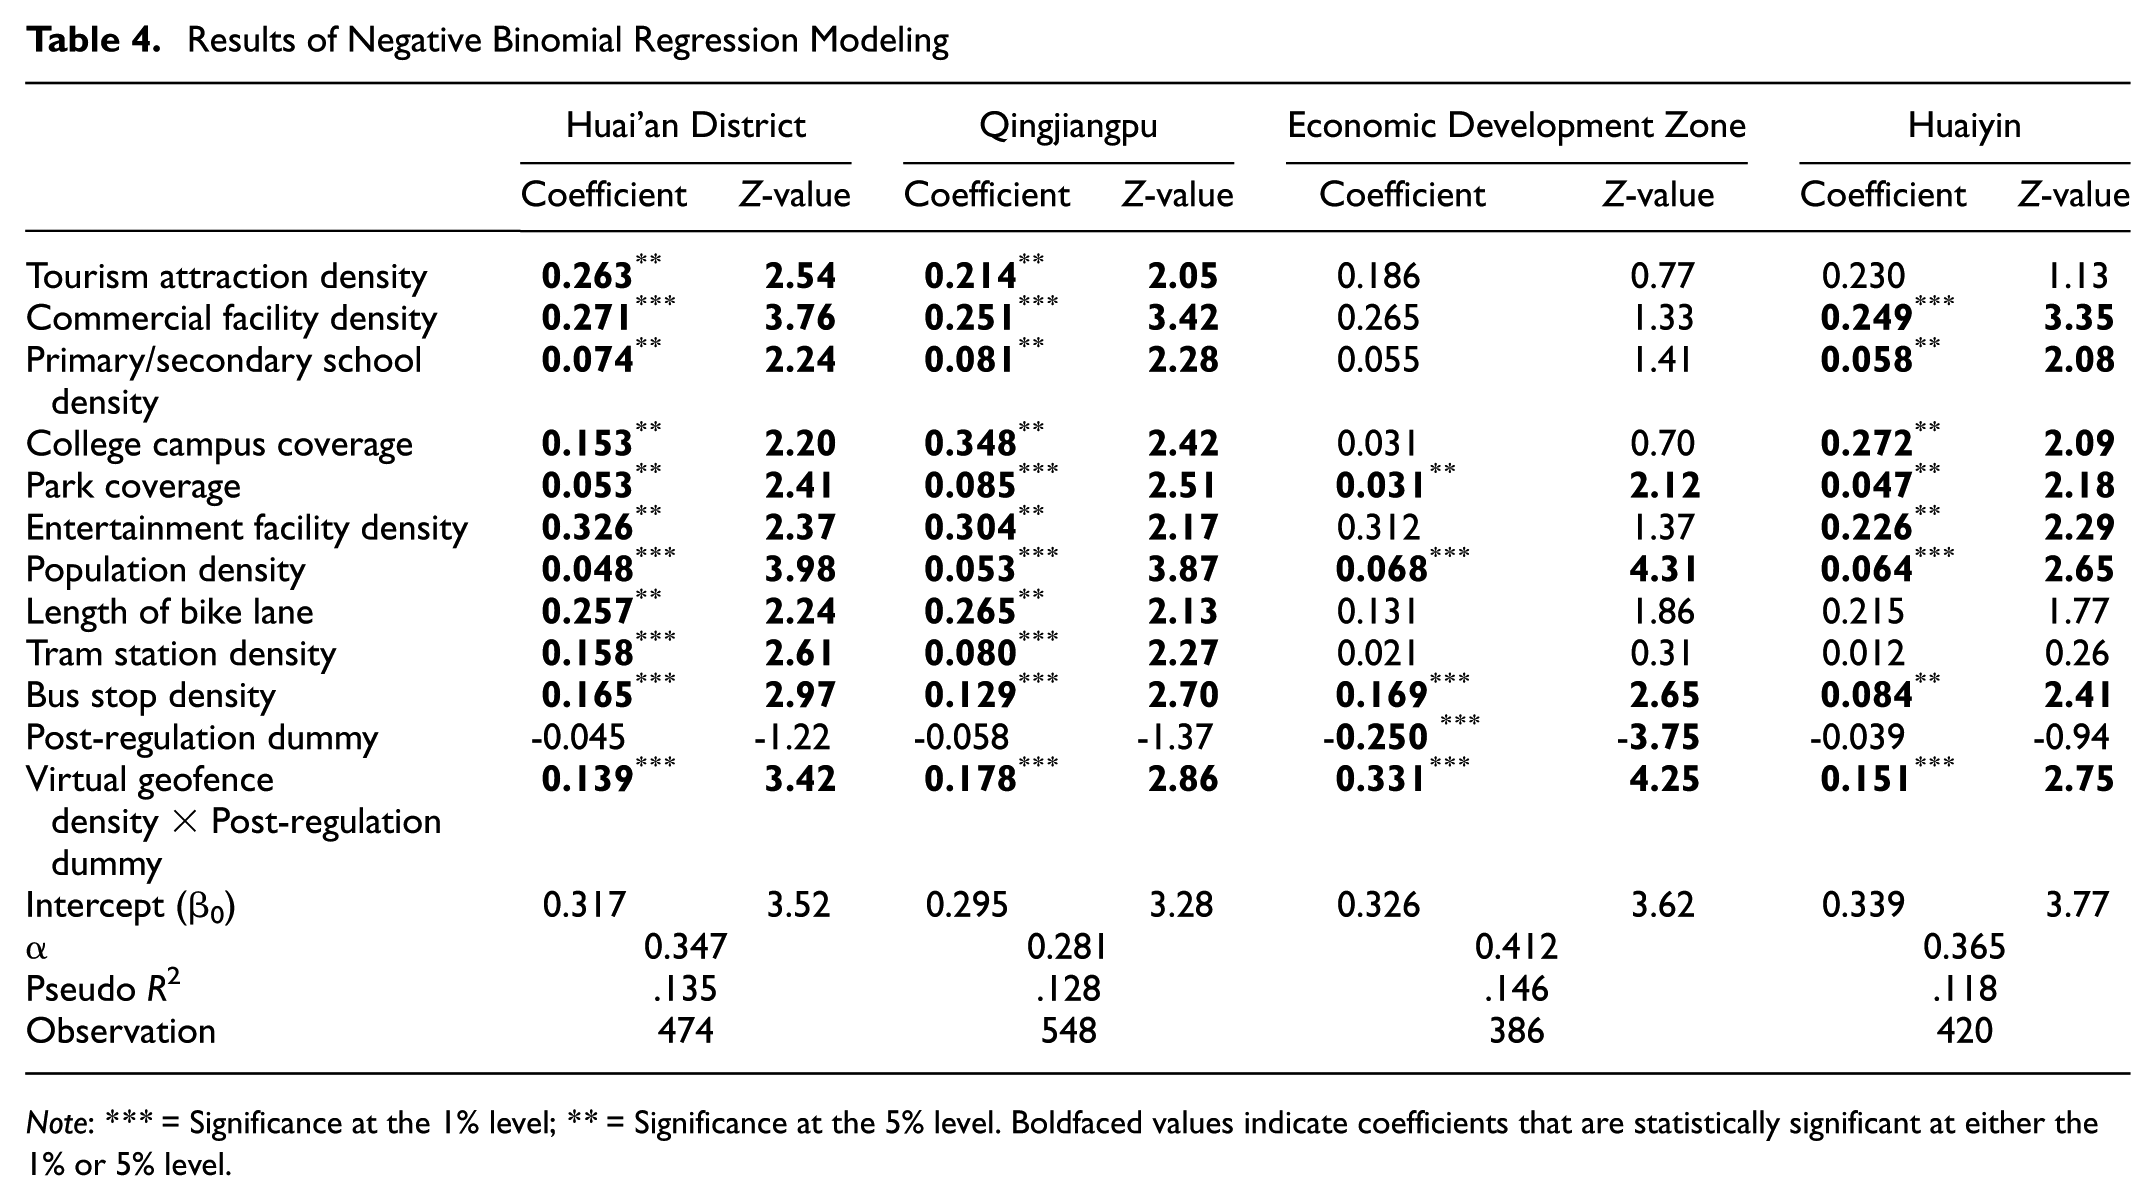
The overdispersion parameter (α) in all models significantly differs from 0, confirming the suitability of the negative binomial regression model over the Poisson model. The pseudo-R2 values range from 0.118 to 0.146, indicating a good fit and consistency between predicted and observed bike-sharing demand.
The regression results in Table 4 reveal several important findings about the determinants of bike-sharing demand across urban districts following the implementation of virtual geofenced parking. Population density, park coverage, and bus stop density consistently show positive and statistically significant effects in all districts, indicating their strong and stable influence on ridership. Other built environment variables, such as commercial facility density and entertainment facility density, also demonstrate significant positive effects in HAD, Qingjiangpu, and Huaiyin, though their impacts are not statistically significant in the EDZ. Primary and secondary school density is positively associated with demand in downtown areas, while college campus coverage exerts the strongest influence in Qingjiangpu (β = 0.348, z = 2.43), reflecting the high concentration of universities and student riders.
Results of Negative Binomial Regression Modeling
Note: *** = Significance at the 1% level; ** = Significance at the 5% level. Boldfaced values indicate coefficients that are statistically significant at either the 1% or 5% level.
Notably, the impact of virtual geofence deployment is captured exclusively by the interaction term with the post-regulation dummy (Virtual geofence × Post). While all districts show positive associations, the impact is particularly pronounced in the EDZ (β = 0.331, z = 4.26), where lower fence coverage and limited accessibility may intensify users’ sensitivity to reduced convenience. In comparison, downtown areas such as HAD (β = 0.139, z = 3.42) and Qingjiangpu (β = 0.178, z = 2.86) exhibit more modest, though still significant, coefficients.
The post-regulation dummy variable, which captures changes in demand after the enforcement of virtual parking zones, further confirms spatial disparities in policy responsiveness. While HAD (β = –0.045, z = –1.22), Qingjiangpu (β = –0.058, z = –1.37), and Huaiyin (β = –0.039, z = –0.94) display small and statistically insignificant declines, the EDZ shows a substantial and significant decrease in demand (β = –0.250, z = –3.75). These combined results suggest that although the regulation had limited observable impact on downtown usage, its implementation in suburban contexts like the EDZ led to a marked reduction in ridership, highlighting the importance of accounting for spatial heterogeneity when evaluating policy interventions in shared mobility systems.
Pooled Negative Binomial Regression Analysis
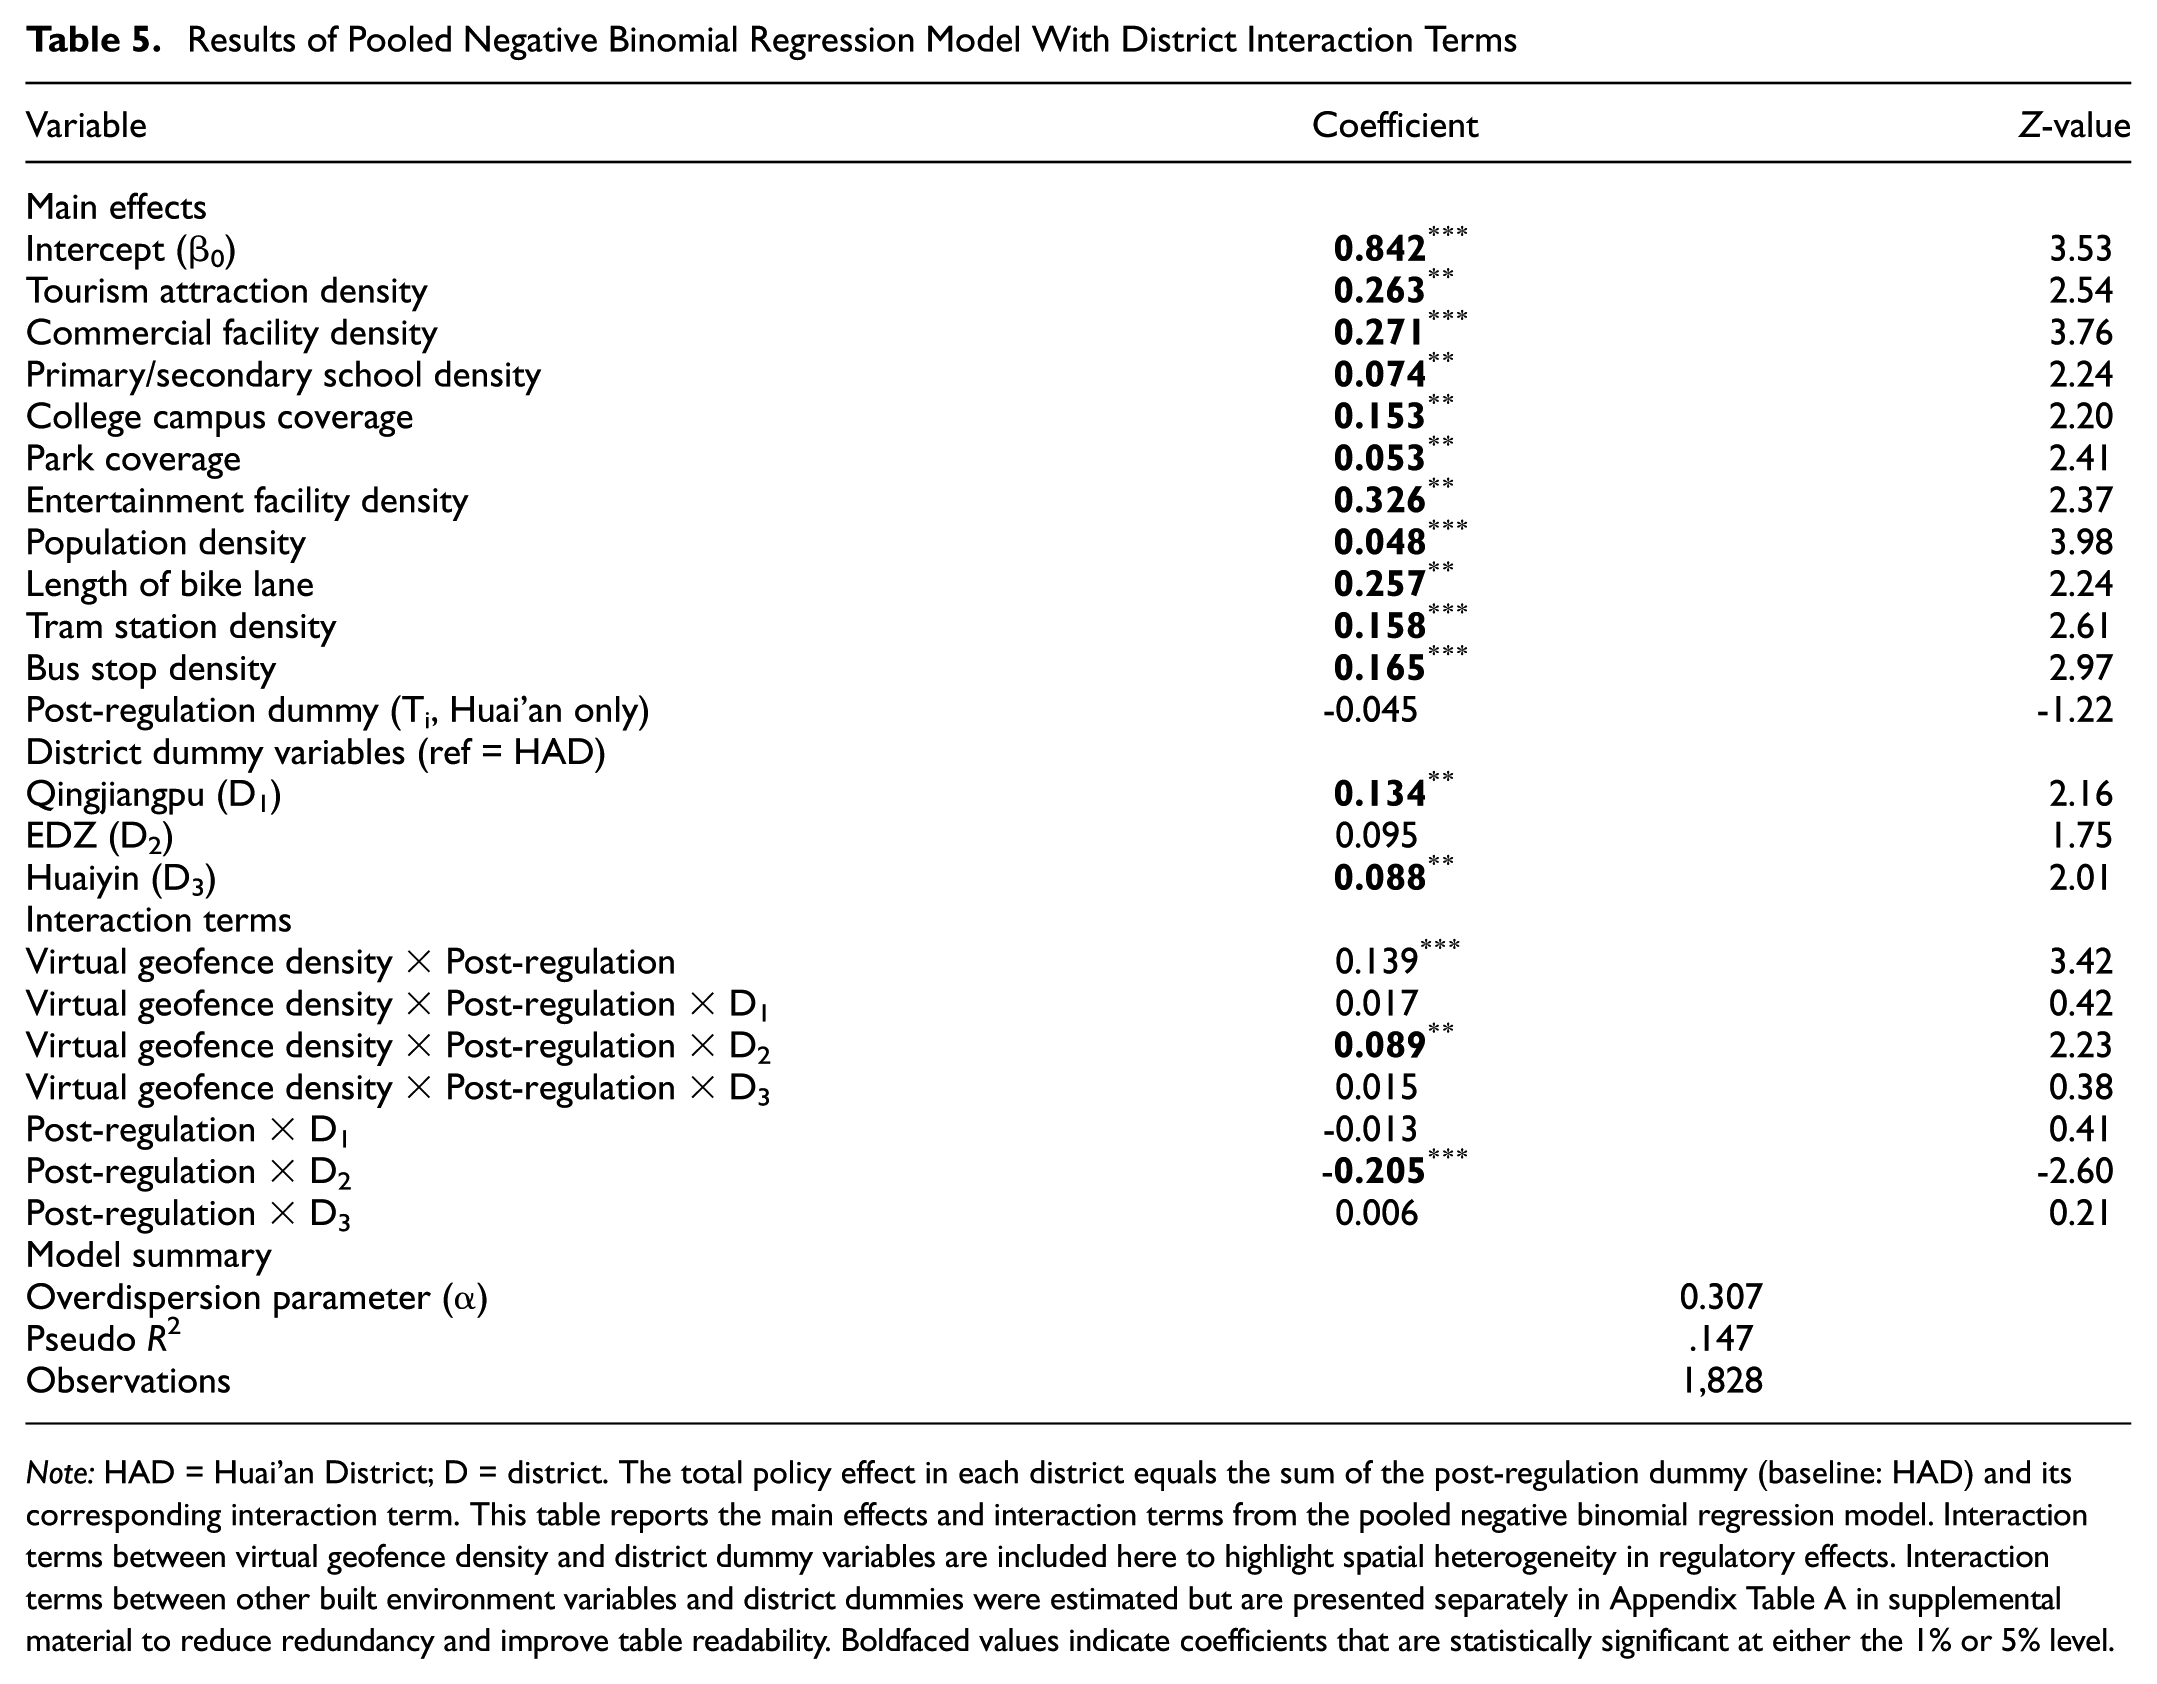
Table 5 presents the results of the pooled negative binomial regression model, which incorporates both district-specific and policy-related interaction terms. This approach enables a unified assessment of spatial and temporal heterogeneity across the entire service area. Importantly, the pooled model complements and reinforces the zone-specific regression models presented in Section 4.3.1. Specifically, the total effects observed in the pooled model—derived by summing the main effects and corresponding interaction terms—closely align with the coefficients estimated in the regional models, thereby validating the robustness and consistency of both modeling strategies.
Results of Pooled Negative Binomial Regression Model With District Interaction Terms
Note: HAD = Huai’an District; D = district. The total policy effect in each district equals the sum of the post-regulation dummy (baseline: HAD) and its corresponding interaction term. This table reports the main effects and interaction terms from the pooled negative binomial regression model. Interaction terms between virtual geofence density and district dummy variables are included here to highlight spatial heterogeneity in regulatory effects. Interaction terms between other built environment variables and district dummies were estimated but are presented separately in Appendix Table A in supplemental material to reduce redundancy and improve table readability. Boldfaced values indicate coefficients that are statistically significant at either the 1% or 5% level.
With respect to policy impacts, the post-regulation dummy variable is statistically insignificant in the baseline district HAD (β = -0.045, z = –1.22), indicating no notable change in bike-sharing demand following the implementation of virtual geofence regulations. The interaction terms for Qingjiangpu (β = -0.013, z = 0.41) and Huaiyin (β = 0.006, z = 0.21) are also small and not statistically significant, suggesting that policy effects in these districts are comparable to the baseline HAD. In contrast, the EDZ exhibits a significantly negative interaction effect (β = –0.205, z = –2.60), which, when combined with the baseline effect, yields a total post-regulation effect of β = –0.250. This corresponds to an approximate 22.1% reduction in OD counts (exp(–0.250) ≈ 0.779), consistent with the EDZ specific estimate from the regional-wise regression in Table 4. These findings reveal spatial heterogeneity in policy responsiveness and highlight that suburban areas may face more pronounced demand suppression under stricter parking regulations.
Crucially, the effect of virtual geofence deployment is modeled exclusively through its interaction with the post-regulation dummy, since virtual geofences did not exist in the pre-regulation period. The coefficient on this interaction term is positive and statistically significant (β = 0.152, z = 3.05), indicating that higher virtual geofence density is associated with greater bike-sharing demand once the policy was in place. This finding aligns with the district-level regressions, confirming that the introduction and scaling of virtual geofences enhanced demand under the new regulatory framework.
Further, the district-specific interaction terms of geofence density × post-regulation reveal important spatial heterogeneity. In the EDZ, the interaction effect is significantly stronger (β = 0.089, z = 2.23), implying that the positive demand response to geofence deployment is amplified in suburban areas relative to the baseline district of HAD. In contrast, the interaction terms for Qingjiangpu and Huaiyin are small and statistically insignificant, suggesting that the effect of geofence deployment in these districts is comparable to the baseline.
The pooled model reveals both consistent baseline effects and important spatial variations in built environment factors. In the baseline district of HAD, variables such as commercial facility density (β = 0.271, z = 3.76), entertainment facility density (β = 0.326, z = 2.37), population density (β = 0.048, z = 3.98), and bike lane length (β = 0.257, z = 2.24) are significantly and positively associated with bike-sharing demand, reaffirming their importance in shaping urban mobility patterns. Furthermore, interaction terms of these built environment factors with district dummies (reported in Appendix Table A in supplemental material) show that the strength of these associations varies across zones. For example, Qingjiangpu exhibits slightly stronger effects for college campus coverage and commercial facilities, while the EDZ shows a diminished association with entertainment and commercial density. These variations mirror the regional model results in Table 5 and underscore the spatial heterogeneity of environmental influences on demand. The alignment between the pooled and zone-specific estimates reinforces the robustness of the analytical framework.
Taken together, the pooled model not only replicates the core findings of the district-level regressions but also offers additional generalizability and statistical efficiency. It confirms that the demand response to geofencing policies and the influence of spatial variables vary by district, underscoring the importance of tailored policy design in micromobility management.
Discussion
Baseline Demand Differences and the Roles of Built Environment Characteristics
Before deploying virtual geofences, bike-sharing demand was primarily concentrated in downtown areas, where the distribution of demand was relatively uniform across districts. In contrast, the demand in suburban areas was significantly lower than in downtown areas. The differences between downtown and suburban areas in various characteristics may explain the uneven distribution of bike-sharing demand.
In HAC, the uneven demand distribution can largely be attributed to population density disparities between downtown and suburban areas. Downtown districts have high population density, whereas suburban service areas often consist of industrial land, resulting in a sparse and dispersed population. Previous studies have shown that bike-sharing stations located in areas with higher population density tend to have higher ridership ( 40 , 61 ), which aligns with the higher bike-sharing demand observed in downtown districts.
The presence of numerous commercial and entertainment facilities in downtown areas also contributes to their higher bike-sharing demand. Downtown districts are ideal for short trips ( 45 ), and residents frequently use sharing bikes to access nearby facilities. The differences in the density and types of commercial and entertainment facilities between downtown and suburban areas further explain this pattern. Suburban commercial facilities, often supermarkets, cater to large-scale purchases typically made by car rather than by bike. Additionally, these facilities are more dispersed, making it inconvenient for users to rely on sharing bikes for long-distance travel. As a result, the impact of commercial facilities on bike-sharing demand in suburban areas is insignificant, leading to lower overall demand.
Extensive public transportation networks in downtown areas further promote bike-sharing usage. Traffic congestion during peak hours often makes car commuting inconvenient, whereas the flexibility of bike-sharing provides an effective alternative. sharing bikes are not only used independently but also integrated with other public transport modes, such as trams and buses, solving last-mile connectivity issues and boosting demand.
The significant impact of college density on bike-sharing demand aligns with findings by Tran et al. ( 30 ), confirming that college students are a key user group. Moreover, colleges contribute to the development of commercial and entertainment facilities, reinforcing the high demand for bike-sharing in downtown districts such as Qingjiangpu, where both students and facilities are densely concentrated.
While primary and secondary schools may generate commuting trips, the dispersed distribution of schools and residential areas in suburbs limits their impact on bike-sharing demand. This contributes to the uneven demand distribution between downtown and suburban areas.
Parks, which are distributed throughout the bike-sharing service area, influence demand uniformly across all areas, as people often use sharing bikes for recreational purposes, such as strolling around parks. However, factors related to functional purposes, such as shopping and commuting, have limited significance in suburbs, highlighting a contrast in how sharing bikes are used between downtown and suburban areas. Unlike parks, tourist attractions are scarce in suburban areas, concentrating their impact on demand in downtown districts where most attractions are located. This disparity further explains the uneven distribution of bike-sharing demand.
Policy-Induced Demand Changes and the Role of Virtual Geofence Density
Building on the spatial disparities outlined above, this section examines how bike-sharing demand shifted following the implementation of virtual geofence regulations, with particular attention to cross-district differences in response.
To begin with, model results consistently demonstrate that only the EDZ experienced a statistically significant decrease in bike-sharing demand following the implementation of virtual geofence regulations. Specifically, the post-regulation dummy × geofence density interaction term is statistically significant and negative, indicating that the adverse policy effect becomes stronger as geofence density decreases. This pattern is most evident in the EDZ, where geofence density is substantially lower than in downtown districts. In contrast, in districts such as HAD, Qingjiangpu, and Huaiyin—where geofence networks are denser—the interaction effect mitigates the inconvenience introduced by the regulation, and the overall post-regulation impact remains statistically insignificant. This finding confirms that the EDZ was uniquely sensitive to the transition from dockless to virtual geofenced parking, while demand in other districts remained relatively stable. These converging results highlight the robustness of the estimation framework and underscore the importance of accounting for spatial heterogeneity when evaluating policy effects.
A likely explanation lies in the reduced convenience introduced by the new parking policy. Dockless systems allowed door-to-door travel, whereas the virtual geofenced model requires users to spend additional time locating and accessing designated parking zones. This added inconvenience appears to have discouraged use, particularly in areas with sparse fence deployment. The regression results support this interpretation: the significant interaction between geofence density and the post-regulation dummy confirms that lower fence density exacerbates the inconvenience, discouraging use particularly in the EDZ. Conversely, denser geofence networks in downtown districts help preserve convenience, offsetting potential negative impacts.
Although built environment factors such as commercial facility density, entertainment facility density, population density, and bike lane length vary across districts and help explain baseline differences in bike-sharing demand, these characteristics are relatively static over the short policy intervention period. These static characteristics can explain baseline differences in bike-sharing demand across districts—specifically, why the EDZ had lower demand than central districts even before the implementation of the parking regulation. That is, their values remained essentially unchanged before and after the implementation of virtual geofenced parking regulations. Consequently, the regression models have controlled for these static factors when estimating the impact of the policy. Unlike these static controls, geofence density explicitly enters the model through its interaction with the post-regulation dummy, enabling us to identify its moderating role in shaping demand responses.
Given the dispersed demand distribution and relatively low virtual geofence density in suburban areas, increasing fence density could help mitigate the inconvenience caused by parking regulations. Studies have shown that insufficient fence deployment undermines the advantages of dockless systems ( 17 ), and suburban residents often face reduced accessibility to shared bikes ( 26 ). Although the current low fence density in suburbs may stem from limited local demand, it further dampens usage by increasing the time and effort needed to obtain and return bikes. Thus, the impact of virtual geofence density on bike-sharing demand is more pronounced in suburbs than in downtown areas.
However, deploying a high density of virtual fences in low-demand areas may not be economically sustainable. This trade-off calls for a balanced strategy. First, investment in virtual geofence infrastructure should consider diminishing marginal returns; previous research suggests that beyond a certain threshold, additional fences contribute only modestly to demand growth ( 17 ). Second, a hybrid parking approach may be viable: while downtown districts adopt mandatory virtual geofenced parking, suburban areas could retain more flexible dockless modes. Such mixed deployment strategies—phased by area characteristics—can better accommodate heterogeneous user needs and operational constraints ( 50 , 62 – 64 ).
By optimizing fence density and adopting differentiated parking policies, bike-sharing systems can improve user satisfaction and accessibility while maintaining economic feasibility.
Conclusion
This study examined spatial heterogeneity in bike-sharing demand in Huai’an by analyzing built environment factors and evaluating the impact of a citywide parking regulation that introduced virtual geofenced parking zones. Using negative binomial regression models at both the district level and a pooled citywide level, the study revealed two key sets of findings: (1) baseline demand patterns were strongly shaped by variations in land use, infrastructure, and population distribution; and (2) the effect of the parking regulation varied significantly across districts, depending on the density of virtual geofence deployment.
First, bike-sharing demand was consistently higher in downtown districts such as HAD, Qingjiangpu, and Huaiyin, where higher population density, more commercial and entertainment facilities, and better public transport access contributed to greater usage. In contrast, the EDZ, a suburban area with more fragmented development and lower amenity density, showed substantially lower baseline demand.
Second, following the implementation of the virtual parking regulation, only the EDZ experienced a statistically significant decline in demand, whereas the changes in other districts were minor and not statistically significant. This divergence is attributable to differences in virtual geofence density: the EDZ had notably sparse coverage, making it more difficult for users to access parking zones, while downtown areas had denser and more evenly distributed fences, which helped preserve convenience and sustain demand. Importantly, built environment factors remained stable during the study period, reinforcing the interpretation that observed demand variations were driven by changes in parking infrastructure rather than changes in land use or population.
These findings highlight the need for nuanced micromobility governance strategies that account for spatial variation in user needs and infrastructure conditions. To improve the effectiveness and sustainability of parking regulations, it is recommended that virtual geofences be strategically deployed in low-density suburban areas to enhance accessibility while avoiding overinvestment. Additionally, future planning should include an economic evaluation of fence density thresholds to identify the point at which additional infrastructure yields diminishing returns. Finally, rather than applying a uniform policy citywide, a hybrid parking approach may be more practical—maintaining flexible dockless operation in suburban zones while enforcing stricter geofenced parking controls in denser downtown districts where regulation is easier to implement and user compliance is higher.
Overall, this study contributes empirical evidence to inform spatially adaptive parking policies and infrastructure planning for shared micromobility systems.
Supplemental Material
sj-docx-1-trr-10.1177_03611981251398751 – Supplemental material for How Parking Regulations Enforced with Virtual Geofences Influence Bike-Sharing Demand: A Case Study in China
Supplemental material, sj-docx-1-trr-10.1177_03611981251398751 for How Parking Regulations Enforced with Virtual Geofences Influence Bike-Sharing Demand: A Case Study in China by Xiaozhou Ye in Transportation Research Record
Footnotes
Acknowledgements
The author thanks Helen Poltimäe for her valuable guidance throughout the preparation of this manuscript. The author also used ChatGPT only to assist with language polishing and improving clarity. It was not used to generate content, analyze data, or interpret results, and the author takes full responsibility for all content.
Author Contributions
The author confirms sole responsibility for the following: study conception and design, data collection, analysis and interpretation of results, and manuscript preparation.
The author reviewed and approved the final version of the manuscript.
Declaration of Conflicting Interests
The author declared no potential conflicts of interest with respect to the research, authorship, and/or publication of this article.
Funding
The author received no financial support for the research, authorship, and/or publication of this article.
Data Accessibility Statement
The data used in this study were obtained from Huai’an Urban Management Bureau and local bike-sharing operators under a data use agreement. Due to privacy and confidentiality restrictions, these data are not publicly available. Processed or aggregated data may be made available from the corresponding author upon reasonable request.
Supplemental Material
Supplemental material for this article is available online.
References
Supplementary Material
Please find the following supplemental material available below.
For Open Access articles published under a Creative Commons License, all supplemental material carries the same license as the article it is associated with.
For non-Open Access articles published, all supplemental material carries a non-exclusive license, and permission requests for re-use of supplemental material or any part of supplemental material shall be sent directly to the copyright owner as specified in the copyright notice associated with the article.