
Abstract
The advancement of driving automation systems is transforming surface transportation. Understanding how drivers develop trust in these systems is crucial for their effective implementation. This study investigated the influence of drivers’ initial expectations and the consistency in system errors on trust in a Level-3 automated driving system (ADS). Participants read descriptions that characterized system capabilities to be either high or low, following which their initial levels of expectation were assessed. Error patterns (no, consistent, inconsistent errors) were manipulated across three simulated drives. Subjective trust ratings after each drive and reaction time to takeover requests (TORs) were measured. Results showed that initial expectations did not significantly impact overall trust or TOR performance; instead, trust was adjusted based on the system’s actual performance. These suggested a greater influence of direct experience over drivers’ preconceived expectations. The perceived predictability of the system partially mediated the effect of error consistency on trust, with inconsistent errors worsening TOR performance. The study highlighted the need for predictable ADS designs and driver-system interactions to enhance trust and road safety.
Keywords
In recent years, driving automation systems have advanced significantly, promising to transform the landscape of surface transportation. These systems, which assist drivers by consistently managing various aspects of the dynamic driving task ( 1 ), are designed to enhance road safety, increase driving efficiency, and reduce crashes involving human error ( 2 , 3 ). Despite their potential benefits, driving automation systems introduce new challenges, particularly concerning drivers’ trust and usage of the systems. Trust is crucial as it forms the basis for acceptance, the precondition of achieving the anticipated benefits of driving automation systems ( 4 ). Both system performance and drivers’ preexisting attitudes can affect trust formation and adoption of the system ( 5 ). The current study investigated how drivers formed trust as a function of their preexisting expectations and consistency in system errors made by the driving automation systems.
Trust in Driving Automation Systems
Trust in automation is “the attitude that an agent will help achieve an individual’s goals in a situation characterized by uncertainty and vulnerability” ( 6 ). In other words, a driver’s trust in automated driving systems (ADSs) reflects their belief that the system will support them in achieving the overarching goal of safe and efficient transportation under uncertain road conditions. This belief depends on the vehicle’s ability to accurately execute its programmed tasks amid variable road scenarios and potential risks.
Trust is a dynamic concept. The initial level of the drivers’ trust can be quickly influenced by initial experiences with automation systems ( 7 , 8 ). Through continuous interactions, trust further develops and stabilizes based on cumulative experiences with the system ( 5 , 9 ) as drivers gain a clearer understanding of its capabilities and limitations. This adjustment process to align trust with the system’s performance, whether through direct interactions or other informative experiences, is known as trust calibration ( 6 , 10 , 11 ). However, it is important to note that the appropriate level of trust is not objectively known. In this study, we therefore focus on the dynamics of trust—how drivers’ trust adjusts even with relatively little direct experience with the system.
The Society of Automotive Engineers categorizes levels of automation in driving automation systems from 0 to 5: Level 0 is no automation, which requires the human to perform all driving tasks; Level 5 involves full automation without human intervention ( 1 ). Specifically, Level 2 involves partial automation, where the vehicle can steer and accelerate, but the human must always remain attentive. Level 3 is conditional automation, where the vehicle can handle all driving aspects under certain conditions without human intervention, but the operator needs to be ready to take control when needed. Our study focused on Level-3 ADSs, which represent a shift that places greater reliance on the system’s autonomous functions than Level 2 and below do ( 1 ), elevating the importance of trust in the vehicle’s ability to perform safely and reliably without constant human oversight. Without adequate trust, drivers might underutilize these systems, missing safety and efficiency benefits, or overtrust them, neglecting necessary supervisory roles and potentially dangerous situations ( 12 ). Therefore, understanding and fostering calibrated trust is paramount for road safety when integrating ADSs.
Driver Expectations
Drivers’ expectations originate from their mental models of the driving automation systems. A mental model of a system is a person’s internal representation of that system, including its purpose, structure, and functioning ( 13 , 14 ), enabling one to predict and interpret system behaviors effectively ( 15 , 16 ). Mental models develop based on several factors, including past interactions with similar systems, instructional guidance, environmental context, and ongoing feedback from the system ( 17 ). From drivers’ mental models emerge drivers’ expectations, their beliefs, anticipations, or assumptions that drivers have about how a system or situation will behave or unfold in the future ( 18 ). Because mental models are inherently personal and can vary widely among individuals, expectations can vary widely among drivers and change over time.
Mental models, and thus expectations, evolve with experience. A recent on-road study ( 19 ) investigated the evolution of drivers’ mental models over time, particularly in response to encounters with specific edge cases in naturalistic driving contexts. The results showed that drivers’ mental models were shaped and adjusted based on experiences that challenged their initial understanding of the system. Through repeated interactions with the system, drivers progressively aligned their expectations with the system’s actual performance.
Setting drivers’ expectations of the driving automation systems may have an impact on trust. Previous research has shaped participants’ expectations through instructions on system capabilities before interaction with the driving systems, revealing mixed results on how expectations influenced trust in systems. Beggiato and Krems ( 20 ) manipulated participants’ expectations by providing some participants with descriptions of an error-free, Level-2 system (i.e., an incomplete and idealized mental model) while others with comprehensive descriptions that included potential system failures (i.e., a correct mental model). When system failures occurred, trust was lowered for the former participants but increased for those with a correct mental model, underscoring the pivotal influence of mental models on trust. Similarly, Victor and colleagues ( 21 ) varied participants’ expectations through the level of detail in instructions about the system’s capabilities before drivers interacted with a driving automation system. They observed that more detailed descriptions caused overtrust, making participants believe the system was more capable than it was. Conversely, Lee and colleagues ( 22 ) reported that the extent of knowledge about the system’s capabilities did not affect drivers’ trust in a Level-2 driving system.
Because of the unclear relationship between mental models and trust, we grounded our approach in the expectation-confirmation theory (ECT). This ECT, initially proposed to explain consumer satisfaction, posits that products meeting or surpassing prepurchase expectations lead to satisfaction, while unmet expectations result in dissatisfaction ( 23 ). In his theory of trust, Georg Simmel ( 24 , 25 ) stated that trust depends on the alignment between experiences and initial expectations—it is enhanced when expectations are confirmed yet impaired and adjusted when expectations turn out to be “blind hope” ( 26 ). Furthermore, a recent study indicated that satisfaction mediated the relationship between expectations and trust ( 27 ). Applying ECT in the context of autonomous driving, this study proposed that drivers’ trust in ADSs would be affected by the comparison between drivers’ original expectations and the systems’ actual performance: trust would increase if system performance met their initial expectations and decrease if the performance fell short.
Automation Errors
Another influential factor in trust is automation errors. Studies showed that failures to perform actions or takeover requests (TORs) requiring manual intervention reduced trust (e.g., 28 , 29 ). Particularly, previous research ( 8 , 22 ) differentiated between system limitations, which are predictable and inherent to the design of a system, and malfunctions, which are unexpected errors in mechanics or software ( 30 ). It was also established that automation failures typically decreased trust, but trust could be restored through subsequent positive experiences (e.g., 8 ).
An important yet under-researched aspect of automation errors is whether they occur for consistent reasons. Muir ( 31 ) proposed that system predictability, or the ability to behave consistently and be accurately anticipated by operators, is crucial for trust development. Therefore, errors because of inconsistent causes likely impair perceived predictability and trust. Muir and Moray ( 32 ) validated the role of predictability on trust in a pasteurization system. They found that predictable automation failures allowed trust to rebuild over time, whereas unpredictable failures led to lasting trust loss despite subsequent experiences with the automation. Past studies also showed that unpredictability negatively affected driving performance. In a simulated lane-changing task, drivers deviated more from the ideal trajectory when the positions of lane-changing signals were less predictable ( 33 ). In addition, while performing a secondary task, drivers took longer to take over a vehicle on adaptive cruise control at unpredictable failures ( 34 ). Given the importance of predictability for trust development and road safety, it is essential to study ways to enhance system predictability, such as ensuring error consistency.
Current Study
Building on earlier work from this research ( 35 , 36 ), the purpose of the current study was to examine the effects of drivers’ initial expectations and error consistency on trust in a Level-3 ADS. The findings aimed to enhance understanding of trust dynamics and offer recommendations for communicating ADS capabilities and system design.
At the beginning of the experiment, participants’ expectations were set at either high or low through descriptions of the system’s capabilities. Error patterns were manipulated across three simulated driving scenarios: no error (baseline condition without errors), consistent errors (errors always occurred for the same reason), and inconsistent errors (errors varied across drives). The errors were prompted by TORs. Participants’ trust was measured through subjective reports after each drive, and their reaction time to the TORs (TOR time) was recorded in the two error conditions. The following hypotheses were formed based on prior literature:
Hypothesis 1.1
The low-expectation group would have higher subjective trust than the high-expectation group because the system’s actual performance would exceed that of the low initial expectations.
Hypothesis 1.2
The no-error group would have the highest subjective trust among the three error-pattern conditions; the inconsistent-error condition would have lower subjective trust than the consistent-error condition because of unpredictability.
Hypothesis 2.1
Participants in the low-expectation group would have a shorter overall TOR time than the high-expectation group as they would anticipate the system to fail more frequently, preparing them to regain control more swiftly.
Hypothesis 2.2
The inconsistent-error condition would result in a longer overall TOR time than the consistent-error condition because unpredictability would delay participants’ takeover responses.
Method
Participants
A power analysis using an alpha level of .05 and an effect size of .25 suggested a sample size of 158 for a power of .80. Considering the counterbalancing design and the feasibility of data collection, we adjusted the planned sample to 144. We recruited 150 undergraduate students from Rice University, offering one research credit for their participation. After excluding invalid data (see the section “Data Exclusion” for the criteria and process), the final sample retained 138 participants, which falls within the acceptable range reported in comparable studies (e.g., 20 , 22 , 28 ). There were 84 females and 54 males; ages ranged between 18 and 23 (M = 19.72, SD = 1.21) years. All of them held valid U.S. driver’s licenses at the time of data collection. All participants reported having normal or corrected-to-normal vision and hearing. This study received approval from the Institutional Review Board at Rice University.
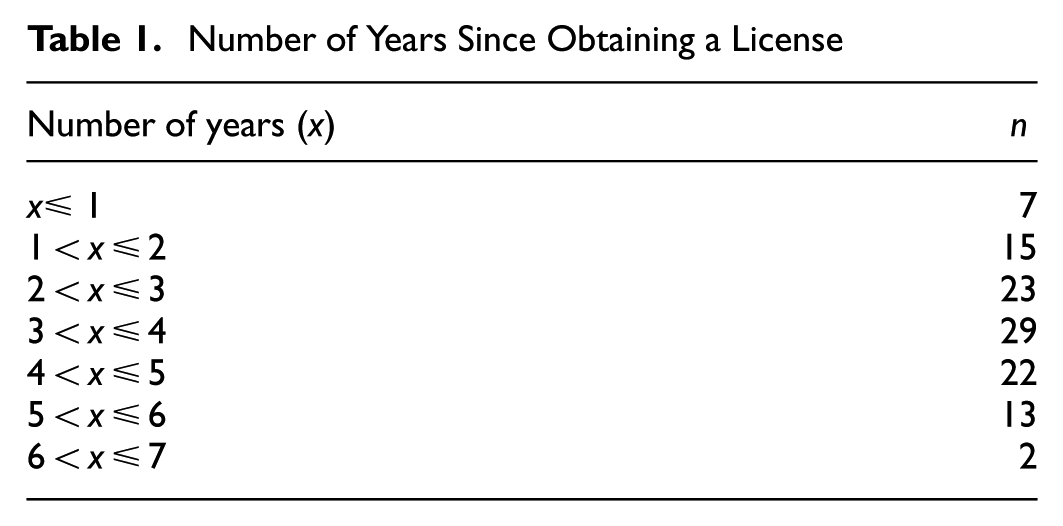
Driving experience data were collected from 111 participants (the inclusion of questions concerning driving experience in a Qualtrics survey was integrated into the study protocol after data collection had commenced): the number of years since obtaining a driver’s license ranged between no more than one year to seven years (Table 1). On average, they drove 4,761.38 mi (SD = 6,433.46) per year. Automated driving experience data were gathered from interviews with 108 participants (audio recordings for the other three participants were not captured): 17 of them had sat in an autonomous vehicle while it was on autopilot, 46 had used advanced driver-assistance technology (such as adaptive cruise control), and 45 had no experience in ADSs.
Number of Years Since Obtaining a License
Apparatus
A STISIM Drive (Build 3.20.03) driving simulator was employed. The driving environment was projected onto three table-mounted Dell Ultrasharp 27 monitors, placed on a table covered by a black cloth (Figure 1). The experimenters used a fourth monitor, out of participants’ sight on another table, to administer the experiment. Participants interacted with the simulator using a Logitech G920 Racing Wheel and pedals.
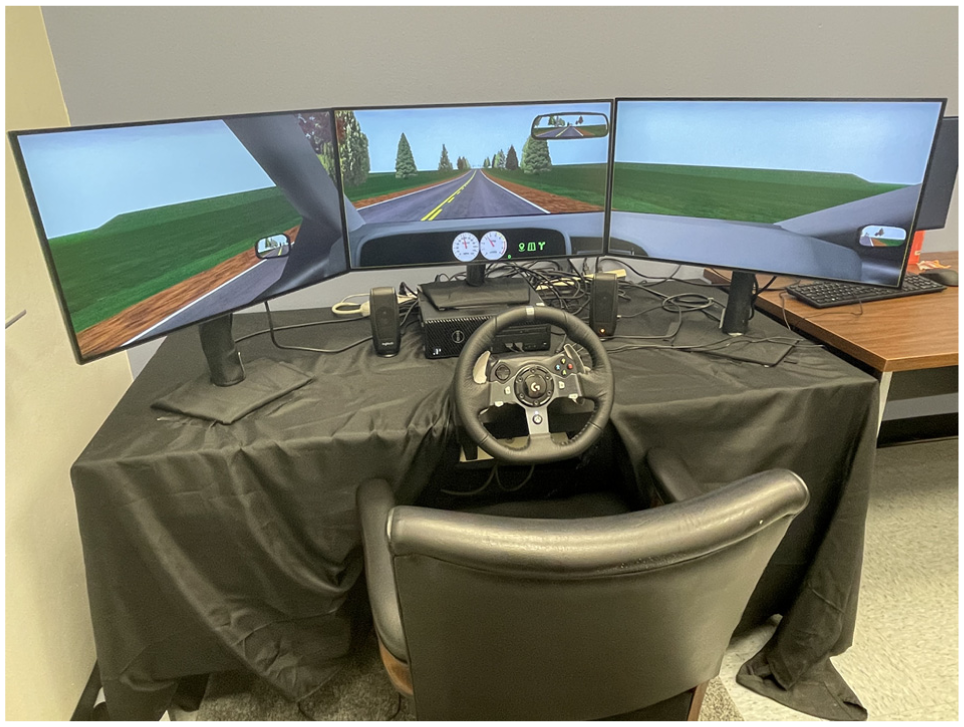
Apparatus setup.
Stimuli
Because error consistency was a critical manipulation in this study, it was necessary for errors to be distinguishable. We adopted errors from three functional components in a proposed autonomous car architecture ( 37 ): (1) perception—sensing the immediate environment through sensors; (2) localization—finding the position of the car using techniques such as global positioning system (GPS); (3) planning—using information from perception and localization to plan for motions of the car. Errors coming from distinct function components allowed their causes to be more identifiable and distinguishable.
We designed driving events to reflect three functional errors (Figure 2). In the perception event, there were no lane markings or incoming vehicles for the ego vehicle to infer lane boundaries. In the localization event, the vehicle lacked access to a GPS signal. In the planning event, the vehicle faced a decision conflict when it stopped at a red light with an approaching ambulance such that it could not determine what to do. All three triggering events happened when the ego vehicle came to a stop at a red light or stop sign. Each event could potentially trigger an error caused by a problem in the corresponding function. There would be an error only if the event triggered a TOR but no error if the vehicle could handle the event on its own.
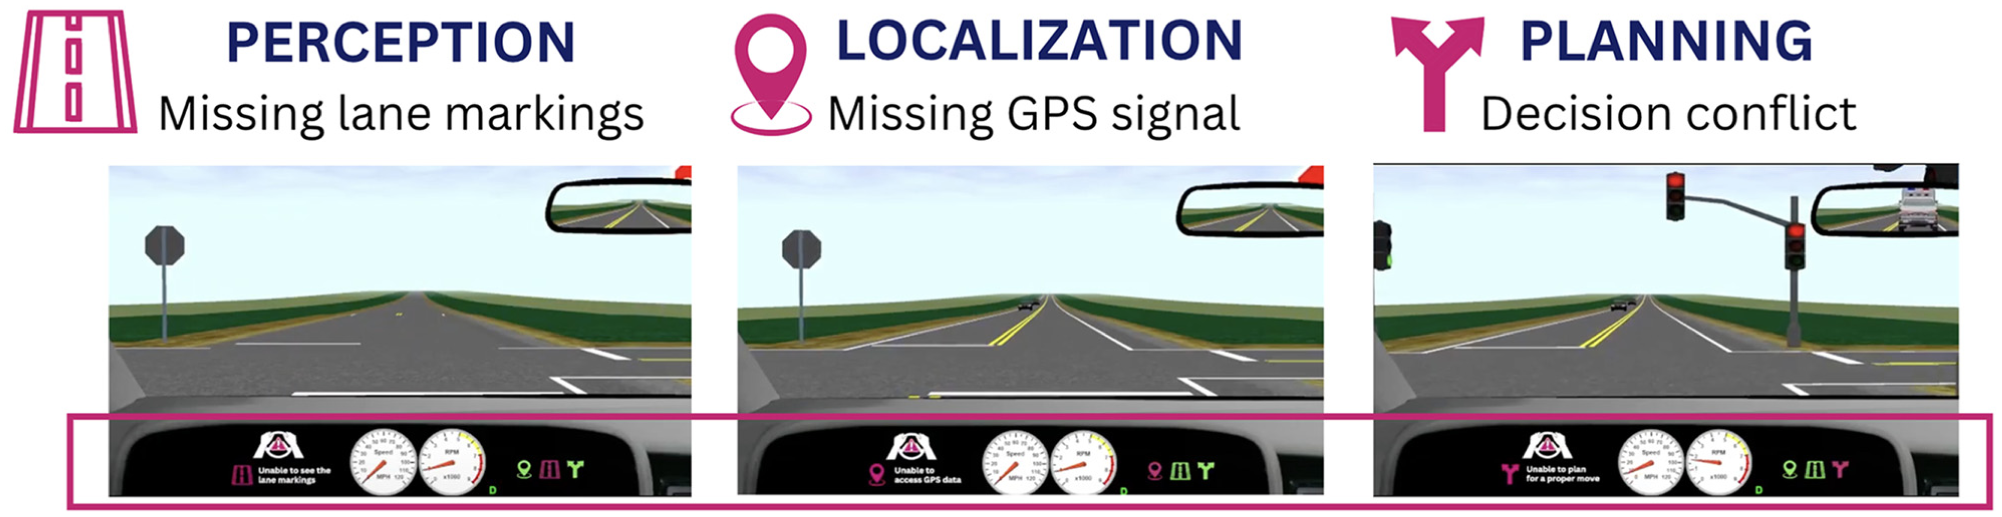
Triggering events for the three errors.
Three indicators on the right side of the dashboard reflected the status of the three vehicle functions. Normally, the indicators were lime green. During a triggering event, the corresponding indicator flashed vivid pink to inform participants of the detected abnormality. In addition, a TOR icon appeared on the left side of the dashboard when an error occurred, accompanied by three 1,000 Hz, 250 ms beeps (in accordance with 8 , 38 ). The colors vivid pink and lime green, as opposed to red and green, were chosen to accommodate color-blind participants.
Participants experienced three drives in all conditions, each containing all three triggering events spaced out with varying intervals (Figure 3). TORs were prompted at the last event except in the no-error condition. The three drives, set up under different environments (rural, suburban, and urban), had varying durations (about 4, 5, and 7 min) to make TOR timing unpredictable. The drive order was fully counterbalanced.
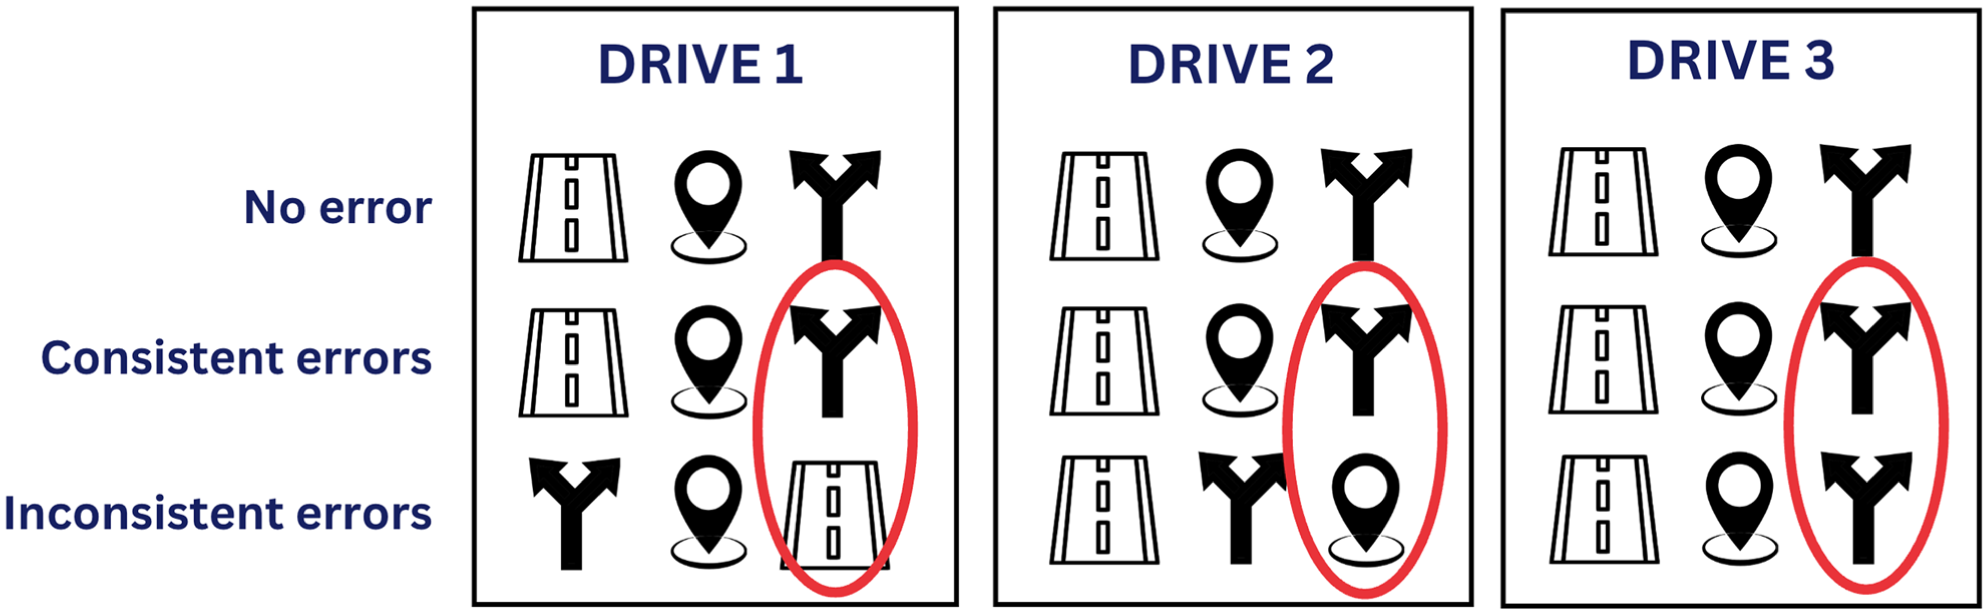
An example arrangement of the three drives.
Experimental Design
The experiment used a 2 (initial expectations: high, low) × 3 (error patterns: no error, consistent errors, inconsistent errors) between-subjects design. Participants were randomly assigned to one of the six conditions.
At the beginning of the experiment, drivers read instructions in a Qualtrics survey, which described the system’s capabilities differently. The high-expectation group read, “the autonomous vehicle is capable and reliable in perceiving its surroundings, identifying the vehicle’s location, and planning an appropriate route given the road conditions,” while the low-expectation group read, “the autonomous vehicle may fail to perceive its surroundings, identify the vehicle’s location, or plan an appropriate route given the road conditions.”
Error patterns were manipulated across three simulated drives, with all three triggering events (missing lane marking, missing GPS signal, and decision conflict) present in each drive in counterbalanced orders. In the no-error condition, the system managed all events without issuing TORs. In the consistent-error condition, the same event caused errors across all drives. The specific event among the three triggering events that caused the errors was randomized for each participant. In the inconsistent-error condition, different triggering events led to errors across three drives. Each event triggered an error exactly once, such that participants experienced all three errors in a counterbalanced order.
The experiment included two dependent variables. First, TOR time was a measure of readiness to take over the vehicle, defined by the duration between the initiation of a TOR and participants’ earliest behavioral response (e.g., steering, pressing the gas or brake). Second, participants’ subjective trust in the system was measured using Jian and colleagues’ 12-item questionnaire ( 39 ).
Procedure
Figure 4 presents a flowchart of the study procedure. On arriving at the laboratory, participants reviewed and signed the consent form, presented a valid U.S. driver’s license, and silenced their phones. The experimenter introduced the brake pedal, gas pedal, and turn signals, instructing participants to adjust a non-rolling chair for comfortable operation.
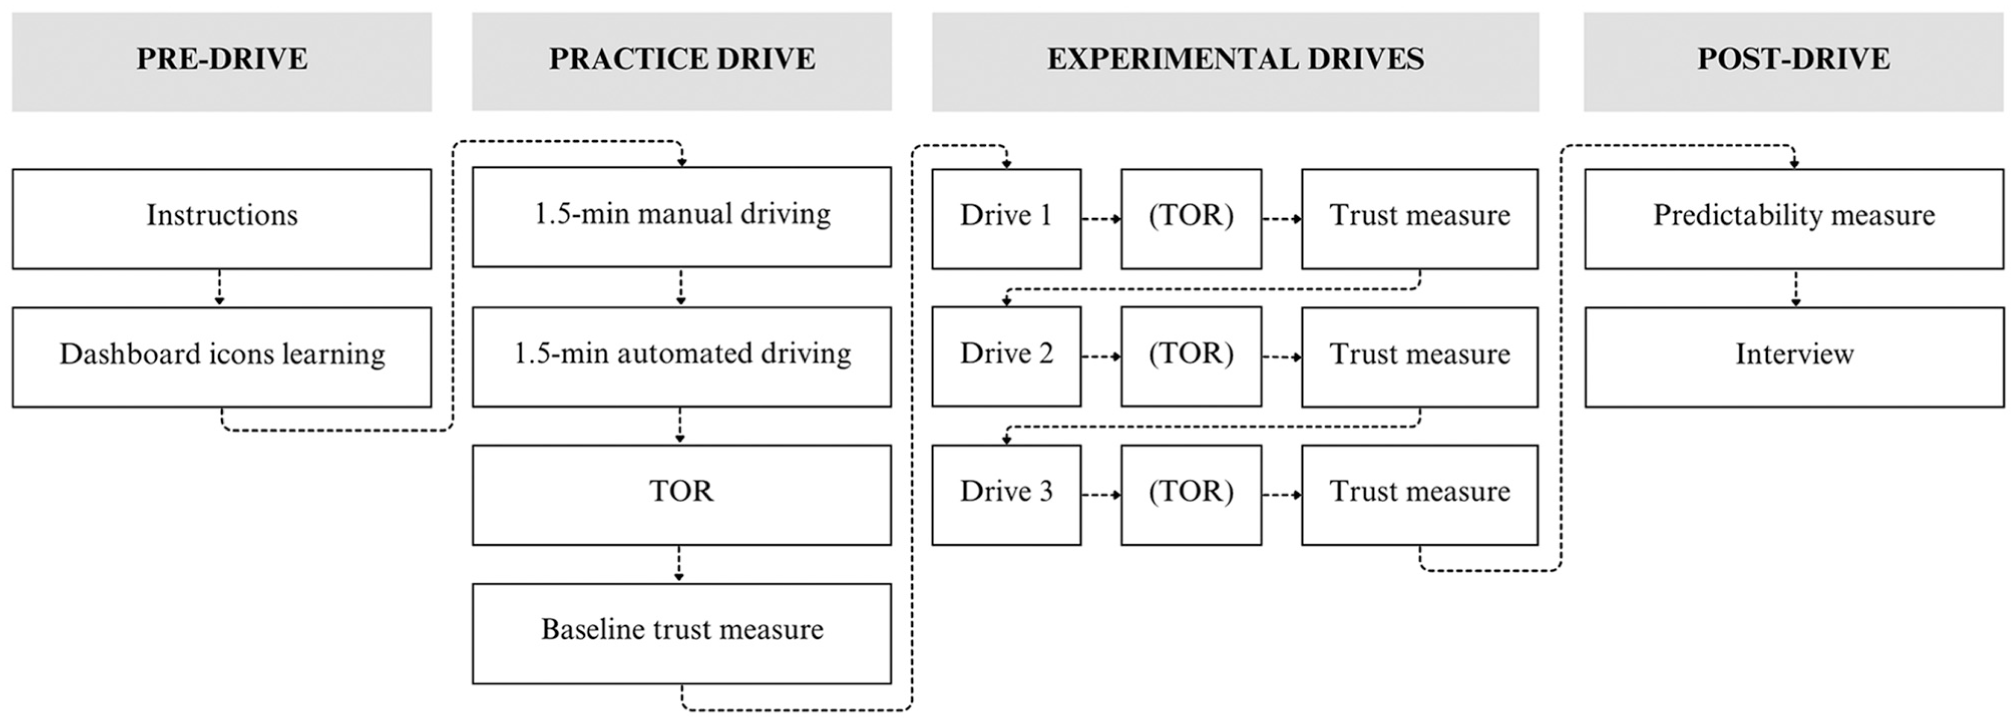
Primary study procedure.
Participants were presented with a Qualtrics survey. In the survey, participants read aloud the instructions that manipulated their initial expectations and reminded them to be ready for potential TORs. They answered three 7-point Likert-scale (1 = strongly disagree; 7 = strongly agree) questions that measured their initial level of expectation before any interaction with the driving simulator: “The autonomous vehicle can perform normally when the lane markings are missing,”“The autonomous vehicle can perform normally when the Global Positioning System is not working,” and “The autonomous vehicle knows what to do when it stops at a red traffic light while an ambulance is approaching from its back.” The survey explained the meaning of each dashboard icon by presenting the icon and its interpretation side-by-side, followed by a learning check. Incorrect answers led participants back to the explanations until they answered all questions correctly.
Next, participants performed a two-phase practice drive (identical regardless of condition) on the STISIM drive simulator. The first phase involved 1.5 min of manual driving to familiarize participants with simulator operations, without any dashboard indicators. The second phase involved 1.5 min of automated driving to demonstrate the system’s capabilities and dashboard icons related to autonomous functions. During the transition between the two phases, the experimenter announced the onset of automated driving and reminded participants to place their hands on the steering wheel and their feet on the pedals. The three indicators initially appeared in lime green. Later, one flashed in vivid pink without any critical event, preventing participants from anticipating the critical event in the experimental drives and ensuring unbiased TOR times. The experimenter explained the meaning of dashboard icons to ensure participants understood the appropriate actions to take in each state. At the end of the practice drive, a TOR was presented visually and auditorily to familiarize participants with the takeover action. On completing the practice drive, participants completed the initial trust questionnaire ( 39 ) with 12 items on a 7-point Likert scale (1 = strongly disagree; 7 = strongly agree). The scale measured baseline trust levels before the experimental drives.
Participants experienced three experimental drives based on their - condition. Trust was measured once after each drive using the same questionnaire as the baseline. TOR times were measured following each TOR in the consistent- and inconsistent-error conditions only. After each drive, participants in the consistent- and inconsistent-error conditions verbally answered the questions “Please describe in your own words the reasons you believe led to the vehicle asking you to take over during the drive session” as a manipulation check for error patterns, and “What were you trying to do after the vehicle asked you to take over?” to understand drivers’ behaviors following TOR.
After the drives, participants rated the system’s predictability: “Based on your experience with the autonomous vehicle over the three drives, to what extent do you agree with the following statement? The behavior of this autonomous vehicle is predictable” (1 = strongly disagree; 7 = strongly agree). They also reported demographics and driving experience. Finally, a semistructured interview (Table 2) was conducted to explore how trust was shaped by initial expectations and error patterns, check the effectiveness of error-pattern manipulation, and gather information on participants’ experience with autonomous driving and advanced driver-assistance technology.
Interview Questions
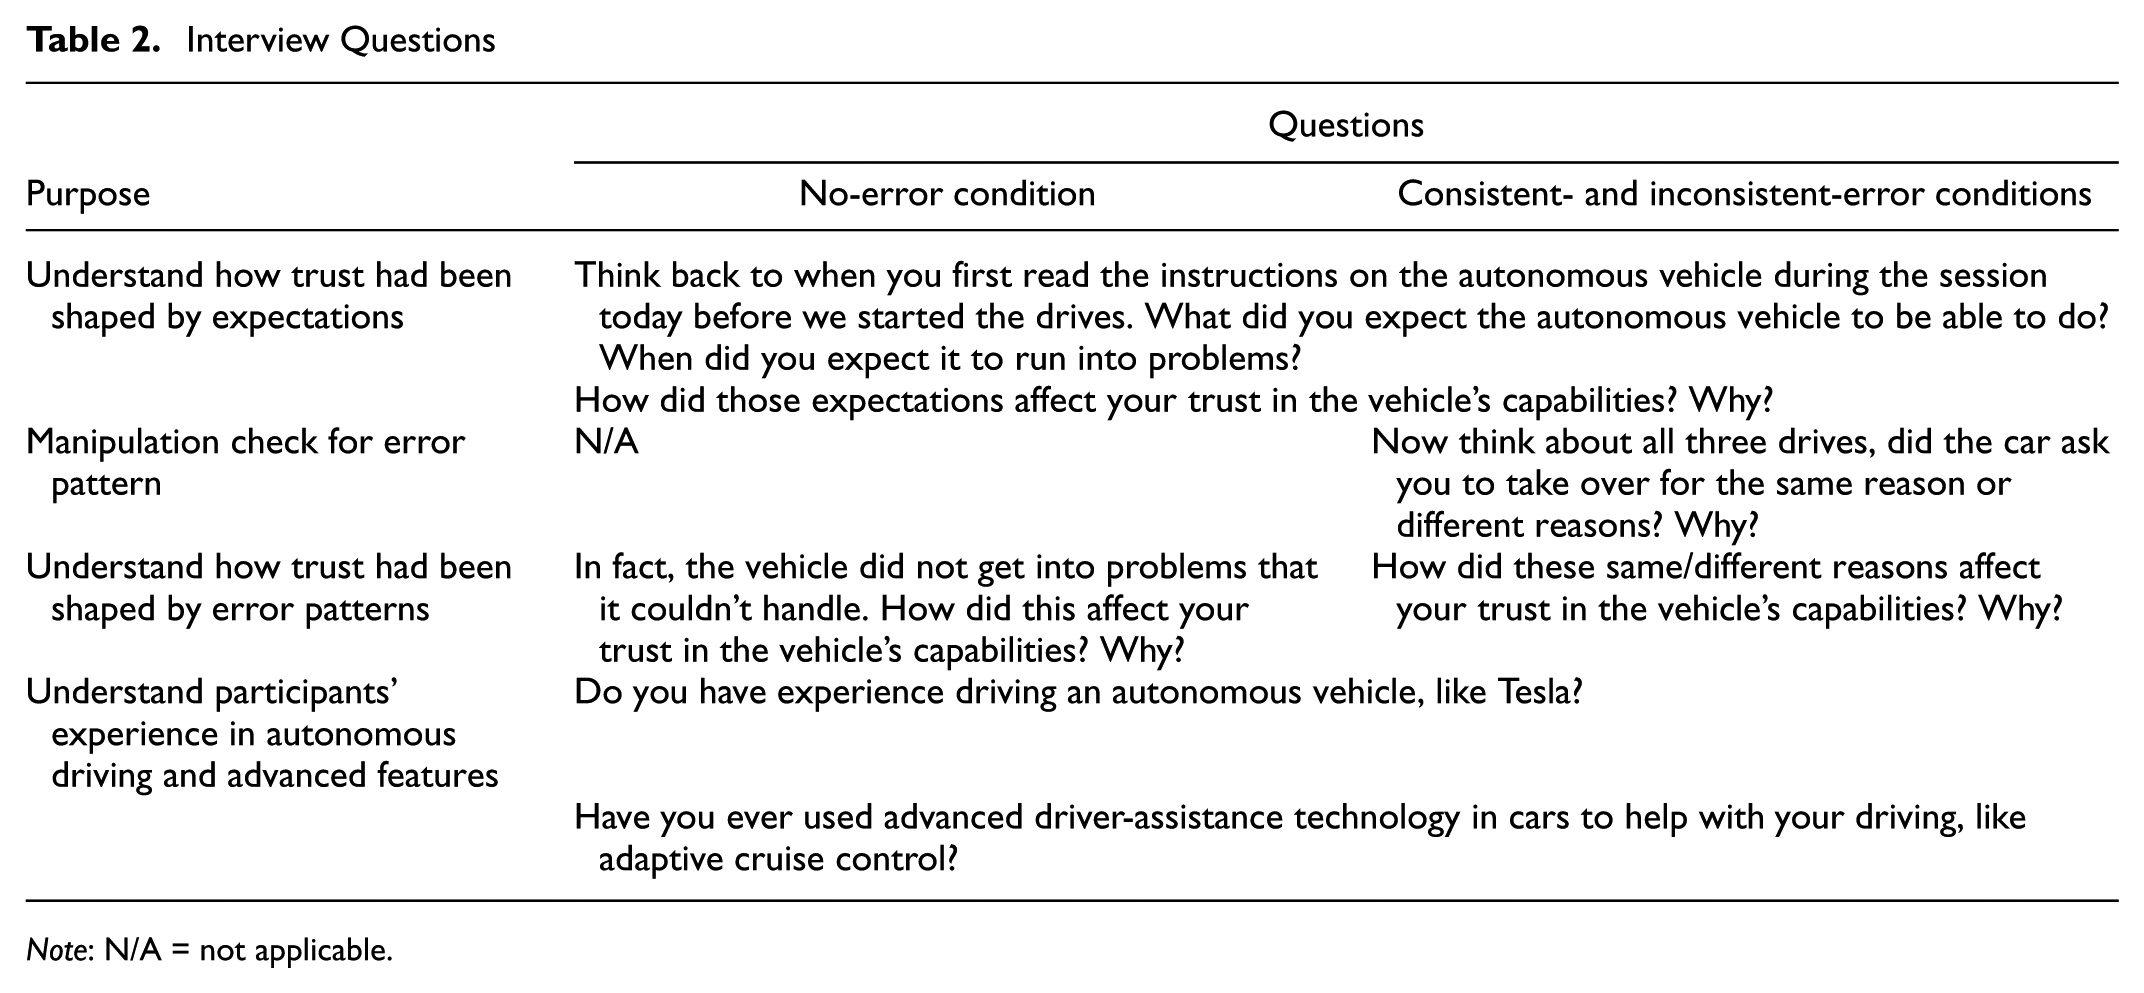
Note: N/A = not applicable.
Results
The Brown-Forsythe test confirmed that the assumption of homogeneity of variances was met for all analyses of covariance (ANCOVA) and analyses of variance (ANOVA) conducted throughout the results section.
Data Exclusion
Of the 150 participants, eight were excluded because of missing data, procedural errors, and participant eligibility issues. Four participants provided incorrect reasoning for why the system issued TORs or were unsure why the system asked them to take over in at least one drive, and thus were removed from the analysis. Data from the remaining 138 participants were included in the subsequent analyses.
To evaluate participants’ initial level of expectations, we computed an expectation score by averaging responses to the three questions that measured participants’ initial expectations immediately following the instructions. As the questions were on a 7-point Likert scale and were positively worded, a score above four indicated positive expectations, and a score below four indicated negative expectations. An independent samples t-test showed that the initial expectation level did not differ significantly between the high-expectation group (M = 3.48, SD = 0.97) and the low-expectation group (M = 3.49, SD = 1.21), t(136) = 0.05, p = .959, Cohen’s d = 0.01. This suggested that the description of system capabilities did not affect participants’ expectations of the system. In later analyses, we treated the average score on the three questions as participants’ initial expectations. The final sample included 138 participants: 49 in the no-error condition, 46 in the consistent-error condition, and 43 in the inconsistent-error condition.
Trust
In this section, we assessed participants’ trust in the ADS using three distinct trust measures. The baseline trust measure captured participants’ initial trust levels before they interacted with the simulated drives. The overall trust was calculated as the average of trust ratings measured following each of the three drives. Finally, we measured trust on completion of Drive 1, which captured participants’ early trust in the system, before any substantial trust adjustment that might occur over the course of extended interaction with the system.
Based on a review of 149 peer-reviewed articles that applied Jian et al.’s trust scale to evaluate trust in automation, AI, or related systems conducted in June 2024 ( 40 ), those studies reported an average Cronbach’s α of .86, demonstrating good reliability. In the present study, the trust scale also showed high internal consistency, with Cronbach’s α ranging from .90 to .94 across the four administrations.
The initial level of expectations was assessed with three Likert-scale items targeting the vehicle’s ability in perception, localization, and planning. The internal consistency (Cronbach’s α = .56) did not fall in a satisfactory range ( 41 ), which could be attributed to the limited number of items or the possibility that the items measure related but separate aspects of the system.
Baseline Trust Measure
To examine whether experimental conditions were equivalent in their trust level before the experiment, we performed a one-way ANCOVA to examine the effects of error pattern on baseline trust while controlling for expectation (with Type III sums of squares). After controlling for expectation, the effect of the error pattern on baseline trust was not statistically significant, F < 1, with an average baseline trust of 4.73 (SD = 0.92) in the no-error condition, 4.68 (SD = 0.91) in the consistent-error condition, and 4.71 (SD = 0.81) in the inconsistent-error condition. Based on the ANCOVA, there was a significant effect of expectation on the baseline trust, F(1, 134) = 6.59, MSE = 4.96, p = .011, η 2 p = .05. Participants with higher expectation scores tended to report higher baseline trust (Figure 5).
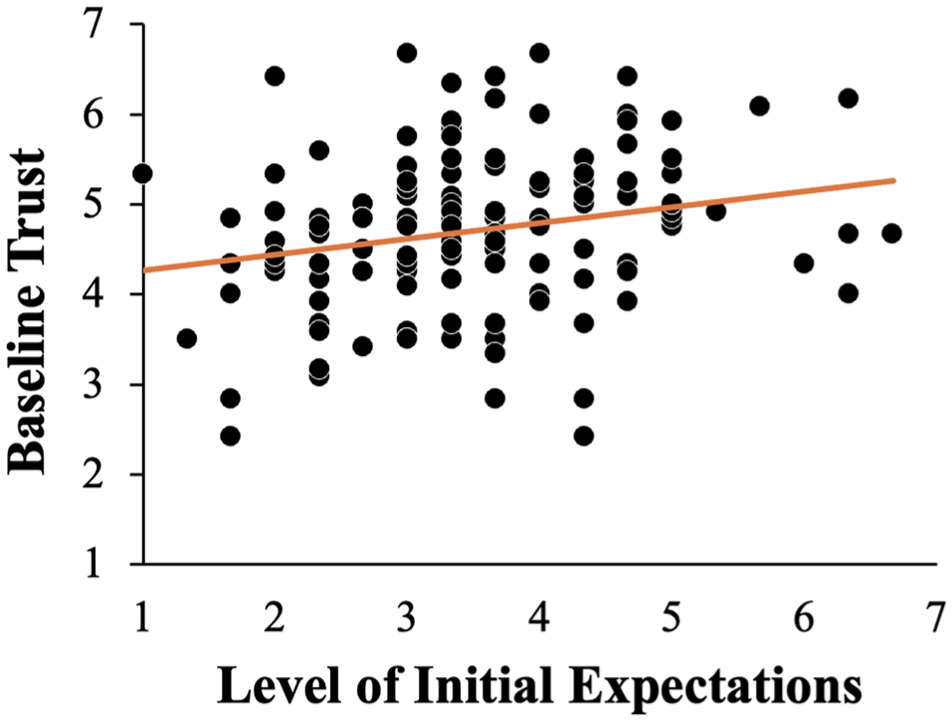
Relationship between expectations and baseline trust.
Effects of Expectation and Error Pattern on Overall Trust
A one-way ANCOVA with Type III sum of squares was conducted to examine the effects of error pattern on overall trust, an average of trust measured after each of the three drives, while controlling for expectation. After controlling expectation, the effect of the error pattern on overall trust was not statistically significant, F < 1, with an average trust of 5.08 (SD = 0.97) in the no-error condition, 4.95 (SD = 0.98) in the consistent-error condition, and 5.00 (SD = 0.79) in the inconsistent-error condition. Initial expectations did not significantly influence the overall trust either, F < 1 (Table 3).
The Effect of Expectations on Trust and TOR
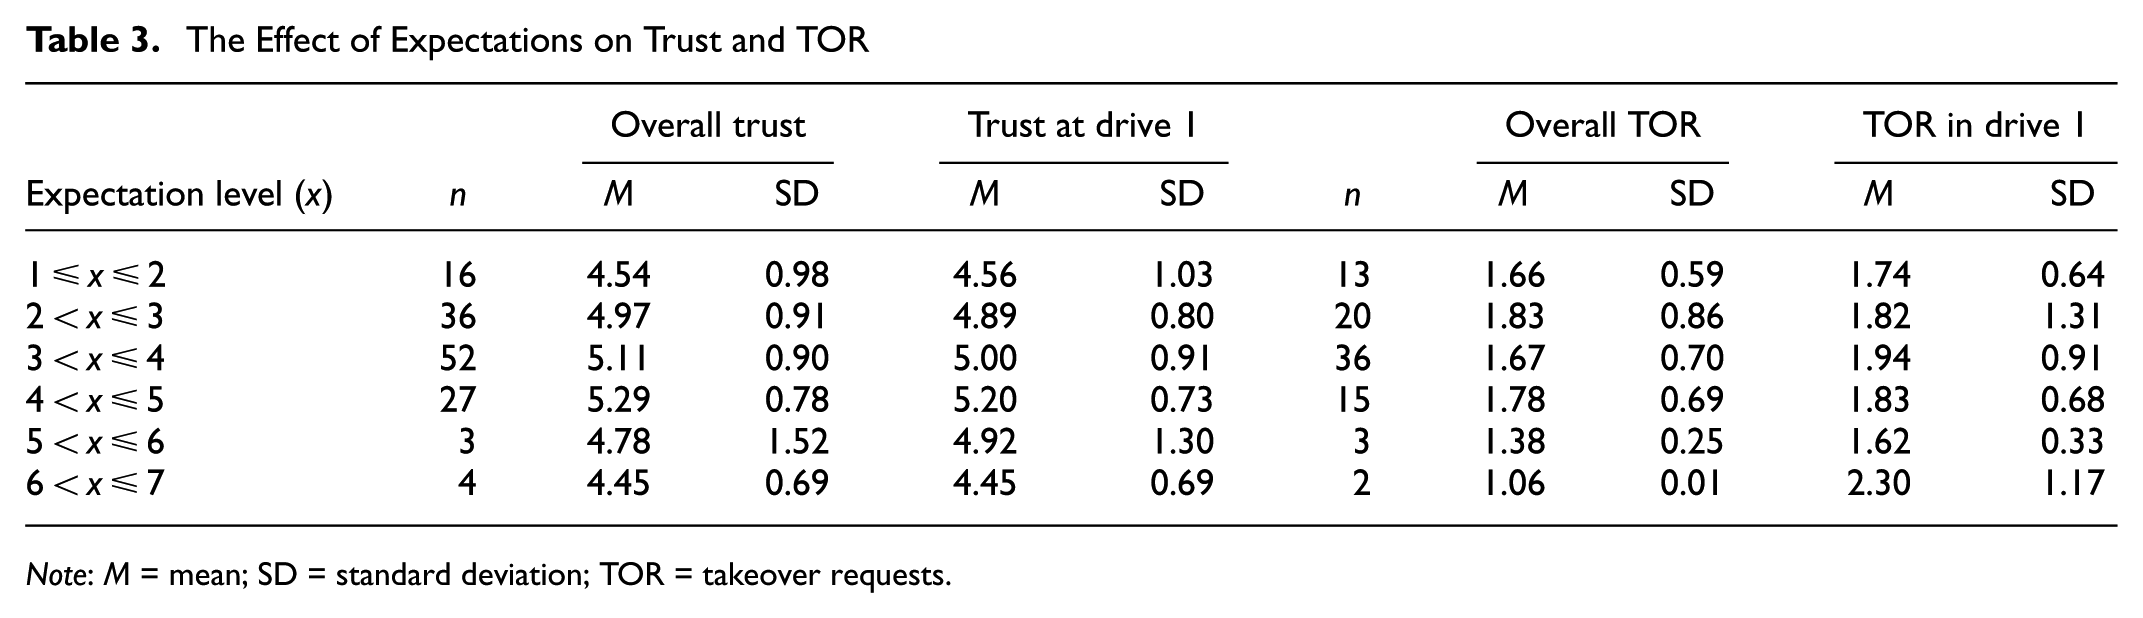
Note: M = mean; SD = standard deviation; TOR = takeover requests.
Given that trust might have been adjusted over the course of the three drives, it was essential to also consider the influence that initial expectations might have on early trust formation. Therefore, in addition to examining the effect of expectation on overall trust, we conducted a similar ANCOVA on trust measured immediately after the first drive, before substantial evolvement could occur. After controlling for expectation, the effect of the error pattern on trust was not statistically significant, F < 1. Similarly, we found that the initial expectations did not significantly influence trust after Drive 1, F(1, 134) = 3.66, p = .058 (Table 3).
Mediation Analysis for the Effect of Error Pattern on Trust through Predictability
The ANCOVA results might not fully capture the dynamics underlying error pattern and trust because error consistency might have impacted the perceived predictability of the system, a key determinant in trust development ( 31 ), rather than directly exerting its effect on trust. Therefore, we performed a mediation analysis using the PROCESS function in R ( 42 ) to explore how the subjective Predictability of system performance might mediate the effect of error pattern on overall trust. In our mediation model, the overall trust was the outcome variable, the error pattern was the predictor, and the Predictability was the mediator.
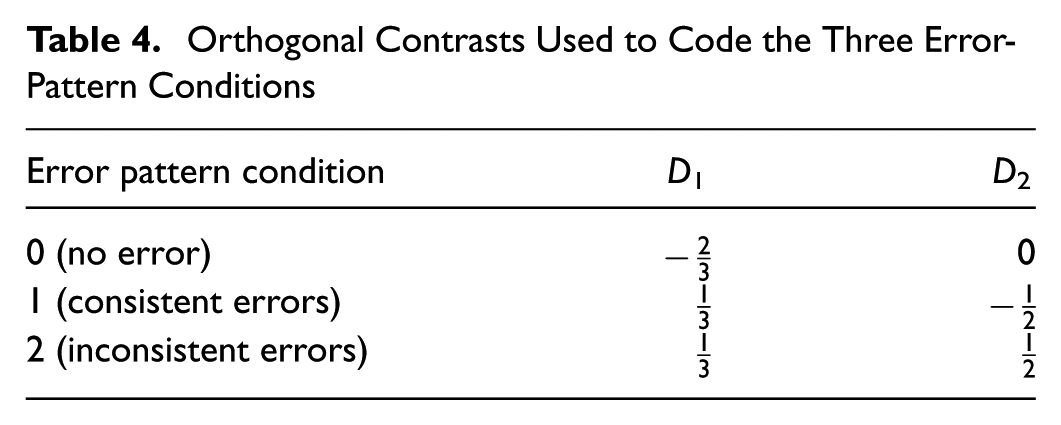
Using the approach recommended by Hayes ( 42 ), we applied Helmert coding with two orthogonal contrasts to represent the three - conditions and assess their effect on trust (Table 4). Rather than coding the no-error condition as the reference group, we opted for Helmert coding for two reasons. First, with three conditions in our study, the mediation results can vary depending on which condition is selected as the reference group, potentially complicating the interpretation of findings. Second, Helmert coding allows for a direct comparison between the consistent- and inconsistent-error conditions—an essential analysis to evaluate our hypotheses—which would not be possible using reference-group coding. In particular, D1 compared trust in the no-error condition with the unweighted average of trust in the consistent- and the inconsistent-error conditions; D2 compared trust in the consistent- against the inconsistent-error condition. The indirect effect was estimated by the bootstrapping method based on 5,000 bootstrap samples.
Orthogonal Contrasts Used to Code the Three Error-Pattern Conditions
The relative indirect effect of the error pattern on overall trust through the perceived Predictability of the system performance was statistically significant. Specifically, the coefficient of the indirect effect of experiencing errors in the drives (regardless of the consistency) relative to no error was a1b = −0.24 with a bootstrap confidence interval of [−0.42, −0.07], represented by the pathway from D1 to trust through Predictability in Figure 6. In other words, compared with experiencing no error, encountering any type of error reduced overall trust by 0.24 on a 7-point Likert scale through Predictability. The indirect effect of inconsistent errors relative to consistent errors was represented by the pathway from D2 to trust through predictability, and the coefficient was estimated to be a2b = −0.46, with a bootstrap confidence interval of [−0.70, −0.23]. That is to say, inconsistent errors resulted in 0.46 lower trust through Predictability on a 7-point Likert scale than consistent errors did. Neither confidence interval contained zero, suggesting a statistical significance of the relative indirect effects.
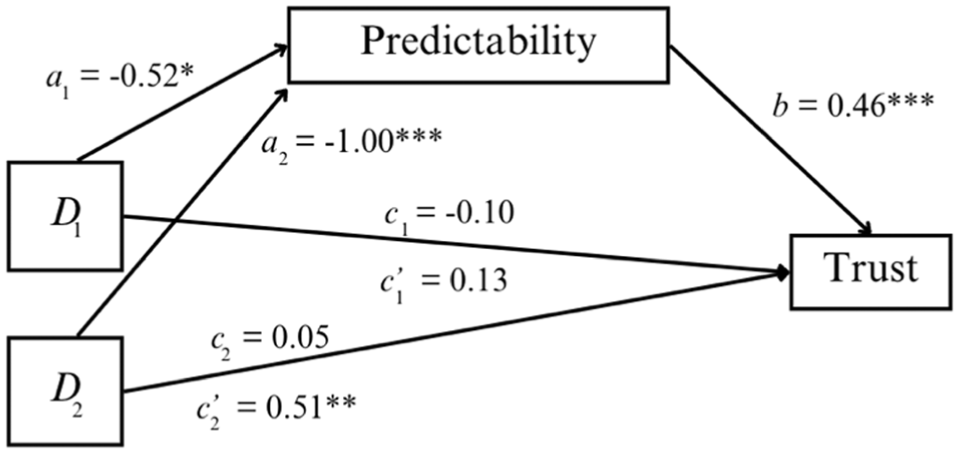
The mediation effect of error pattern on trust through predictability.
The relative direct effect,
The relative total effect was the overall effect of error pattern on trust without considering the mediation effect. The coefficient of the total effect of experiencing errors on trust relative to no error was estimated to be c1 = −0.10, which was not statistically significant, t(123) = 0.64, p = .524. The total effect of experiencing inconsistent relative to consistent errors was estimated to be c2 = 0.05, not statistically significant either, t(123) = 0.26, p = .794.
TOR Time
In this section, we examined two measures of reaction time to assess participants’ driving behavior in response to TORs. The average TOR time represented the mean of reaction time to TORs across three drives. The other was the first TOR time measured in Drive 1.
Outlier Handling
We defined outliers as any values that were more than three interquartile ranges (IQRs) above the third quartile or below the first quartile ( 43 ). We conducted two rounds of outlier identification to ensure data quality. First, we identified within-subjects outliers by examining abnormalities in TOR times for each subject. Differences between individual TOR time in each drive and each subject’s mean TOR time across the three drives were computed. According to this 3-IQR criterion, within-subjects outliers were computed differences that fell beyond these ranges: [−2.35, 2.66] for Drive 1, [−2.74, 2.64] for Drive 2, and [−2.74, 2.22] for Drive 3. There were three outliers identified (3.37% of the total data), all in the consistent-error condition. The outliers were subsequently replaced by the subject’s average TOR time, computed using the nonoutlier values across the three drives (e.g., for subjects with one outlier, the average was calculated from the remaining two drives). No data were removed. Second, we examined the presence of between-subjects outliers, representing overall abnormal participants. The 3-IQR criterion was applied to the mean TOR time across three drives. No data points fell beyond the accepted range of [−1.46, 4.70]. The sample for the reaction-time analyses included 89 participants: 46 in the consistent-error condition and 43 in the inconsistent-error condition.
Effects of Expectation and Error Pattern on TOR Time
A one-way ANCOVA with Type III sum of squares was conducted to examine the effects of error pattern on average TOR time, the mean of TOR time measured in three drives, controlling for expectation. After controlling expectation, participants who experienced inconsistent errors (M = 1.88, SD = 0.71) had a significantly longer overall TOR time than those who experienced consistent errors (M = 1.54, SD = 0.67), F(1, 86) = 6.15, MSE = 2.87, p = .015, η 2 p = .07. The effect of initial expectations on TOR time was not statistically significant, F(1, 86) = 1.70, MSE = 0.80, p = .196, η 2 p = .02 (Table 3).
In addition, we investigated whether similar effects could be found on the TOR time measured during the first drive. This measure captured participants’ driving safety behavior early on before adjusting their expectations based on actual experiences with the system. We conducted another ANCOVA on TOR time in the first drive. Similarly, we found that the initial expectations did not significantly influence the TOR time in Drive 1, F < 1 (Table 3). After controlling for expectation, the effect of the error pattern on trust was not statistically significant, F(1, 86) = 1.95, p = .167.
Mediation Analysis for the Effect of Error Pattern on TOR through Predictability
Similarly, we performed a mediation analysis using the PROCESS function in R ( 42 ) to explore if the subjective Predictability of system performance mediated the effect of error pattern on overall TOR time. In our mediation model, the outcome variable was the overall TOR time, the predictor was the error pattern (with the consistent-error condition being the reference group), and the mediator was Predictability.
Based on the analysis, there was a lack of evidence for the mediation effect (Figure 7). The indirect effect of the error pattern on overall TOR time through the perceived Predictability of the system performance was not statistically significant, ab = −0.07 with a bootstrap confidence interval of [−0.20, 0.03] that contained zero. The direct effect of the error pattern on overall TOR time,
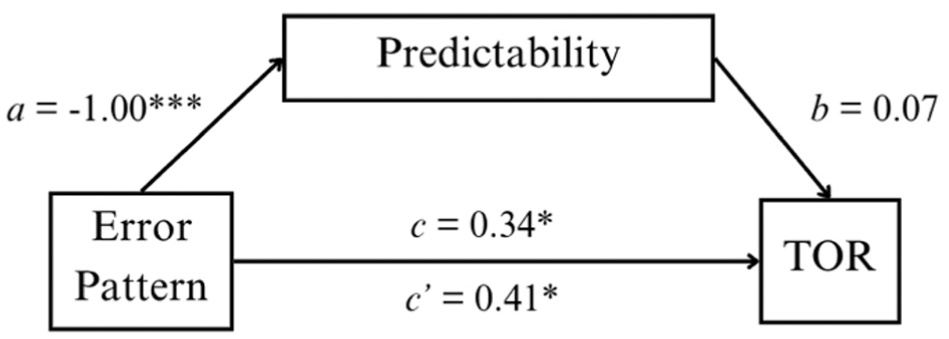
The mediation analysis of error pattern on TOR time through predictability.
Experience with ADSs
Given participants’ varied prior experience with ADSs (see section “Participants”), we also explored how these differences might have influenced their expectations of system capabilities and their trust in the system.
The Effect on Initial Expectation
A one-way ANOVA with Type III sum of squares was conducted to examine the effects of prior experience on initial expectation. No significant difference in the level of expectation was observed across participants who had experience with highly automated features such as autopilot (M = 3.90, SD = 1.03), those who had only used advanced driver-assistance technology including adaptive cruise control (M = 3.43, SD = 1.10), and those had no experience with ADSs at all (M = 3.26, SD = 1.21), F(2, 105) = 1.97, MSE = 2.55, p = .145.
The Effect on Overall Trust
A one-way ANOVA with Type III sum of squares was conducted to examine the effects of prior experience on overall trust. There was no significant difference in overall trust across participants who had experience with highly automated features such as autopilot (M = 5.27, SD = 1.02), those who had only used advanced driver-assistance technology including adaptive cruise control (M = 5.08, SD = 0.90), and those had no experience with ADSs at all (M = 4.94, SD = 0.89), F < 1.
Discussion
The goal of the present study was to investigate how initial expectations of system capabilities and error consistency might influence drivers’ trust in the system and driving safety. We evaluated the validity of the four proposed hypotheses based on our results.
There was a lack of evidence to support Hypothesis 1.1. Participants’ initial expectations did not affect their overall trust in the system. Since trust can be changed through experiences with the ADSs ( 5 , 9 ), this adjustment process might reduce the impact of initial expectations on trust over the course of three drives. The absence of a significant effect on early trust at the end of the first drive challenged this view, further validating the minor role that initial expectations played once participants had direct experience with the driving simulator. This finding contradicts the ECT and prior studies (e.g., 44 ). However, it is important to note that initial expectations were significantly related to baseline trust, indicating that prior understanding and assumptions on system capabilities initially influenced people’s trust before interacting with the system. Once participants experienced the ADS directly, however, their trust depended more on the system’s demonstrated reliability and effectiveness, suggesting that initial expectations had a diminishing influence after direct experience. This conclusion aligns with the concept of the description-experience gap, which emphasizes the greater efficacy of information gained from direct experiences than descriptions ( 45 ). Previous research (e.g., 46 ) shows that experience has a more prominent effect on trust development, enabling better alignment with the system’s actual capabilities. Our findings are consistent with this pattern, demonstrating a similar description-experience gap in the driving domain.
Hypothesis 1.2 was partially supported. Predictability fully mediated the relationship between the absence or presence of errors and overall trust: experiencing errors reduced trust by 0.24 points on a 7-point scale through predictability. This aligns with an array of previous research on trust reduction as a result of system failures ( 8 , 28 , 29 ) and adds to the literature by demonstrating that errors may exert their detrimental effects on trust by rendering the system unpredictable. Inconsistent errors reduced trust by 0.46 points compared with consistent errors partially through predictability. The partial mediation suggested that other factors might also influence trust when errors were inconsistent. Surprisingly, after parsing out the mediating effect, inconsistent errors increased trust by 0.51 points over consistent errors. A possible reason for this unexpected effect was that participants interpreted the inconsistent errors in an unforeseen manner. In the postdrive interview, a participant who experienced inconsistent errors and correctly recognized the distinct causes of the errors stated that the varied errors enhanced their trust: the system’s failure for different reasons in each drive did not indicate unreliability but rather demonstrated its ability to learn from previous mistakes, as it did not repeat the same error. This participant’s explanation suggested that the inconsistent errors might not be seen by the driver as an undesirable attribute but as evidence of ongoing system improvement and adaptability, fostering trust development. In summary, Hypothesis 1.2 was partially supported as the negative influence of errors on trust might have been further complicated by an unexpected interpretation of the error manipulation.
We measured TOR time to understand how people’s responses to ADS errors might be influenced by initial expectations of the system’s capabilities and error consistency. The level of expectations did not affect the overall TOR time or the TOR time in Drive 1. Consequently, Hypothesis 2.1 was not supported. Inconsistent errors resulted in longer TOR time, validating Hypothesis 2.2. Though this relationship was not mediated by predictability, our analysis revealed a particularly strong link between error pattern and perceived predictability (Figure 7). Participants rated the system as substantially less predictable in the inconsistent-error condition compared with the consistent-error condition, highlighting that variability in failure modes strongly shaped drivers’ perceptions of the system. Participants remained vigilant to potential TORs regardless of initial expectations: the grand mean TOR time across conditions was 1.71 s (SD = 0.70), notably shorter than the typical range of 2–3.5 s in much of the existing TOR literature ( 47 ). It is important to note that participants were familiarized with the TOR icon and informed about the potential for TORs before experiencing the drives, which likely heightened their readiness to resume control when necessary. This readiness might have enabled participants to respond more quickly to errors, contributing to the better TOR performance observed.
Limitations and Future Research
Our study encountered limitations that future research could address to better understand how error patterns influence user trust in ADSs. First, the manipulation of the error pattern involved presenting three critical events in each drive, and only the last one triggered a TOR. This design aimed to highlight each error as distinct; however, it led to unexpected interpretations of inconsistent errors by some participants, who perceived the system as learning from previous events. Future studies might consider increasing the number of drives such that each error is repeated to demonstrate that the system does not learn from errors made in previous drives. Alternatively, one can present only one critical event per drive to clarify the system’s error-handling capabilities without suggesting inadvertent learning.
In addition, it appeared that the manipulation of initial expectations at the start of the experiment did not work as intended, resulting in similar levels of expectations across groups. Several reasons could explain this pattern. First, the written instructions might have been insufficient to effectively alter participants’ expectations. People’s perceptions of what the system can do might be unlikely to change without witnessing its capabilities firsthand. Second, as one participant noted, they may have perceived the instruction in the low expectation-condition (“the autonomous vehicle may fail to perceive its surroundings, identify the vehicle’s location, or plan an appropriate route given the road conditions”) as a common disclaimer that car manufacturers use, which did not necessarily imply that the system lacked these abilities. Third, participants in both conditions were informed that there could be a need for a TOR, requiring them to take back control. Although the high-expectation group was told the system would be capable, the mention of a TOR might have diminished their expectations, reducing the impact of the manipulation. Since these are only speculations, further research is warranted to better understand the factors that shape expectations and to identify more effective methods for manipulating expectations.
Another limitation was the study’s inability to separate the effects of error consistency from the number of distinct errors. In conditions with consistent errors, participants encountered only one type of error; whereas in the inconsistent-error condition, participants encountered three different errors. This design did not rule out the possibility that it was merely the number of distinct errors—rather than their inconsistency—that contributed to the observed effects on trust. Future studies should attempt to isolate the two factors to determine their specific impact on trust and TOR performance.
It is also essential to acknowledge the potential effects of error attribution on our results. While we designed three scenarios to represent failures in vehicle functionality, participants might have attributed these events to external environmental factors unrelated to the vehicle. For instance, a missing GPS signal might have been interpreted as the result of poor signal coverage in the geographical region rather than a vehicle error. Such external attribution likely attenuates the impact of errors on trust, as participants do not perceive the vehicle itself to be erroneous. To assess the extent to which error attribution may have influenced our findings, we analyzed participants’ verbal responses to the open-ended question, “Please describe in your own words the reasons you believe led to the vehicle asking you to take over during the drive session.” These responses were categorized as: (1) internal attribution to vehicle failures, (2) external attribution to environmental factors, or (3) neutral, defined by participants either restating the TOR message displayed (e.g., “the GPS signal was missing”) or providing ambiguous explanations that could not be clearly classified. Among the 89 participants in the consistent- and inconsistent-error conditions, 15 attributed the errors internally, five attributed them externally, and 69 provided neutral responses. Future studies on automation errors could benefit from making the source of errors more explicit to ensure participants attribute them correctly to the system and incorporating direct measures to assess participants’ error attributions.
Lastly, the participant pool consisted of college students, consistent with many prior studies on trust-in-automation (e.g., 8 , 9 , 29 ), representing a specific demographic with relatively limited driving experience. While this homogeneity minimized variability in driving experience and allowed us to focus on the effects of expectations and error consistency on trust, findings may not generalize to other groups with different characteristics or extensive years of driving.
Conclusion
In conclusion, this study reinforces existing research on trust in ADSs by examining the dynamics among initial expectations, error consistency, and drivers’ trust. Contrary to our initial hypotheses, initial expectations did not affect trust or TOR performance; instead, trust was shaped by the system’s actual performance during real-time interactions, indicating that direct experience is more influential than preconceived expectations. Our findings also highlight how quickly trust can change, even with limited exposure to ADS behavior in the course of this experiment. The impact of inconsistent errors on trust was influenced by the perceived predictability and learning capabilities of the system, suggesting a need for further study in this area. These findings have practical implications for driver education and ADS engineering. Facilitating interactions between drivers and ADSs allows drivers to accurately assess the capabilities and limitations of ADSs, which is instrumental in achieving the appropriate level of trust. The study also indicates the importance of consistency and predictability in system engineering, thereby improving safety and reliability in automated transportation.
Footnotes
Acknowledgements
We thank the undergraduate research assistants for their efforts in data collection and data coding: Faith Zhang, Teon Golden, and Aisha Khemani, as well as Scott A. Mishler and Katherine R. Garcia for their help setting up the driving simulator. We also thank the reviewers for their feedback.
Author Contributions
The authors confirm contribution to the paper as follows: study conception and design: X. Cheng, J. Chen; data collection: X. Cheng; analysis and interpretation of results: X. Cheng, J. Chen; draft manuscript preparation: X. Cheng, J. Chen. All authors reviewed the results and approved the final version of the manuscript.
Declaration of Conflicting Interests
The authors declared no potential conflicts of interest with respect to the research, authorship, and/or publication of this article.
Funding
The authors disclosed receipt of the following financial support for the research, authorship, and/or publication of this article: This research was partially supported by the National Science Foundation (Grant No. 2245055).