
Abstract
Reliable pavement friction performance models are crucial for effective pavement management, affecting both the safety and maintenance costs. Existing models face challenges, including their reliance on laboratory test data, which is not always accessible at the network level, and their inability to capture potential increases in pavement friction shortly after construction or maintenance. To address these issues, this study proposed an exponential decay model that accounts for such potential friction increases as well as exploiting variables that are easily accessible at the network level within a state department of transportation’s pavement management system. Two sets of models were developed: (i) a statewide model for use in areas with limited data availability and (ii) regional models that incorporate adjustment factors for regional conditions. Both model types were validated against actual field measurements, demonstrating acceptable goodness-of-fit for pavement management application. The models showed that increased annual average daily traffic accelerated friction decay, whereas higher truck traffic percentages and higher temperatures were associated with higher terminal coefficients of friction. Conversely, higher precipitation increased the difference between terminal and initial coefficients of friction. Among pavement types, jointed concrete pavements maintained a stable coefficient of friction longer than continuously reinforced concrete pavements and both thick and thin asphalt concrete pavements. This study enhances pavement friction management by providing models that accurately reflect field conditions and regional variations. These models are essential for optimal long-term pavement management, such as the development of 4- and 10-year management plans.
Pavement friction refers to the force that resists the relative motion between a vehicle tire and a pavement surface ( 1 ). The friction force, tangential to the contact interface between the tire and pavement, is proportional to the perpendicular load applied by the vehicle, and the friction coefficient between the tire and pavement. In practice, the friction between the tire and the pavement is often characterized by a dimensionless ratio between the friction force and the vertical load. When the vertical load is constant, an increase in the friction coefficient results in a high level of pavement friction.
Pavement friction is a decisive element in ensuring drivers can safely control and maneuver their vehicles, and keep the vehicles on the road ( 1 , 2 ). With an increase of pavement friction, less effort is needed for a driver to control their vehicle. Although it is uncommon for poor pavement friction to be the primary cause of a crash, it can increase the possibility of skidding or wheel slipping, especially during an emergency maneuver. This, in turn, could lead to loss of control or collision ( 2 ). As a result, pavement friction has been treated as a key input for highway geometric design, and it is necessary to model the deterioration of pavement friction so that the results can be incorporated into the management of pavement networks to provide a safe driving environment.
For most transportation agencies, the management of pavement friction is threshold-based, in which a series of “investigatory” levels are established for different circumstances to decide whether the friction properties of certain pavement sections need to be further investigated. Similarly, a series of “intervention” levels are predetermined to identify pavement sections that need to be treated to improve friction ( 3 , 4 ). However, if the implementation of the approach is solely based on friction measurement, the pavement friction management would be reactive and the investment in the treatment would be less cost-effective. On the one hand, owing to the limitation of the current friction testing methods, the annual measurement of pavement friction for the entire network is difficult. For instance, on average, Texas Department of Transportation (TxDOT) measures only about 30% of its entire network with respect to mileage each year. For certain pavement sections, there might be a gap of several years between two consecutive friction measurements, during which the friction of the pavement section might decrease to unacceptable levels, requiring immediate treatment. On the other hand, there is an optimal “time window,” during which the effectiveness of a certain treatment can be maximized ( 5 , 6 ). However, under the measurement-guided friction management approach, we may miss the optimal time window, thereby achieving less benefit from the applied treatments. To address these issues and advocate proactive pavement friction management, reliable pavement friction deterioration models are critical.
Reliable pavement friction models should reasonably reflect the effect of different variables. These variables include the properties of the surface layer, characteristics of the traffic, and the environment ( 7 – 9 ). Among them, the properties of the pavement surface layer affect the deterioration of pavement friction primarily through their capacity to resist aggregate polishing and abrasion/wear of both aggregates and mix under accumulated traffic and environmental loadings ( 1 ). The characteristics of the traffic and environmental variables affect pavement friction deterioration by changing the properties of the surface layer ( 10 , 11 ). For instance, using aggregates with high wearing resistance, the proper selection of binders, mixture design, and sound construction quality can promote minimal friction reduction compared with the initial values. Conversely, with increasing traffic loadings and volume, the wearing of the pavement surface texture is expected to be accelerated, resulting in accelerated pavement friction decaying rates. Similarly, environmental factors, such as precipitation, heat and sunlight, and freeze–thaw cycles can change the properties of the surface layer by intensifying material aging, breaking the bonds between aggregates and binders, and introducing defects. These changes in the surface layer can then lead to distress and loss of materials on the pavement surface, reducing the level of pavement friction.
Several models have been developed to describe the decay of pavement friction. Wang et al. proposed a convex power model to fit the decaying trend of the British Pendulum Number (BPN) based on laboratory polishing tests ( 7 , 12 ). Expanding this model to field friction measurement data, they developed models to predict in-field pavement friction decay, which incorporated variables including traffic, polishing resistance from laboratory tests, and aggregate gradation. However, the performance of the developed models was limited because of unobserved heterogeneities like weather, traffic volume variance, random measurement errors, and using lab data for field predictions ( 7 ). Li et al. employed survival analysis to successfully develop models that assess the probability of pavement friction remaining above specified thresholds without directly modeling friction values ( 13 ). However, these models utilized only two explanatory variables: the degree of curvature and average speed. Moreover, the test data used for model estimation had limited ranges of traffic and speed. Crisman et al. developed a friction model to predict the deterioration of the BPN by integrating data from accelerated polishing tests and in situ pavement friction degradation using the same aggregates ( 14 ). They extended this laboratory model to predict field pavement friction by converting expected traffic into equivalent polishing time, establishing in situ pavement friction deterioration model expressed as a function of expected traffic and the polished stone value of the aggregates. The models showed poor prediction power outside the original dataset. Santos et al. analyzed a dataset of friction measurements in Portugal and developed predictive models for pavement friction decay in relation to grip number using linear mixed models with random effect specifications ( 8 ). They also found that incorporating highway-specific characteristics alongside traditional traffic and climate variables can significantly enhance model performance compared with models based solely on traffic and climate conditions.
In Texas, the current pavement friction prediction model was initially proposed by Masad et al. based on a study investigating the impact of aggregate properties on skid resistance and its deterioration from polishing ( 9 ). The aggregate textures before the Micro-Deval test and at different polishing times were measured using the Aggregate Imaging System ( 15 , 16 ) and used as one indicator of the polishing resistance of the aggregate. Then, the polishing resistance of aggregate texture, aggregate gradation, traffic, mean profile depth of the pavement surface, were utilized as input variables to predict pavement friction. Subsequent revisions to the model were made by Kassem et al., who incorporated aggregate angularity’s polishing resistance ( 17 ), and by Chowdhury and Kassem, who integrated the percentage of truck traffic and lane distribution into the model ( 18 ). The latest revision was undertaken by Pratt et al. ( 19 ). In this revision, they further modified the model based on reassembled data and newly collected data with an emphasis on high-friction surface treatments.
Although current pavement friction models have demonstrated good project performance, their practical application in pavement friction management at the network level faces several challenges. One significant issue is that most models assume a monotonous deterioration of pavement friction after initial construction or surface treatments. However, both laboratory tests and field observations have shown that pavement friction can increase significantly in the early stages ( 10 , 14 ). This increase is likely to be the result of the wearing away of the binder coating on the aggregate surface, or the rearrangement of aggregates in the surface layer during early traffic compaction, both of which increase the contact area between the tire and the pavement surface. Therefore, developing pavement friction models that account for both the decrease and potential increase in friction during the early stages would be more realistic and beneficial for managing pavement friction at the network level. Additionally, several existing models require inputs of aggregate properties from laboratory tests, however, this information is not always available, especially at the network level. Furthermore, some models lack the consideration of environmental variables.
Objectives
Accurate pavement performance models are critical for the efficient management of transportation infrastructure ( 20 – 22 ). Specifically, for pavement friction management, by reducing the prediction errors of such performance models, agencies can not only achieve significant savings through timely interventions and accurate planning ( 23 ) but also reduce the number of crashes resulting from inadequate pavement friction. Considering the limitations of current pavement friction models, especially their applications to network-level pavement friction management, the objective of this study was to develop pavement friction models that are reliable, are based on pavement management data, and can be easily implemented at the network-level. These models incorporate a comprehensive set of variables that are readily accessible at the network level, producing efficient and accurate predictions while reasonably reflecting the effects of different variables.
Data Source
Pavement Friction Data
In this study, pavement friction data were collected over an 8-year period using both the GripTester (Figure 1) and a locked-wheel skid tester. To ensure consistency across data sources, measurements obtained from the locked-wheel tester were converted to GripTester grip numbers. Based on the statistical distribution of these values, coefficients of friction (CF) were then calculated. The CF ranges from 0 to 1.0, with higher values indicating better pavement friction performance.
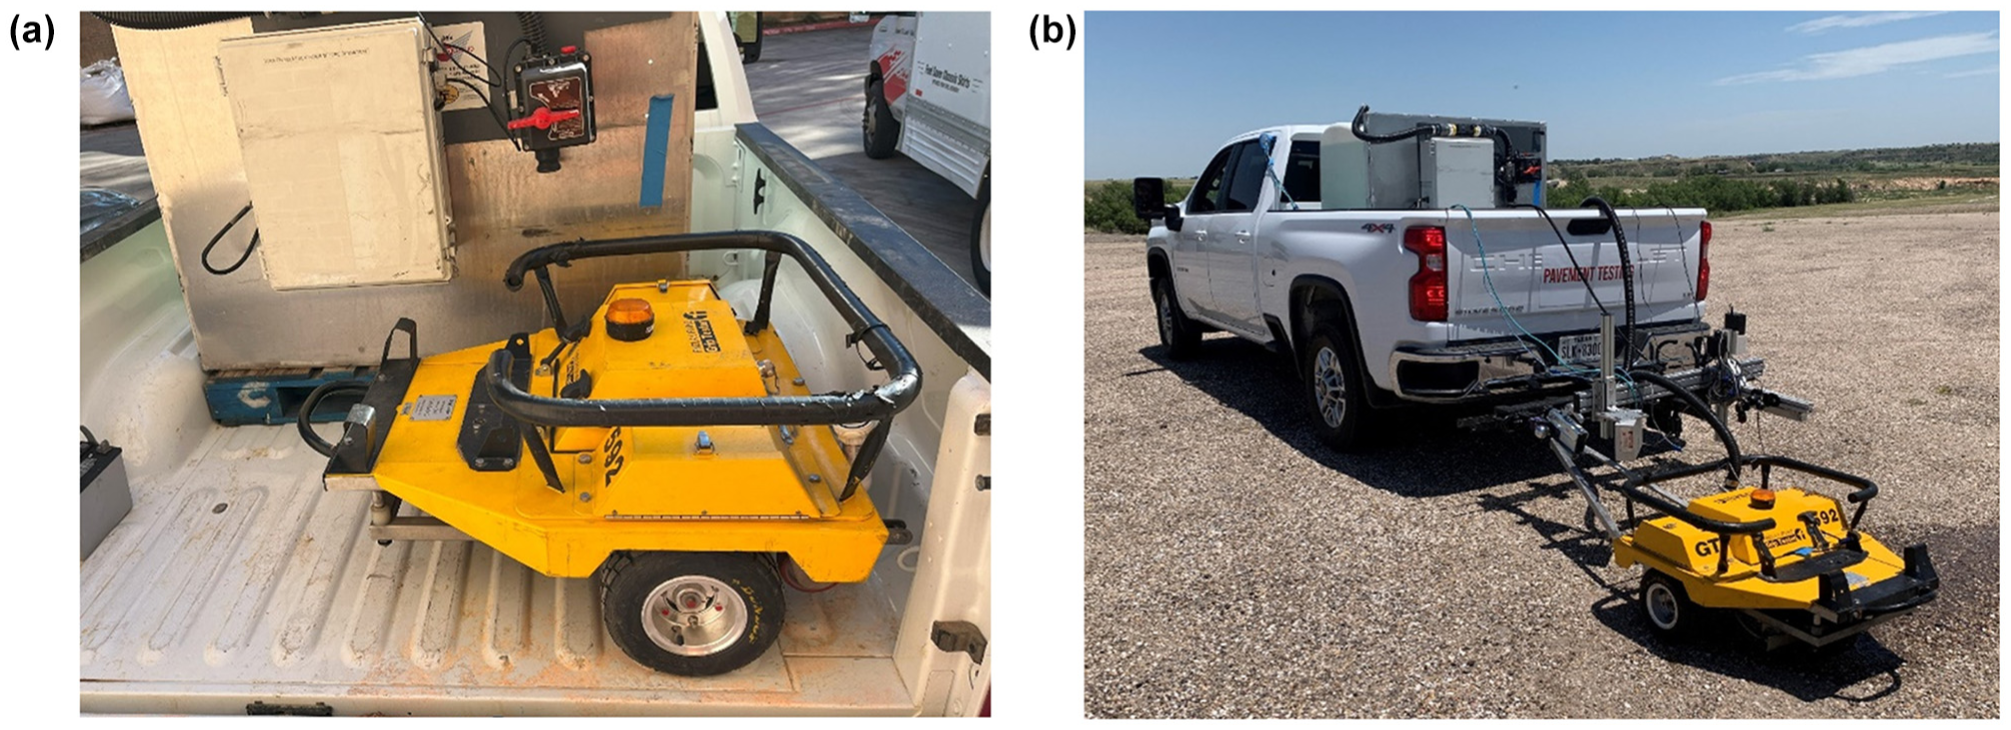
(a) GripTester and (b) field operation.
In Texas, data collection sections (DCS) are defined for the purpose of performance data collection and aggregation, most of which are 0.5 mi in length. These sections can be located using a linear referencing system (LRS), which records the distance from a designated origin point along each route. Pavement friction measurements are also referenced using this system, allowing for accurate matching of individual friction data points to their corresponding roadway segments.
To assign friction values to each data collection section, all friction measurements located within the corresponding DCS were identified using the LRS. Although most sections are uniformly 0.5-mi long, some variation exists. In cases where multiple friction measurements were available within a section, the average value was used to represent the section’s pavement friction.
By combining this friction dataset with pavement work history records obtained from TxDOT’s Open Data Portal, we established a comprehensive analysis dataset comprising 34,055 records, representing total friction measurements summarized at the 0.5-mi intervals across multiple years, for friction modeling.
In considering pavement surface age, Figure 2 shows that as surface age increased, the number of data points decreased. This is most likely attributable to rehabilitation or maintenance activities undertaken in response to deteriorating conditions, such as poor pavement friction. This pattern aligns with engineering principles, which suggest an increased probability of failure or need for intervention as pavements age. Notably, the majority of data points corresponded to surfaces less than 5 years old, aligning with TxDOT’s maintenance practices. Consequently, friction models derived from this dataset are likely to produce more robust short-term predictions than long-term predictions.
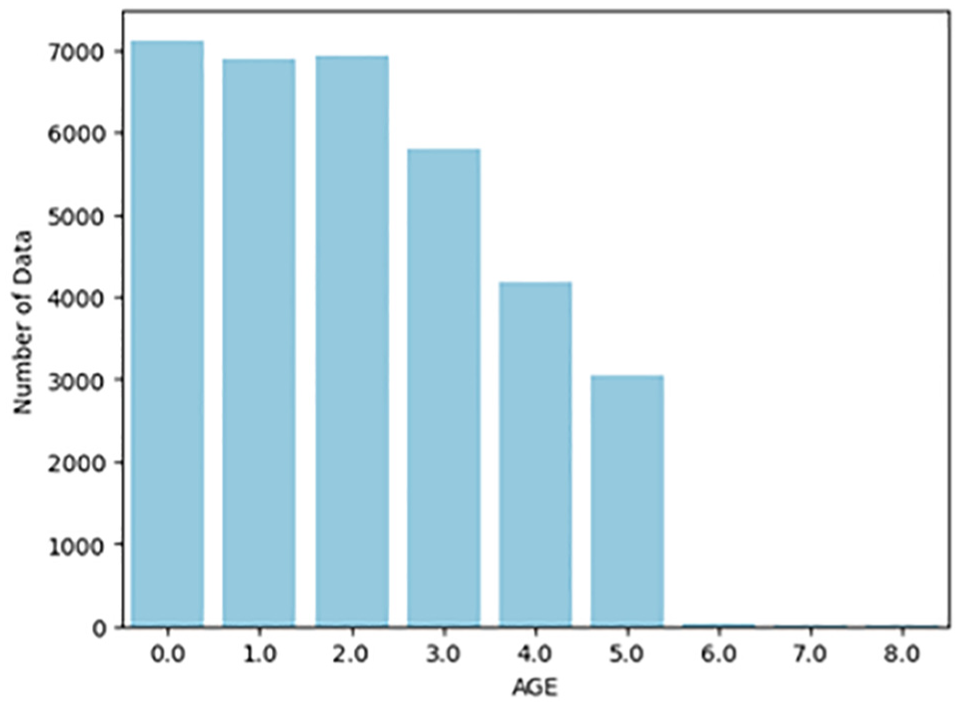
Distribution of data measurements at different surface ages.
The change in CF with pavement age for this dataset is presented in Figure 3. As shown, there was a noticeable decreasing trend in CF as pavement age increased, particularly within the 0- to 6-year range. However, a distinct rise in CF was observed at Pavement Ages 7 and 8. This apparent discrepancy occurred because of the scarcity of data points at later ages, with the data being dominated by pavement sections that had better resistance to friction decay, thereby skewing the friction distribution at these ages.
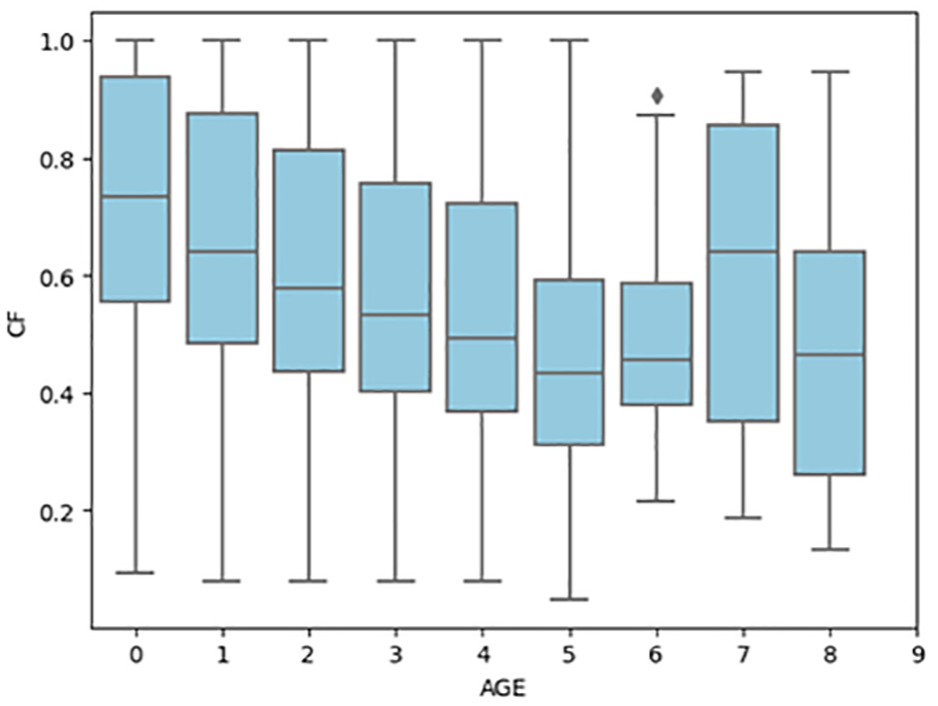
Change in coefficient of friction.
Selection of Variables
The road segments used in this study encompassed highways with varying functional classifications, including farm-to-market roads, state highways, national highways, and interstate highways. These segments also represent different pavement types, climate conditions, and traffic characteristics. Specifically, the average annual daily traffic (AADT) of the road segments ranged from 22 to 95,893, the average temperatures (tavg) from 56.50°F to 72.03°F, annual precipitation (prcp) from 10.19 to 61.25 in., and truck traffic percentages ranged from 1.33% to 59.85%. To facilitate the implementation of pavement friction models for network-level pavement friction management, this study extracted a comprehensive set of explanatory variables accessible from the TxDOT’s Open Data Portal and Pavement Management Information System (PMIS) and other external sources. The explanatory variables utilized in the pavement friction modeling included pavement type, facility type, traffic, and environment.
The pavement type information encompassed thin asphalt concrete pavement (less than 2.5 in., AC_Thin), thick asphalt concrete pavement (greater than or equal to 2.5 in., AC_Thick), composite pavement (COM), jointed concrete pavement (JCP), and continuous reinforced concrete pavement (CRCP). Facility type was categorized into farm-to-market roads (FMs), state highways (SHs), U.S. highways (US), and interstate highways (IHs). Traffic factors included the 20-year projected equivalent single axle loads (ESALs), AADT, and the percentage of truck traffic.
Climate data were sourced from the National Oceanic and Atmospheric Administration (NOAA) database, incorporating variables such as the 30-year normal mean annual temperature and mean annual precipitation. These data were first aggregated at the county level by averaging the climate information of weather stations within each county boundary. The climate information for roadway segments was then assigned based on their corresponding county locations. The distribution of climate variables at the county level is revealed in Figure 4: in general, temperature increased from north to south, whereas precipitation increased from west to east.
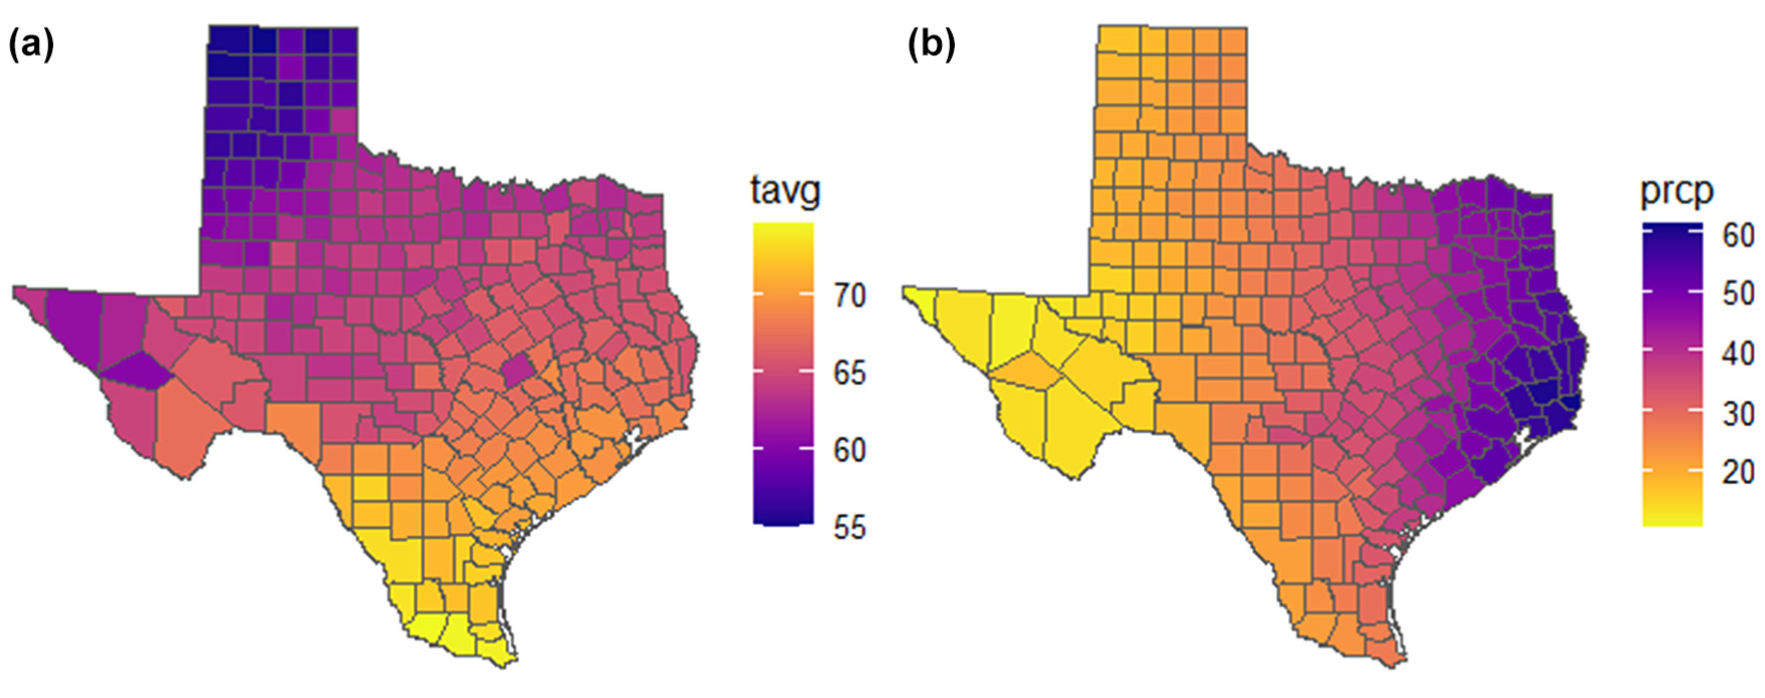
Climate information (Left: normal mean annual temperature; Right: normal mean annual precipitation).
Recognizing the critical role of aggregate properties and surface type information in friction modeling, and the limited availability of this information at the network level, a region variable was also established based on TxDOT’s district map. This region variable could enhance the robustness and accuracy of the friction models by compensating for the absence of detailed aggregate source and surface type information.
It should be noted that, among these extracted variables, a fundamental correlation exists between the 20-year projected ESALs and AADT. Given this inherent correlation, reliance on AADT was deemed appropriate for the development of the friction model. Additionally, a correlation analysis was conducted among the remaining variables, where a substantial correlation between AADT and facility type was identified. As illustrated in Figure 5, which depicts distributions of AADT for various facility types through box plots, IHs showed the highest level of AADT followed in order by US, SH, and FM routes. Consequently, in the model estimation process, the facility type was omitted.
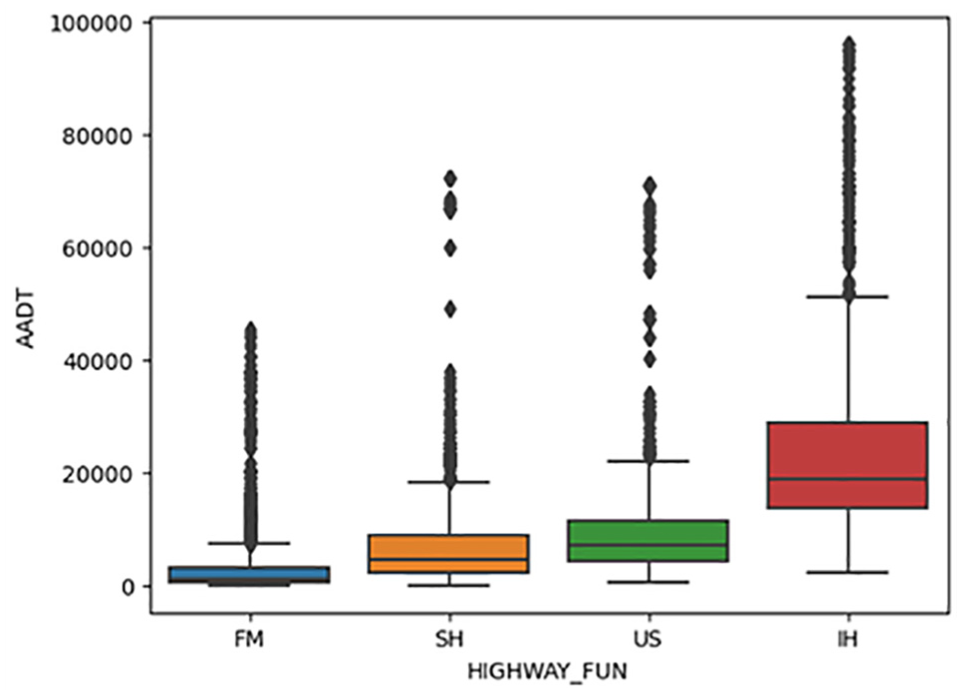
Correlation between AADT and facility type.
Model Specification
Referring to TxDOT’s current pavement friction model ( 19 ) and the potential increase of pavement friction in the early stages of a pavement’s lifespan ( 10 , 14 ), in this study, the following model specification was used for the friction model development:

where
a is terminal CF,
b is maximum decay of the CF between the terminal value and initial value,
c is decay rate, and
t 0 is parameter used to address cases in which the CF increases in the early stages after construction or maintenance activities.
In the exploration of proper ways to incorporate different explanatory variables, Equation 1 was first employed to model the data for individual pavement sections, utilizing pavement age as the sole independent variable. This process yielded a set of model coefficients (a, b, c, or t0) for each project. Subsequently, a comprehensive multiple linear regression analysis was performed, which involved the fitting of a multiple linear model to relate each model coefficient to all available explanatory variables. The primary objective of this analysis was to identify statistically significant explanatory variables associated with each model coefficient. Based on the analysis and applying sound engineering judgment, the following specifications were adopted to incorporate different explanatory variables:

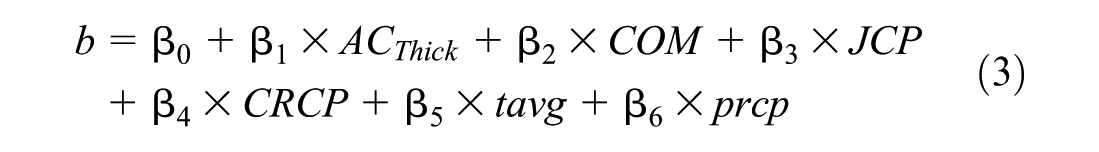


where
TRUCK_PCT is percentage of truck traffic;
AC_Thick is thick asphalt concrete (thickness ≥2.5 in.);
COM is composite pavement;
JCP is jointed concrete pavement;
CRCP is continuously reinforced concrete pavement; and
tavg, and prcp represent the 30-year normal mean annual temperature and mean annual precipitation, respectively.
As discussed previously, the characteristics of aggregates and pavement surface types play a critical role in influencing the duration of pavement friction. However, at the network level, tracking aggregate sources and properties is challenging, and surface type information for older pavements is often unavailable or inaccurate. Considering that different administrative regions may prefer specific aggregate source and surface types, location information (i.e., region), based on the TxDOT district boundaries, was used to reflect possible differences in aggregate properties and surface types across different regions. This necessitated the incorporation of region-specific information in the development of pavement friction models to account for regional variations. However, the training dataset did not cover all regions of Texas, and within the covered regions, there is a significant imbalance in data distribution. As a result, either direct incorporation of the region as an explanatory variable or developing friction models for each region would result in biased model performance and the absence of friction models for some regions. Consequently, in this project, two sets of models were developed:
Statewide models: These models were constructed without considering the effect of the regions, allowing for application in regions with scarce or no data during model training. The least-squares method was employed in the estimation of statewide friction models. This method seeks to minimize the objective function, which is defined as the sum of squared distances between predictions and observations,
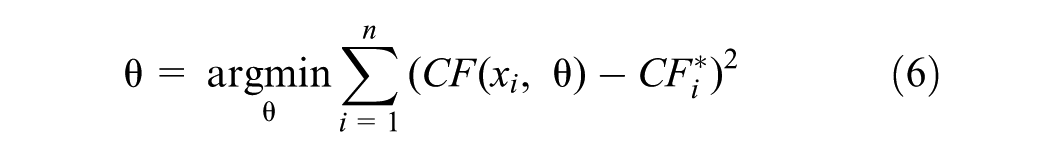
where
Region-level models: In developing region-level models, adjustment factors were introduced for regions with a minimum of 30 data points in the training dataset. This adjustment ensures a more tailored and accurate representation of the unique characteristics present in regions with sufficient data, as presented in Equation 7,

where
Results and Discussion
The estimation of the statewide model was conducted with a single constraint mandating a positive value for
Estimation of Statewide Model
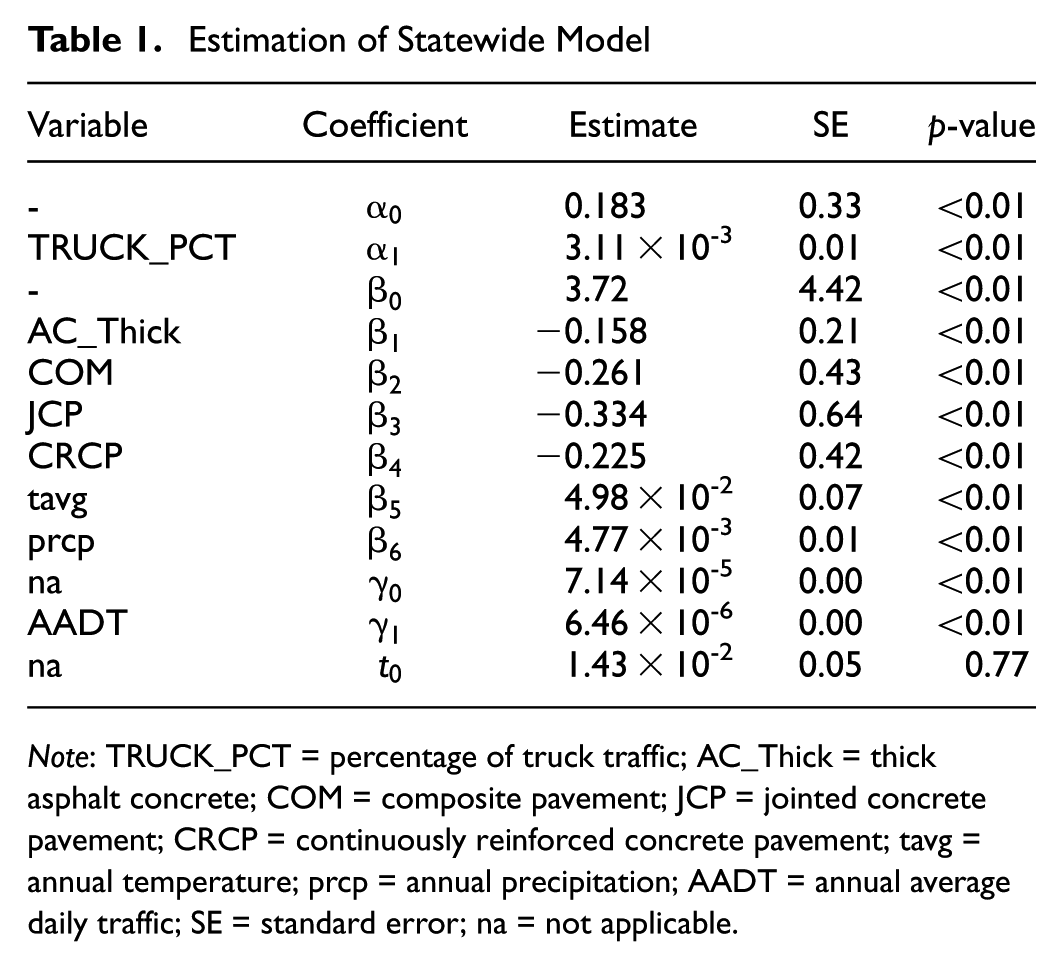
Note: TRUCK_PCT = percentage of truck traffic; AC_Thick = thick asphalt concrete; COM = composite pavement; JCP = jointed concrete pavement; CRCP = continuously reinforced concrete pavement; tavg = annual temperature; prcp = annual precipitation; AADT = annual average daily traffic; SE = standard error; na = not applicable.
The estimation of the region adjustment factors is presented in Table 2. Notably, the majority of regions exhibited statistically significant adjustment factors at a confidence level of 95%. This indicates substantial variations in the decay of pavement friction across regions, reinforcing the importance of incorporating region-specific adjustments. It was found that this correlated to the aggregate quality and practice in selecting surface type in the region.
Region Adjustment Factor
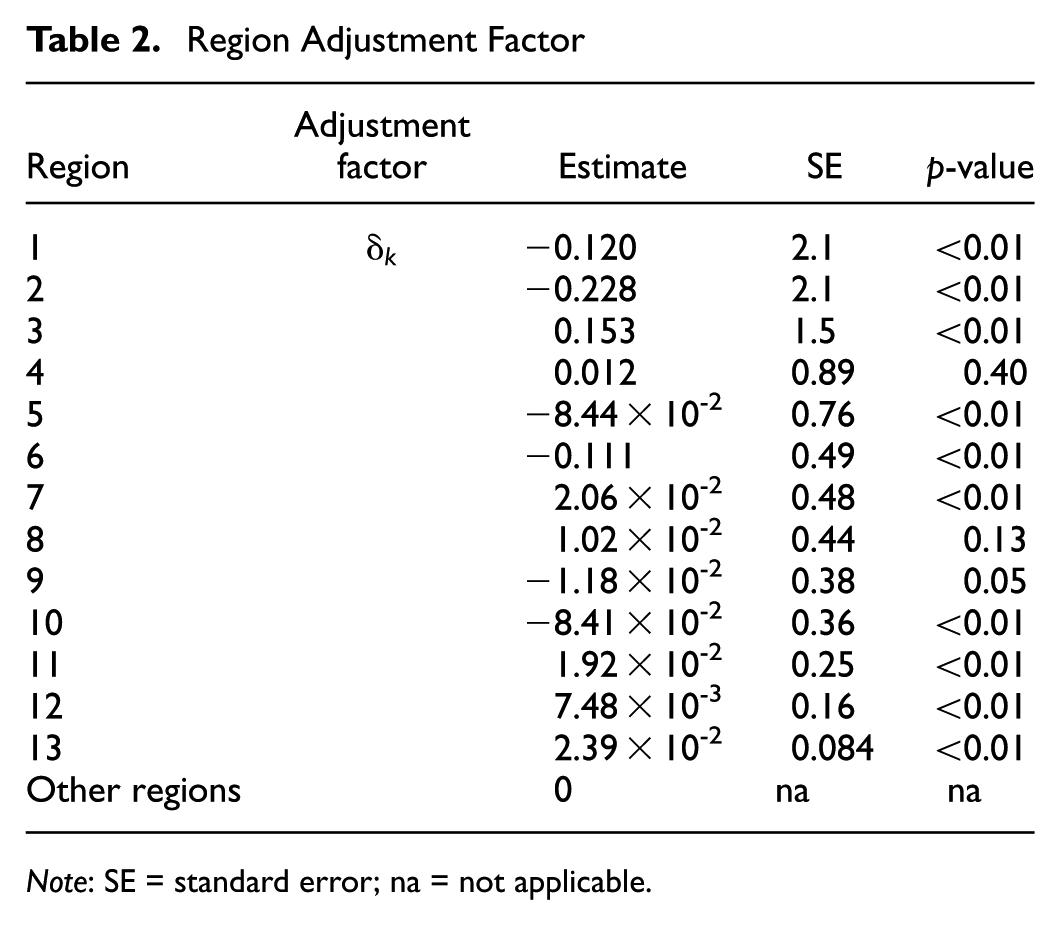
Note: SE = standard error; na = not applicable.
To assess the performance of the developed friction models, root mean square error (RMSE) values were computed for both the statewide and regional models, as shown in Table 3. The table also includes summary statistics for each region and the statewide dataset. Specifically, Column 2 shows the total number of data points used for model development within each region; Column 3 indicates the number of unique pavement sections these data points came from; and Column 4 reports the total mileage of those sections. It is important to note that regions with fewer than 30 data points were excluded from regional model development. As a result, the sum of the data points, number of sections, and total mileage across all listed regions is smaller than the corresponding statewide totals.
Statewide and Region-Level Model Performance
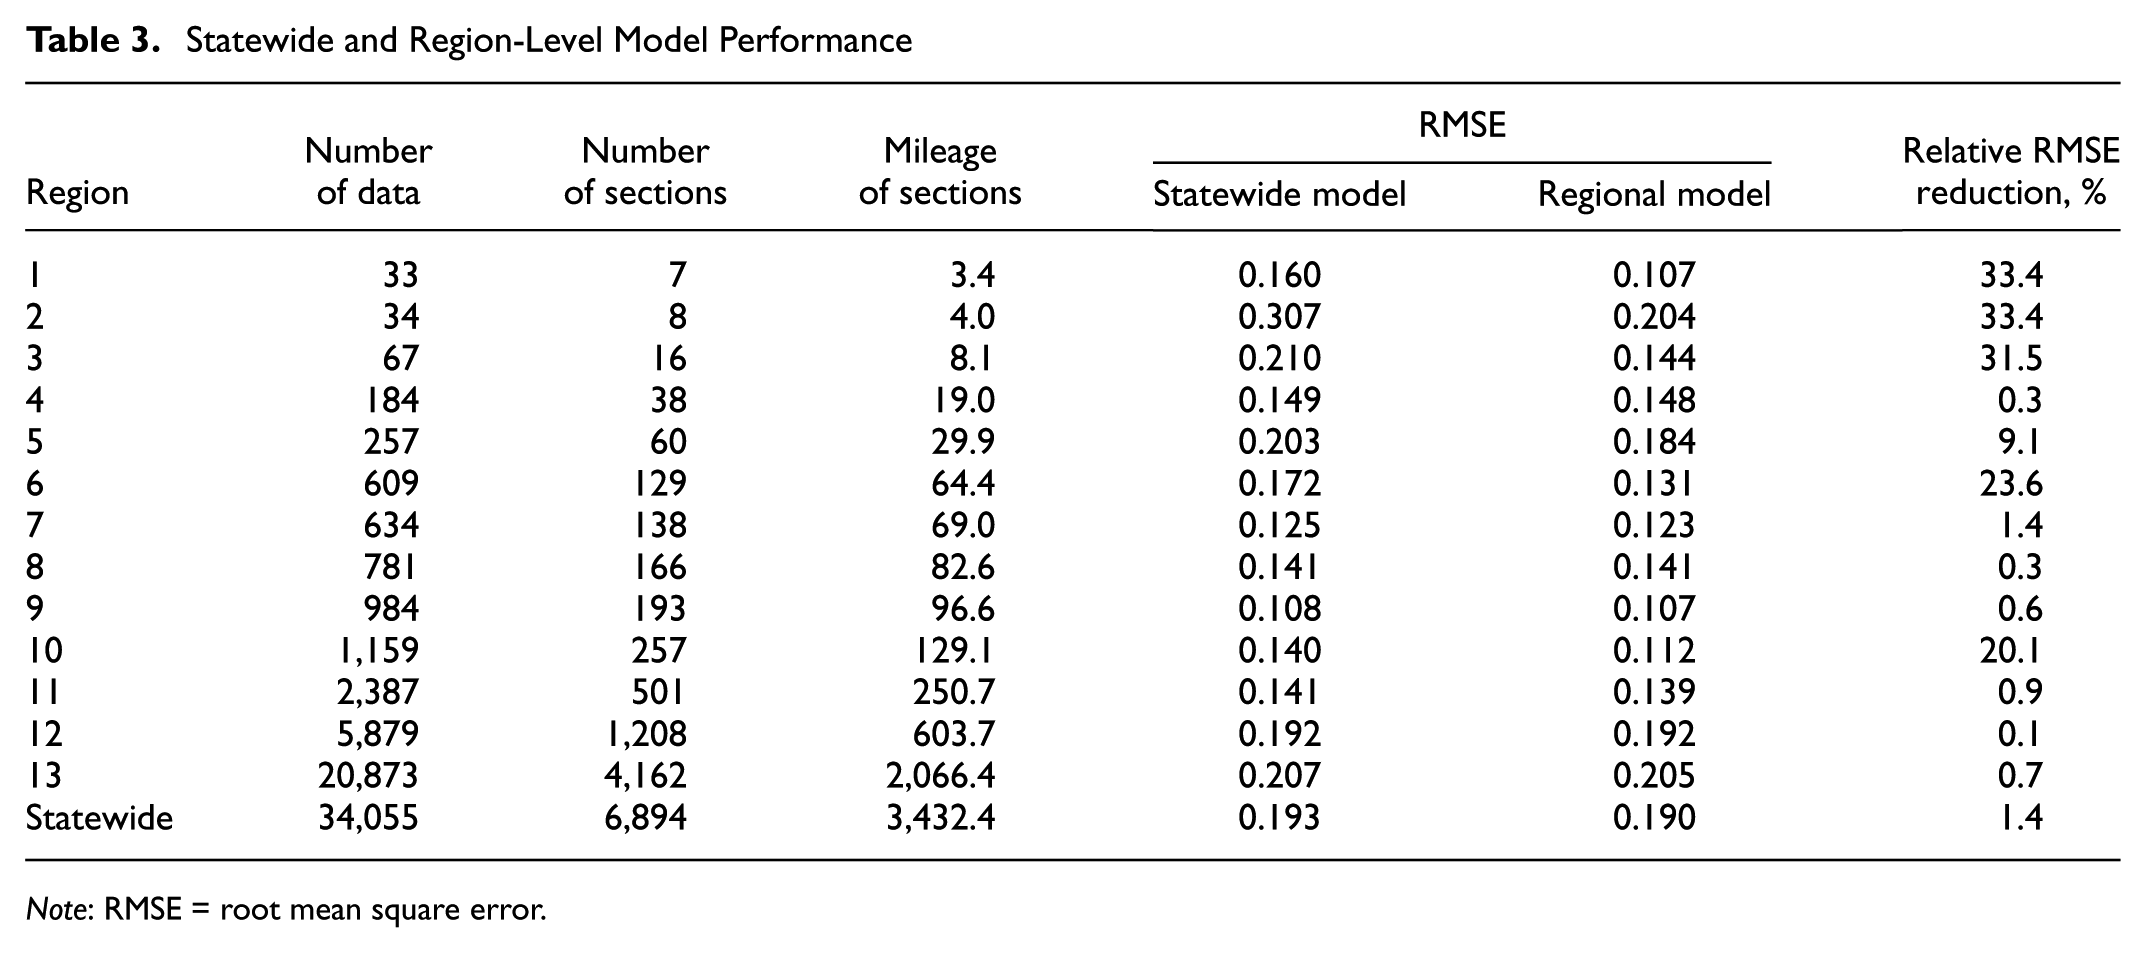
Note: RMSE = root mean square error.
The statewide and regional models had RMSEs of 0.193 and 0.190, respectively, indicating that the models exhibited good predictive accuracy. Compared with the statewide model, the regional models demonstrated lower RMSEs both at the state level and within individual regions. Although the RMSE reduction for some regions was relatively small, significant reductions in RMSE and improvements in model performance were observed in others, validating the necessity of incorporating variables to account for the regional variance in the change of pavement friction.
To further evaluate the performance of the statewide and regional models, a comparison was made between field measurements and model predictions at both the state and region levels (see Figures 6 and 7). In these figures, the blue boxplots depict the distributions of friction indexes at different ages from field measurements and the orange boxplots represent model predictions. As shown, at the state level, predictions from the statewide models exhibited median values that closely aligned with field observations, indicating an exceptional goodness-of-fit. Similarly, at the region level, the medians of predictions from the region-level models closely resembled those from field measurements, particularly in regions with a larger amount of data. This consistency further underscored the efficiency of the developed models in capturing the observed trends both statewide and at the region level.
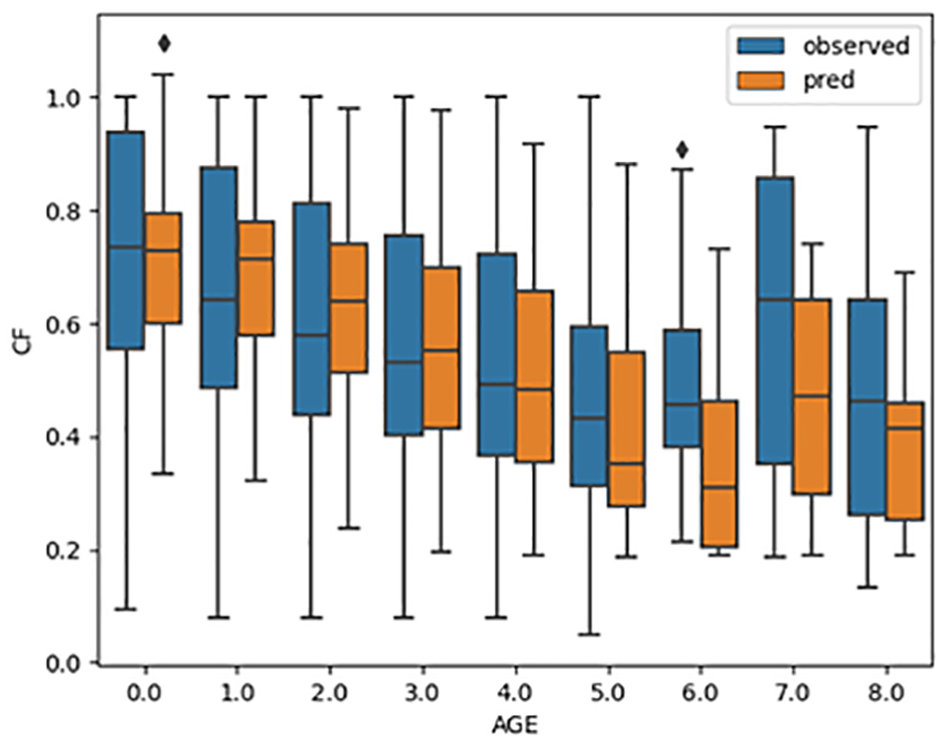
Statewide model performance (without region adjustment).
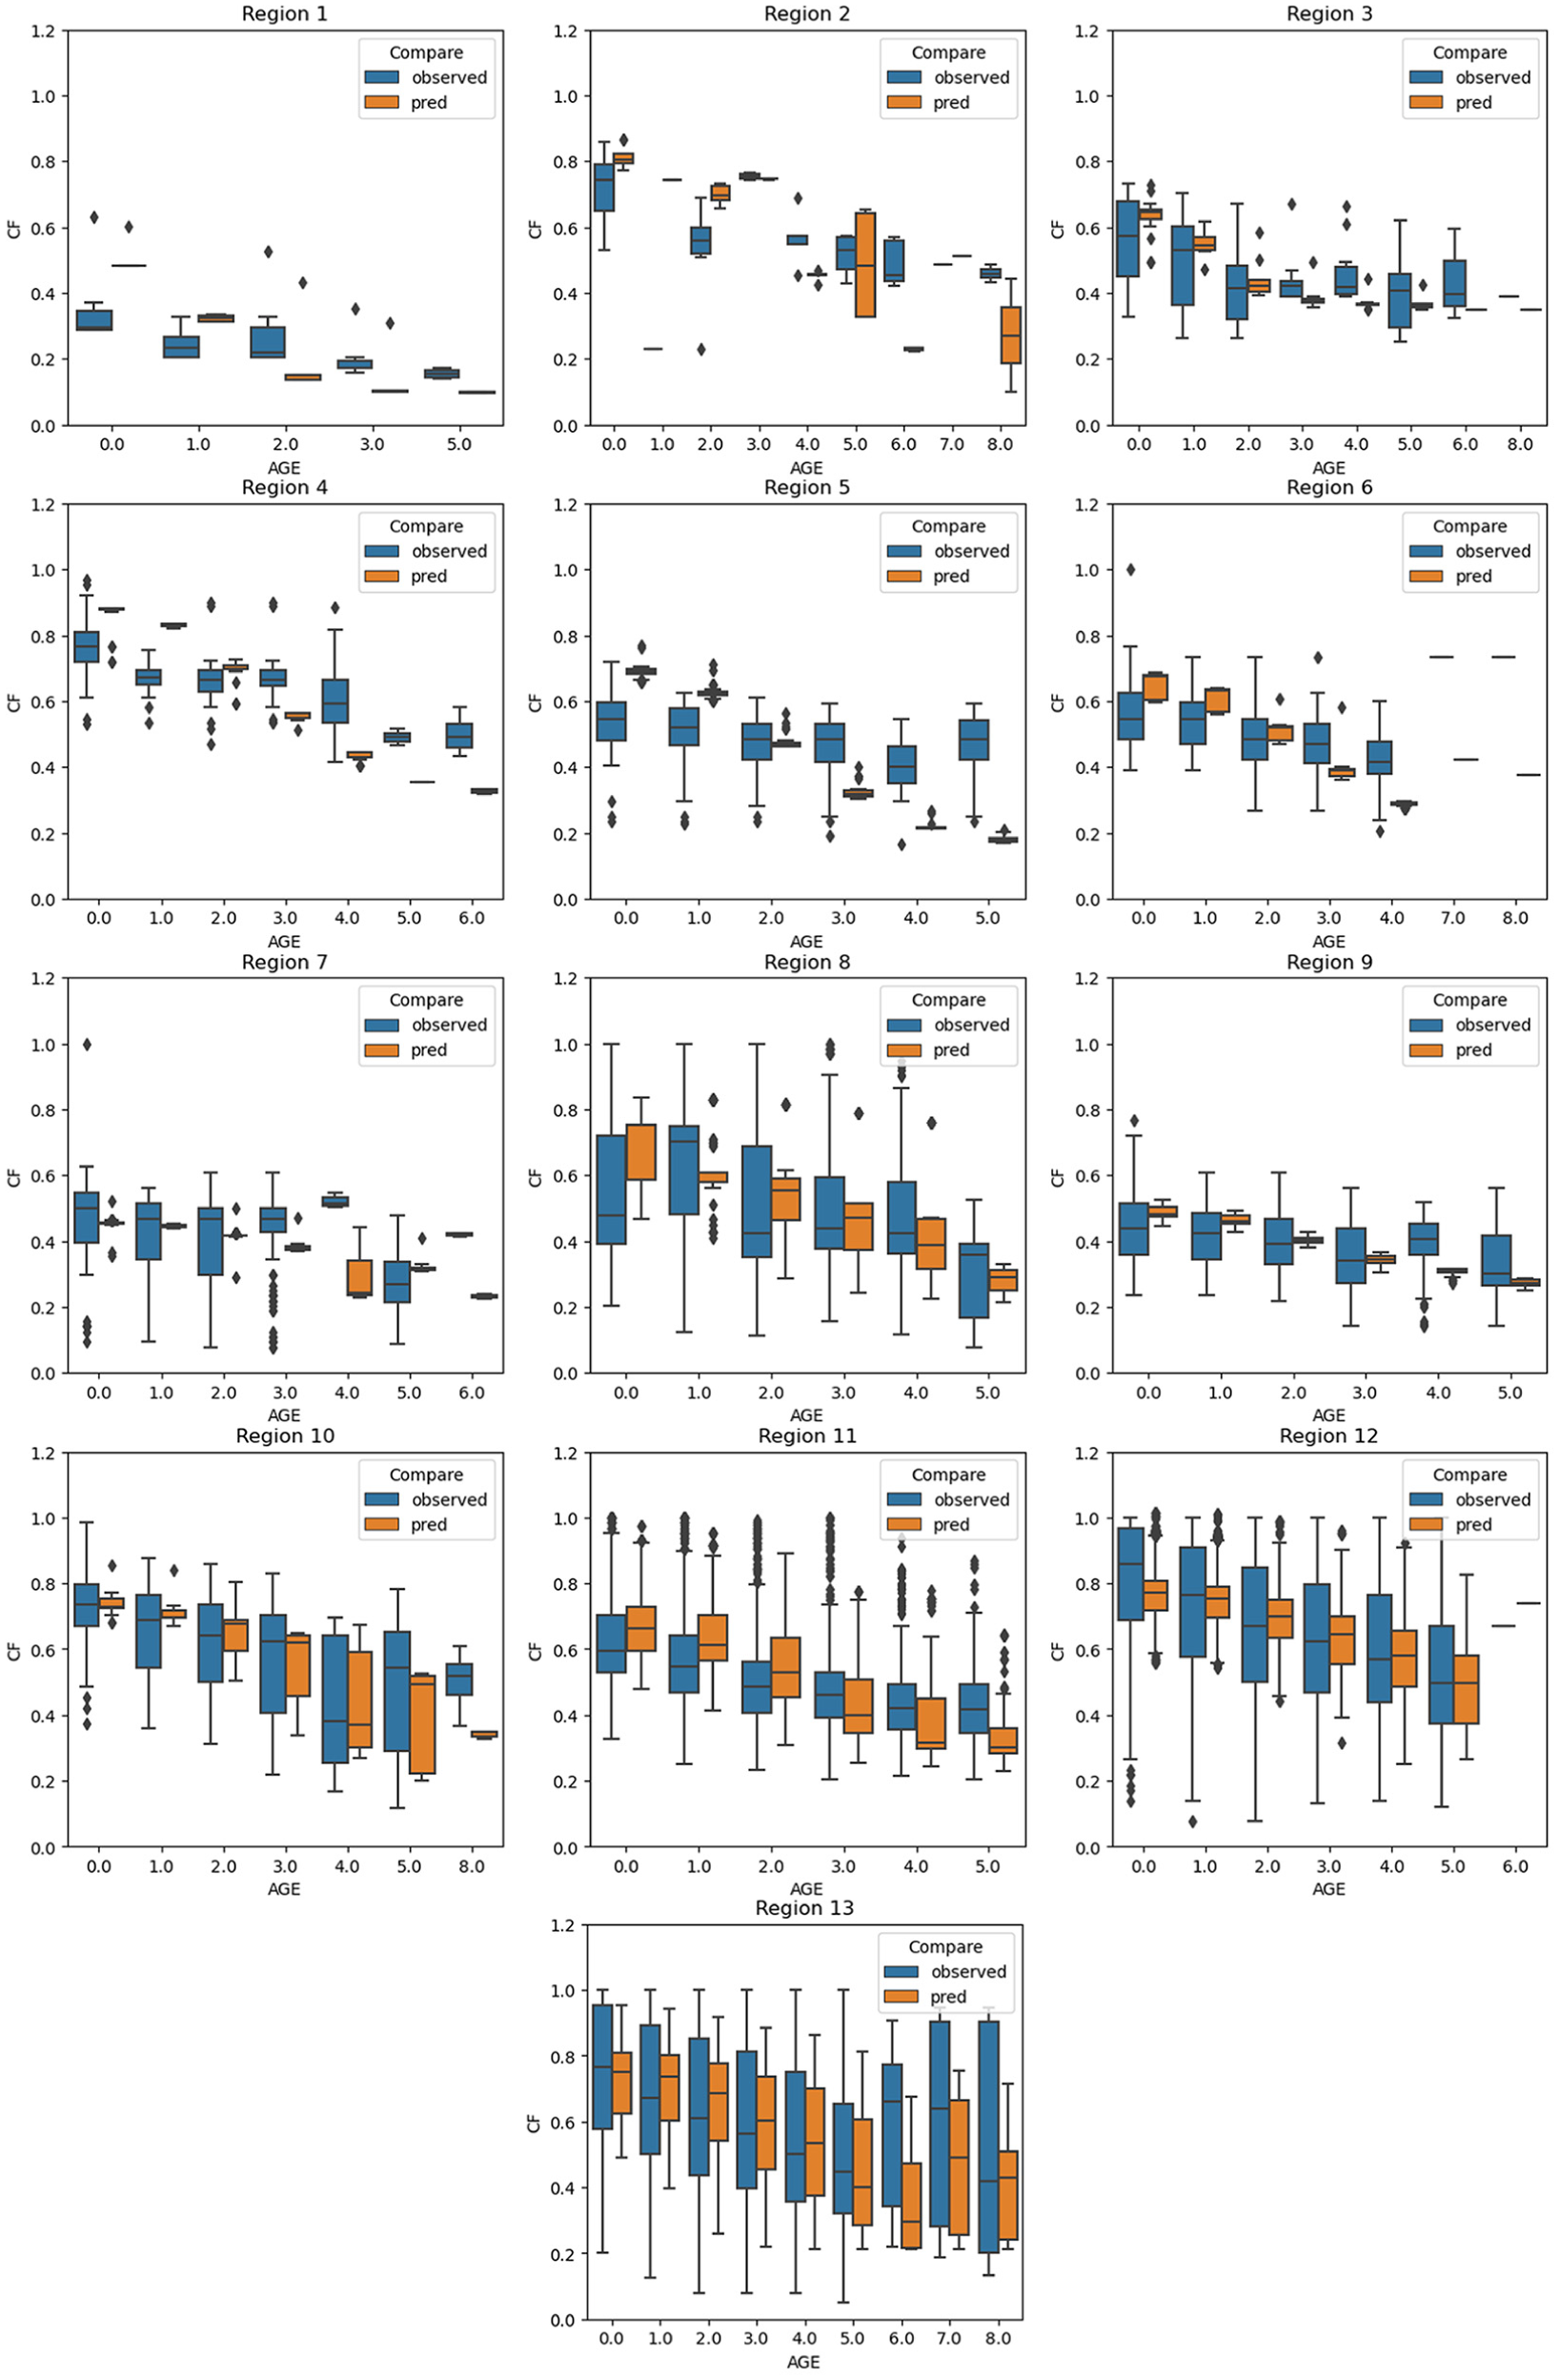
Region-level model performance.
Conclusions
Pavement friction is crucial for ensuring that drivers can safely control and maneuver their vehicles and keep vehicles on the road. Consequently, it is imperative for transportation agencies to maintain adequate friction levels on their highway network to provide a safe driving environment. Achieving this requires effective friction management, which requires efficient modeling of pavement friction performance to guide the decision process during friction-related maintenance and rehabilitation activities. However, current pavement friction models are predominantly developed based on laboratory data and lack the predictive ability for field friction at the network level. Considering these limitations, this study aimed to develop pavement friction models that are reliable, based on actual pavement management data, and that could be easily implemented at the network level. The main conclusions of this study are listed below.
A dataset for friction modeling, consisting of 34,055 records over 8 years across Texas, was established. To facilitate the implementation of the developed models for network-level pavement friction management, a set of variables that can be easily accessed at the network level was identified and extracted from TxDOT’s Open Data Portal, the PMIS, and the NOAA database. The variables extracted from these databases include pavement type, facility type, traffic volume, temperature, and precipitation. All these variables are commonly available in most pavement management systems.
An exponential decay model, which can incorporate potential increases in pavement friction in the early stages after construction or maintenance activities, was proposed. This was done to account for early increases in friction observed in the field under given combinations of aggregates and surface types.
Based on the proposed model specification, two sets of models were developed for both statewide and region-level applications. Statewide models were constructed without considering regional variations, allowing for application in regions with scarce or no data during model training. The region-level models were established by introducing adjustment factors to account for the region-specific effects in the decay of pavement friction. Compared with field friction measurements, predictions from the statewide and region-level models aligned with the actual measurements very well, demonstrating the usefulness of the developed models.
The estimated model coefficients correctly reflected the effect of different variables. An increase in AADT was associated with a faster decay rate in pavement friction. Pavement sections with a higher percentage of truck traffic tended to preserve higher terminal CF. Higher temperatures were linked to a smaller difference between terminal and initial CF, whereas higher precipitation was associated with a larger difference between terminal and initial CF. With regard to pavement type, JCPs, despite having the lowest initial CF, were found to be more durable than CRCP, and thick and thin ACPs.
In summary, this research validates the feasibility of friction modeling with limited variables at the network level. Although our models were developed using data from Texas, the structure is generalizable. Application to other regions may require validation or adjustment, but the underlying principle holds: effective network-level models do not necessarily require an exhaustive set of detailed inputs—they can be successfully developed using readily available explanatory variables at the network level. Future work should focus on enhancing friction model implementation by addressing several key areas: a) surface type and texture were not considered in the development of the friction models, but these factors significantly influence friction characteristics. The model should be updated when such data become available; b) incorporating surface material properties is challenging owing to the lack of linkage between construction and performance data. Further effort is needed to establish this link and incorporate these properties into friction models; c) some regions lack sufficient data, particularly continuous measurements over multiple years, leading to underfitting in certain regional models. It is anticipated that regional models, especially in data-scarce areas, will need recalibration as additional data become available.
Footnotes
Author Contributions
The authors confirm contribution to the paper as follows: study conception and design: H. Xu, J. A. Prozzi; data collection: H. Xu, J. A. Prozzi; analysis and interpretation of results: H. Xu, J. A. Prozzi; draft manuscript preparation: H. Xu, J. A. Prozzi. All authors reviewed the results and approved the final version of the manuscript.
Declaration of Conflicting Interests
The authors declared no potential conflicts of interest with respect to the research, authorship, and/or publication of this article.
Funding
The authors received no financial support for the research, authorship, and/or publication of this article.