
Abstract
This paper aims to raise awareness about the decarbonization process and to estimate the potential to decrease greenhouse gas emissions, especially carbon dioxide, and other pollutants from tourist, leisure, and sports activities in the sensitive inland and coastal areas in central Portugal (Ria de Aveiro, Mondego Estuary, and Peniche). A specific objective was the characterization of mobility in inland and coastal waters for existing tourism, leisure, and sports activities. To achieve this, we gathered data about leisure boats through interviews with different entities. Then, emissions (NOx, NH3, PM10, and CO2) were calculated using the EMEP/EEA Air Pollutant Emission Inventory Guidebook 2019 method, considered to be the European reference. CO2 emissions were then assessed for alternative scenarios involving the use of biofuels (B15 and E10), and the electrification of boats using reduction emissions factors from RED II and emission factors from an energy provider. This research demonstrated that replacing fossil fuels with B15 and E10 in recreational boats represents an effective strategy for reducing CO2 emissions in the short term (reductions of 334.5 t (tonnes) CO2 and 73.2 t CO2, respectively). A more complex solution would be to replace combustion engines with electric engines on touristic boats with off-board engines that operate for extended periods, which would result in a significant reduction in CO2 emissions (a reduction of 104 t CO2 in the analyzed cases).
Inland and coastal waters are crucial for the movement of people and large volumes of goods at low cost. Natural and artificial inland waterways exist worldwide, such as the Suez Canal and the Rhine–Meno–Danube Canal. In the EU, domestic shipping accounted for 0.4% of total greenhouse gas (GHG) emissions in 2019, corresponding to approximately 16,262 kilotonnes of CO2e ( 1 , 2 ). The EU has set a target to reduce net GHG emissions by 55% by 2030 and to achieve climate neutrality by 2050 ( 3 ).
The Horizon Europe project aims to strengthen research and innovation supporting the EU’s climate change targets via development and dissemination of knowledge and technology. Decarbonization projects, such as the Atlantic-Arctic Agora Horizon Europe project (A-AAGORA) ( 4 ), are crucial in mitigating climate change’s adverse effects, primarily caused by carbon emissions. These projects promote transition to a more sustainable and resilient economy. A-AAGORA supports the EC’s mission of “Restoring our oceans and waters by 2030,” by combining competences from academia, industry, and public and private entities, through collaborations with various local agents to explore themes such as climate resilience, ecosystem-based management, sustainable blue economy (including the decarbonization process), and the interaction of society with these themes. The main objectives of this project are 1) to protect and restore marine and freshwater ecosystems and biodiversity; 2) to protect valuable ecosystems located in coastal communities vulnerable to climate change; 3) to mitigate the effects of climate change; and 4) to decarbonize small to medium port areas. A-AAGORA aims to develop pilot projects focusing on small-scale sustainability that can be expanded or replicated in different areas of Europe to achieve the objectives of this project.
To pave the way for decarbonizing sensitive inland and coastal water areas in the central region of Portugal, the main objective of this research was to quantify the potential reduction in GHG emissions (particularly CO2) and other pollutants from tourist, leisure, and sports maritime activities. Specifically, characterizing the mobility of existing tourism, leisure, and sports activities in inland and coastal waters.
The research contribution of this paper is to highlight the significance of maritime-mobility-related emissions generated by tourism activities and, through case studies, stimulate interest in the development of pilot projects and further studies on the decarbonization process of inland and coastal mobility. The remainder of this paper is organized as follows: Section 2 provides a state-of-the-art review of the literature; the methodology used is presented in Section 3; the analysis and a discussion of the results are provided in Section 4. Following this, some conclusions are drawn and measures for decarbonization defined in the final section.
Literature Review
The EMEP/EEA Air Pollutant Emission Inventory Guidebook 2019 ( 5 ) is a key document addressing emissions from ships and their calculations. It covers all types of aquatic transport, from recreational boats to large-scale cargo ships. The method detailed in this guidebook has been used in previous research to calculate shipping emissions.
Tomić-Petrović et al. address environmental problems at international and national levels, focusing on inland navigation and the Danube navigation network ( 6 ). The paper assesses the emissions and costs produced by motor cargo vessels and small passenger cruise ships on the Danube River. The calculation of emissions is based on the average power of the main engines of different types of vessels and the fuel used, with all vessels analyzed using marine diesel. The European Monitoring and Evaluation Programme (EMEP) Tier 1 method is used to calculate emissions. River transport on the Danube offers a reliable, cost-effective, and eco-friendly alternative to land transport, but their use of fossil fuels still has a negative impact on the environment.
Another interesting study that used the EMEP method was developed by Johansson et al., which used EMEP’s emissions factors to model leisure boat activities and emissions in the Baltic Sea. The model, called BEAM (Boat Emissions and Activities Simulator), combines recreational boat characteristics with a temporal and geographically distributed profile ( 7 ). The study concluded that recreational boat emissions were concentrated in urban areas during the summer and were significant compared with commercial boat emissions in the Baltic Sea.
EMEP’s emissions calculation method is still used for European ship emissions inventories, for example, in the UK ( 8 ). Such studies show that ships of less than 400 GT (gross tonnage) contribute negligibly to total CO2 emissions and fuel consumption.
The WATERBUS emissions model was developed by Pecorari et al. to estimate pollutant emissions from small touring and leisure boats in Venice, Italy ( 9 ). This model uses some assumptions from EMEP. The study found that replacing older engines reduced annual emissions by 4%, and that small boats were a key source of emissions that could affect overall urban emissions in Venice, contributing levels comparable to those of road traffic.
The study by Monteiro et al. on the environmental impacts of shipping in Ria de Aveiro used the URBan AIR model incorporating the EMEP method as the basis for evaluating pollutant emissions in the atmosphere ( 10 ). The study also analyzed the pollution of river waters from the discharges of scrubbers (exhaust gas cleaning systems), mainly studying the effects on ecosystems. The study suggests that shipping activity could potentially affect marine ecosystems if the scrubber water is discharged (open loop scrubbers), highlighting the potential for false conclusions and imprudent policy choices based solely on air emissions or sea discharges.
Studies have also incorporated the EMEP method within the framework of the A-AAGORA project ( 4 ): Barbosa et al. created a web calculator of GHG emissions ( 11 ); and Barata et al. quantified the emissions generated by several mobility alternatives (road, maritime, and rail modes) in the central region of Portugal and proposed a Mobility Decarbonization Plan for small- to medium-sized ports ( 12 ). Some of the measures studied ( 12 ) were onshore power supply, electrification of cargo handling equipment, cargo modal shift from road to rail transport and using B100 or other advanced fuels with low or net zero emissions as an alternative. The current research aims to complement these studies by quantifying emissions from smaller vessels engaged in tourism, leisure, and sports activities.
The International Maritime Organization (IMO) began considering technical and operational measures to improve energy efficiency in maritime transport in the early 2000s to reduce its impact on climate change. To that end, IMO created indicators. One of IMO’s indicators is the Energy Efficiency Design Index ( 13 ), which provides a specific value for a specific ship project but can only be applied to larger ships like tankers and cargo ships. Another IMO indicator, the Energy Efficiency Operational Indicator ( 14 ), measures operational efficiency in CO2 emissions but is only applied to vessels with a capacity of more than 12 passengers. IMO has also introduced the Energy Efficiency eXisting ship Index (EEXI) and the Carbon Intensity Indicator ( 15 ), but these can only be applied to ships with a gross tonnage equal to or higher than 400 GT.
Another method for acquiring an inventory of atmospheric emissions from mobile sources related to ports over a specific period was developed by the U.S. Environmental Protection Agency (EPA) ( 16 ). This guide analyzed emissions from ocean-going vessels, harbor crafts, recreational marine vessels, and other sources. Recreational vessels are primarily used for recreation, however, some operate more like commercial vessels owing to their continuous exploration and are therefore considered to be harbor craft. The MOVES-Nonroad model ( 17 ) is the main tool for calculating recreational ship emissions. Using the EPA method, Ramboll conducted an inventory of marine emissions from commercial boats in Texas in 2020 and some trend inventories through 2050 ( 18 ).
Bruccoleri et al. focused on the environmental impact of water recreation activities in Palermo, Italy ( 19 ). The research aimed to identify the pollution sources of five Italian marines using a P-Mapping approach and to determine the recreational nautical sector’s environmental footprint. It concluded that the main sources of pollution were maintenance waste, direct CO2 emissions, and the potential dispersion of pollutants into the water.
Carreño and Lloret analyzed the ecological impacts of recreational navigation in the Mediterranean coastal marine environment ( 20 ). The impacts included noise pollution, emissions, hydrocarbon release, oil and fuel leaks, degradation of anti-incrusting paints, and others. They concluded that the need for raising awareness of the potential impacts of recreational navigation in coastal environments was urgent.
This outline of state-of-the-art studies identified two main gaps. First, little is known about the activity profiles of smaller boats engaged in tourism, leisure, and sports activities. Second, there is a lack of understanding about their emissions. The present paper aims to fill these gaps by characterizing the activity and emissions of these types of boats.
Methodology
First, a complete inventory of the boats associated with tourism, leisure, and sports activities in the inland and coastal areas of central Portugal was undertaken. The data were collected through contact with port administrations, Aveiro Captaincy, and entities like touristic operators and nautical clubs. The locations to be studied were Aveiro Lagoon (Zone 1), the Mondego Estuary (Zone 2), and the region of Peniche and the Berlengas Nature Reserve (Zone 3). These zones are marked in Figure 1.
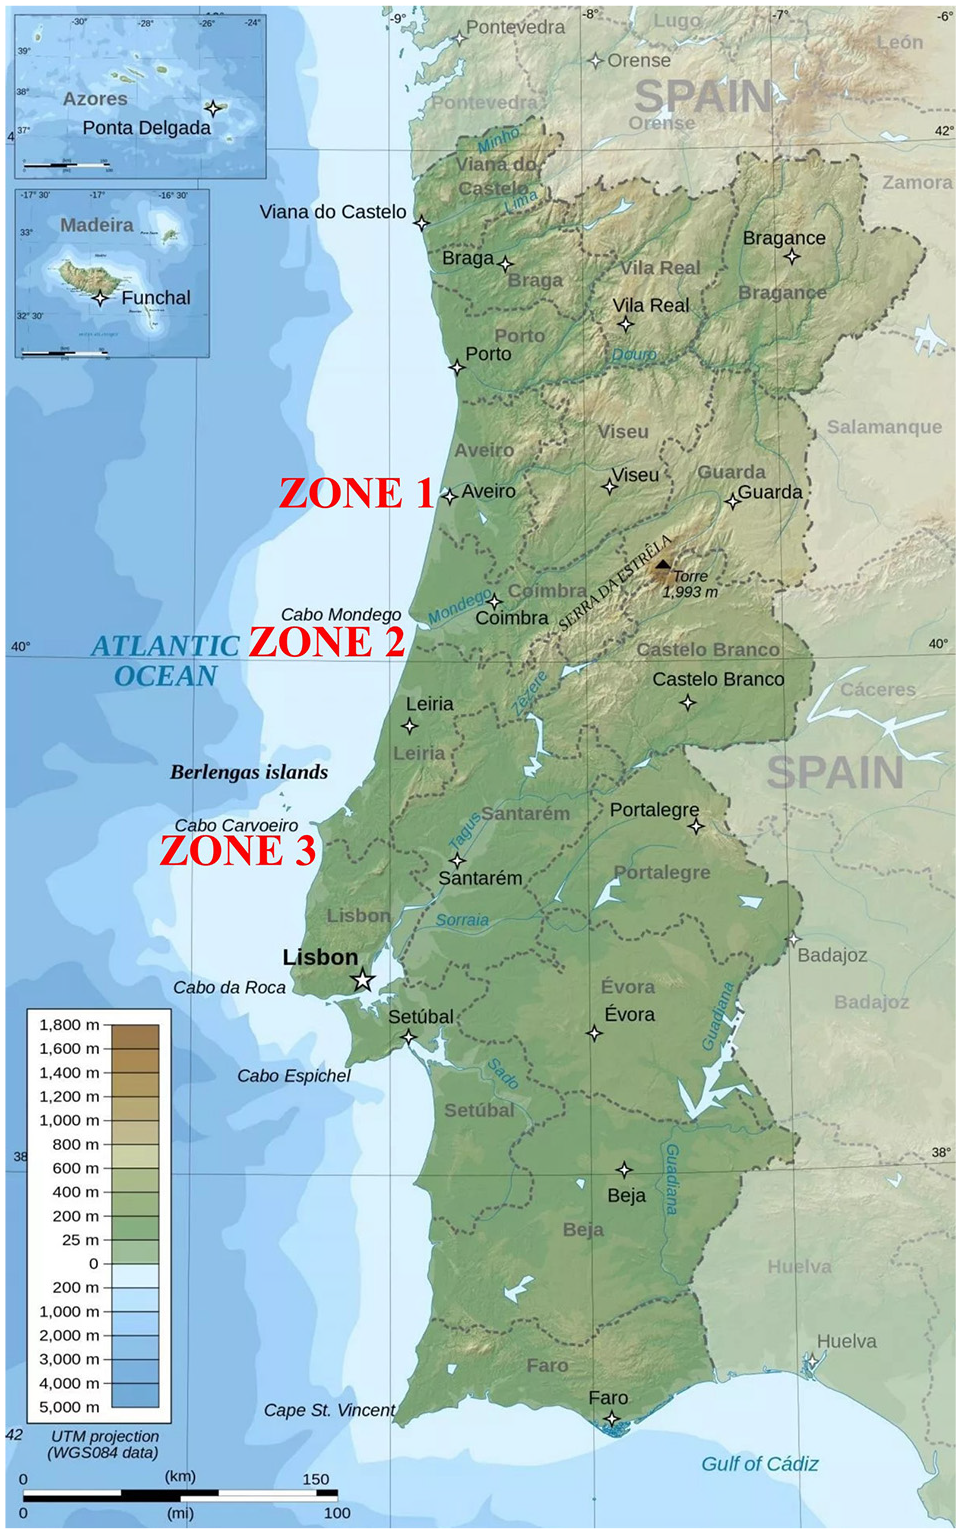
Zones studied.
For emissions calculation, the chosen method was EMEP/EEA ( 5 ) since this offers more detailed reference values for fuel consumption and for leisure boat activity. In addition, it allows for the calculation of emissions from boats at three levels of detail (tiers)—potentially useful for cases in which boats characteristics are unknown. In addition to CO2, NH3 (ammonia), NOx (nitrogen oxide), and PM10 (particulate matter with a diameter of 10 μm or less) emissions were calculated.
Use of the different tiers depends on the information collected about the boats: the general process is described through the scheme in Figure 2. Tiers 2 and 3 were used. Tier 1 was not used as the information collected could be organized by engine type. The Tier 1 method uses emission factors for each pollutant and for each type of fuel used, thus facilitating a more general analysis by only accounting for consumption and the type of fuel used.
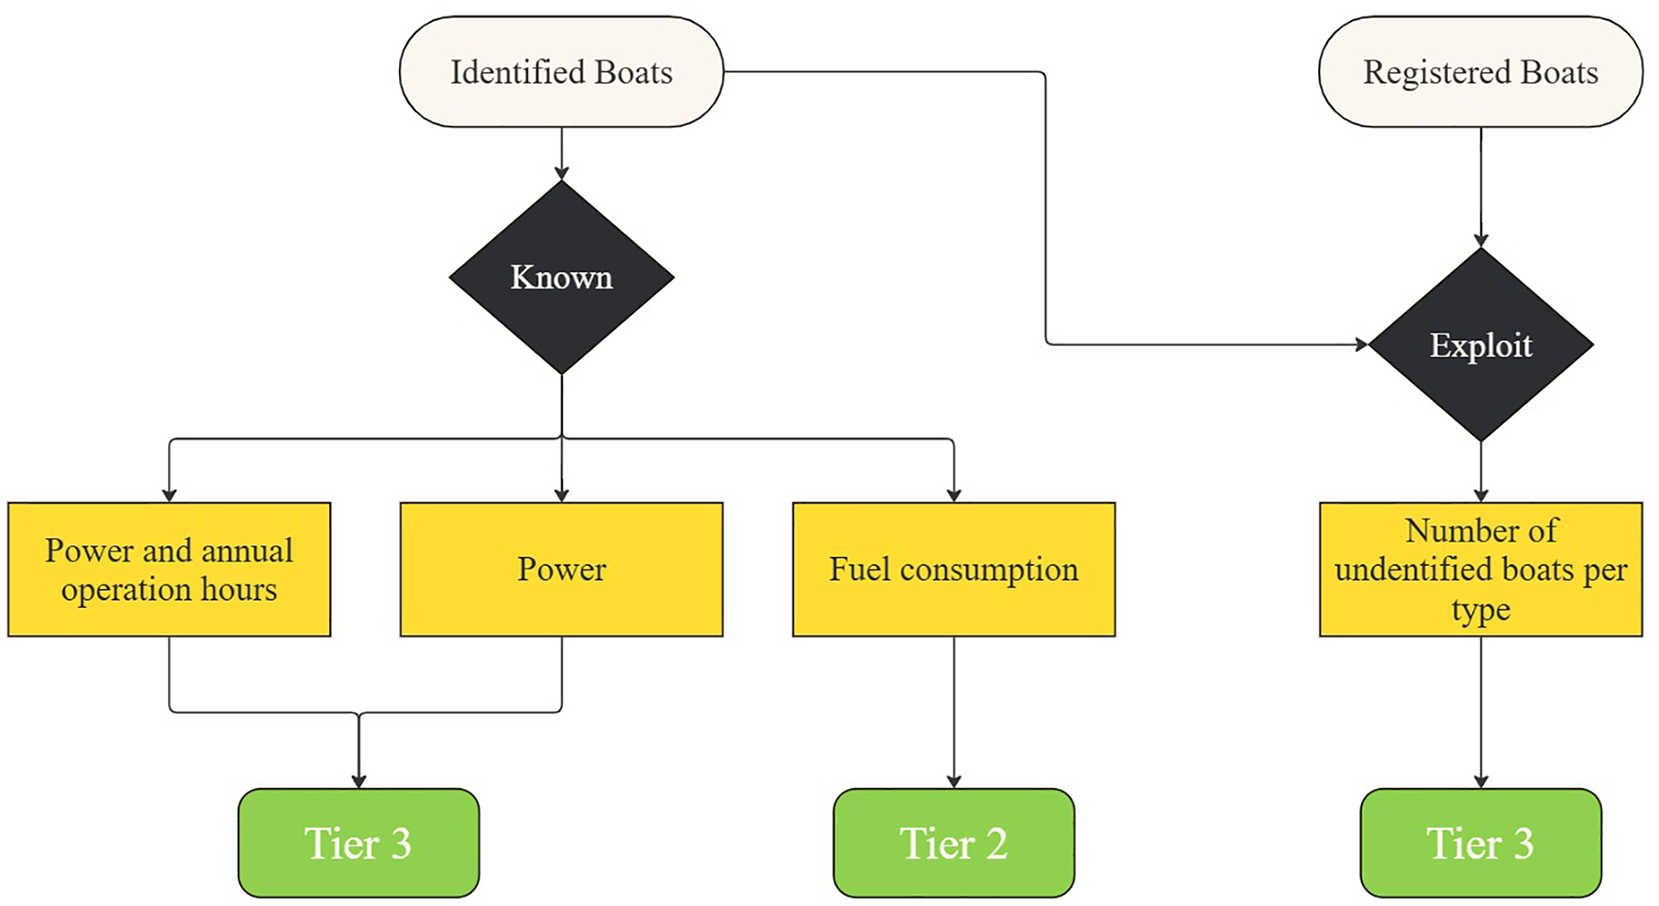
Scheme of the general process for chosen tiers.
Tier 2 uses fuel consumption per fuel type and motor type. This level is defined by Equation 1,
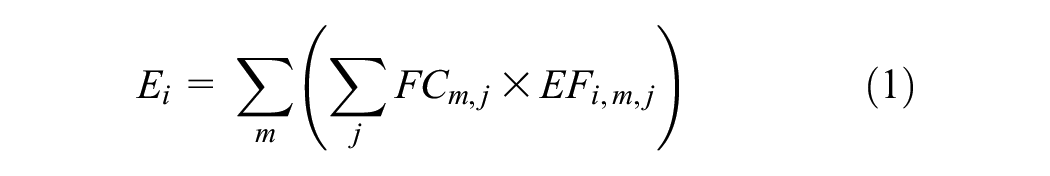
where
E is annual emissions (tonnes);
i is pollutant;
j is engine type;
m is fuel;
In Tier 2, the emissions factors represent the average conditions of the entire journey, calculated as the sum of emissions factors at various operation points. The emissions factors for NOx, NH3, and PM10 were defined in the EMEP guide, and for CO2 we used emissions factors as defined by the UK government ( 22 ) (i.e., 3,154.75 kg CO2/tdiesel for diesel; and 3,154.08 kg CO2/tgasoline for gasoline).
The Tier 3 method relies on individual vessel movement data and technical information. It is recommended when detailed data are available, however, implementation of this method can be slow owing to its high level of detail. This tier can be applied to small boats using Equation 2,
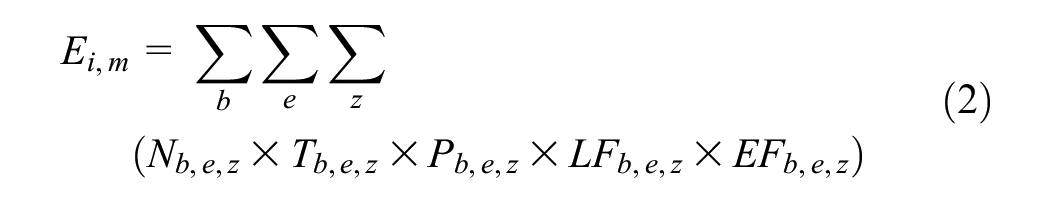
where
N is number of vessels,
T is average duration of operation of each vessel per year (h/vessel),
P is nominal engine power (kW),
LF is engine load factor (%),
EF is emissions factor (g/kWh),
b is vessel type,
e is engine type, and
z is technology layer (Directive 2003/44/EC).
As far as emissions factors are concerned, the EMEP/EEA guide contains emissions factors for NOx, NH3, and PM10 but does not contain reference values for CO2. These CO2 emissions factors can be obtained by considering full fuel combustion and the carbon content of the fuel as defined through Equation 3,
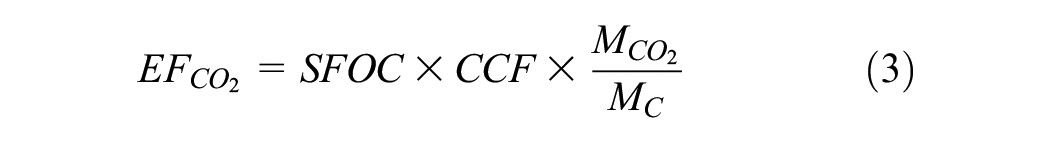
where
CCF is carbon content factor of the fuel (gC/gfuel);
MC is molar mass of carbon (g/mol).
Specific fuel consumption values available for collection from vessels may be set in Liters per hour and not in grams per kilowatt hour. Conversion uses Equation 4,

where
Q is specific fuel consumption (L/h),
D is fuel density (kg/m3), and
P is nominal engine power (kW).
A density of 900 kg/m3 and a CCF of 0.8744 were used for diesel, whereas a density of 780 kg/m3 and a CCF of 0.87 were used for gasoline ( 23 ).
Although some smaller boats sometimes use fuel from road supply stations that may contain biofuels, for the base scenario the use of fossil fuels without biofuel integration was determined. This was because these exceptions were only verified in smaller boats with very low fuel consumption and therefore irrelevant in the general context of vessels. Such occurrences are also extremely difficult to quantify precisely. The alternative scenarios would use a mix of diesel and biodiesel (B15) instead of diesel, or a mix of gasoline and ethanol (E10). Use of E10 may not apply to vessels before 1992 with fiberglass tanks as they could decompose as a result of the ethanol ( 24 ). Since it was not possible to collect information on tanks from all the boats, and the percentage of boats this might apply to before 1992 was small, the best reduction scenario was assumed, in which all boats were compatible with E10. The emissions were evaluated using the CO2 emissions from the base scenario and the reduction factors for biofuel emissions in (see Annex V of Directive (EU) 2018/2001 of the European Parliament and of the Council of 11 December 2018 on the promotion of the use of energy from renewable sources [ 25 ], also known as RED II). The emissions were calculated using Equation 5,

where
X is percentage of biofuel incorporation, and
The alternative scenario with B15 was evaluated, with biodiesel obtained from the used edible oil, resulting in a reduction factor of 0.88. The alternative scenario with E10 was evaluated, with bioethanol obtained from sugar cane, resulting in a reduction factor of 0.70. The reduction in CO2 emissions was calculated using a method based on two factors, resulting in a percentage reduction of 13.2% for B15 and 7% for E10. Note that reductions for B15 may be greater, as tests developed by a Portuguese marine B15 producer report reductions of up to 18% ( 12 ).
Alternative scenarios with electric boats were also analyzed. For these, only their indirect CO2 emissions related to energy production were calculated. The emissions factor used was 188.3 gCO2/kWh, which corresponded to the CO2 emissions generated during the energy production of the electricity provider ( 26 ) considering Portugal’s mix of energy sources.
Results and Discussion
Boat Inventory
This characterization provides information on existing and registered recreational boats in the different zones. We also discuss the entities contacted and the information collected. There were some restrictions related to data protection policies: some of the entities shared information only about their vessels, whereas others provided general information about all the vessels affiliated with them. The collected information is presented in aggregate to anonymize the organizations’ information.
Aveiro Lagoon: Zone 1
Some 2,815 gasoline- and 137 diesel-powered recreational boats were registered in Aveiro. It was also possible to count 687 fishing boats (612 on gasoline and 75 on diesel) and 136 auxiliary boats (108 on gasoline and 28 on diesel). According to the registration laws and Decree Law No. 93/2018 ( 27 ) it was possible to determine that around 83% of all the recreational boats could only navigate in inland waters or less than 6 mi from the coast.
Through contact with various organizations, it was possible to verify that 24 moliceiros (i.e., typical Aveiro Lagoon boats) navigated the urban channels of the Ria de Aveiro: gasoline boats with 4-stroke off-board engines, with a capacity for 20 passengers. A change to electric motors by 2025 is planned for these vessels. Another change that took place this year, was the replacement of an old diesel ferry with a new electric one; however, it was not possible to collect information about this vessel. A larger diesel motorboat that operates as a hotel was also identified and the information about the annual fuel consumption was gathered.
To collect information about the private boats, 13 clubs/marinas focused on sailing, sport fishing, and recreational boating were contacted. These entities offer different services to their affiliates like sailing schools, licenses, parking, refueling stations, and maintenance shops.
Despite the aforementioned restrictions on obtaining information, it was possible to ascertain the existence of 75 sailboats and 912 speedboats. It was possible to gather information on the average fuel consumption of different groups of speedboat, all of which have similar seasonal activity patterns, since they are much more active during the summer months than in the rest of the year. Of the 914 speedboats identified, 24 were equipped with diesel engines. Of the diesel speedboats, two had a 125-kW engine, 12 had two inboard 185-kW engines, four had a 67-kW engine, one had a 63-kW engine, and it was not possible to obtain information on the power of the remaining five vessels. Of the 890 speedboats identified with gasoline engines, it was possible to collect information on the fuel consumption and power of 580 speedboats and on the power of a further 162 speedboats. Of these speedboats, the vast majority were equipped with engines of up to 110 kW, and of these, the majority had power outputs of between 50 and 67 kW. Some exceptions with higher power ratings were also identified, such as five speedboats with a 185-kW gasoline engine.
With regard to the 75 sailboats, 30 were equipped with auxiliary diesel engines. Of these, 28 were equipped with engines with an average power of 22 kW, one had an 8-kW engine, but it was not possible to collect information on the power of the remaining one. We also identified 45 sailboats with auxiliary gasoline engines, 11 of which had power between 4 and 6 kW. For some of these sailboats, it was also possible to collect information on their average annual or monthly fuel consumption. Of the remaining 34 gasoline sailboats, it was not possible to collect any information on their power, but for some it was possible to collect information on their gasoline consumption.
In general, it was possible to see that almost all the boats in Aveiro belonged to private individuals and were not associated with tour operators. Of these boats, only half sailed regularly, whereas the rest either did not sail at all or very sporadically (i.e., once or twice a year). The half that did sail generally had the same activity profile, which consisted of sailing once a weekend during the summer.
In Aveiro it was estimated that of the unidentified boats, 2,147 were gasoline-powered speedboats, 34 diesel-powered speedboats, 50 gasoline-powered sailboats, and 54 diesel-powered sailboats.
To calculate their emissions, were used reference activity profiles and emissions factors from EMEP’s guide. For gasoline-powered speedboats, a standard activity profile was found, with half of them consuming 12 L per week during the summer. The EMEP guide reference values revealed emissions from these speedboats were 3.2 to 3.6 times higher than the actual activity patterns, indicating the need to use the activity profile defined before.
Mondego Estuary: Zone 2
In Mondego Estuary, 1,302 recreational boats were registered (1,260 gasoline and 42 diesel), 101 fishing boats (63 gasoline and 38 diesel), and 12 auxiliary boats (5 gasoline and 7 diesel). From the register, it was also possible to determine that approximately 66% of all recreational boats could only sail in inland waters or less than 6 mi from the coast.
The Recreational Marina of Figueira da Foz, located in the estuary, had 51 sailboats, 100 speedboats, and an electric catamaran belonging to the Municipality of Figueira da Foz. However, only 10% of the vessels in the marina regularly sailed during the summer.
The electric catamaran operates a daily transportation service between the riverbanks. The old diesel catamaran was replaced by the electric one in early 2023, however, it proved inadequate owing to increased demand and the need for frequent stops. Given this situation, the Municipal Chamber of Figueira da Foz added a diesel-powered speedboat to the service. Information on the diesel and electricity consumption of both vessels was collected between September 2023 and April 2024.
Three nautical clubs were found in the vicinity of the marina, using the marina’s water parking, refueling station, and winch services. These clubs’ activities include sailing regattas, sailing schools, boat training, and boat trips.
A total of 12 gasoline sailboats were identified in Zone 2, seven of which were equipped with auxiliary engines of approximately 45 kW and the other five with engines between 7 and 4 kW. Ten sailboats with auxiliary diesel engines were also recorded, eight of which were 45-kW engines, one was 15 kW, and the last was 7 kW. During contact with the different entities, it was also possible to gather information on fuel consumption for the various sailboats.
In addition to the sailboats, 62 speedboats were identified. Of these, six were diesel-powered, one equipped with a 165-kW engine and the other five with engines between 35 and 60 kW. Fifty-six gasoline-powered speedboats were also recorded, 50 of which had engines between 30 and 65 kW and one with a 15-kW engine. The remaining five gasoline-powered speedboats were identified as semirigid speedboats equipped with engines between 5 and 50 kW. It was also possible to collect information on the average annual or monthly fuel consumption for all these boats.
In Zone 2, from the unidentified boats, 982 were gasoline-powered speedboats, 10 diesel-powered speedboats, 210 gasoline-powered sailboats, and 16 diesel-powered sailboats. To calculate the emissions of these boats, it was assumed that only 10% sailed regularly, according to the profile established during contact with the Recreational Marina of Figueira da Foz. For these, the activity profiles listed in the EMEP guide were used.
Peniche: Zone 3
In Peniche, most boats are dedicated to commercial fishing and tourist activities, such as the crossings between Peniche and the Berlengas Nature Reserve. Tour operators’ vessels, which are larger and have higher levels of activity than private leisure boats, were analyzed as representative of the area. No nautical associations or clubs for private leisure boats were found in Peniche.
We contacted six tourist operators that operate the Peniche route to the Berlengas Nature Reserve and Berlengas tours, and three operators dedicated to visiting the reserve and swimming activities. Two of these operators also have sports fishing boats.
Through various contacts with the different tour operators, it was possible to gather information on the activity profiles and consumption of one catamaran with two diesel engines of 670 kW, one speedboat with two diesel outboard engines of 235 kW, and two speedboats with diesel inboard engines, one equipped with two engines of 235 kW and the other with one 270-kW engine.
After several attempts to get in touch with the other tour operators, it was not possible to obtain information on their activity profiles or consumption. However, through the websites of these operators, it was possible to verify that in Zone 3 at least two diesel catamarans operate, three speedboats with diesel outboard engines, two speedboats with diesel inboard engines, and five speedboats with gasoline outboard engines. It was also possible to gather information on the activity profiles of some operators through their operating schedules. In general, tour operators make two round trips per day between Peniche and the Berlengas during the high season and one daily round trip during the low season, with most boats not sailing from November to April. It should also be noted that, on average, the catamarans had a capacity of 110 passengers, the speedboats with diesel outboard engines had a capacity of 18 passengers, the speedboats with diesel inboard engines had an average capacity of 18 passengers, with one larger one having a capacity of 185 passengers, and of the speedboats with gasoline outboard engines, three had a capacity of 9 passengers and the other two had a capacity of 17 passengers. It was not possible to collect precise data on the activity profiles of the gasoline speedboats, but owing to differences in passenger capacity and round trips to the Berlengas, it was assumed that these speedboats made two trips for every round trip made by the other boats.
Emissions Inventory
Taking all the above into account, the emissions for the baseline scenario were calculated and are summarized in Table 1. Tier 3 was used for 36% and Tier 2 for 64% of the boats. In Zone 1, Tier 2 was used for 91% and Tier 3 for 9% of the boats; in Zone 2, Tier 2 was used for 6% and Tier 3 for 94% of the boats; and in Zone 3, Tier 3 was used for all the boats.
Annual Emissions of NOx, NH3, PM10, and CO2 for the Baseline Scenario
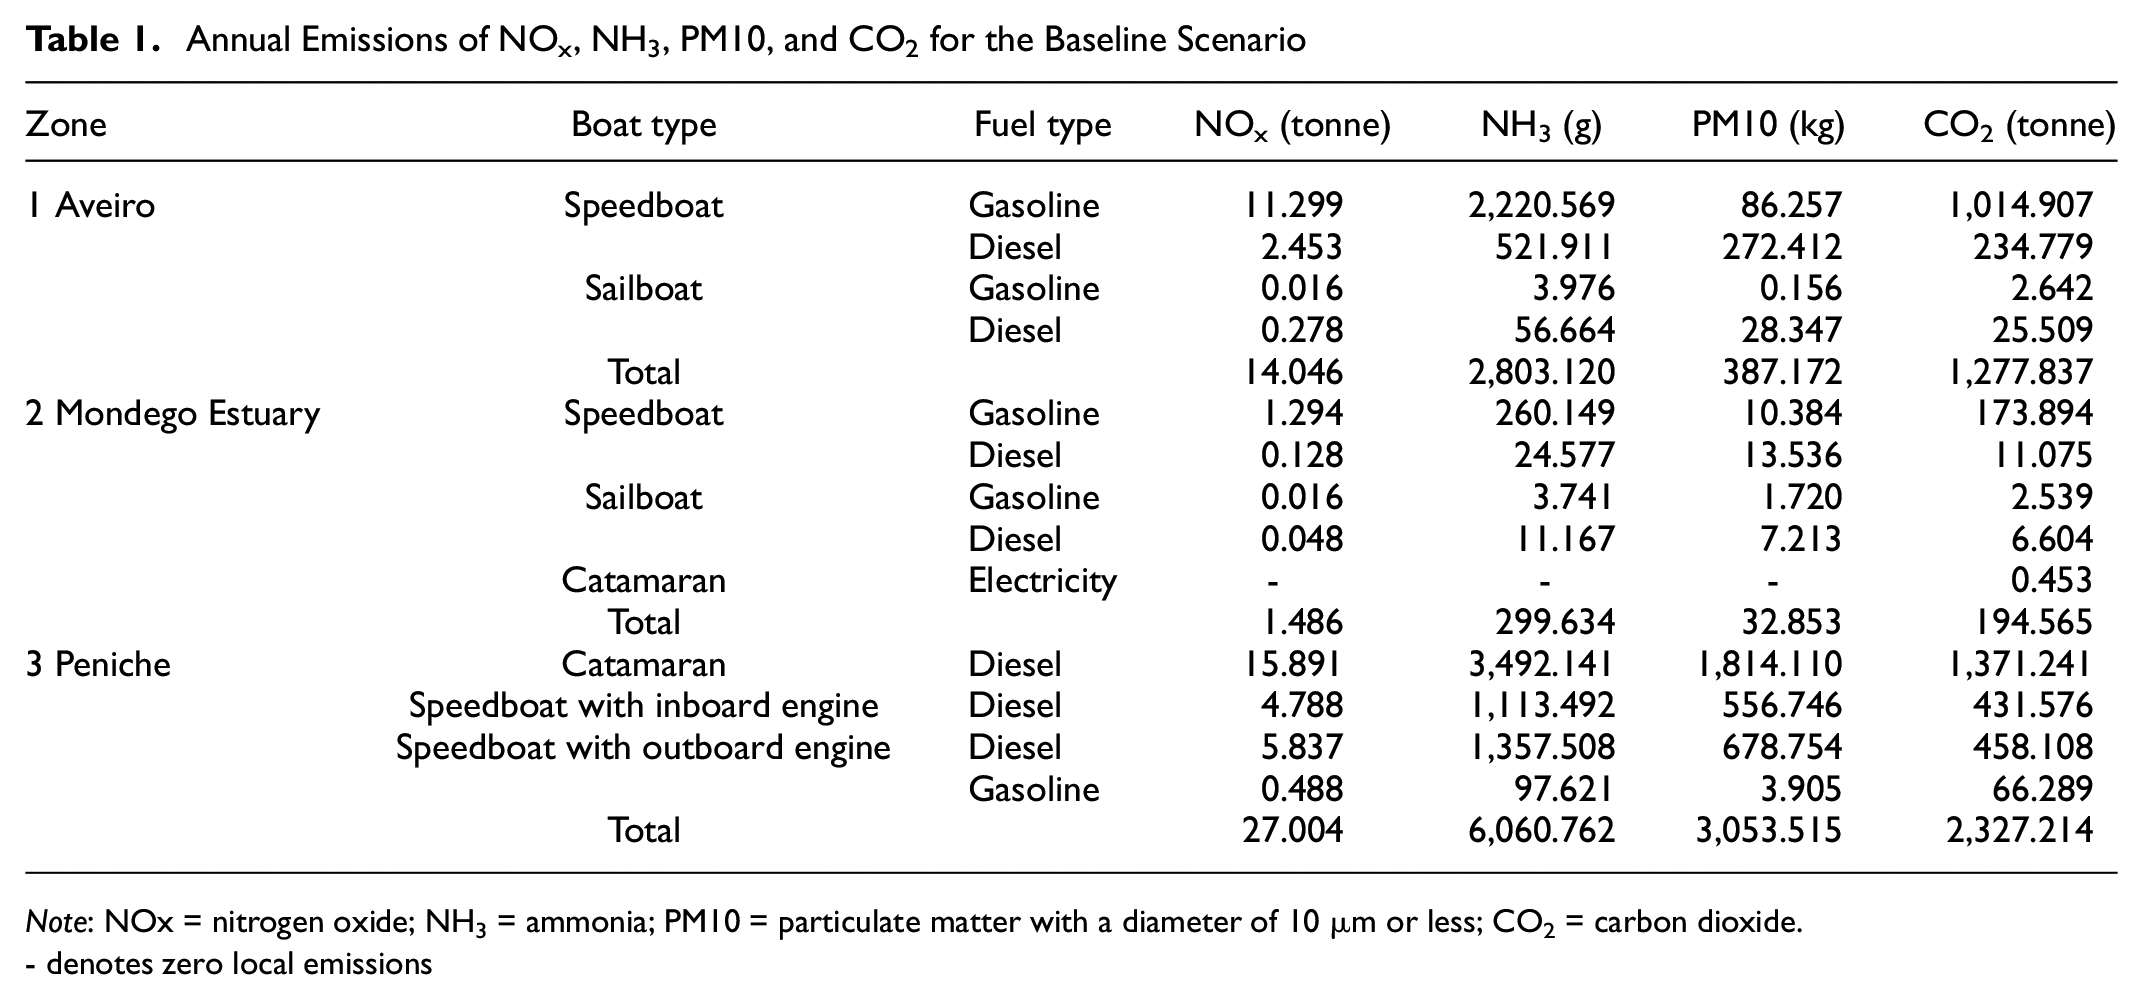
Note: NOx = nitrogen oxide; NH3 = ammonia; PM10 = particulate matter with a diameter of 10 μm or less; CO2 = carbon dioxide.- denotes zero local emissions
To facilitate comparison of total emissions by zone, the maps in Figure 3 were created for the different pollutants.
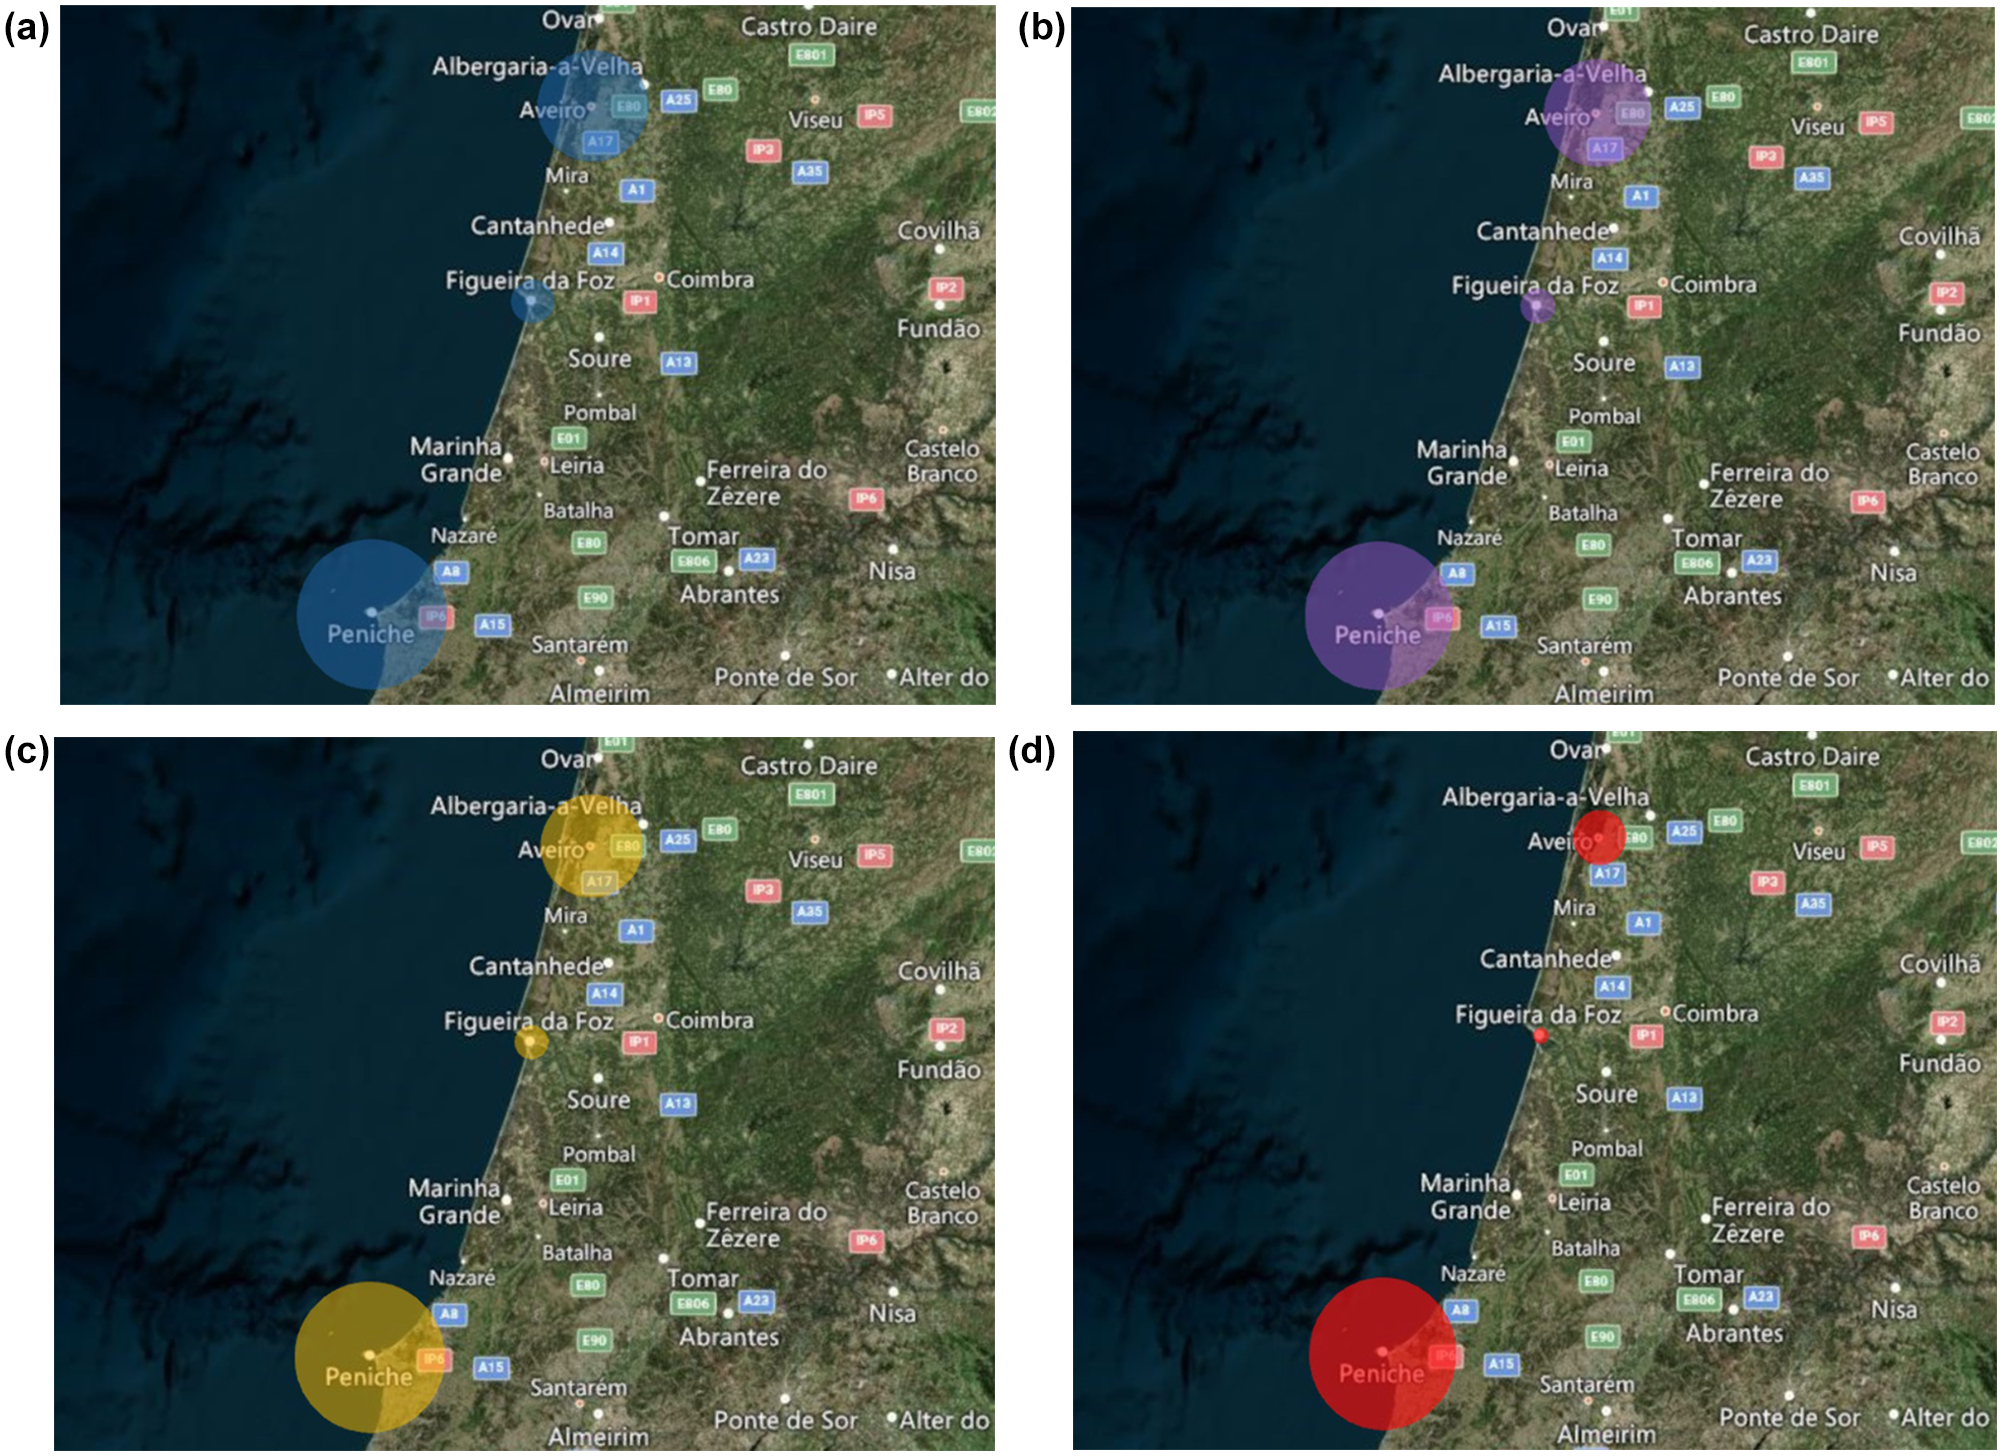
Total emissions maps: (a) t CO2 (b) t NOx (c) g NH3 and (d) kg PM10.
Using Aveiro as reference, Peniche had NOx emissions that were 1.9 times higher, NH3 emissions that were 2.2 times higher, PM10 emissions that were 7.9 times higher, and CO2 emissions that were 1.8 times higher. On the other hand, for the Mondego Estuary, NOx emissions were 9.4 times lower, NH3 emissions were 9.3 times lower, PM10 emissions were 11.8 times lower, and CO2 emissions were 6.5 times lower.
The analysis of recreational boating emissions in Portugal revealed that Aveiro, with its largest number of registered leisure boats, was the second-largest emitter, whereas the Mondego Estuary, with 1,302 registered boats, produced the least emissions. Peniche, despite having the lowest number of boats, was the location with the highest level of emissions. The differences in emissions across zones were partially attributed to the type of fuel used. For instance, this contrast was more noticeable in PM10 emissions, as diesel engines emit more particles than gasoline engines. However, the difference in emissions was mainly a result of the activity profiles of each location. Aveiro has more recreational boats but with very low activity profiles. In contrast, Peniche has the lowest number of boats, but they operate more hours, peaking in the summer. For comparison, Aveiro speedboats consumed an average of 2,800 L of diesel per year, whereas one of the biggest boats in Peniche consumed the same amount in just under 8 h (i.e., fewer than 4 days during high season). The Mondego Estuary, with only 10% of boats operating, generated significantly lower emissions than the other locations.
Peniche and Aveiro had the highest emissions because of the tourist boats, which have more annual activity than private boats. An analysis of emissions per seat. kilometer per type of tourist boat was conducted, revealing that the typical Aveiro boat was the least emitting type. This is most likely the result of sailing in calm inland waters and carrying more passengers per kilowatt of installed power. These boats had 0.9 seats/kW, whereas Peniche’s boats had between 0.13 and 0.3 seats/kW.
Alternative Scenarios
As mentioned, emissions for the alternative scenarios were evaluated using B15 for diesel boats and E10 for gasoline boats. Other scenarios involved the shift from gasoline to electric engines on Aveiro’s typical boats in 2025 and introduction of the electric catamaran in the Mondego Estuary instead of the diesel speedboat.
The results achieved for emissions reductions in both alternative scenarios using B15 and E10 are summarized in Table 2.
Emissions Calculated for the B15 and E10 Alternative Scenarios
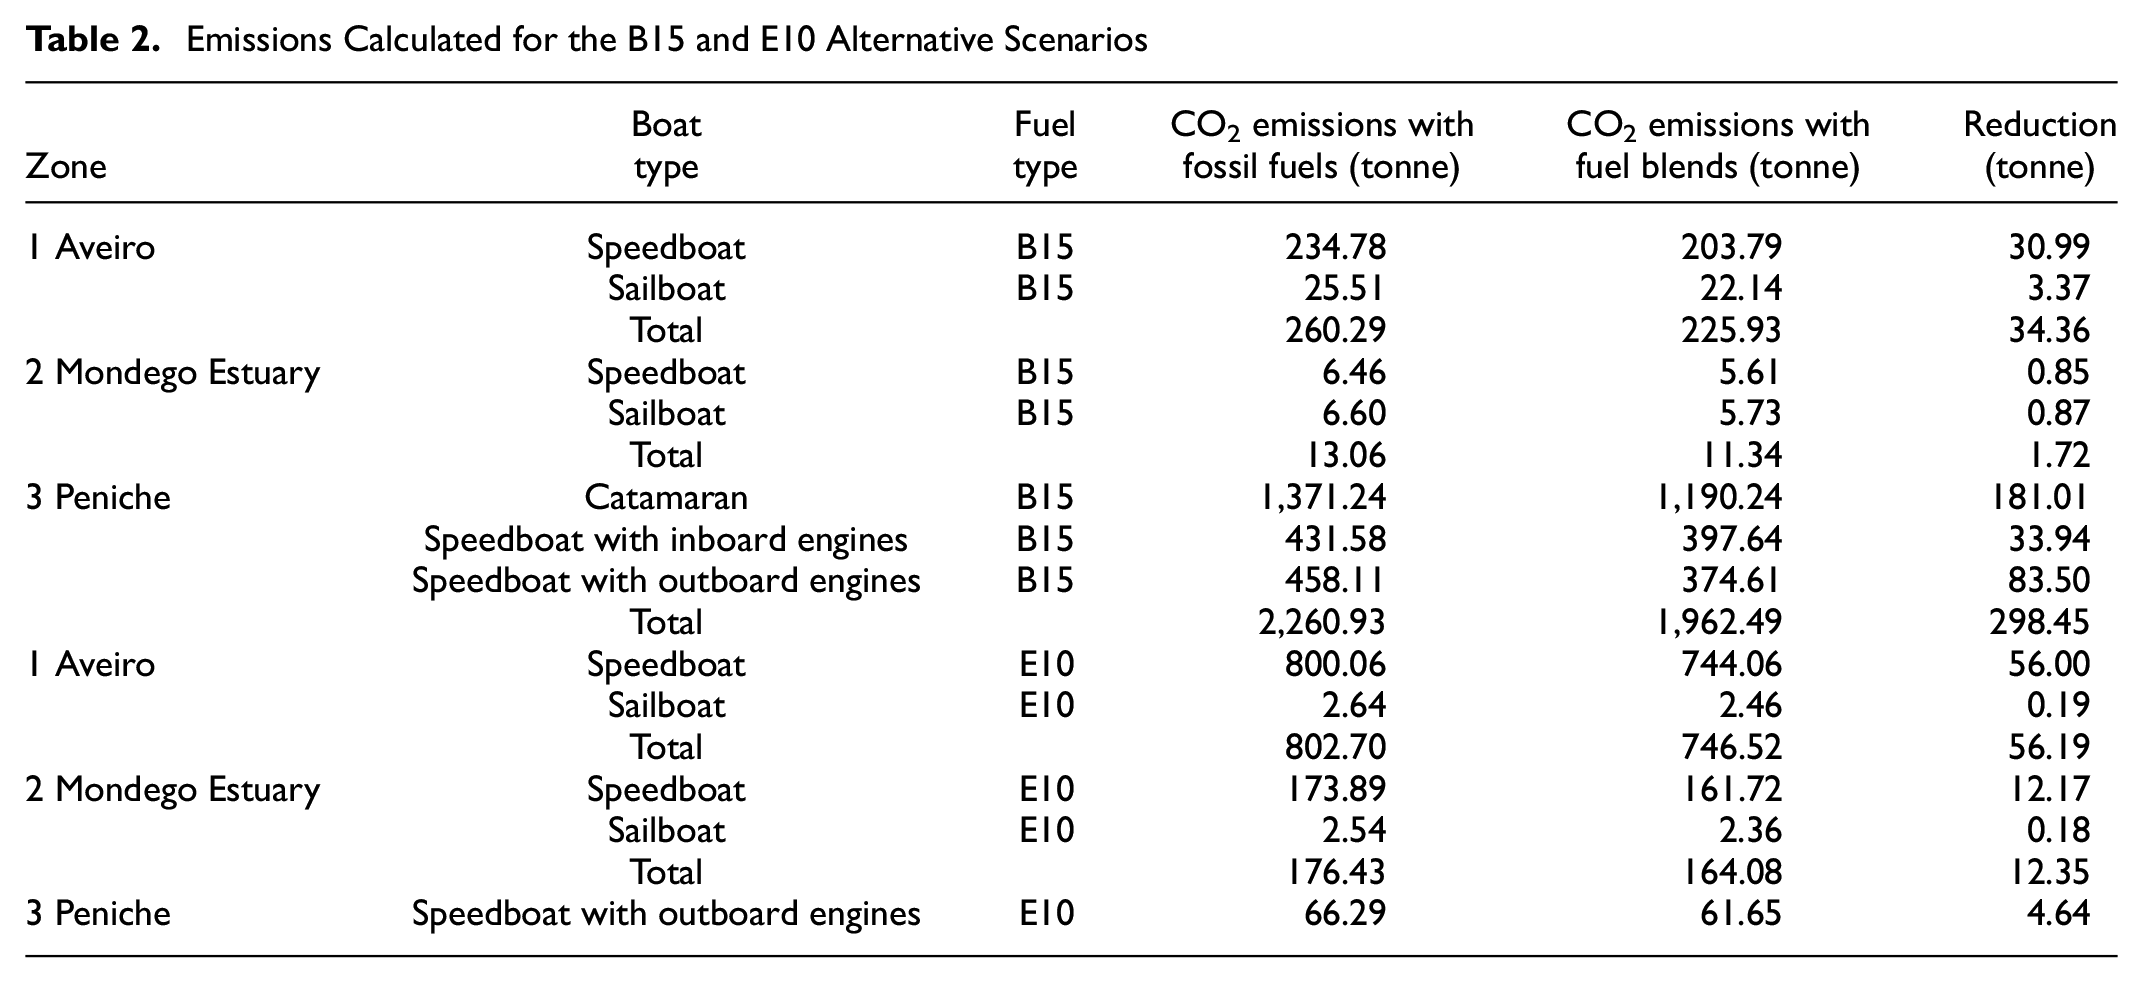
Table 2 shows that Zone 3 experienced the largest absolute reduction in CO2 emissions because of using B15. Zone 1 was in second place, and Zone 2 placed last, as expected given that the reduction in emissions was proportional to the total emissions.
Since Aveiro had more gasoline boats sailing than the other locations, this was the zone with the largest absolute reduction in CO2 emissions owing to using E10 instead of gasoline. The Mondego Estuary had the second-largest absolute reduction in emissions (see Table 2). Considering that only five gasoline-powered boats were examined in Zone 3, Peniche experienced the smallest absolute reduction in emissions.
The use of electric solutions was evaluated in two cases in Zones 1 and 2. The first case involved replacing the gasoline engines from Aveiro’s boats with electric ones. These electric motors had the same power and usage profiles as the gasoline engines, allowing for a direct assessment of the impact on CO2 emissions. Currently, 24 of these typical boats emit 214.845 t CO2 annually. If they operated with electric engines, their emissions would reduce to 111.85 t CO2. This decrease of 102.995 t CO2 represents a reduction of approximately 48% from current annual emissions.
In Zone 2 the replacement of the diesel speedboat with the electric catamaran for the crossing between the banks of the Mondego River was another case study concerning the use of electric boats. The speedboat was in operation for 6 months in 2023 and emitted 4.613 t CO2. However, for the electric catamaran, by carrying over the energy consumption from the first few months of 2024 to the remainder of the year, the electric catamaran would be anticipated to contribute to the indirect release of 3.521 t CO2. This trade represents a reduction of about 24% in CO2 emissions, or 1.093 t CO2.
Conclusions
This study analyzed the impact of inland and coastal navigation on GHG emissions in Portugal. Inland navigation accounted for 0.4% of total emissions in 2019, corresponding to approximately 16,262 KT of CO2e. CO2 emissions from recreational boating activity and fuel consumption were assessed (tank-to-wake). This made it possible to gauge the local impact of these types of boats as well as to evaluate the decarbonization process through the use of biofuels and electric alternatives. This research aims to reduce emissions from inland sailing activities in the Aveiro Lagoon, Mondego Estuary, and Peniche. With the results, we aim to raise awareness about the impact of boats linked to tourist, recreational, and sports activities on NOx, NH3, PM10, and CO2 emissions in the regions under analysis; the potential for reduction of these emissions was also quantified. The findings may encourage the development of pilot projects to reduce emissions from these vessels in other regions.
Zone 3 was found to be the area emitting the most. This was primarily because of the significant tourist activity in the Berlengas Nature Reserve. Despite having the largest number of boats, Zone 1 was the second-least emitting zone owing to its smaller boats. Although more vessels were associated with Zone 2 than with Zone 3, and fewer than in Zone 1, they presented very low activity, so Zone 2 was the least emitting location. The difference in particle emissions between zones was significant because of the diesel engines used in Zone 3, which emit more particles than equivalent gasoline engines. The diesel engines in Zone 3 boats were also more powerful and operated for more hours annually.
The study examined various biofuel scenarios, including the use of B15 and E10, which showed percentage reductions of 13% and 7%, respectively, but total reductions of 334.5 t CO2 and 73.2 t CO2. The use of electric engines in the typical boats of Aveiro and the electric catamaran in the Mondego Estuary also resulted in significant CO2 emissions reductions, resulting in a combined reduction of 104 t CO2. Despite B15 and E10 being used on a larger number of boats, this resulted in a reduction of emissions only four times greater than those involving electric boats owing to the low fuel consumption and activity of most diesel and gasoline boats. Electric alternatives showed large percentage and absolute reductions for a small number of vessels because of their long operating hours.
We used the EMEP/EEA method to calculate emissions from recreational vessels, however, this has some limitations, such as in defining activity profiles. The development of more accurate estimates of key parameters is necessary, such as SFOC and operational profiles using the classification of engine types based on installed power. Unfortunately, in most cases, it was not possible to collect information from the various organizations on whether the engines were 2- or 4-stroke. Also, data protection policies and the inability to identify vessels individually can lead to errors, such as vessels operating in different locations from the ones where they are registered resulting in different numbers of unknown vessels at each location. Following a thorough analysis of all the data for both the reference and the alternative scenarios, it is recommended that future research be undertaken in Peniche to potentially create pilot projects to evaluate the effects of replacing gasoline off-board engines with electric ones.
Another research avenue for Zone 3 might involve the use of B15 in initial pilot projects and, after these, increase the percentage of biodiesel until reaching B100. Based on the pilot projects from Zone 3, it is suggested that stakeholders in Zones 1 and 2 seek to promote the provision of biofuels to associates from the nautical clubs and associations through their refueling stations.
Other relevant future work could include analyzing toxic substances, like volatile organic compounds; emissions validation through diverse methods (such as direct measurements, ship operational data-based estimates, noon report-based estimates, and/or automatic identification system [AIS]-based estimates); use of geographic information system tools to quantify geospatial emissions; analyzing Portugal’s infrastructure and viability for alternative fuels like propane, compressed natural gas, and hydrogen cells for the recreational boats analyzed; and continue to gather more detailed information about these boats through partnerships and pilot projects with the nautical clubs and associations. The aforementioned validation, although essential, was not operationally feasible to implement during the timeframe of the projects that funded this research.
In conclusion, the decarbonization of mobility in inland and coastal waters is essential and an increase in integrated studies and pilot projects on this subject is envisaged, mainly studies and pilot projects involving the use of alternative energy sources such as biofuels, electricity, hybrid solutions, and, ultimately, even the use of hydrogen or synthetic fuels. As seen in this study, for now, the short-term measures to reduce the emissions of inland and coastal navigation include tourist boats using biofuels, converting to electric, and then the same measures being undertaked in private boats.
Footnotes
Acknowledgements
M.C. Coelho thanks the Portuguese Science and Technology Foundation (FCT) for the project (2023.14870.PEX) and UID 00481 Centre for Mechanical Technology and Automation (TEMA). The authors also thank Atlantic-Artic Agora Horizon Europe Project for their support.
Author Contributions
The authors confirm contribution to the paper as follows: study conception and design: D. Guerra, M.M. Cruz, M.C. Coelho; data collection: D. Guerra; analysis and interpretation of results: D. Guerra, M.M. Cruz, M.C. Coelho; draft manuscript preparation: D. Guerra, M.M. Cruz, M.C. Coelho. All authors reviewed the results and approved the final version of the manuscript.
Declaration of Conflicting Interests
The authors declared no potential conflicts of interest with respect to the research, authorship, and/or publication of this article.
Funding
The authors disclosed receipt of the following financial support for the research, authorship, and/or publication of this article: This research was funded by the Portuguese Science and Technology Foundation (Project 2023.14870.PEX); UID 00481 Centre for Mechanical Technology and Automation (TEMA) Funder Foundation for Science and Technology; and Atlantic-Arctic Agora (funding from the EU Horizon Research and Innovation Programme: Grant agreement 101093956).