
Abstract
In recent years, Paris, France, transformed its transport infrastructure, marked by a notable reallocation of space away from cars to active modes of transport. Key initiatives driving this transformation included Plan Vélo I and II, during which the city created over 1,000 km of new bike paths to encourage cycling. For this, substantial road capacity has been removed from the system. This transformation provides a unique opportunity to investigate the impact of the large-scale network reconfiguration on the network-wide traffic flow. Using the Network Fundamental Diagram (NFD) and a resampling methodology for its estimation, we investigate with empirical loop detector data from 2010 and 2023 the impact on the network’s capacity, critical density, and free-flow speed resulting from these policy interventions. We find that in the urban core with the most policy interventions, per lane capacity decreased by over 50%, accompanied by a 60% drop in free-flow speed. Similarly, in the zone with fewer interventions, per-lane capacity declined by 34%, with a 40% reduction in free-flow speed. While these changes seem substantial, the NFDs show that overall congestion levels did not increase, indicating a modal shift to other modes of transport and therefore presumably more sustainable urban mobility.
Keywords
The capital of France, Paris, is frequently said to be a pioneer in the reallocation and reconfiguration of road space to other transport modes. However, it is not only its pioneering role, but also the speed and magnitude of this transformation that attracts interest. Paris plans to completely eliminate local emissions by 2050, making the city emission-free. It also aims to reduce the carbon footprint by 80% compared with 2004 levels ( 1 ).
The transformation of Paris has been driven by several political initiatives introduced since 2015, primarily under the leadership of Mayor Anne Hidalgo (2014–present). Among these initiatives, Plan Vélo I (2015–2020) and Plan Vélo II (2021–2026) have been instrumental in advancing Paris toward becoming a “100% cyclable” city ( 2 ). Between 2015 and 2020, approximately 1,000 km of bike paths were constructed, with plans to add an additional 180 km by 2026 ( 3 , 4 ). The second phase of the plan also proposes removing 72% of car parking spaces ( 5 ). Other notable efforts include the “Paris Breathes” program, which began in 2016 and features temporary street closures on Sundays, and the city’s shift toward becoming a “15-minute city” starting in 2020. This shift includes both conceptual changes, such as converting school playgrounds into parks after hours, and infrastructural updates, like redesigning public squares such as Place de la Bastille to incorporate trees and bike lanes ( 6 ). These initiatives aim to enhance bike accessibility and promote sustainable transport options city-wide, fostering a greener, pedestrian-friendly urban environment that is more conducive to cycling.
As a result of these policy interventions, the bike and car network in Paris has experienced significant transformations. These extensive interventions have affected traffic capacity and car behavior within the network, influencing factors such as speed, route choice, and overall traffic dynamics. Paris’ transformation stands as a compelling case study for cities confronting emission reduction goals in the face of the climate crisis while ensuring mobility for the masses. The substantial shifts in its transport infrastructure provide an invaluable opportunity to empirically study their effects on traffic operations and travel behavior, essentially functioning as a real-world experiment.
This paper presents a comprehensive, large-scale, and long-term empirical assessment of network changes and car traffic flow in Paris. Our data-driven analysis reveals that traffic production has decreased by up to 53%, depending on the specific area of the city examined. Despite this significant reduction in traffic production, congestion levels have remained relatively stable. This suggests that a shift toward more sustainable transport modes, as intended by political initiatives, has indeed occurred.
This study builds on a first analysis exploring how network changes for bicycle and car traffic relate to travel demand ( 7 ). The present analysis differs from that study in the following ways. First, the data has been updated: we now compare the status quo (up to the end of 2023) to that of 2010. This broader timeframe allows us to view the changes in greater perspective and, by including data up to 2023, helps filter out the effects of the COVID-19 pandemic, as conditions largely returned to normal in 2023. Of course, long-term changes, such as the increased prevalence of home-office work, will also have an impact. With a refined methodology, employing a resampling technique for the Network Fundamental Diagram (NFD), we can provide more robust estimations for the NFD despite the inherent variability of real-world data. This approach focuses on two specific zones within the network to investigate differences at a more detailed level. Second, we retrieved official data on the cycle paths in Paris, enabling us to conduct a thorough analysis of the changes in cycling infrastructure. Lastly, we developed a sophisticated methodology for mapping loop detector data to higher-order roads from OpenStreetMap (OSM), which allows us to more accurately infer lane-kilometers for the NFD. This enhanced mapping better reflects the actual network conditions and thus improves the precision of our traffic flow estimations.
The remainder of this paper is organized as follows. First, we present the literature review, then the methodology to investigate network and capacity changes using the NFD. Next, we present the data from Paris and describe its processing for this analysis. Thereafter we present the results. Ultimately, this paper ends with a discussion of the results as well as the conclusions from the study.
Literature Review
The NFD
The NFD, also frequently denoted as the macroscopic fundamental diagram (MFD), serves as a novel tool for assessing such policy interventions ( 8 ). The NFD is a reproducible curve between urban traffic density and traffic flow within a network. It describes the macroscopic relationship between traffic density (measured in vehicles per lane-kilometer) and traffic flow (vehicles per lane-kilometer per hour), aggregated over an entire urban network. Its shape is specific for every network and depends on network design and the operations of other traffic modes ( 9 ).
In its idealized form, the NFD yields an upper-bound curve—the theoretical upper limit and therefore the capacity of the network under optimal conditions. However, realized NFDs may deviate from this upper bound depending on the presence or absence of specific mobility policies and infrastructure configurations. For example, the diagram in Figure 1 illustrates two curves:
The blue curve describes a realized NFD in a network with priority for cars at signalized intersections, that is, longer green-time shares, as well as higher free-flow speed limits.
The orange curve describes a realized NFD in a network with less priority for cars and therefore more for other modes as reflected in a lower green-time share at signalized intersections and lower free-flow speed limits.
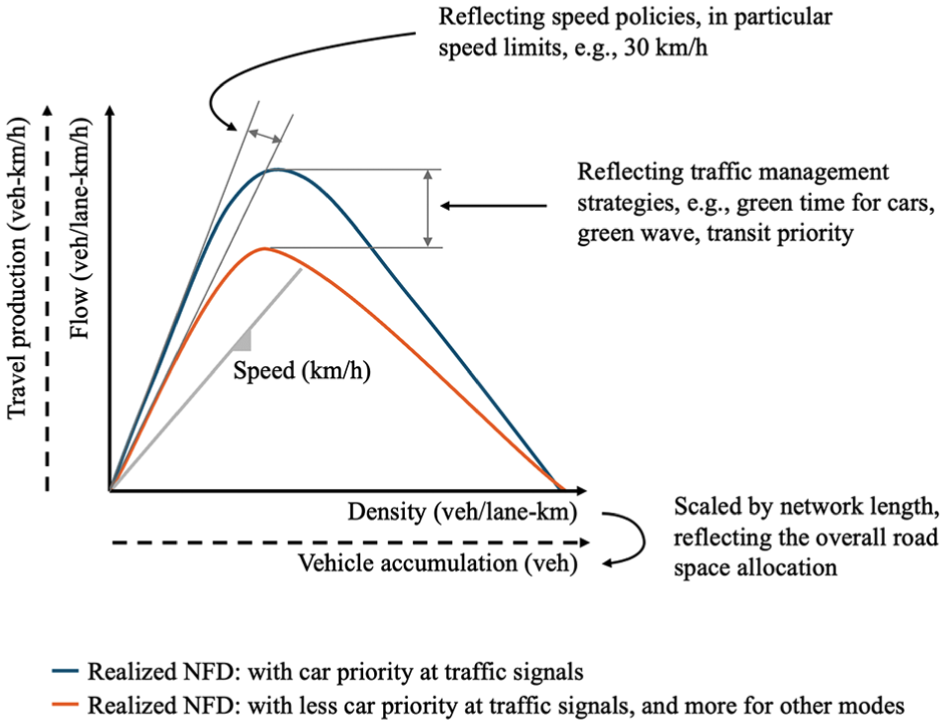
Impact of mobility policies on the network fundamental diagram (NFD).
It is known from empirical data and other case studies that realized NFDs are further affected by traffic operations and other disturbances, creating substantial scatter in the flow-density relationship; for example, Gayah and Daganzo ( 10 ) and Geroliminis and Sun ( 11 ). However, using the so-called “resampling” methodology ( 12 ) allows for approximating the representative upper NFD for the considered network configuration from the available data, that is, either loop detector or floating car data ( 13 ).
Consequently, the NFD can be used to assess network-wide mobility policies as shown in Figure 1 such as widely discussed speed-limit policies, for example, a consistent 30 km/h limit across the city ( 14 , 15 ) and how the space-time at signalized intersections is distributed between cars, public transport, and active modes, where the latter could receive not only more green time, but also priority ( 16 , 17 ). Further, as shown in Figure 1, the NFD can be provided in absolute terms, that is, production NFD, as well as normalized by total network length. In other words, in its absolute representation, the NFD also captures the total provision of road infrastructure, that is, if less road space is provided, the absolute NFD thus will “shrink” in size, while the NFD normalized by total network length might be unaffected. However, note that empirical evidence suggests that total NFD capacity scales sublinear with network size, arguably because of the increasing number of between-vehicular conflicts; for example, lane changes and at signalized intersections.
Applications of the NFD
Given the considerable number of policy interventions and their implications for the network, it is plausible to expect a decrease in NFD capacity. The change in overall network capacity has implications for car travel times: without a change in travel behavior, congestion would worsen substantially, incentivizing car travelers to switch to other modes of transport until a new equilibrium in door-to-door travel times with other modes of transport is reached, following the Downs-Thomson-paradox ( 18 ). Using the NFD as a measure of infrastructure changes, thus, allows us to derive implications for how demand for car trips changes to other modes. Here, recent research has shown how the NFD’s critical point is predictable ( 9 ), leading to the hypothesis that reducing the overall network length reduces the overall capacity when transforming a car city to a bicycle/public transport city by up to 50%. In relation to the critical density, the change depends on the presence and mixing with other modes of transport as well as network design: reducing the car network length while keeping public transport operations at the same level is expected to increase the critical density as bus operations and priority slow car traffic ( 19 , 20 ). In relation to network, reducing the overall route choice or redundancy for car traffic, in other words, forcing car traffic to a limited set of routes, is expected to decrease the critical density. Understanding how the NFD changed allows us to derive implications for suitable transport demand management schemes to improve mobility for everyone in the city ( 21 , 22 ).
Policy-Driven Traffic Changes
The impact of these policy interventions on car traffic at the network level has not been extensively explored in the literature. While other studies have investigated the immediate impacts of bicycle traffic on car traffic in Shanghai ( 23 ), there is a lack of research on long-term effects similar to those observed in Paris over a 14-year period. Existing research primarily focuses on the impact of cycling infrastructure on cycling patterns and bike traffic. One review highlights the role of public policy in promoting biking, emphasizing the need for diverse interventions like infrastructure enhancement and pro-bicycle initiatives ( 24 ). Another study finds that investments in bicycle highways increase cycling commuters and reduce car dependency ( 25 ). In addition, research examines the quality of bicycle infrastructure and its effect on bike lane usage ( 26 ). Further, a comparative analysis between classical and recent studies on urban bicycle infrastructure interventions is also conducted ( 27 ). Finally, studies explore factors contributing to a city’s cyclability and introduce methodologies to evaluate cycling quality based on user preferences ( 28 ).
Cycling Infrastructure Impacts
The transformation in Paris is of interest not only for practitioners, as discussed earlier, but also for researchers exploring the broader implications of cycling infrastructure. For example, while some studies found no clear link between cycling networks and property values in Paris ( 29 ), others highlight how the city exemplifies the potential of cycling in a dense metropolitan environment ( 30 ). This growing interest builds on decades of foundational work. In the Netherlands and Denmark, large-scale cycling infrastructure interventions dating back to the 1970s have been extensively evaluated, offering long-term insights into their effectiveness. These studies showed that comprehensive, network-wide upgrades were generally more impactful than isolated improvements, informing national design guidelines and shaping modern best practices ( 27 ). More recent cases confirm the durability of these findings, even under changing urban conditions and with newer approaches such as shared space concepts. In addition to mobility outcomes, infrastructure investments have been shown to produce measurable health and environmental benefits. A health-focused economic analysis in three Canadian cities found that even moderate increases in cycling mode share led to benefit-cost ratios exceeding 1, driven by reductions in premature deaths and carbon emissions ( 31 ). These results emphasize the broader societal value of active mobility investments, especially when health is considered in policy decisions. Recent interventions in Outer London provide further real-world evidence. A longitudinal study of the “mini-Hollands” program showed that residents in areas with substantial improvements in walking and cycling infrastructure increased their active travel significantly and reported more positive perceptions of their local environment, despite some public concern over spending priorities ( 32 ).
Methodology
We examine the impact of Paris’ urban road space transformation on traffic operations using the NFD as a city-scale assessment method. Table 1 lists all symbols used in this analysis.
List of Symbols Used in This Analysis
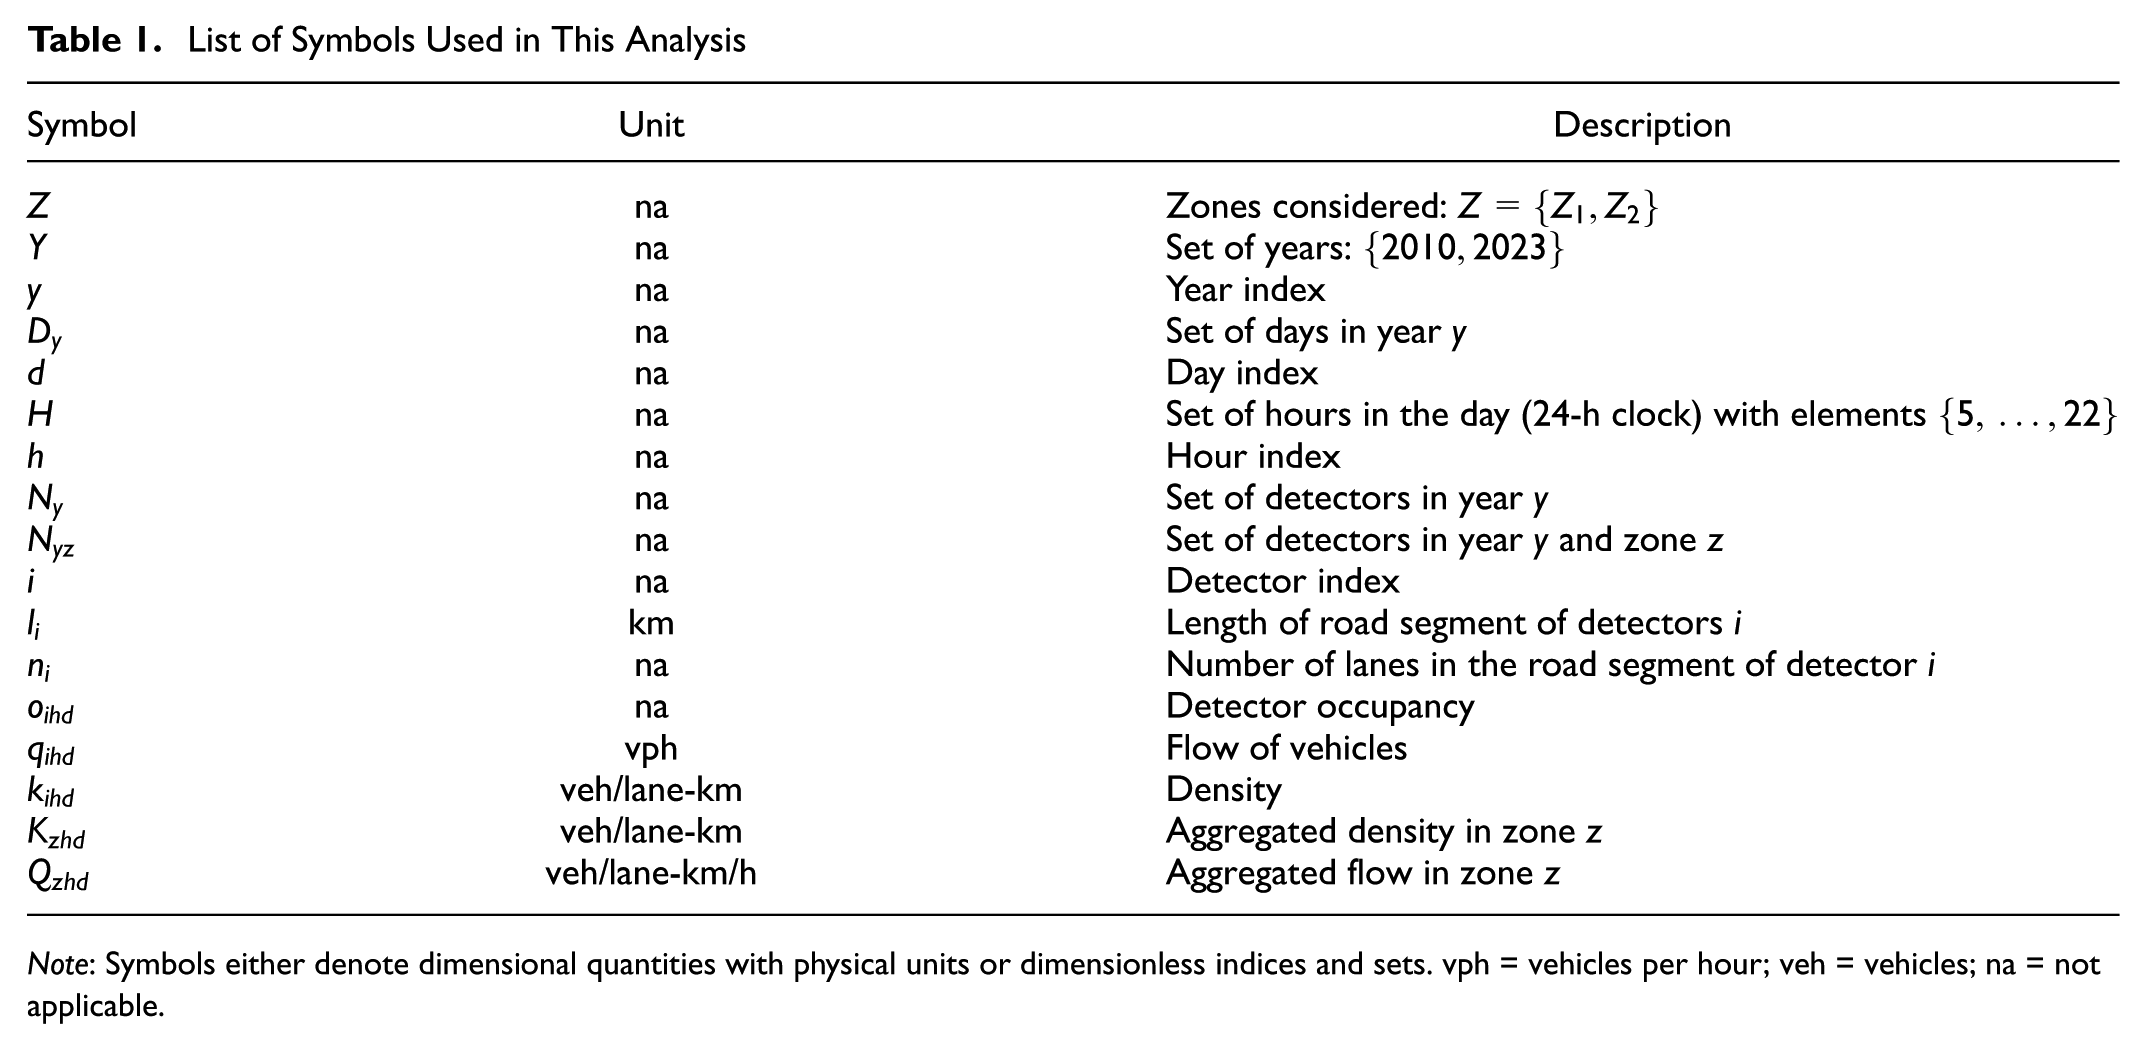
Note: Symbols either denote dimensional quantities with physical units or dimensionless indices and sets. vph = vehicles per hour; veh = vehicles; na = not applicable.
The NFD provides an aggregated, network-wide perspective on the relationship between the number of vehicles in an urban road network and their average speed and collective production of travel ( 8 , 33 ). The shape of this relationship is primarily governed by network topology, traffic signal control strategy, and multimodal traffic operations ( 9 , 20 , 34 , 35 ). The NFD perspective describes the average journey speed of vehicles in the network that in cities contain driving time on links as well as waiting times at signalized intersections. Therefore, compared with its link-based counterpart, the fundamental diagram explicitly considers the flow-interrupting effects at signalized intersections. In other words, the indicated free-flow speed in the NFD is based on free-flow under “optimal” conditions along an urban corridor, that is, “green waves” will increase this speed substantially ( 35 ); a fact that acknowledges that intersections in the network are the capacity-defining elements (Figure 1). A key characteristic of the NFD is the critical point, the traffic state at which travel production is maximized, that is, the network capacity, and beyond which an increase in the number of vehicles decreases travel production, creating congestion in the physical sense. Here, it has been found that a car-centric city has a capacity of around 700 to 800 vehicles per hour (vph) and lane, while a city focusing on public transport and active mobility has a capacity of around 400 vph and lane ( 9 ). Utilizing this network-wide perspective facilitates a comprehensive assessment of the impacts of large-scale transport policies; for example, the allocation of road space between car traffic and public transport ( 36 – 38 ). Another relevant policy that can be investigated with the NFD is the network-wide traffic control strategy. Here, the NFD provides a natural control point at the critical density: traffic flowing into a network controlled by an NFD is restricted from entering the network by increasing the red signal length at the perimeter to avoid congestion in the controlled area ( 39 ).
In our analysis, we adopt the NFD’s representation of density versus vehicle flow per lane-kilometer. We employ a method that utilizes loop detector data and network data from OSM at different time points. We approximate the travel production by multiplying by the overall zonal network length in lane-kilometers. Loop detectors, integrated into street infrastructure, provide counts of passing vehicles over time, yielding flow (
To estimate the NFD, we use the “resampling” method ( 12 ) based on the “loops” method ( 13 ), which provide robust estimations of network capacity and critical density even under real-world traffic conditions. This method proves particularly useful for assessing alterations using empirical data, as it helps mitigate any potential inaccuracies in the empirical dataset. The idea of the resampling approach is to identify the most homogeneous subsamples of all roads by first creating many random subsamples of the network, estimating for each an NFD, and extracting the smooth upper bound from the superposition of all NFDs. When the resampling parameters are chosen appropriately, all points on the upper bound represent the most homogeneous traffic states ( 12 ). The aim of resampling is to approximate the NFD to achieve the best possible performance given the available infrastructure ( 40 ).
Primary roads dominate the NFD network with 50%, compared with 34.5% in the entire network, while secondary and trunk roads also have higher shares in the NFD network. Conversely, tertiary roads and motorways are underrepresented in the NFD network compared with their shares in the entire network.
The resampling methodology is applied to homogeneous urban zones with a well-connected road layout. We select two zones: the first, Zone 1, characterized by a magnitude of policy interventions (Arrondissements 1–4); and the second, Zone 2, where policy interventions occurred at a pace more in line with the rest of the city (Arrondissements 5–7). This method yields robust estimations of network capacity and critical density, even under real-world traffic conditions, thereby addressing potential inaccuracies in empirical data.
Normalization of Measurements
For every year

The measurements are available per link and can result from the aggregation of several detectors on this link, that is, not per lane. Analysis using street images from Paris suggests that each lane of a link is monitored by a detector, that is, if a link has three lanes, one detector is placed on each lane. This results in the following units for
The available Parisian data do inform about the length
For every detector


We convert occupancy, denoted as

Yearly statistics for detector activity from 2010 to 2023 show a steady decline in the number and share of active detectors over time, with a notable increase in detectors going offline, particularly after 2020.
Conversion of Occupancy to Density
As previously mentioned, detectors in Paris measure flow
We corroborate this transformation using public data from TomTom on speeds in Paris. The source reports an average speed of approx. 38 km/h at 5 am and approx. 34 km/h at 6 am, that is, before the onset of the morning peak hour. It is not reported whether these values are time-mean or space-mean speeds, presumably time-mean speeds ( 42 ). Note that the time-mean speed is usually larger than the space-mean speed.
It is anticipated that in 2023, average speeds closely match those reported by TomTom, potentially even slightly surpassing them, given the likelihood of additional speed reductions. On comparing TomTom speeds with calibrated speeds during the same time periods using the NFD’s
Data
This section presents the available data set from Paris. There is an extensive network of loop detectors installed for traffic control and congestion identification purposes. They measure traffic flow (number of vehicles passing the detector) and occupancy (fraction of time the detector is occupied by a vehicle) in 1-h intervals since 2010. We only considered data from “complete days”: those values for which detectors delivered data for flow and occupancy from 5 a.m. to 11 p.m. on a weekday. Unfortunately, the available data are reported at the link level, and the number of lanes is often unspecified. To address this, we approximate the number of lanes using the average lane count associated with each highway type. As a result, per-lane estimates are less precise.
To infer the number of lanes of the street that a detector measures, we geolocated all spatial information of loop detector positions in reference to the whole road network, as described in the section “Data for Lane-Kilometers from OSM.”
Selecting the Areas for Investigation
As the “resampling” methodology works best on homogeneous areas of approximately 5 – 10 km2, we select areas on which we apply the method. To define our zones, we use the boundaries of Paris administrative districts (Arrondissements), and select two compact yet policy-relevant areas (Figure 2).
Zone 1 encompasses Arrondissements 1–4. These central districts, situated north of the Seine, have been focal points of Parisian policy interventions. They were also the first ones in which measures such as car-free Sundays have been implemented. This zone represents a “progressive transformation” of the city.
Zone 2 comprises Arrondissements 5–7. Located south of the Seine, these districts have also undergone significant revitalization endeavors. Zone 2 embodies transformation endeavors more in line with the rest of the city.
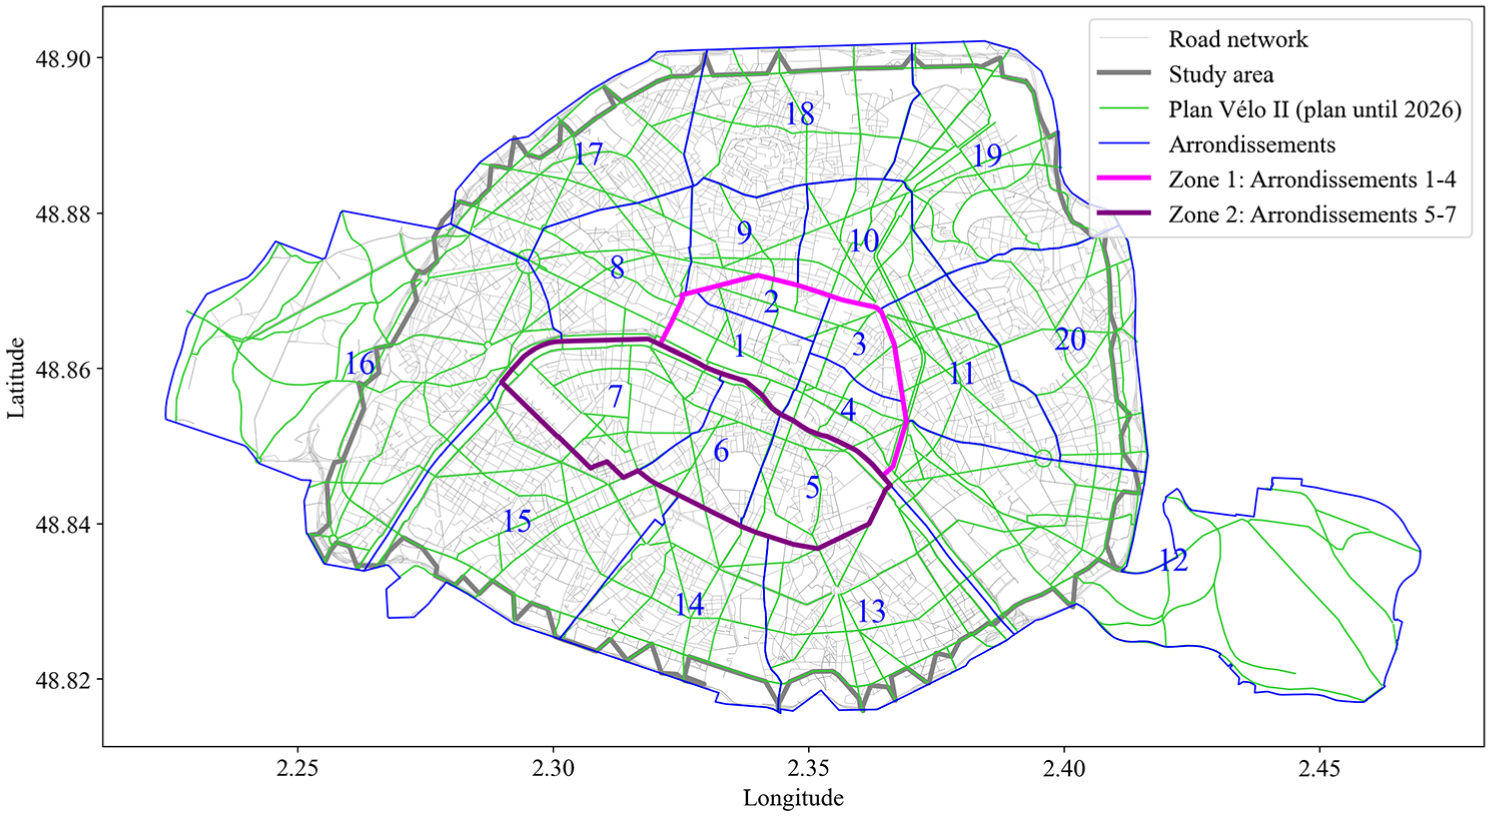
Paris map and its Arrondissements.
By contrasting these two zones, we investigate how different levels of political ambition in urban mobility planning translate into measurable differences in traffic and travel patterns.
Data for Lane-Kilometers from OSM
To estimate the NFD for lane-kilometers, we need to know the number of lanes on the roads where the detectors are installed. In addition, the total network length is required to approximate the production NFD. For this purpose, we use data from OSM for the Parisian road network, specifically from January 1, 2013, and January 1, 2024. Unfortunately, data from earlier periods is not available. Therefore, we utilize lane information from 2013 to infer values for 2010, which sufficiently serves our analytical objectives assuming that no major changes happened in between.
To improve the representativeness of the detector data, we limit our analysis to the higher-order road network (primary, secondary, tertiary, trunk, and motorway), which aligns with typical detector placement and captures the majority of network-wide vehicular flow.
However, a one-to-one mapping does not exist between the higher-order road network and the detector network. Importantly, the loop detector data does report on the actual position of the detectors, but provides a line geometry of the monitored link. This is not only because of inaccuracies in OSM but also because of different representations of the network; for example, the network in OSM consists of smaller road segments. Therefore, our methodology involves a mapping process based on centroid distances and angles. Specifically, for each detector, we identify the most compatible road segment within the OSM network in relation to both centroid proximity and angle alignment.
In Figure 3 we demonstrate the Higher-Order Road Network from OSM and the detector network for the investigated zones 1 and 2. We distinguish the following cases, as indicated by the blue arrows:
Roads where a detector is located on a road that is also recorded in OSM.
Higher-Order Roads in OSM for which there are no detectors.
Detectors where there is no road in OSM higher-order road: this means that for these roads, we cannot know the number of lanes, so we must approximate them.
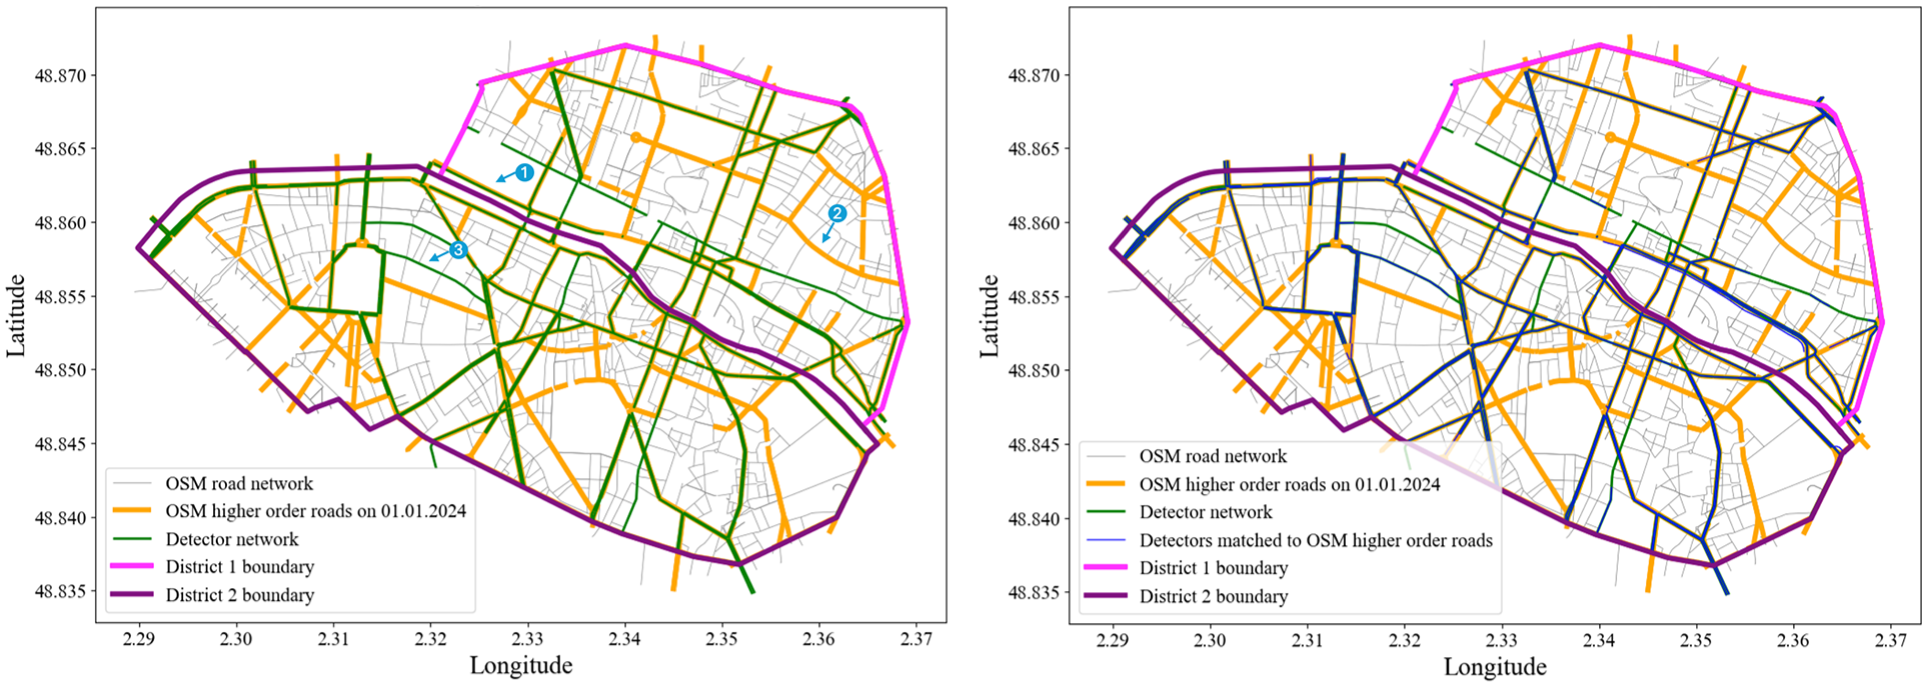
Matching loop detectors to the higher-order road network of OpenStreetMap (OSM).
In the matching process, we proceed as follows: first, we retrieve historical data from OSM spanning from 2013 to 2024; and second, given the dynamic nature of street networks and loop detectors, we repeat the following steps for the years 2013 and 2024.
Narrow down the OSM road network to encompass higher-order streets, such as primary, secondary, tertiary, trunk, or motorway. Realistically, loop detectors are seldom installed on other road types (as of January 1, these were 6,352 out of 16,554 edges).
Map the detectors to corresponding road segments in OSM based on centroid proximity and angle alignment.
Define the required accuracy of matches. Notably, not every detector yields a satisfactory mapping.
Utilise the mapped street segments to determine the associated “highway” classification and lane count. In cases where lane information is unavailable for certain street segments, we approximate it by using the average of the lane counts per highway type for the given year. For instance, on 1.1.2024, the average lane count on primary streets was 3.09, on secondary streets 2.48, on tertiary streets 2.08, and on trunk roads 4 lanes.
Through this process, we estimate the number of lanes for each road segment with detector data. This allows us to accurately approximate the flow per lane-kilometer. However, as of January 1, 2024, 331 (12%) detectors lacked lane specifications, and approximated values were employed. While it would have been ideal to obtain the number of lanes for each detector lacking lane specifications, we assume that given that only 12% of detectors are affected, using the average number of lanes per OSM-highway classification provides a sufficient approximation for the methodology employed.
To estimate the total network length in the two selected zones as defined in Figure 2, we proceeded in a similar fashion:
Select the higher-order road network in OSM, that is, OSM’s highway attribute with levels primary, secondary, and tertiary roads, in each of the two zones, regardless of having a loop detector or not.
In cases where lane information is unavailable for certain street segments, we replace missing values with the mean of the number of lanes of the respective highway category in that particular year.
We obtained the total network length by calculating the sum over the edge length times the number of lanes.
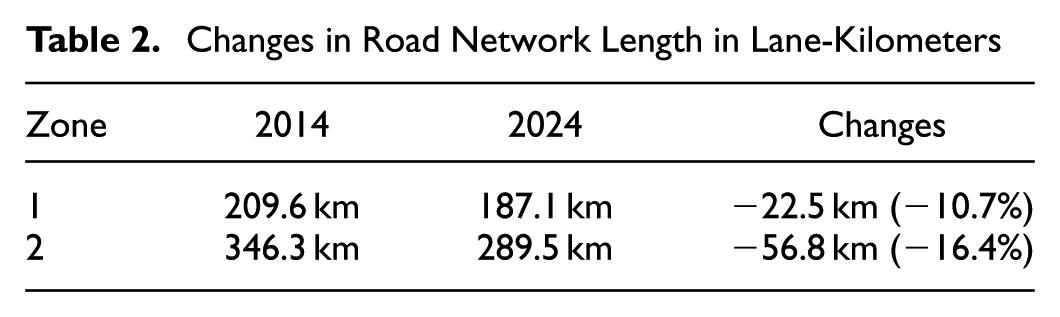
Table 2 summarizes the results. It can be seen that the road network length in lane-kilometers has been reduced substantially, in relative terms by 10.7% in zone 1 and by 16.4% in zone 2.
Changes in Road Network Length in Lane-Kilometers
Examining the Evolution of the Cycling Infrastructure
We conducted an analysis of the evolution of Paris’s bicycle network using publicly available data ( 43 ) spanning from 2000 to 2022. The analysis was conducted using data accessed in April 2024. Regrettably, as of July 2024, this data appears to be unavailable.
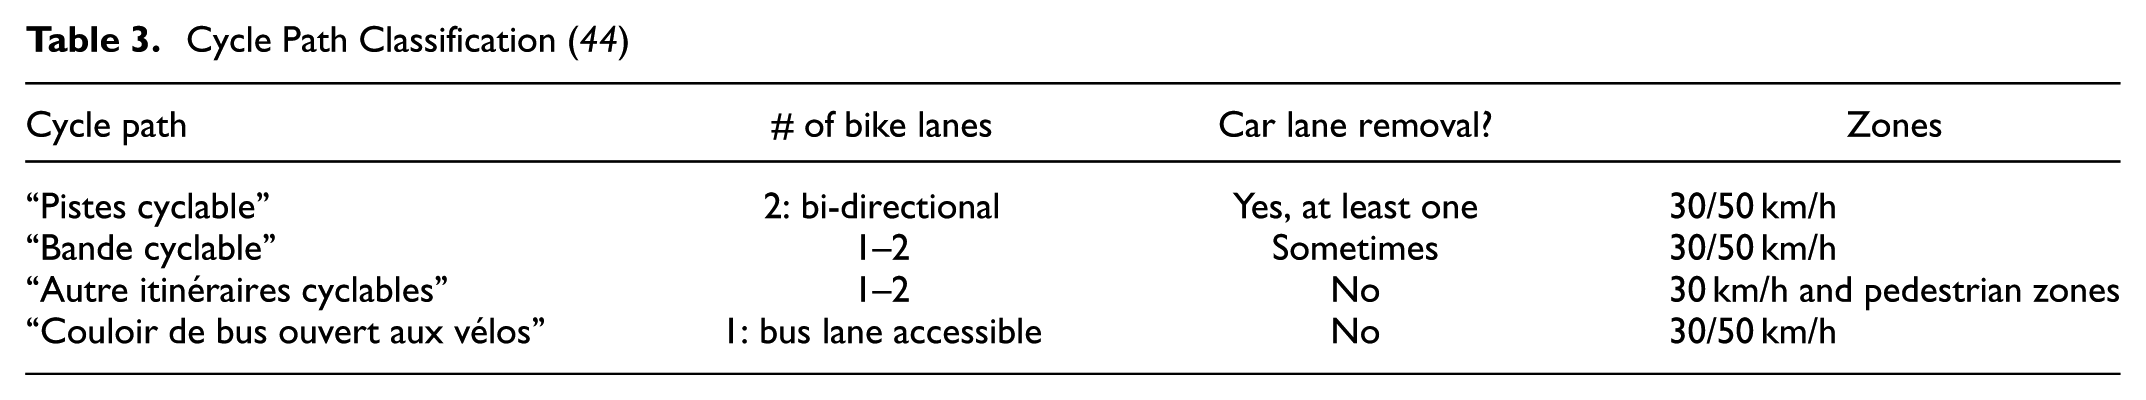
Cycle paths in this official plan are categorized into four types: “Pistes cyclables” for lanes exclusively for cyclists with physical separation from other traffic; “Bande cyclables” are lanes on roads open to general traffic; “Couloir de bus ouvert aux vélos” are bus lanes open to buses and certain categories of vehicles—cyclists are allowed to use it, indicated by bicycle logos on the ground or signs; and “Autre itinéraires cyclables” encompass all routes that can be used by cyclists, that are closed to general traffic and not part of the other types of described facilities. This includes pedestrian areas, contraflow cycle lanes, and routes closed to general traffic. We provide details on the classifications in Table 3 and show examples of the different cycle paths in Figure 4.
Cycle Path Classification ( 44 )
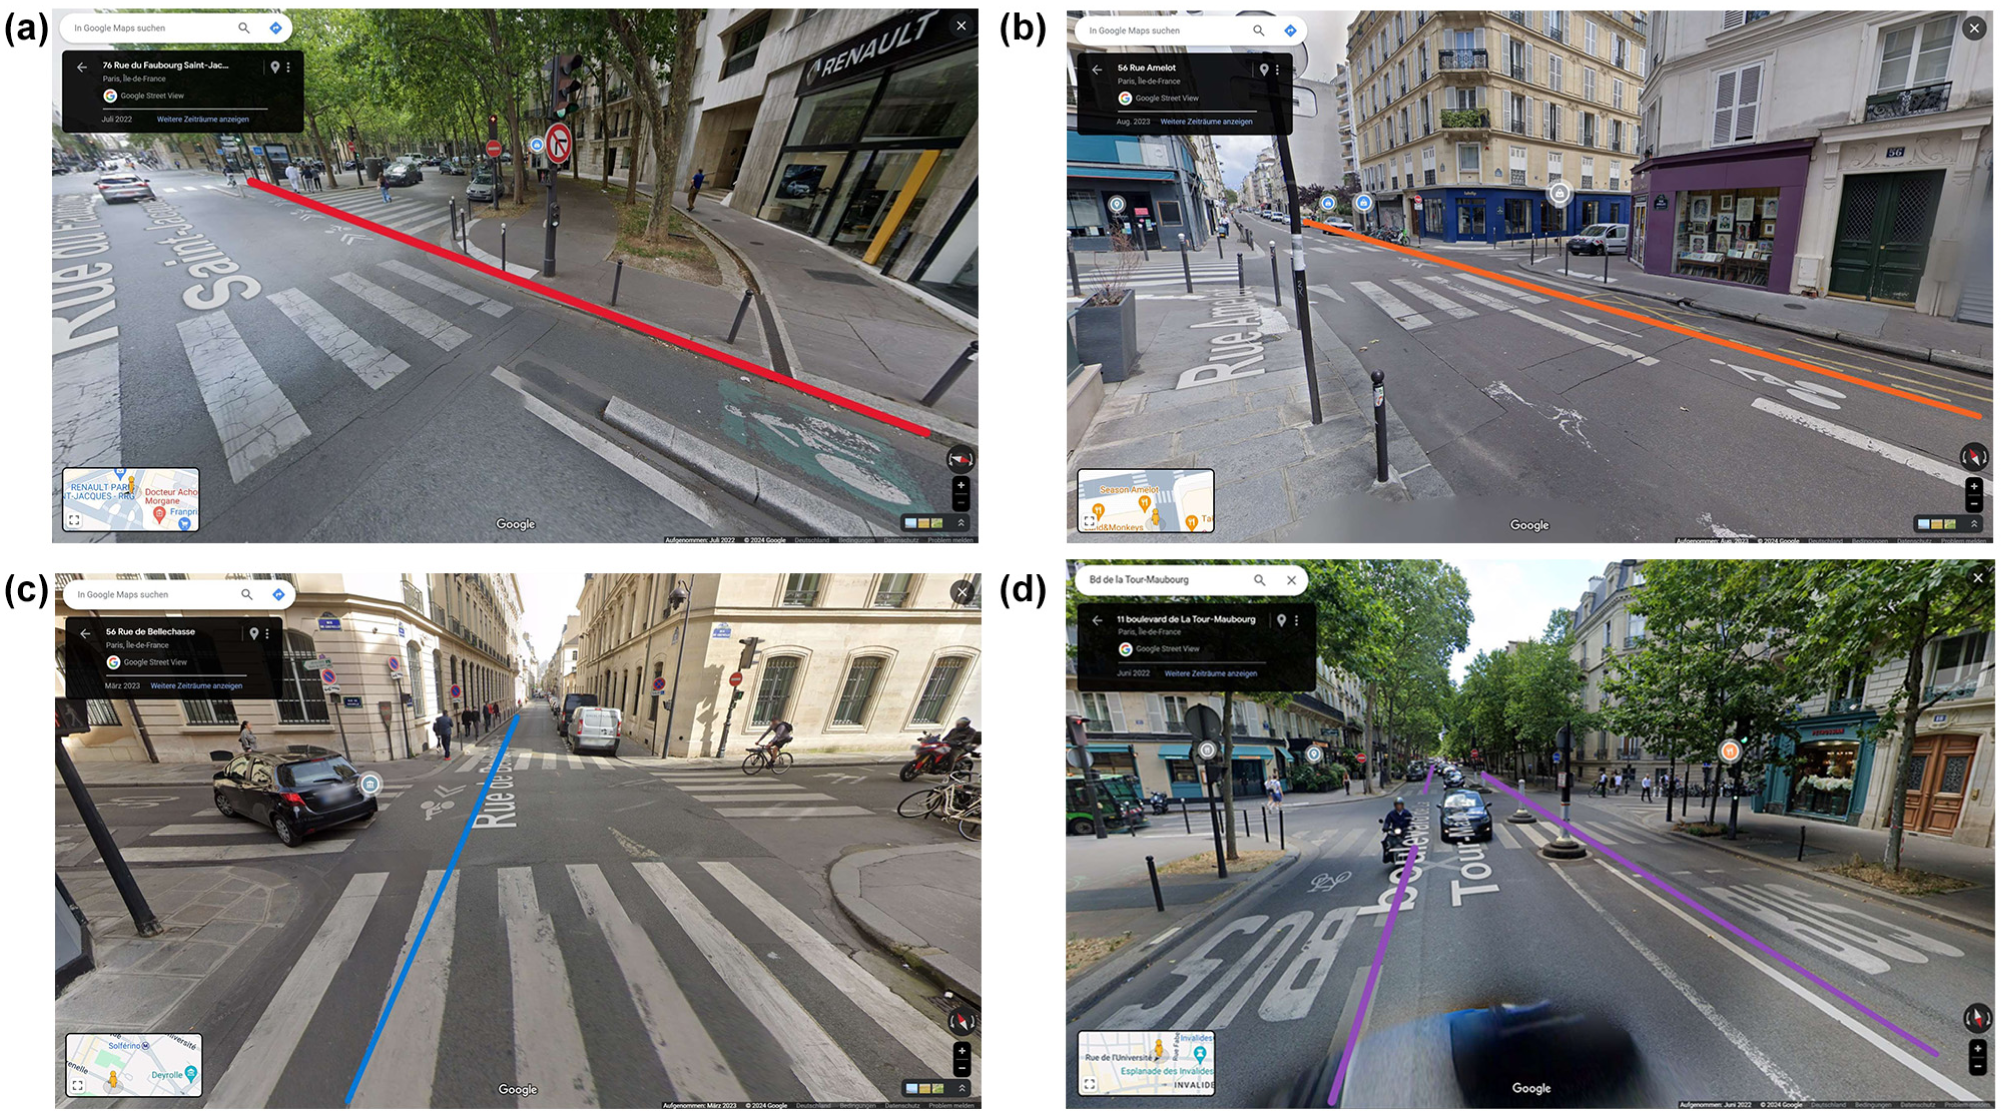
Example of different types of cycle paths implemented in Paris: (a) “Pistes cyclable”; (b) “Bande cyclable”; (c) “Autre itinéraires cyclables”; an (d) “Couloir de bus ouvert aux vélos.”
Of particular significance for our analysis are the “Pistes cyclables,” which stand out as the only bike paths featuring physical separation. The creation of these paths consistently involved the removal of at least one car lane.
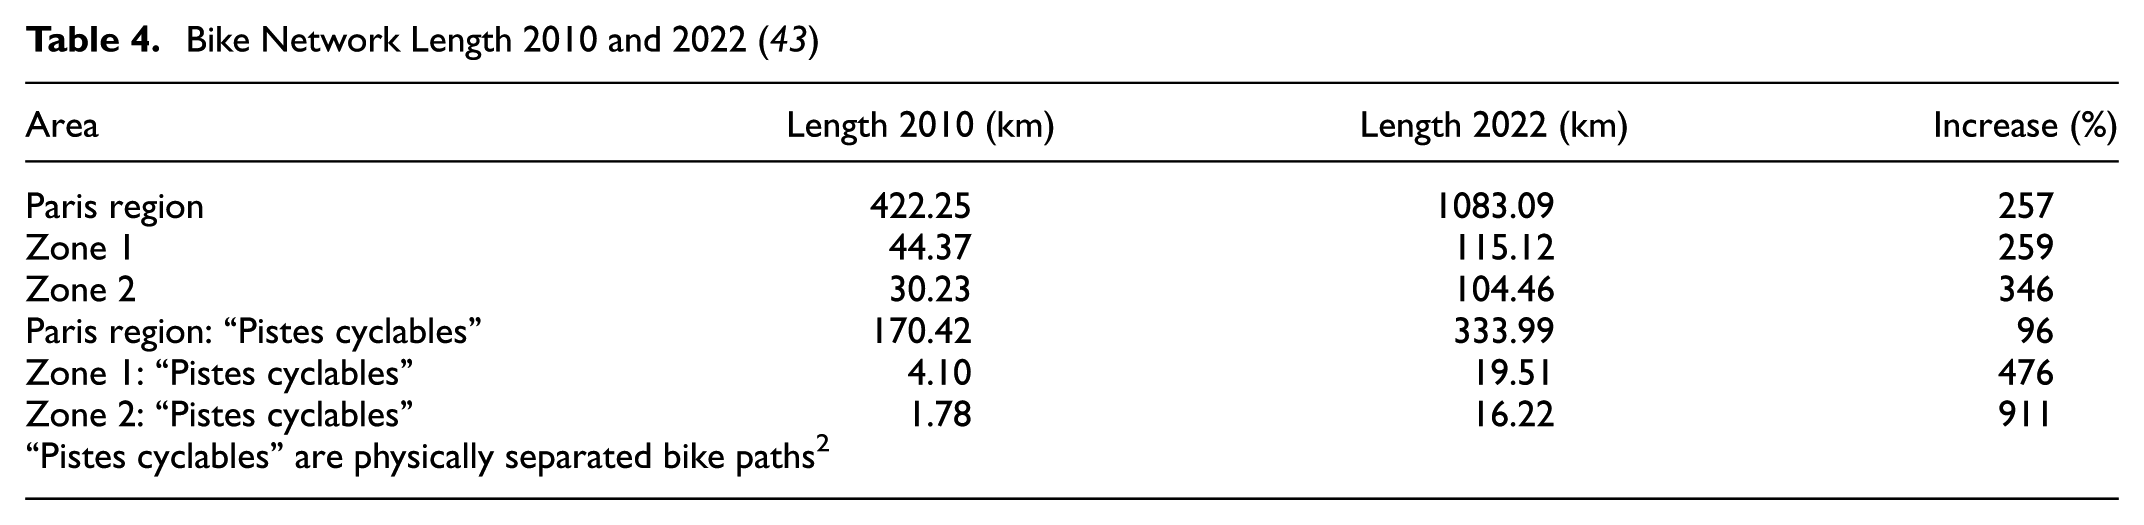
The development of the bike network length over time is illustrated in Table 4. Plan Vélo II ( 45 ) is depicted in Figure 2, illustrating the expansion of the “Pistes cyclables” network. This network is projected to span 447 km on its completion by 2026, in alignment with official reports indicating a coverage of 334 km as of 2022.
Bike Network Length 2010 and 2022 ( 43 )
Results
In this section, we present the results of applying our methodology from the “Methodology” section to the data in the “Data” section. In Figures 5 and 6, we show the resampled NFD normalized per lane-kilometer for zones 1 and 2, respectively. It is important to note that every point in the NFD represents a macroscopic traffic state in relation to vehicle density and vehicle flow. We computed the free-flow speed as the speed at a density of 0–15 veh/km. The NFD envelope is defined as the median of the top
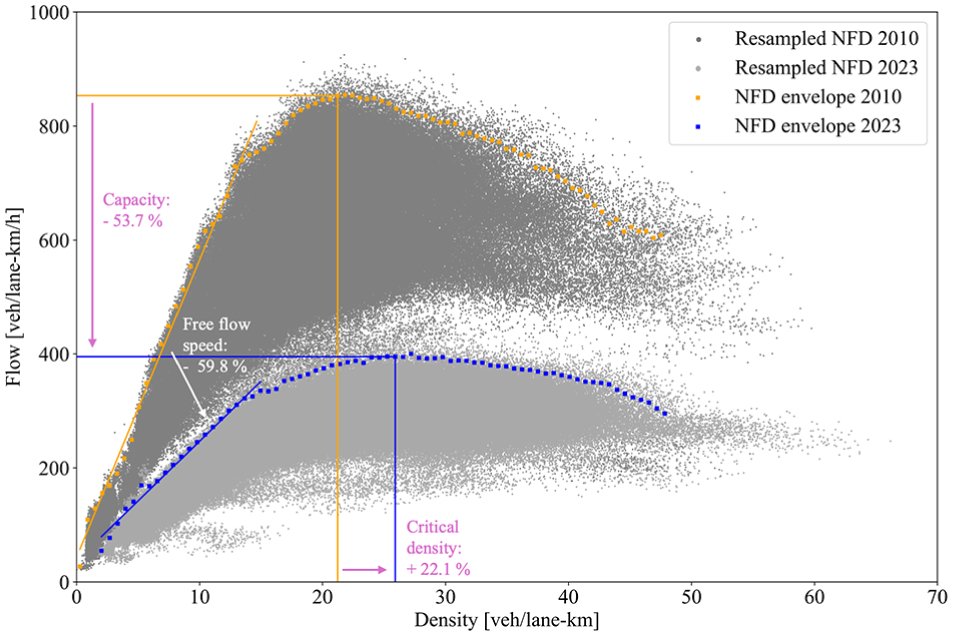
Zone 1: Resampled network fundamental diagram (NFD) 2010 and 2023.
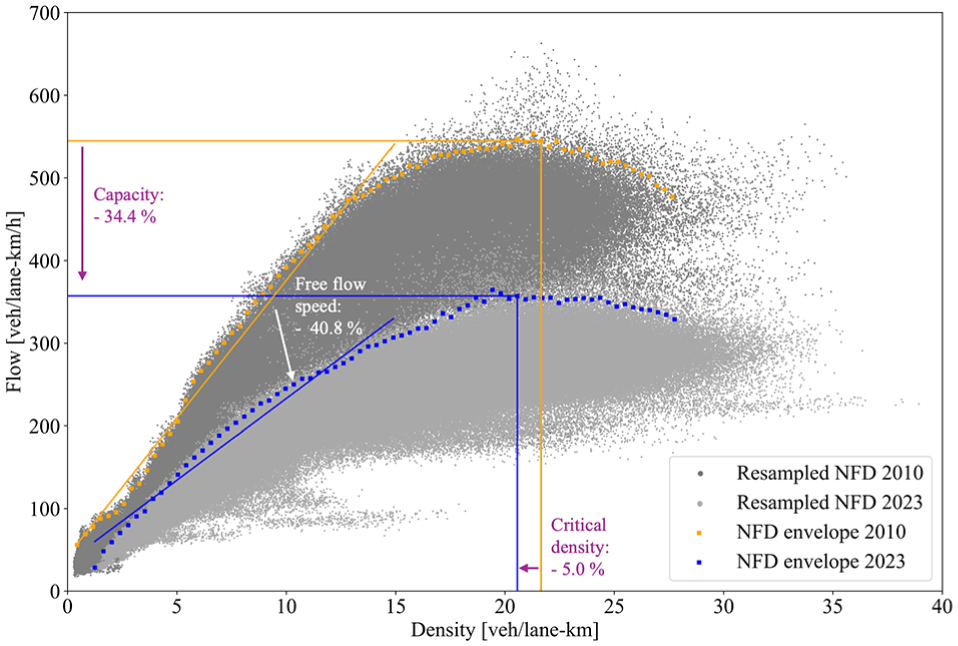
Zone 2: Resampled network fundamental diagram (NFD) 2010 and 2023.
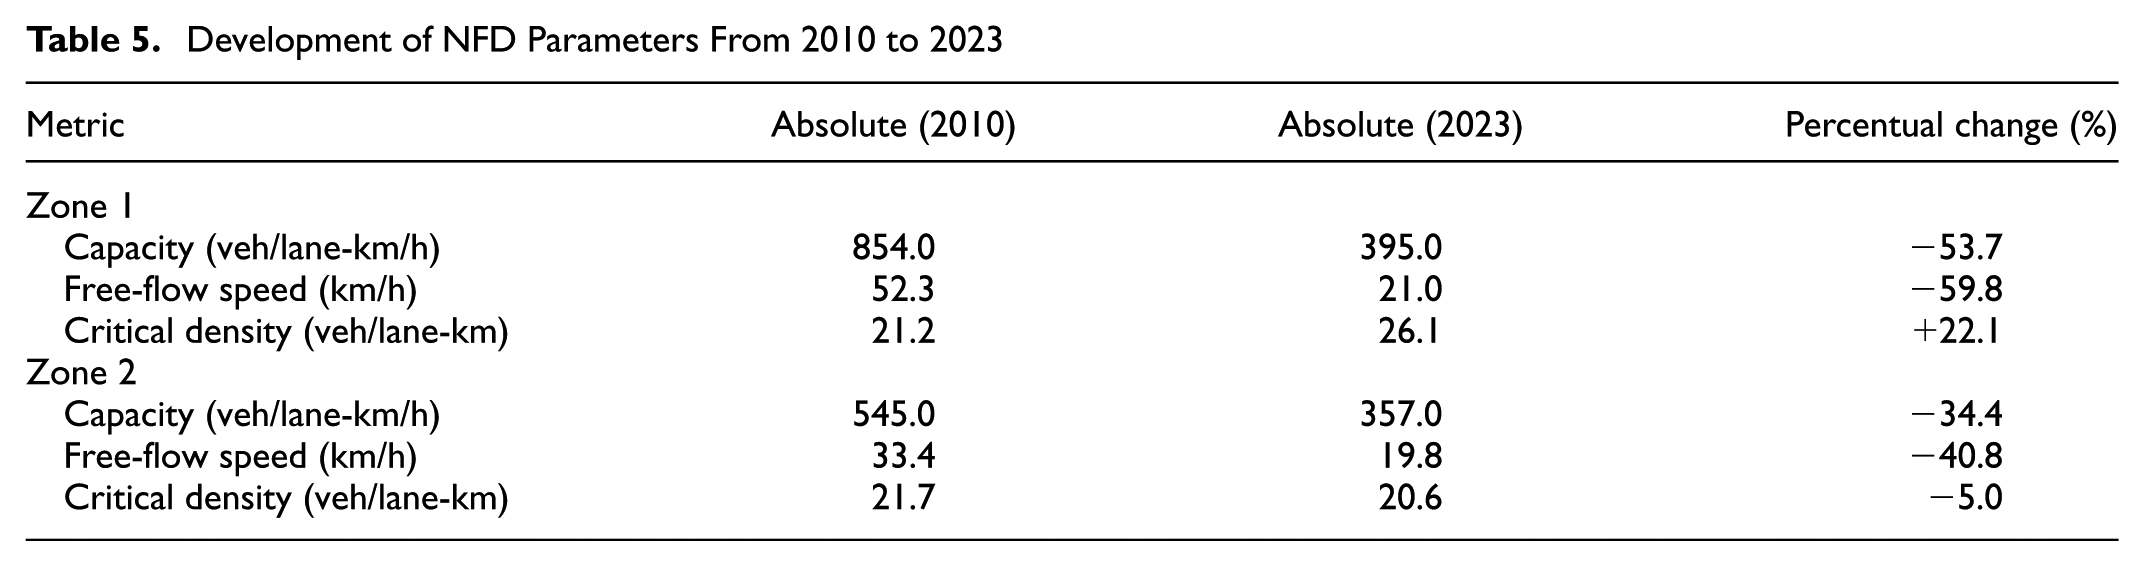
Remarkably, both NFDs exhibit a smooth upper bound, which supports the general theory of the NFD, defined as a tight upper bound relatively independent of demand. We present the results in Table 5. For Zone 1, we found that the capacity dropped in the considered time frame from 854 veh/lane-km/h to 395 veh/lane-km/h, a substantial decrease of 53.71%. The critical density increased from 21 veh/lane-km to 26 veh/lane-km, representing a 22.12% increase. This phenomenon can be attributed to the same level of public transport operations being made on less overall network infrastructure, that is, its relative shares of operations is increasing ( 20 ). In Zone 2, capacity dropped from 545 veh/lane-km/h in 2010 to 357 veh/lane-km/h in 2023, marking a drop of 34.41%. The critical density decreased only slightly, from 21.65 veh/lane-km in 2010 to 20.57 veh/lane-km in 2023. This trend is likely attributable to reduced space for cars and an increase in viable alternatives ( 19 ). Both zones experienced a significant drop in free-flow speed. In Zone 1, it dropped from 52.25 km/h in 2010 to 21.00 km/h in 2023, representing a reduction of about 60%. In Zone 2, it decreased from 33.36 km/h to 19.75 km/h, a decrease of about 40%. These findings are consistent with our initial hypotheses—both zones experienced a substantial decrease in traffic flow and speed, with Zone 1 seeing particularly significant declines.
Development of NFD Parameters From 2010 to 2023
In relation to network supply, the interventions in Paris, including Plan Vélo I and II, led to an expansion of bike lanes and a reduction in space allocated to cars. The cycling network has notably grown, according to cycling paths data from official sources ( 43 ), with detailed findings provided in Table 4. In particular, the establishment of separated bike paths, referred to as “Pistes cyclables” in the section “Examining the Evolution of the Cycling Intrastructure,” has notably increased. When analyzing the relative increases, it seems that Zone 2 has experienced more significant developments. However, one must not overlook the absolute numbers: despite its smaller geographical size compared with Zone 2, Zone 1 already had a more extensive bicycle network in 2010. This network comprised both overall routes and distinct cycling paths, which are especially noteworthy. This suggests that Zone 1 was already more bicycle-friendly and less reliant on cars compared with Zone 2 by 2010. Subsequent network modifications have likely only propelled this progress further.
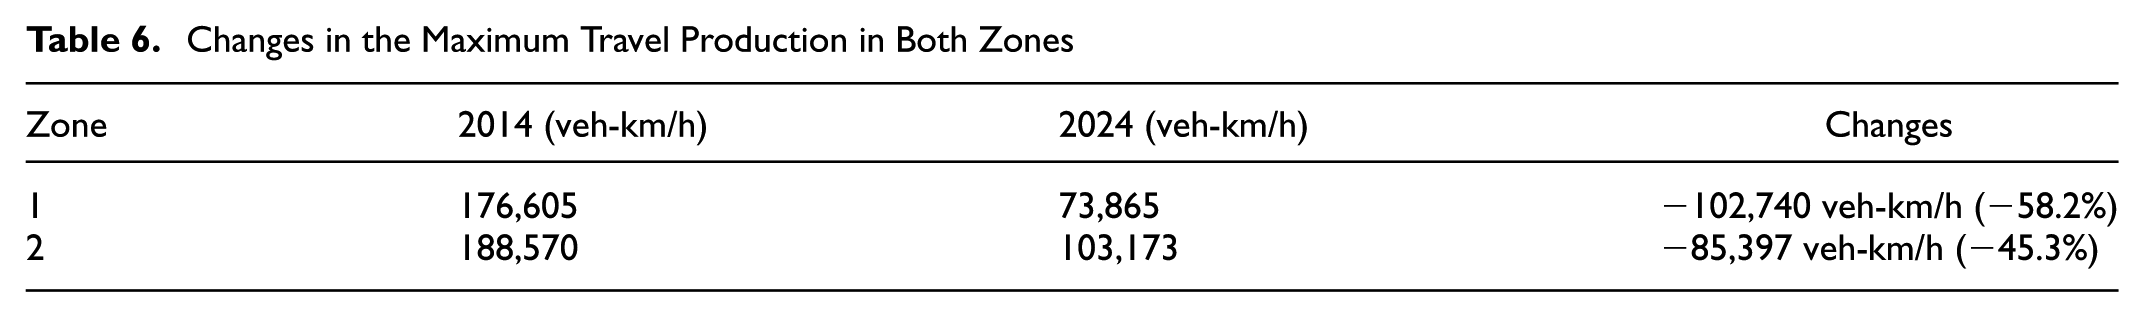
In relation to the road network, the expansion of the cycling network comes at the expense of the road network supply. Overall, Natterer et al. ( 7 ) reported for the entire road network a reduction in the road network’s lane-kilometers from 10,759 km in 2015 to 10,237 km in 2023, representing an overall reduction in road space of 4.9%. In the two zones of this analysis, this reduction is larger in relative terms as shown in Table 2. Combining these reductions with the NFD estimations in Figures 5 and 6 means that the road network’s travel production has been substantially reduced by the cutback in the road network length as well as changes in free-flow speeds and traffic management strategies. We find that the maximum travel production has been reduced as shown in Table 6, which we obtained from multiplying the capacity from Table 5 with the network length from Table 2. Combining these changes in the maximum travel production with the observed traffic states from Figures 5 and 6 implies the hypothesis that a substantial amount of car travel likely switched to other modes of transport or resulted from other changes in travel behavior.
Changes in the Maximum Travel Production in Both Zones
Discussion
The presented results on the changes in the NFD suggest that an interesting transformation has happened in Paris’ road network. With the NFD characterizing, among others, network topology, traffic signal control, and multimodal traffic operations, the observed changes are informative ( 34 ). First, as no substantial changes in public transport supply are reported, the observed changes can be attributed to changes in network topology and traffic signal control ( 20 , 34 ), which is intuitive considering the magnitude of Plan Vélo I and II. Second, considering the observed difference in the NFD’s normalized capacity between 2010 and 2023, that is, dropping from more than 800 to around 400 vph and lane, allows us to make the following conclusion: the network transformed from a car-oriented to a network focusing more on other modes of transport like public transport and active mobility ( 9 ). This drop is explained by giving substantially more green time to other modes than car traffic, while the reduced network-wide free-flow speed can be explained by lowering the links’ speed limit as well as potentially reducing green waves in the network ( 46 , 47 ). The findings then allow us to discuss how drivers experience the changes in their day-to-day travel. Drivers still experience that car travel without gridlock is possible in the network, while they will experience lower journey speeds. Nevertheless, drivers will also experience that driving speeds will be comparable to cycling speeds, presumably following the rationale of the Downs′“Triple Convergence” ( 48 ), therefore, providing an incentive to cycle on some relations.
Implications for a Modal Shift
We cannot make universally valid statements about the modal share as there are no data available to us. For example, it is also plausible that some vehicle trips were eliminated, diverted to other routes or locations (especially given that lower-order streets were excluded from the analysis), or replaced by walking.
However, when looking at the data and findings, a modal shift to more bike use can be observed: a study reveals that bicycles have surpassed cars as the preferred mode of transport within Paris, driven by extensive cycling infrastructure, policy support, and cultural shifts, with bicycles now accounting for 11.2% of trips compared with cars’ 4.3%. ( 49 ). Further, other studies ( 7 ) found that cycling surged between 2016 and 2022 by 94%. This suggests that a modal shift has occurred. Further, the reduction in the overall network length in the considered two regions emphasizes that the travel production overall has been reduced, suggesting further travelers had to switch to other modes of transport to produce their trips.
While our measurements provide a vehicle-based traffic flow perspective, using secondary data allows us to discuss further implications on passenger flows. It is important to note that data are still too sparse to properly estimate passenger NFDs ( 50 ). Nevertheless, we observed that in the considered time period, the supply of public transport in relation to vehicle/train kilometers remained relatively stable: it declined 0.85% for rail services and 5.24% for buses, while ridership decreased more significantly, by 3.7% for rail modes and 11.9% for buses ( 51 ).
Methodological Considerations and Data Limitations
Several key methodological considerations must be acknowledged. First, these changes were observed in loop detector data, which introduces certain limitations. The impact of network changes on overall car travel, particularly network exit flows, depends on average trip length. If car travelers with previously short trips switch modes, this reduces maximum trip production and increases average trip length, thereby reducing network exit flows. Conversely, if car travelers with previously long trips change modes, a reduced maximum trip production and decreased average trip length can increase network exit flows.
The use of loop detector data may introduce errors. Increasing the coverage of loop detectors and refining the NFD estimation process could mitigate potential bias in loop detector selection. Moreover, obtaining accurate information in relation to the number of lanes at measurement locations would enhance the accuracy of travel production estimates. This, coupled with improved speed data for NFD calibration, would facilitate investigations into the consistency of occupancy scale interpretation over time.
While OSM offers valuable insights, its limitations must be acknowledged. The lack of precise road network details, delays in updates, and limited availability of data starting only from 2013 hinder verification with official sources. Further, pinpointing the exact reduction in relation to lane-kilometers from 2010 is challenging because of the continuous enhancements in OSM’s accuracy, particularly considering that data are only available from 2013 onwards.
Broader Context and Future Implications
A comprehensive assessment of Plan Vélo I and II requires consideration of various dimensions beyond immediate traffic impacts. The broader implications include potential health benefits from reduced car usage and air pollution, the promotion of alternative modes of transport, and the potential mitigation of the urban heat island effect through increased green spaces.
It is crucial to note that these results cannot be viewed in isolation. During the 2010 to 2023 period, various events, including the impact of COVID-19 and a significant trend toward remote work, have also influenced transport patterns. Furthermore, this investigation serves as an interim assessment of Plan Vélo I and II. The transformation is ongoing, with several other measures being implemented too. Future studies, particularly on full implementation, will provide valuable insights into traffic behavior and the overall effectiveness of these initiatives.
Conclusion
This study analyzed the evolution of traffic in Paris from 2010 to 2023, a period marked by significant network changes driven by policy interventions aimed at making the city more bicycle- and pedestrian-friendly. The most notable of these interventions was Plan Vélo I and II, during which over 1,000 km of new bicycle lanes were constructed. We focused our investigation on two distinct zones in Paris’ city center, utilizing the resampling method for NFDs based on empirical data. Zone 1, comprising the central districts north of the Seine, represents a progressive transformation of the city, while Zone 2 embodies transformation endeavors more in line with the rest of the city.
Space Allocation Changes
The most fundamental change observed is in space allocation. The total production NFD, considering the total network length, reduced substantially in proportion to the network length reduction. This reduction in vehicular space was accompanied by a significant expansion of the cycling network. These changes reflect a deliberate shift in urban space allocation from private vehicles to active mobility modes.
Normalized Network Performance
The shape of the normalized NFD, when divided by total network length, reveals important changes in both zones: in Zone 1, we observed significant changes in both capacity and free-flow speed, with the normalized capacity dropping from more than 800 to around 400 vph and lane. In Zone 2, the changes were more moderate, reflecting the different approaches to network transformation in each zone.
Congestion Patterns
The congestion patterns observed in both zones provide valuable insights into the effectiveness of the interventions: in Zone 1, higher congestion was observed, resulting primarily from reduced space for vehicles rather than an increase in traffic volume. In Zone 2, we observed lower congestion levels following the interventions, suggesting a more balanced approach to transformation.
These findings demonstrate that Paris’ transformation toward sustainable mobility has had measurable impacts on traffic flow characteristics. The different approaches taken in Zone 1 and Zone 2 provide valuable lessons for other cities considering similar transformations. The results suggest that while aggressive space reallocation can lead to higher congestion in the short term, it may be necessary to achieve significant modal shift and long-term sustainability goals. The transformation in Paris continues to evolve, with several other measures being implemented, and future studies will provide further insights into the long-term effectiveness of these initiatives.
Overall, our findings suggest that the available travel production capacity for car traffic has been reduced by removing road space, reducing the speed limit and adjusting the traffic signal control strategy. That the observed traffic states indicate only a minor increase in congestion suggests that substantial share of the previous travel likely changed behavior; for example, switched to other modes like cycling, which is supported by other travel surveys. Further, considering that public transport supply did not change much suggests that passenger travel per unit distance—travel efficiency—increased as less cars with presumably lower vehicle occupancy circulate. Nevertheless, these are hypotheses that require further corroboration with further data sources.
The revealed changes in the NFD, particularly in capacity and critical density, demonstrate that Paris has undergone a substantial transformation from a car-oriented city to one that prioritizes cycling and public transport. While car travel is not banned, it has been disincentivized for many trips, leading to increased cycling and decreased car travel ( 7 ). However, the estimated NFDs indicate that Paris still experiences substantial congestion levels, as seen in the many observed traffic states beyond critical density in Figures 5 and 6.
These findings have important implications for future policy and research. First, the success of space reallocation as a transport demand management policy suggests that similar approaches could be effective in other cities. However, to further improve car traffic conditions, additional transport demand management policies, such as pricing-based strategies based on the NFD ( 52 ) or consumed mobility ( 53 ), could be considered.
Future research will continue to examine network changes in Paris, including the transformations implemented for the 2024 Paris Olympics. In addition, we will focus on estimating changes on the demand side, such as trip rates and trip lengths, from the available data to enhance our understanding of this infrastructure-based transport demand policy. This ongoing monitoring will be crucial for informing effective traffic management decisions and evaluating the long-term impacts of these transformative policies.
Footnotes
Acknowledgements
We provide the code for mapping road segments to (historical) data from OpenStreetMap on Github. We thank Yamam Alayasreih for providing a first implementation of the resampling methodology and for fruitful discussions. ChatGPT 4.0 helped with spelling checks and summarizing paragraphs.
Author Contributions
The authors confirm contribution to the paper as follows: study conception and design: E. S. Natterer, A. Loder, K. Bogenberger; data collection: E. Natterer; analysis and interpretation of results: E. Natterer, A. Loder, K. Bogenberger; draft manuscript preparation: E. Natterer, A. Loder, K. Bogenberger. All authors reviewed the results and approved the final version of the manuscript.
Declaration of Conflicting Interests
The authors declared no potential conflicts of interest with respect to the research, authorship, and/or publication of this article.
Funding
The authors disclosed receipt of the following financial support for the research, authorship, and/or publication of this article: This research was supported by MINGA project (grant no. 45AOV1001K to author E. Natterer) from the German Federal Ministry of Transport and Digital Infrastructure. This project is partially funded by the Bavarian State Ministry of Science and the Arts in the framework of the bidt Graduate Center for Postdocs to author A. Loder.
The authors are responsible for all findings and opinions presented in the paper.