
Abstract
Port governance has had a substantial impact on port operations. China launched the port-recentralization reform in 2015 to better allocate resources and improve efficiency. This was a reverse reform of port decentralization, and it is of great practical significance to assess its impact. This study empirically examines how port-governance recentralization affects port efficiency from the perspective of enterprise operation of listed port companies from 2010 to 2022. Using the super-efficiency slacks-based measure for efficiency analysis and the Tobit model for impact analysis, and decomposing the overall technical efficiency (TE) into pure technical efficiency (PTE) and scale efficiency (SE), it is found that: 1) the average values of TE, PTE, and SE first decreased and then increased, supporting the 2015 reform to some extent; 2) the establishment of provincial port groups (PPGs) increased PTE, but the changes in TE and SE were small; 3) the changes in corporate structure did not improve TE and PTE, but reduced SE. Because of the offsetting improvement in PTE and decrease in SE, port recentralization may not always increase overall efficiency. This study contributes by empirically revealing the complex micro-level effects of port-recentralization reform. It offers decision-making insights for port managers and related enterprises to maximize the positive effects of port reform on management and technology, while minimizing its negative effects on returns to scale.
Keywords
Port governance occupies a pivotal position in the fields of port operations and policymaking and has long attracted numerous scholars to conduct in-depth research ( 1 ). According to the results of a port economics survey, port governance was ranked as the third most popular research topic from 1997 to 2008 ( 2 ). This is mainly attributed to the wave of port reform characterized by decentralization that emerged globally in the 1990s and the early 2000s ( 3 ). From 2009 to 2020, port governance remained a core topic in the fields of port economics, management, and policy research, ranking second in the popular topic categories ( 4 ). Many studies focus on assessing its impact. This not only reflects the dynamic process of continuous exploration and transformation in the port field in many countries around the world, but also indicates that the academic and practitioner communities have not yet reached a wide consensus on which governance model is most appropriate for the long-term development of ports ( 4 , 5 ).
In the new stage of port development, the practice of cooperation among ports has led to several port mergers, which have evolved into port recentralization. Examples include the recentralization in Italy, the increased participation of state and federal governments in the United States, the centralization of the federal government in Brazil, and the integration of ports at the provincial level in China ( 5 , 6 ). These new trends of cooperation and integration are gradually reshaping the competitive pattern of freight and port markets, making it particularly urgent to assess the impact of these changes on port efficiency ( 7 ).
After the Open Door Policy in 1978, China’s port governance has undergone three reforms, shifting the authority power of port management from decentralization to recentralization. Since the founding of the People’s Republic of China (PRC) in 1949, China’s ports have operated under a highly centralized system, with the Ministry of Transport (MOT) directly managing port operations on behalf of the national government. In the 1980s, the first reform changed the administrative authority of major ports in China from the centralization under the MOT to the dual leadership of the MOT and local governments. The second reform, which began in 2001, further decentralized the administrative authority of ports, reflecting marketization and corporatization, and gradually delegated it to local governments ( 8 , 9 ). Although the first two rounds of reform promoted the rapid development of the port industry, they also created problems such as port overcapacity, resource idleness, and increased market competition.
To effectively address the above-mentioned challenges, driven by both the market and the government, ports have started an integration process, and the scope of integration has gradually expanded from within ports to neighboring, provincial, and regional ports ( 10 ). Since 2015, China has launched the third round of port-governance reform. The main measure of this reform is the establishment of provincial port groups (PPGs) to vigorously promote the process of port recentralization, with the aim of achieving optimal integration of port resources and scientific planning of functional layouts ( 11 – 13 ). As of 2024, except for Guangdong Province, all coastal provincial governments in China have established PPGs. These PPGs are composed of several specific port enterprises, among which listed port enterprises play a dominant role in the operation of coastal ports ( 14 ).
Existing research results show that port integration has achieved remarkable results, which can effectively alleviate the disorderly competition among ports ( 15 ), promote the economic growth of port cities ( 16 ), and improve the efficiency of provincial ports ( 17 ). However, from the perspective of corporate operation, whether port recentralization can enhance the efficiency of listed port enterprises is still a research gap. Existing studies have mainly focused on the overall impact of port-governance reform at the macro level, while the micro-level exploration of the impact of recentralization on the efficiency of listed port enterprises is insufficient. This study aims to explore how port recentralization affects port efficiency by selecting 11 listed port enterprises in coastal provinces with established PPGs as the research sample. This research contributes by filling the micro-level research gap and offering a reference for port-governance reform from the perspective of corporate economic operation, which can guide decision-making in both corporate and policy fields.
The rest of this study is organized as follows: The next section presents a thorough review of port reform and port efficiency to identify the research gaps. The third section discusses the evolution of port governance in China and the port corporate structures of recentralization. The fourth section introduces the research methodology, data, and variables. The fifth section reports the results of empirical analysis. The sixth section presents the discussion and the seventh section concludes this study.
Literature Review
Efficiency refers to the ability to obtain the best output with minimal input. Efficiency analysis is widely used in the port industry to evaluate performance, identify potential problems, and provide direction for improvement, which is critical for ports to remain competitive. To measure port efficiency, data envelopment analysis (DEA) models have been widely employed as a result of their advantages, such as no need for a priori determination of weights for each indicator, and handling multiple inputs and outputs effectively ( 18 , 19 ). The DEA model was initially introduced by Roll and Hayuth ( 20 ) for the assessment of port efficiency and mainly includes types of Charnes, Cooper and Rhodes (CCR), Banker–Charnes–Cooper (BCC), Super-DEA, slacks-based measure (SBM), and super-efficiency SBM (Super-SBM) models. Zhang et al. ( 7 ) conducted a comprehensive review of port-efficiency studies published through the end of 2023, covering types, perspectives, and methodologies. Most research focused on traditional port efficiency (i.e., technical and economic) from the perspective of managers or operators. Among methodologies, frontier techniques such as stochastic frontier analysis (SFA) and DEA are popular, while advanced or hybrid methods are rarely used. The review also identified problems in current research, particularly inconsistencies between the definition of decision-making units (DMUs) and the selection of input/output variables. DMUs, which can be ports, terminals, operators, or authorities, are often confused in many studies. In particular, with the ongoing trend of port integration, the impact of changes in port-governance structures on port efficiency remains unexamined. The review suggests future research directions to fill these gaps and improve the understanding of port efficiency.
To assess how port reform influences port efficiency, the existing literature primarily focuses on the consequences of port devolution, as a significant wave of global port devolution reforms occurred during the 1990s and early 2000s ( 5 ). However, there remains no consensus in relation to the effect of port devolution on port efficiency. One view suggests that port devolution does not have a significant impact on port efficiency, and the devolution of ports can even hinder their efficiency ( 21 – 23 ). For example, Valentine and Gray ( 21 ) utilized the DEA-CCR model to analyze 31 container ports to investigate the relationship between governance models and performance. Their findings indicated that there was no correlation between ownership structure and efficiency. Cullinane et al. ( 22 ) empirically investigated the correlation between privatization and port efficiency using a dataset of the top 30 container ports worldwide in 2001. The analysis concluded that increased private-sector involvement did not lead to enhanced efficiency. Coto-Millan et al. ( 23 ) concluded that smaller Spanish ports under centralized control exhibit higher efficiency than ports with devolution and greater managerial autonomy, utilizing a panel dataset of Spanish ports from 1985 to 1989. The other view suggests that port devolution has a favorable impact on port efficiency ( 24 , 25 ). Cheon et al. ( 24 ) used 98 major ports worldwide as case studies and demonstrated that port institutional reforms can enhance total factor productivity of ports. Caldeirinha et al. ( 25 ) validated the positive correlation between port devolution and improvements in port performance. Zheng and Negenborn ( 26 ) compared two different modes of port governance, namely centralization and decentralization. Their findings demonstrated that the decentralization mode leads to higher levels of tariff, port efficiency, port service demand, and social welfare. In addition, several studies have observed that the impact of port reforms on port efficiency varies significantly across regions and different stages, yielding contrasting outcomes ( 27 – 29 ). Pilcher and Tseng ( 1 ) posed the question: “Can we really measure the impact of port governance reform?”. They summarized the key issues and offered suggestions for policy makers and researchers by critically examining three key aspects: “key terms and their ambiguity,”“aspects of time and geography,” and “issues of methods and context.”
In the last decade, some countries, such as Brazil, China, and Italy, have begun to recentralize ports, with national or regional governments increasingly involved alongside local governments ( 6 ). Lee and Song ( 30 ) revisited the port devolution continuum in China and argued that the path has shifted from local government to central government. As a newly emerging reverse reform of port decentralization, the impacts of port recentralization and its effect on port efficiency are issues worthy of in-depth research and discussion. Through empirical analysis, Cheng et al. ( 15 ) suggested that the port-governance reform since 2015 has effectively mitigated inter-port competition to some extent and indicated that port integration can significantly promote the economic growth of port cities; utilizing the difference-in-differences (DID) model, they suggest that the positive effects become more pronounced over time. Zhou et al. ( 17 ) conducted an empirical study on the impact of provincial port integration (PPI) on port efficiency from a provincial perspective, using a multi-period DID model with panel data covering the nine coastal provinces of China during the period 2004–2019. The results revealed that PPI significantly enhances provincial port efficiency.
Driven by top-down government leadership and implemented through corporatization, China’s port-recentralization reform calls for an examination of its impact on port enterprise efficiency. A review of existing studies on port reform and efficiency reveals research gaps that this study aims to fill. Using data from listed Chinese coastal port enterprises, this study quantitatively assesses port efficiency and analyzes how it is influenced by port recentralization.
This study contributes by empirically revealing the complex micro-level impacts of the port-recentralization reform. First, it clarifies the evolutionary characteristics of port governance in China and comprehensively details the changes in port corporate structures. Second, from the economic-operation perspective of listed port companies, ensuring consistency between DMUs and input/output variables, it measures port efficiency separately by decomposing technical efficiency (TE) into pure technical efficiency (PTE) and scale efficiency (SE) to reveal the complex relationship between different efficiency components. Third, it strengthens the empirical research on the relationship between port-governance reform, especially recentralization, and port efficiency. These efforts offer a scientific basis for port-governance decision-making and enrich academic research on port governance and efficiency.
Port-Governance Reform in China
Evolution of Port Governance in China
The process of port-governance reform should be attributed to specific social, historical, and institutional settings ( 31 ). Before 2018, three distinct stages of port-governance reform in China were identified from the existing literature, including centralization, dual leadership, and decentralization ( 8 , 32 , 33 ). Huo et al. ( 9 ) concluded that the trend toward establishing PPGs indicated the initiation of further port-governance reform transitioning from devolution to recentralization. The term “port recentralization” has been referenced in recent studies related to Chinese port governance after 2018 ( 11 , 12 ). Cheng et al. ( 15 ) employed the terms “semi-centralized stage” and “one province, one port (OPOP)” mode to illustrate the process of port recentralization in China. Provincial integration progresses from a managerial level to an institutional level and from mere cooperation between ports toward governance structures. Port recentralization or integration is now recognized as the fourth phase of port governance in China by scholars including Chen et al. ( 12 ), Zhang et al. ( 11 ), Zhang et al. ( 34 ), Cheng et al. ( 15 ), and Zhou et al. ( 17 ).
The key characteristics of the four stages of port-governance evolution in China are shown in Table 1 ( 9 , 12 ). At Stage 1 (1979–1984), the Chinese ports were under the strong centralized supervision of the MOT, and they applied the mode of “highly centralized, unified management, integration of government administration and enterprise operation, and national monopoly” ( 32 ). The MOT was the owner and operator of ports and managed all activities and decisions. The local port authority, serving as a subordinate agency of the MOT, functioned both as a decentralized government entity and as a port enterprise ( 33 ). The legal document followed at this stage was the “Provisional Regulations of the PRC on the Administration of Seaports” promulgated in January 1954, which clearly stipulated that the MOT should set up port authorities in port cities according to the needs of trade and transport.
Key Characteristics of Four Stages of Port-Governance Evolution in China
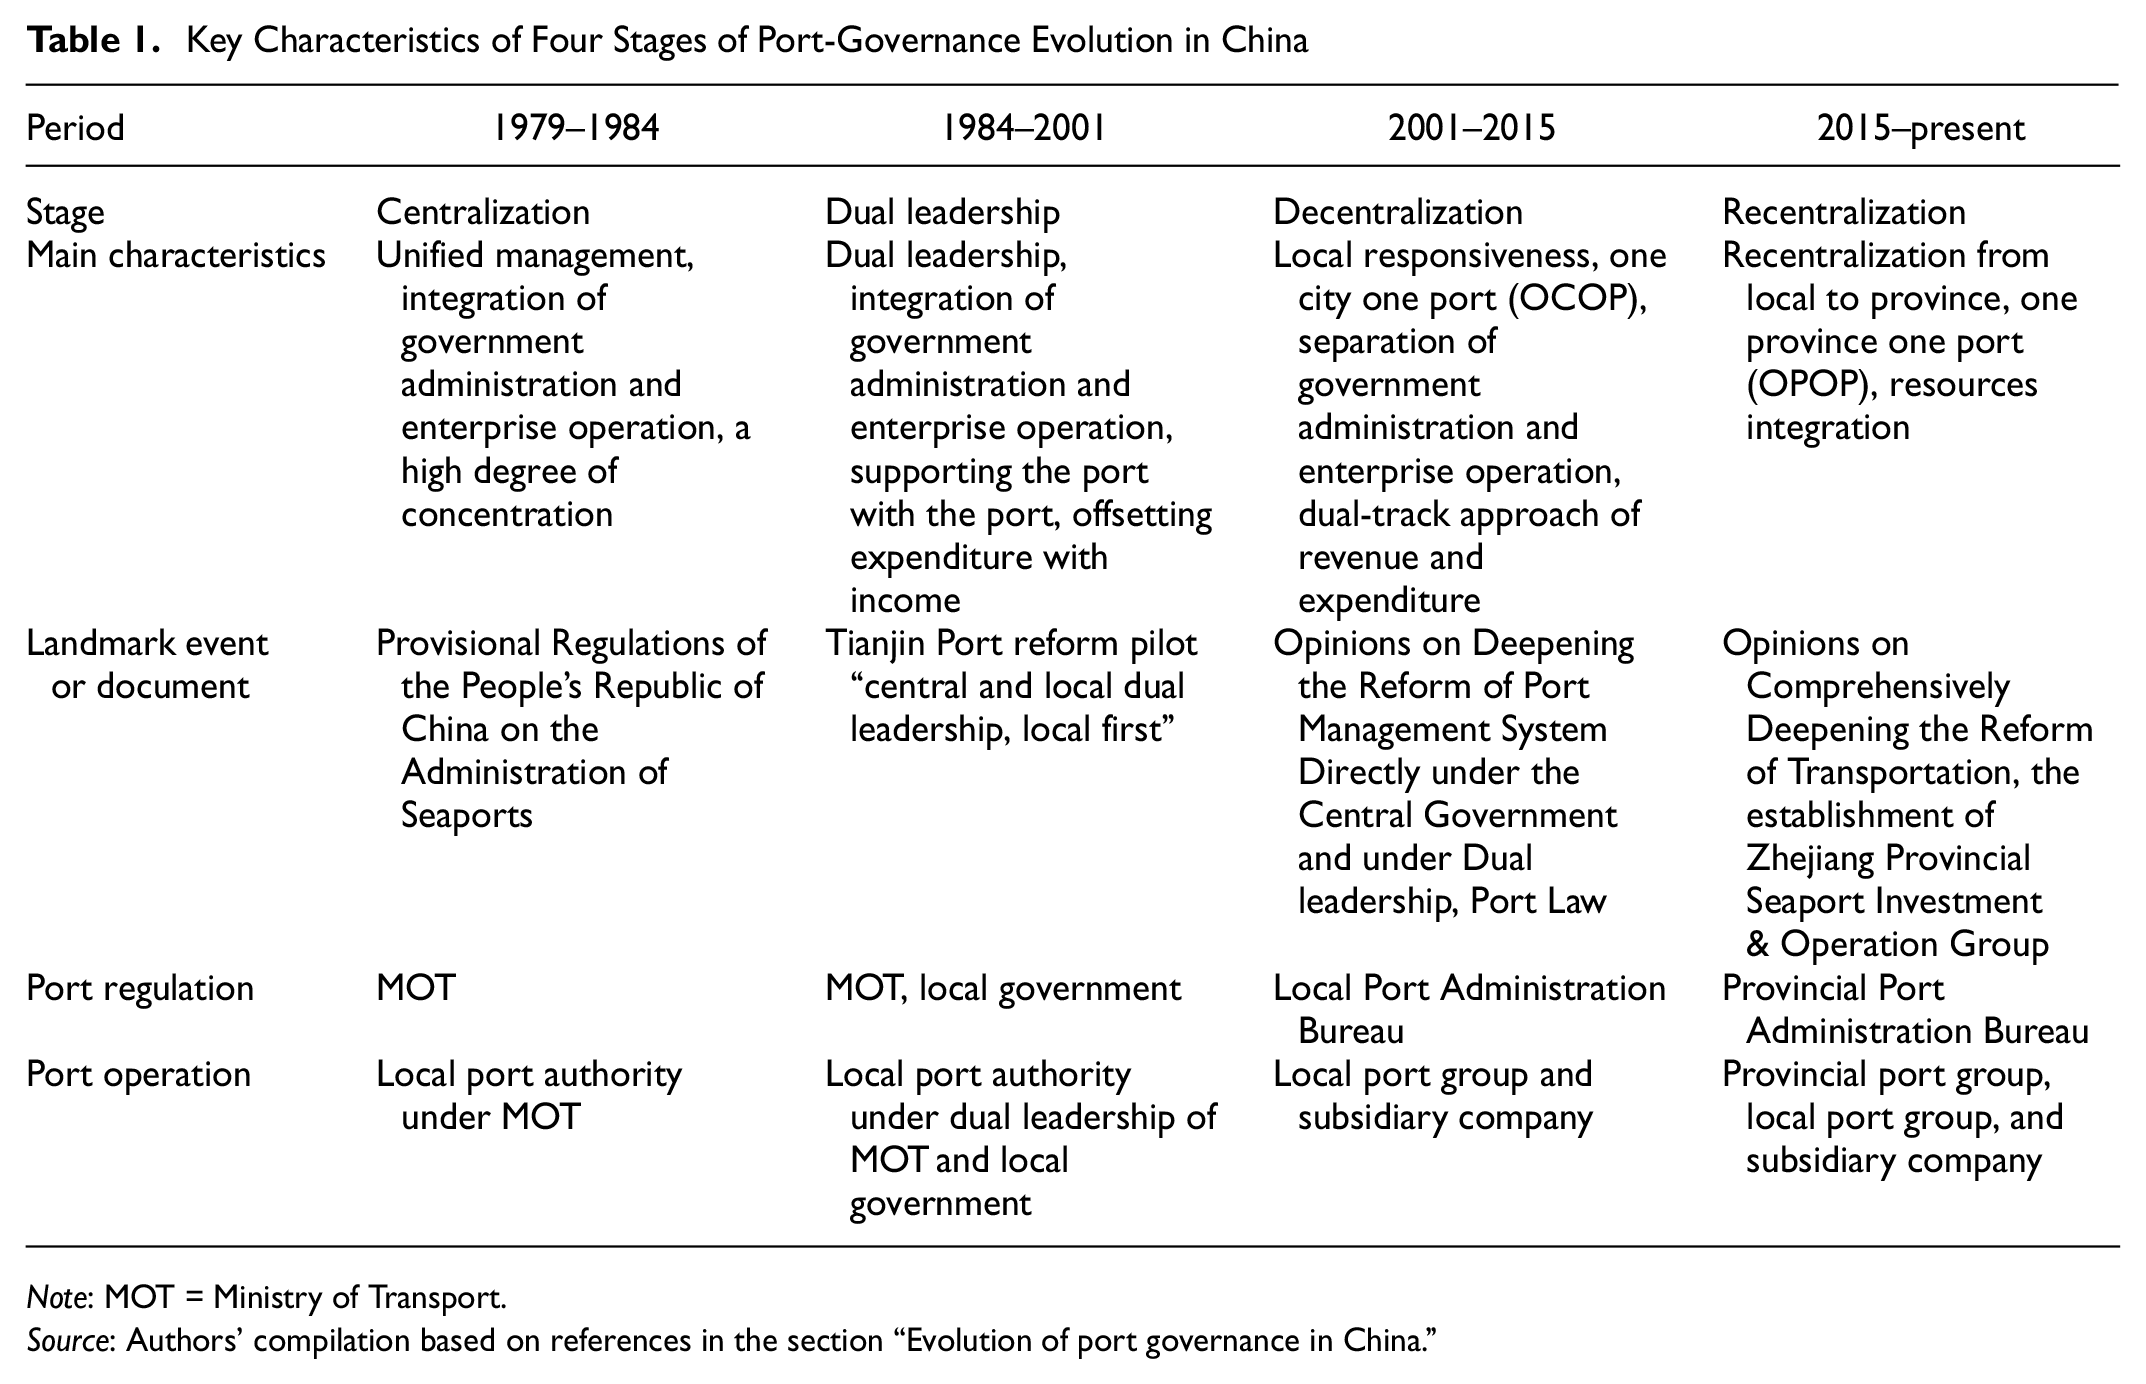
Note: MOT = Ministry of Transport.
Source: Authors’ compilation based on references in the section “Evolution of port governance in China.”
During Stage 2 (1984–2001), the MOT and the local governments jointly managed the ports, with local governments at the forefront. On the basis of the successful pilot reform in Tianjin Port in 1984 ( 33 ), the MOT adopted port decentralization and implemented the mode of “dual leadership of the central and local governments [ 32 ], with local governments as the main authority” and the financial policy of “supporting the port with port, offsetting expenditure with revenue, fixed payment, unchanged for a certain number of years.”
At Stage 3 (2001–2015), a change in port governance took place, primarily through the creation of port administration bureaus and local port groups, to achieve the separation of administration and operation ( 32 ). Ports were devolved to local governments based on the principle of “one city, one port, one administration” ( 33 ). The financial policy shifted from “supporting the port with the port and offsetting expenditures with revenue” to “a dual-track approach of revenue and expenditure.” The income tax was collected from port enterprises in accordance with relevant provisions set forth by the state tax administration. The “Opinions on Deepening the Reform of the Port Management System Directly Under the Central Government and Under Dual Leadership” and the “Port Law” were the reform and legal documents followed at this stage ( 8 ).
At the fourth stage (2015 to present), port governance is going through recentralization from local city to province ( 9 , 12 , 30 ). On December 30, 2014, the MOT issued the “Opinions on Comprehensively Deepening the Reform of Transportation,” proposing measures such as streamlining port-administration reform efforts, to encourage integration of port resources, and to promote intensified collaboration among regional ports ( 16 ). It also aimed at advancing power-reconcentration reforms within the port industry. In 2015, the MOT issued the “Pilot Program for the Integration of Regional Port Development.” Ports along the Yangtze River below Nanjing in Jiangsu Province and coastal ports in the Beibu Gulf in Guangxi Province were required to carry out pilot reform. In the same year, Zhejiang Province took the lead in port integration and established a port-resource integration-platform company to carry out overall control of port resources in the province. Since then, Jiangsu, Liaoning, Shandong, Fujian, and other places have proposed port integration in the province. On August 28, 2015, Zhejiang Seaport Investment and Operation Group Co. Ltd. (Zhejiang Seaport Group) was officially inaugurated in Zhoushan; this was committed to integrating the five ports in Zhejiang Province. The establishment of Zhejiang Seaport Group marked a new stage of port-governance reform in China, with port recentralization and OPOP mode ( 15 ). In 2017, the MOT summarized the document titled “Reform Experience of Zhejiang’s Strong Promotion of Regional Port Integration” and issued the “Notice on Learning from Zhejiang’s Experience to Promote Reform in Regional Port Integration.” This notice was distributed to all provinces and cities with the aim of fostering comprehensive development through integration reform. The document provided full recognition to Zhejiang’s port-integrated mode and utilized it as a prominent example for advancing the integrated mode of OPOP ( 17 ).
In summary, China’s port governance has undergone a process of centralization–decentralization–recentralization and jurisdictional scales at the state–local–province levels. The initial three stages (1979–2015) witnessed port devolution, while the fourth stage is characterized by port recentralization.
Port Corporate Structures of Recentralization
The reform of port recentralization primarily employs administrative and market mechanisms, namely the establishment of state-owned PPGs for holistic management of all ports within each province, to integrate provincial ports. At the time of writing (2024), all coastal provincial governments (except Guangdong Province) have established PPGs. As the transition from “one city and one port” (OCOP) to OPOP has taken place, numerous ports that were previously operated independently have now evolved into specialized branches of PPGs.
Some listed port companies have changed to be under the control of PPGs from being under that of municipal port groups, and have undergone a change of corporate structure or other restructuring. For example, Dalian Port Co. Ltd. merged with Yingkou Port Co. Ltd. and was renamed Liaoning Port Co. Ltd. in 2021; Tangshan Port Group Co. Ltd. was transferred to Hebei Port Group with the restructuring of Hebei Port Group in 2022; Ningbo Port Co. Ltd. was renamed Ningbo Zhoushan Port Co. Ltd. in 2016 following the acquisition of Zhoushan Port Co. Ltd. through a private placement; Beihai Port Co. Ltd. implemented a major asset reorganization to realize the three ports (Fangcheng, Qinzhou and Beihai) being listed as a whole in 2013, and was renamed Beibuwan Port Co. Ltd. However, as of December 2023, Lianyungang Port had not been transferred to Jiangsu Port Group, although Jiangsu Port Group was established in 2017.
Port recentralization has involved corporate-level structure adjustments, that is, transition of jurisdiction and ownership from local cities to the provincial level through corporatization. Taking Ningbo Port as an example, this section explains the change of port corporate structure. After the establishment of the PPG (Zhejiang Seaport Group), Ningbo Port Group and Zhoushan Port Group completed a holding merger to establish Ningbo Zhoushan Port Group Co. Ltd. on September 29, 2015. In December 2015, the assets of Ningbo Zhoushan Port Group were injected into the PPG, and it became a wholly owned subsidiary of the PPG. Figures 1 and 2 show the change of Ningbo Port corporate structure. Before the establishment of the PPG, Ningbo Port Co. Ltd. (stock code: 601018) was a subsidiary of the local port group, with Ningbo municipal government as the actual controller through the State-owned Assets Supervision and Administration Commission (SASAC). After the PPG was established, the actual controller changed to Zhejiang provincial government. The independent operation of Ningbo Port was changed to the overall operation of the PPG, and the management layer was changed from “local city” to “province and local city.” Ningbo municipal government lost its autonomous control over Ningbo Port.
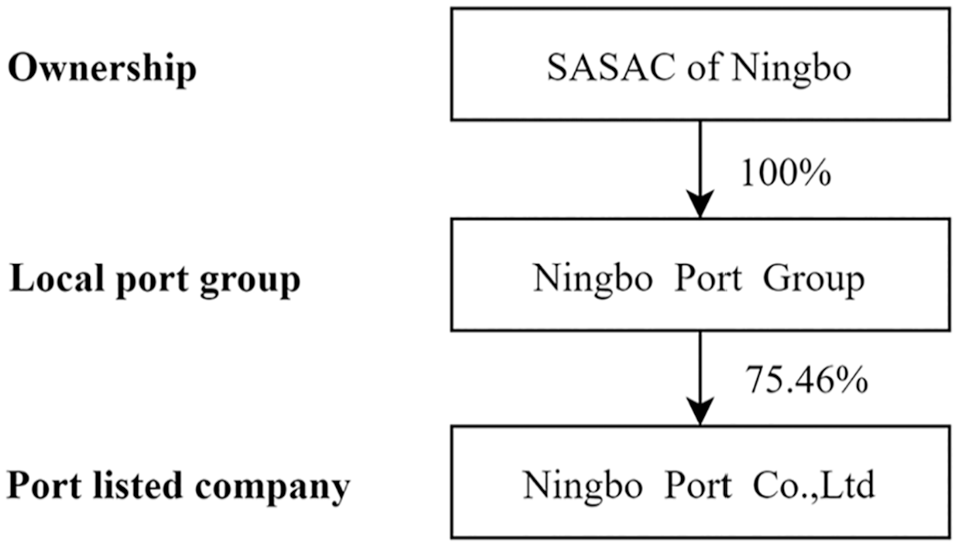
The corporate structure of Ningbo Port in 2014 before PPG.
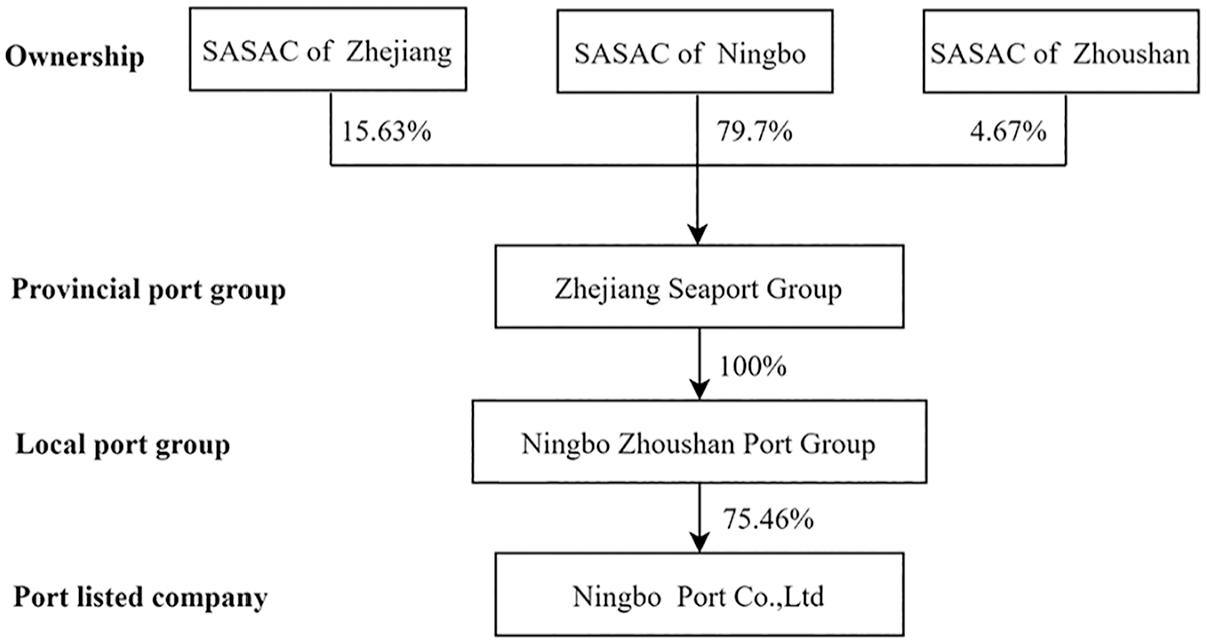
The corporate structure of Ningbo Port in 2015 after PPG.
The port corporate structure reflects the overall organizational layout and administration for port management ( 24 ). The argument for port devolution is that the more decentralized corporate structure enables ports to be free from political interference and allows port managers to act more proactively and effectively with higher independence and greater autonomy, then improves port efficiency ( 24 , 35 ). However, the current port-recentralization reform results in a more hierarchical and centralized corporate structure, and it is worth examining whether these changes have an impact on the efficiency of the listed port companies.
Methodology, Data, and Variables
This study constructs an econometric framework to examine the effect of port recentralization on port efficiency using panel data from coastal listed port companies. The research framework is organized as follows. First, the Super-SBM model is adopted to measure the efficiency of coastal listed port companies in China to reveal the efficiency change along with port-governance reform. Therefore, to ensure consistency between DMUs and input/output variables from the perspective of business operations, this study employs financial indicators for analysis. Second, by controlling other influencing factors, the Tobit model is employed to examine the impact of port recentralization on port efficiency derived from the Super-SBM model. Finally, the credibility of the research findings is improved through a robustness test. All listed port enterprise data for the efficiency analysis are obtained from their annual reports from 2010 to 2022 on www.eastmoney.com. Meanwhile, data on all influencing factors for the impact analysis are sourced from the China Statistical Yearbooks.
Super-SBM Model for Port-Efficiency Measurement
Traditional DEA models consist of DEA-CCR and DEA-BCC. The DEA-CCR model, proposed by Charnes et al. ( 36 ), calculates the TE value of a DMU assuming constant returns to scale. The DEA-BCC model, proposed by Banker et al. ( 37 ), excludes the influence of SE on TE and provides the PTE measure considering variable returns to scale. Technically speaking, TE equals PTE multiplied by SE in value. In practice, it is often observed that multiple DMUs exhibit simultaneous effectiveness (TE value of 1), making accurate ranking and assessment of efficient DMUs unattainable. To overcome this deficiency, the Super-DEA model, proposed by Andersen and Petersen ( 38 ), compares the evaluated DMU with all other DMUs in the sample without itself obtaining an efficiency value above 1. Thus, it can effectively discern the efficiency differences among efficient DMUs and enables reliable ranking of evaluated DMUs. On the other hand, traditional DEA models require the inputs and outputs to be proportional and the orientation to be set separately, which does not align with the reality. To address these issues, Tone ( 39 ) proposed a non-radial and non-oriented SBM model that considers the impact of slacks. This model allows for disproportional inputs and outputs while simultaneously handling input excess and output shortfall. The SBM model returns an efficiency value between 0 and 1; therefore, it is still unable to distinguish the efficiency values of efficient DMUs. As a result, the Super-SBM model was further introduced by Tone ( 40 ) to enhance the discriminatory power based on both the Super-DEA model and the SBM model. The Super-SBM model overcomes the limitations of radial and equal-proportion input and output changes that existed in the traditional DEA model, fully considers the slacks of input and output indicators, and avoids the problem of overestimation of efficiency values. As a result of the above advantages, the Super-SBM model is adopted in this study to measure the efficiency of coastal listed port companies in China.
Suppose that there are n DMUs with two matrices respectively: m inputs
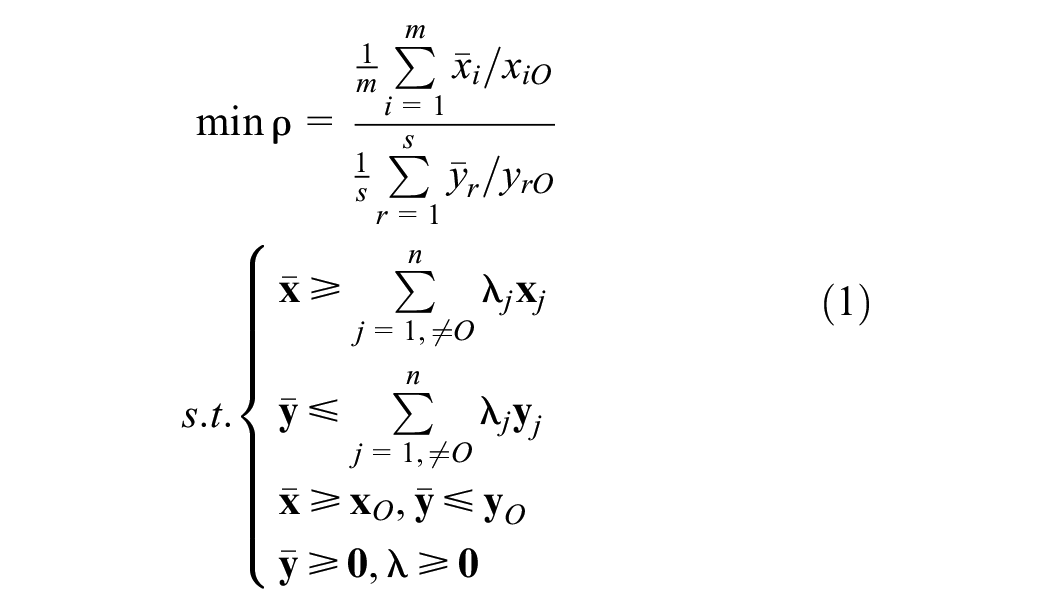
where
the subscript
ρ is the port-efficiency value TE.
When considering variable returns to scale (VRS), the Super-SBMVRS model can be employed to exclude the impact of SE on TE to obtain the PTE value with an additional constraint; the extending Super-SBMVRS model is specified as follows ( 40 ):
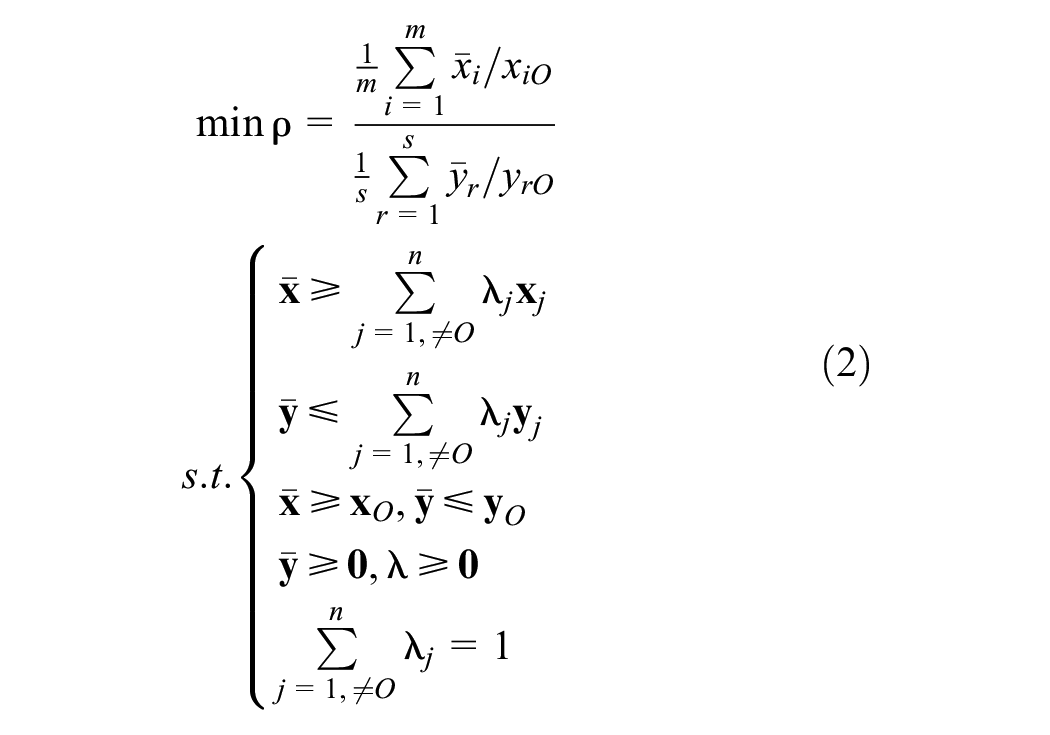
In this study, Super-SBM and Super-SBMVRS models are adopted to calculate the scores of TE and PTE, and calculate the scores of SE using the following formula:

Tobit Model for Examining the Impact of Port Recentralization on Port Efficiency
The Tobit model is used to describe the correlation between a non-negative dependent variable and independent variables when the dependent variable is censored ( 41 ). Censoring occurs when the values of the dependent variable are only partially observed or are restricted to a certain range. It is an extension of the linear regression model and is used for modeling limited-dependent variables. The Tobit model adopts maximum-likelihood estimation to avoid the inconsistency and bias in parameter estimation. The values of port efficiency measured by the Super-SBM model are greater than 0 and relatively concentrated, which exactly satisfies the requirement of the Tobit model ( 18 , 42 ). Therefore, this paper adopts the Tobit model to estimate the effect of port recentralization on port efficiency. The Tobit model accounts for this censoring by incorporating a latent variable framework. The basic Tobit model is defined as follows:

where
The second equation specifies the censoring mechanism, where
Sample, Data Sources, and Variables
Sample and Data Sources
This paper selects 11 coastal listed port companies in the provinces where PPGs have been established, as shown in Table 2. It includes the year of the establishment of PPGs, corporate structure change (CSC) and listing for each company respectively. All the raw data were collected from the annual reports of the 11 companies from 2010 to 2022.
Listed Port Companies in the Provinces Where PPGs Have Been Established
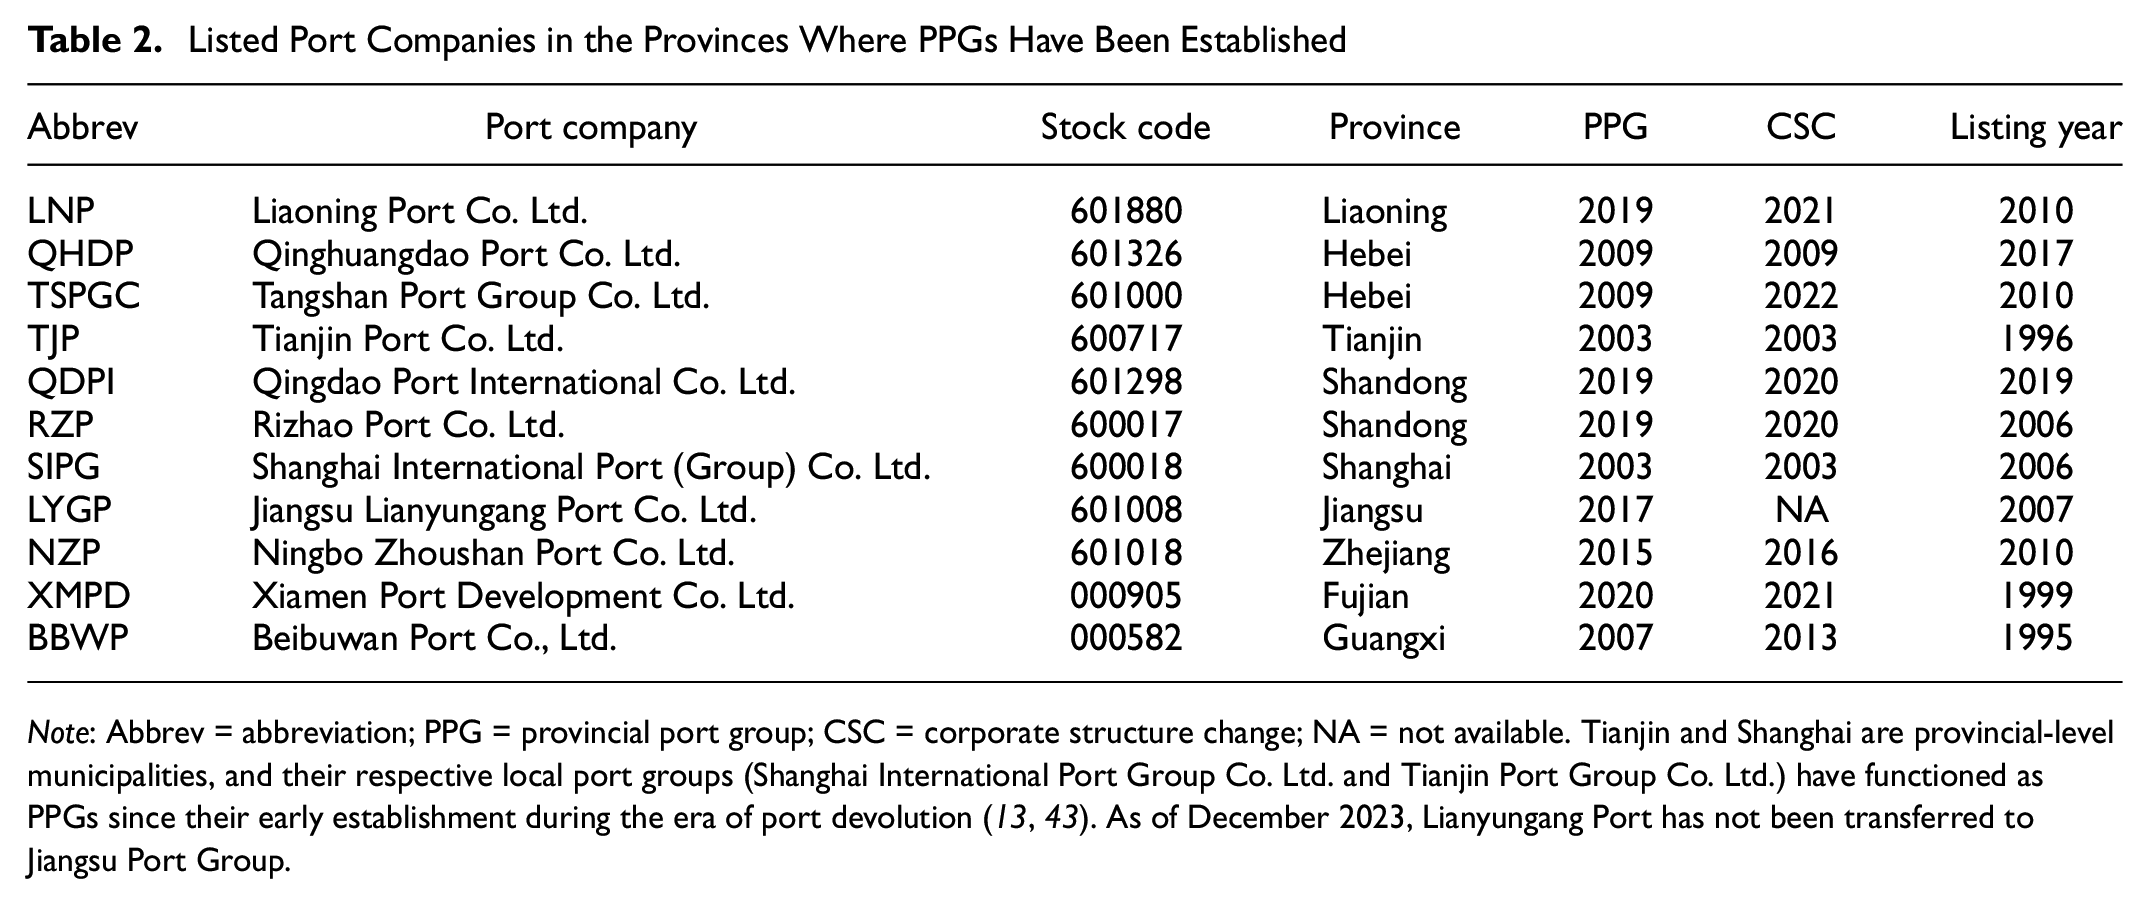
Note: Abbrev = abbreviation; PPG = provincial port group; CSC = corporate structure change; NA = not available. Tianjin and Shanghai are provincial-level municipalities, and their respective local port groups (Shanghai International Port Group Co. Ltd. and Tianjin Port Group Co. Ltd.) have functioned as PPGs since their early establishment during the era of port devolution ( 13 , 43 ). As of December 2023, Lianyungang Port has not been transferred to Jiangsu Port Group.
Input and Output Variables for Super-SBM Model
To run the Super-SBM model for port-efficiency evaluation, the key is the selection of input and output variables for port-efficiency analysis, which involves two distinct perspectives of production and finance. From a production perspective, port production depends crucially on the efficient use of labor, land, and equipment. The input variables typically include factors such as staff count, terminal area, quay cranes, number of berths, and berth length, with throughput serving as the output variable ( 17 , 19 , 33 , 44 ). From a financial perspective, port efficiency refers to the ratio of benefits to costs in corporate operation (the value creation process), focusing on specific port companies. The appropriate financial indicators include total assets (TA), total operating costs (TOC), net assets (NA), and number of employees (NE) as input variables, and total operating revenues (TOR), net profit (NP), and earnings per share (EPS) as output variables ( 45 – 49 ).
Numerous ports encompass multiple port areas, each potentially managed by multiple port or terminal enterprises. Acquiring production indicators for evaluating listed port companies poses challenges. Additionally, even when production indicators are accessible, their application carries the drawback of providing a holistic view, as ports are often operated by multiple companies collectively ( 45 ). Table 3 shows the financial input and output variables utilized in existing literature to measure the efficiency of the Chinese listed port companies. Considering the principles of accessibility, comprehensiveness, and effectiveness, this paper selects TA, TOC, and NE as input variables, and EPS, TOR, and NP as output variables based on the existing literature. The above input variables consider the inputs of listed port companies from the perspectives of “material,”“capital,” and “labor” costs; the output variables can represent the output scale and economic benefits of enterprises. The unit for TA, TOC, TOR, and NP is million yuan, while the unit for EPS is yuan per share. NE is measured in relation to individuals.
Input and Output Variables in the Existing Studies
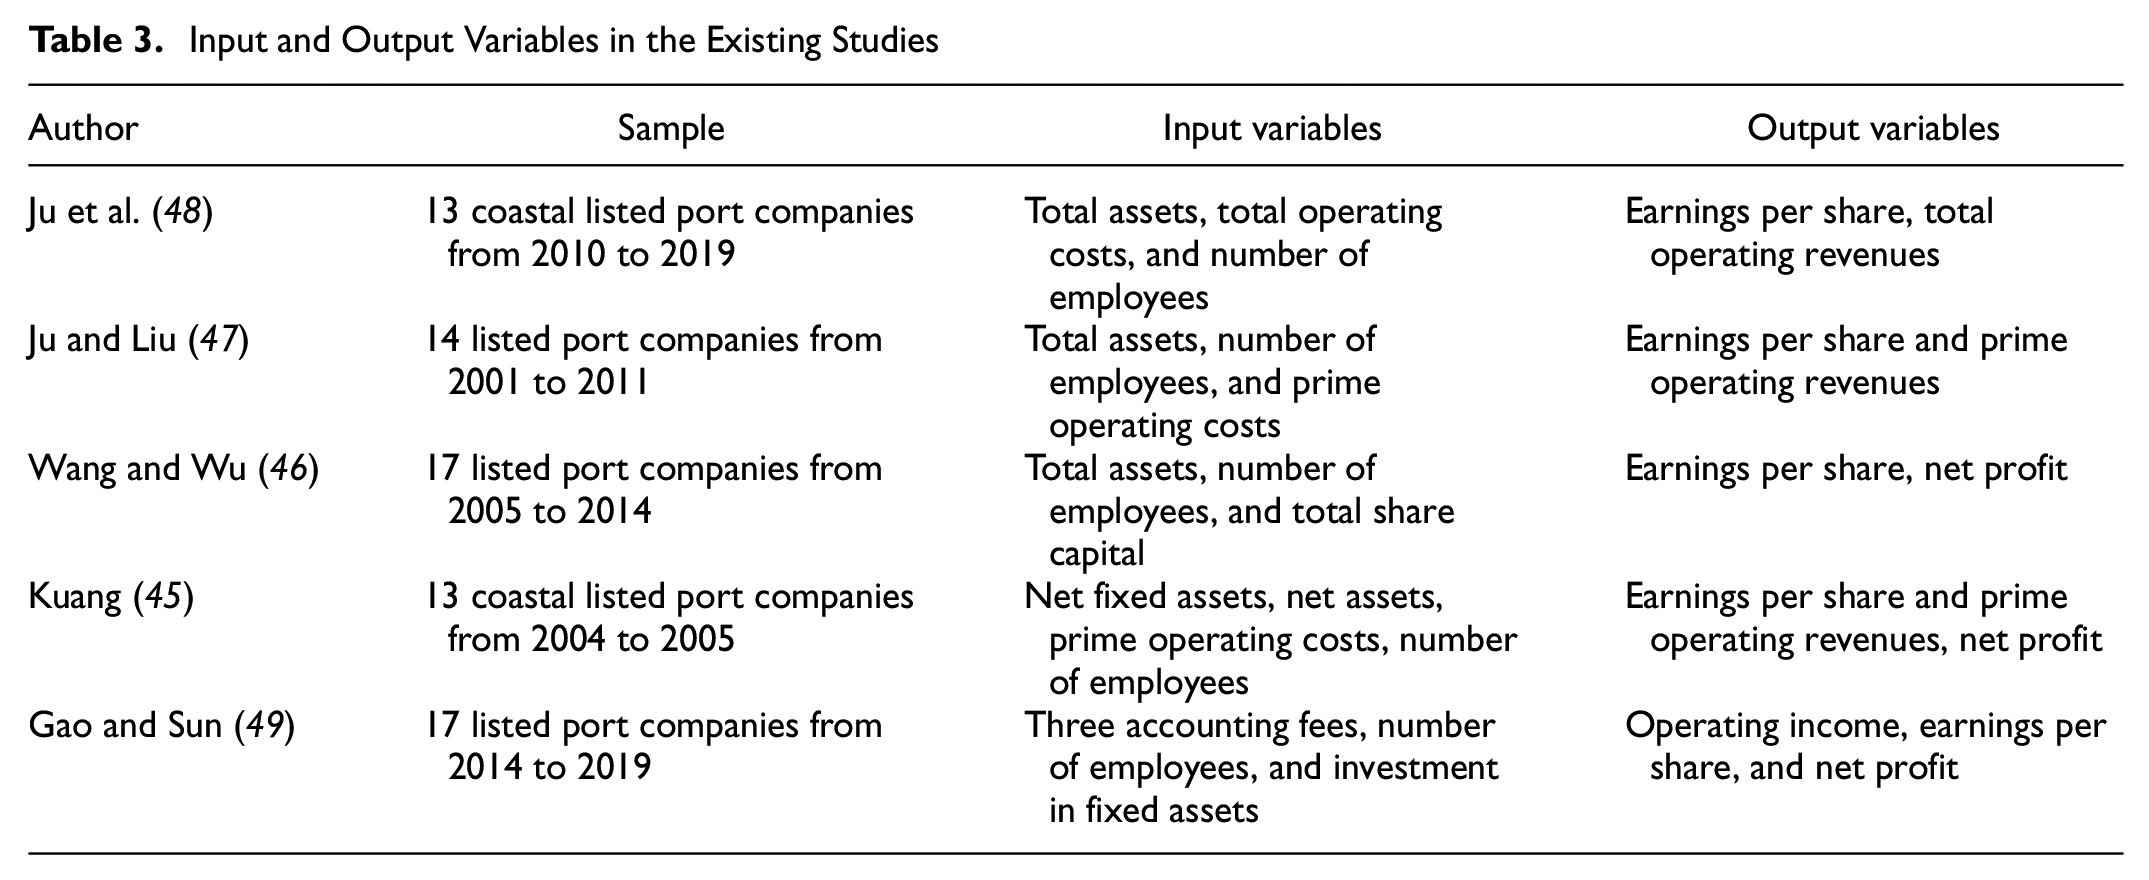
Table 4 reports the descriptive statistics of input and output variables. Since Qingdao Port was listed in 2019 and Qinhuangdao Port was listed in 2017, there is a lack of 15 DMUs in the corresponding years. The values of input and output variables exhibit significant variations across the companies over the years. This implies substantial disparities in both size and operation capacity among the ports.
Descriptive Statistics of Input and Output Variables
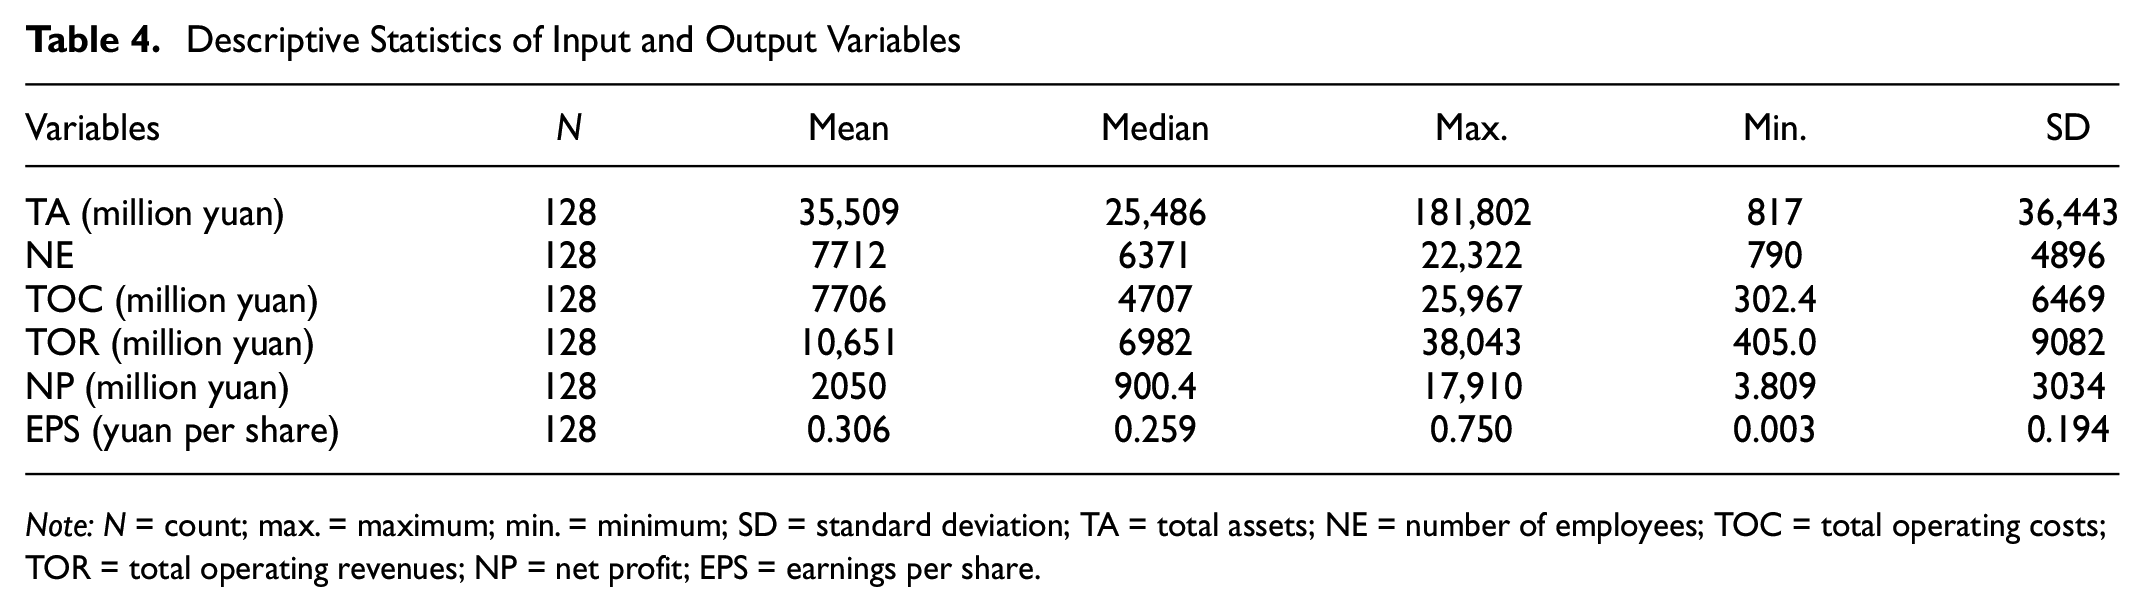
Note: N = count; max. = maximum; min. = minimum; SD = standard deviation; TA = total assets; NE = number of employees; TOC = total operating costs; TOR = total operating revenues; NP = net profit; EPS = earnings per share.
Dependent and Core Independent Variables
After using the Super-SBM model to measure the efficiency of the 11 port companies, to further analyze the impact of port recentralization on port efficiency, this paper takes TE, PTE, and SE of the 11 companies from 2010 to 2022 as dependent variables.
At this stage, the main measure for implementing port recentralization in China is to establish PPGs to uniformly manage and operate ports within each province. This paper uses whether a PPG is established as the core independent variable. It is a dummy variable PPG it , indicating whether a PPG was established in the corresponding province of the listed port company i in year t. If a PPG was established in year t, it is assigned a value of 1 in year t and after, otherwise it is assigned a value of 0. The establishment year of PPG corresponding to listed companies is shown in Table 2.
With the establishment of PPGs, most of the port companies have evolved into subsidiaries of PPGs and changed the corporate structure with shareholding changes and asset restructuring. But there are also companies that had not been transferred to a PPG as of December 2023, such as Lianyungang Port in Jiangsu Province, despite Jiangsu Port Group having been established in 2017. Therefore, when examining the impact of port recentralization on port efficiency of the selected port companies, this paper introduces another independent variable CSC it to verify whether the impact of the CSC on port efficiency is consistent with the impact of the establishment of a PPG on it. As a dummy variable, CSC it indicates whether the listed port company i carried out any shareholding transfer or asset restructuring in year t. If the company changed the corporate structure in year t, it is assigned the value of 1 in year t and thereafter, otherwise it is assigned the value of 0. The year of CSC of listed port companies is shown in Table 2.
Control Variables
Combined with port integration and the actual operations of listed port companies, to control other factors that may affect port efficiency, this paper introduces control variables from both internal and external aspects of the port based on the existing literature. Three factors are selected as internal factors: firm age, listing age, and cargo throughput. The firm age is to eliminate the interference caused by the learning effect ( 19 ). The listing age reflects the company’s internal operation and management level to a certain extent, and cargo throughput is used to reflect the port operation scale ( 18 ). In evaluating external factors, GDP and GDP per capita are selected to assess the economic development level of the hinterland ( 17 , 19 ). Total import and export volume, along with foreign trade dependence, are chosen to depict the level of openness and engagement in foreign trade activities. Foreign trade dependence is defined as the ratio of a province’s total trade (including exports and imports) to its GDP. Additionally, we consider railway, highway, and inland waterway mileage as indicators of transportation capacity ( 17 , 46 ). All external factors are measured by utilizing data from the provinces where the ports are located ( 19 ). All data come from the “China Statistical Yearbook” and the annual reports of listed port companies from 2010 to 2022. The unit of cargo throughput is 10,000 tons, the unit of GDP per capita is yuan, the unit of GDP and total import and export is 100 million yuan, and the unit of railway, highway, and inland river mileage is kilometers, and the descriptive statistics of related control variables are shown in Table 5.
Descriptive Statistics of Control Variables
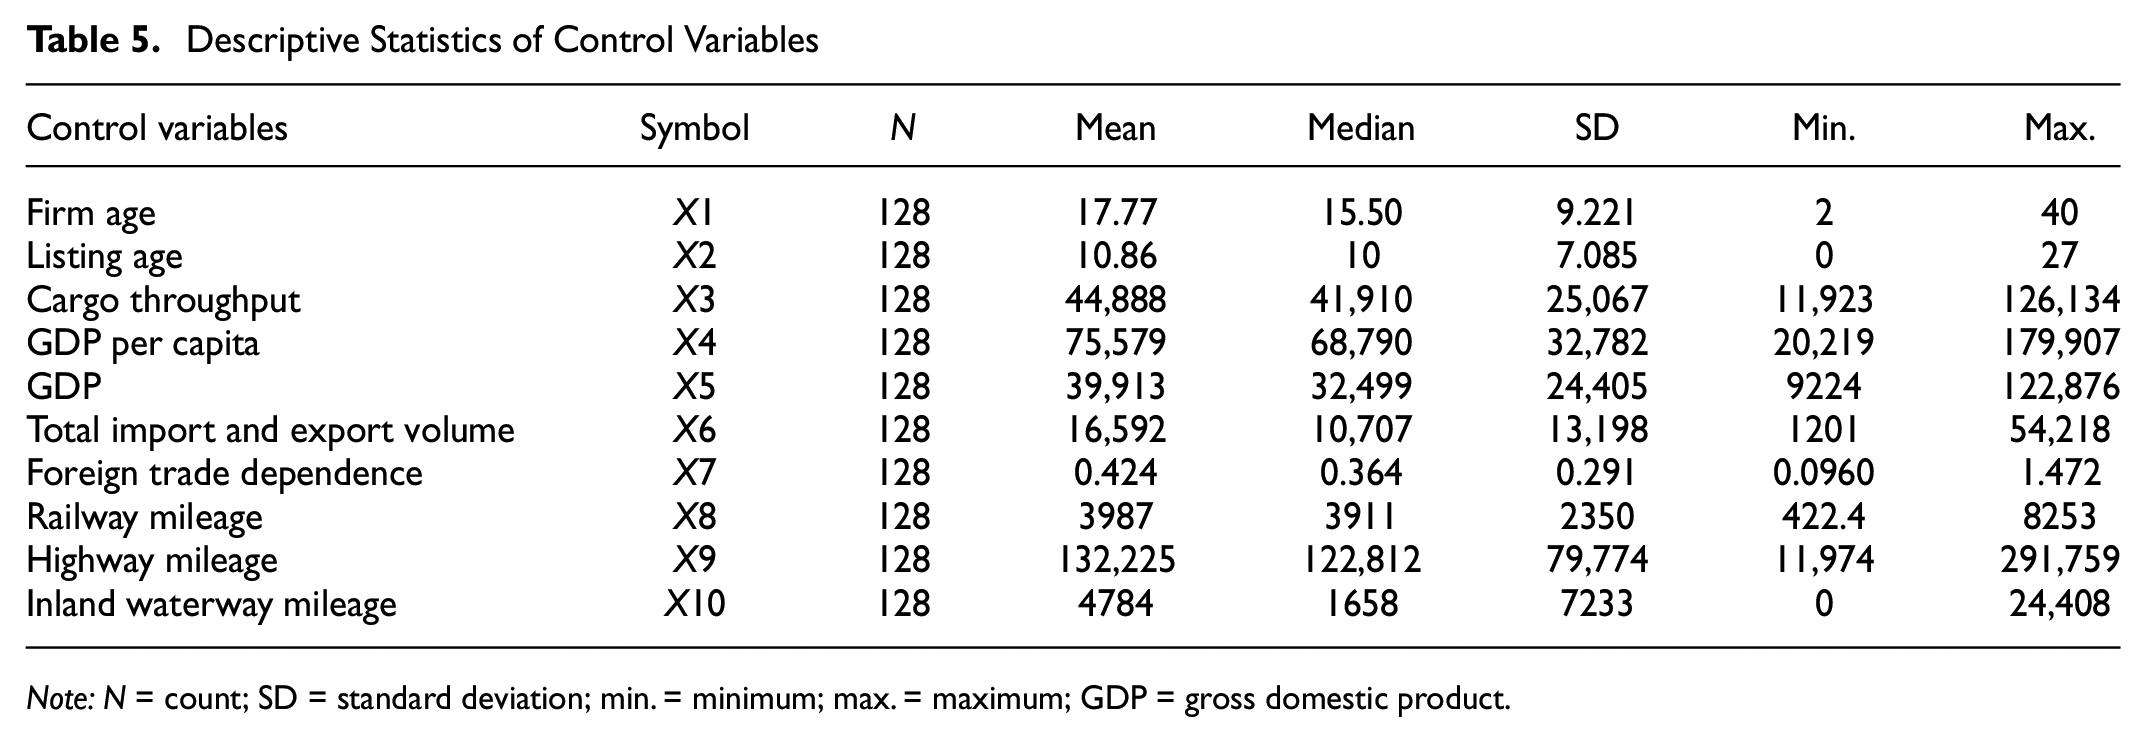
Note: N = count; SD = standard deviation; min. = minimum; max. = maximum; GDP = gross domestic product.
Multicollinearity Analysis of Control Variables
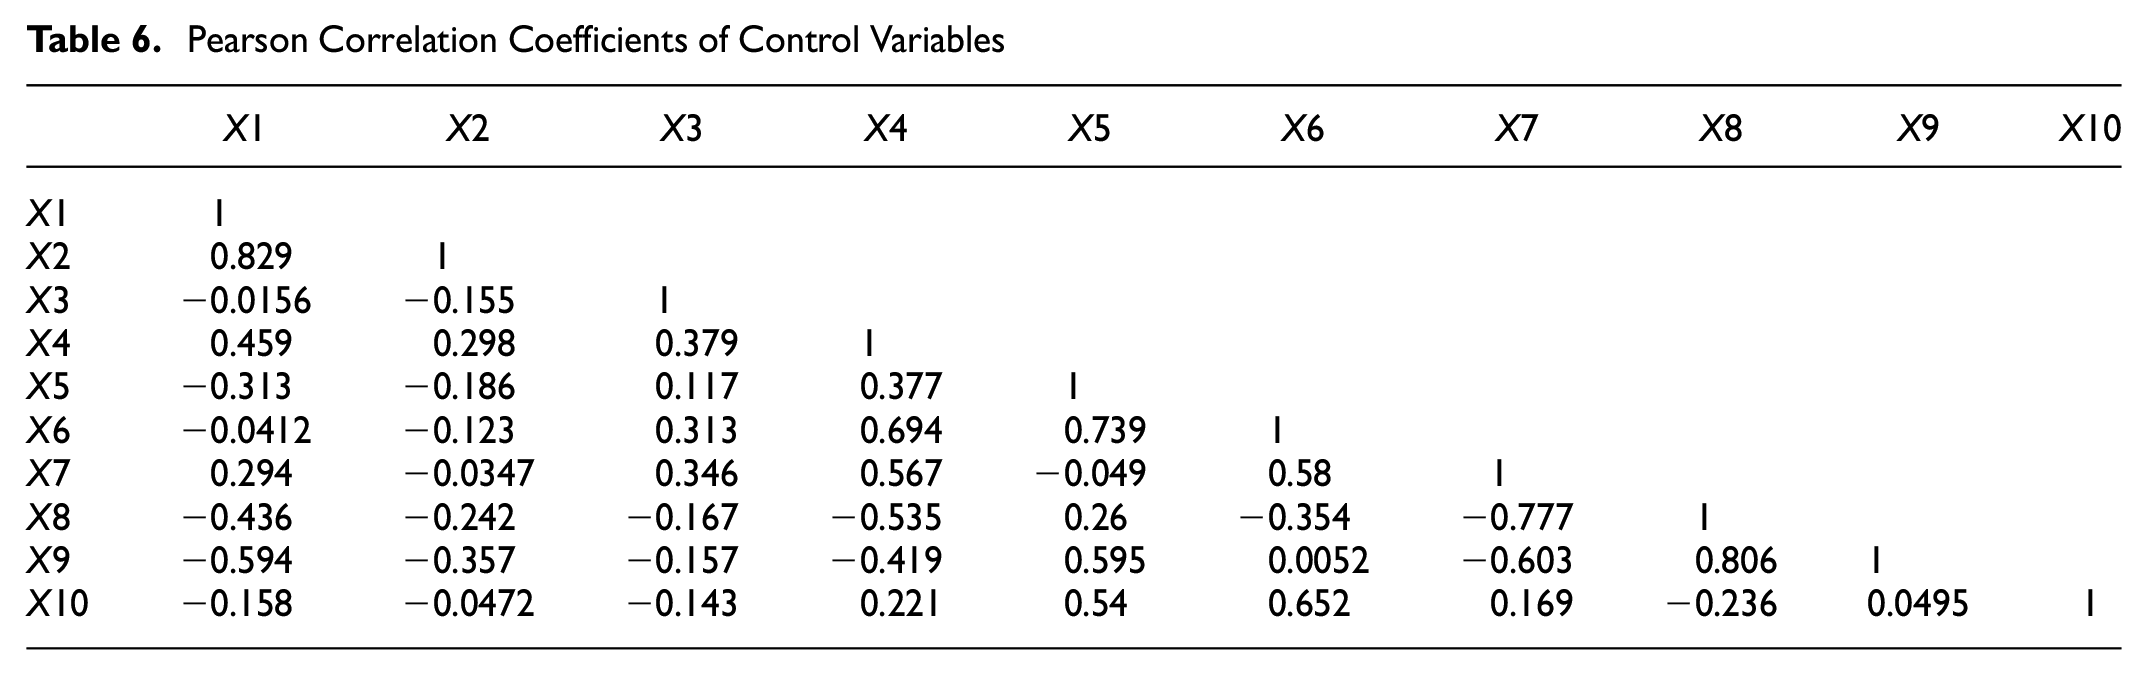
Multicollinearity manifests itself as a high degree of correlation between two or more control variables, that is, the information has an overlapping relationship. If the absolute value of the correlation coefficient between two variables is too high (for example, >0.8), it means that there are likely collinearity problems. The variance inflation factor (VIF) value can also be used to judge collinearity problems. Before undertaking regression analysis, collinearity diagnosis of control variables needs to be performed.
This paper uses the Pearson correlation coefficient and the VIF for collinearity diagnosis. The Pearson correlation coefficient method usually uses its absolute value greater than 0.8 as the standard. The VIF method quantifies the severity of multicollinearity in the multiple regression model, usually with a VIF value >10 as a criterion for judgment ( 50 ).
The control variable Pearson correlation coefficient and collinearity diagnosis VIF results are shown in Tables 6 and 7. The correlation coefficient values of X1 and X2, X8, and X9 are greater than 0.8, and the VIF values of X4, X5, X6, X7, and X9 are greater than 10. Combined with the actual meaning of the control variables and the collinearity diagnosis results, we remove the variables X1, X4, X6, X9; all the new VIF values are less than 10, all tolerance values (1/VIF) are greater than 0.2 (see Table 8). This shows that after removing the relevant variables, the remaining variables have eliminated the collinearity problem and we can proceed to the next step of regression analysis.
Pearson Correlation Coefficients of Control Variables
VIF of Control Variables
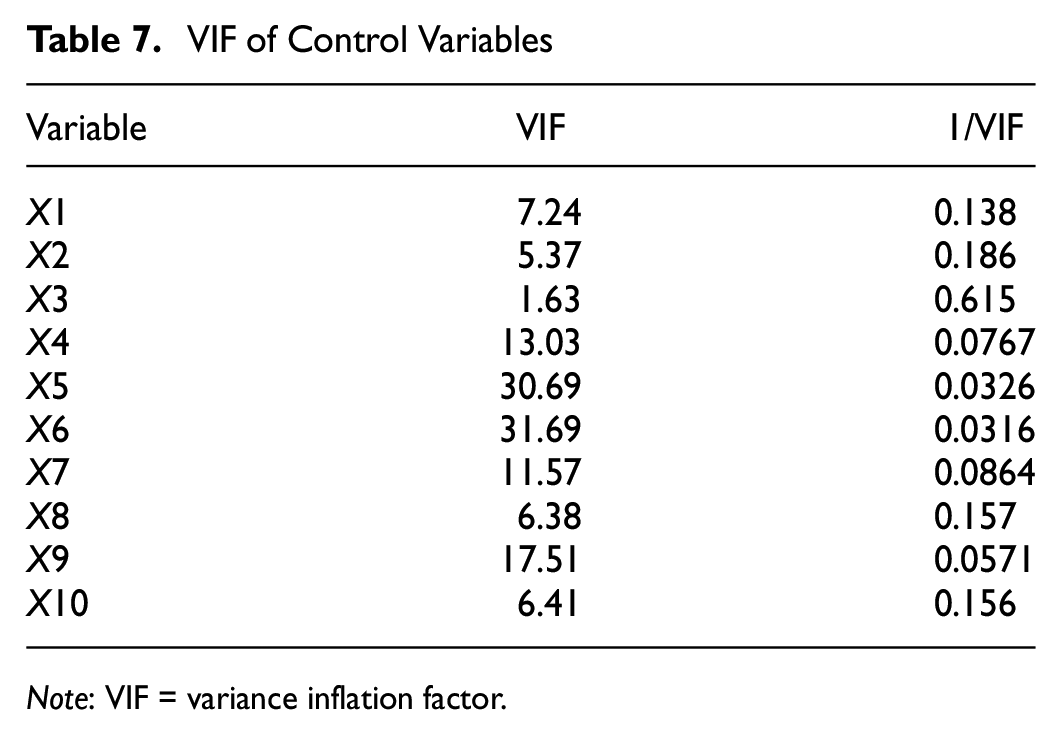
Note: VIF = variance inflation factor.
VIF After Removing the Relevant Variables
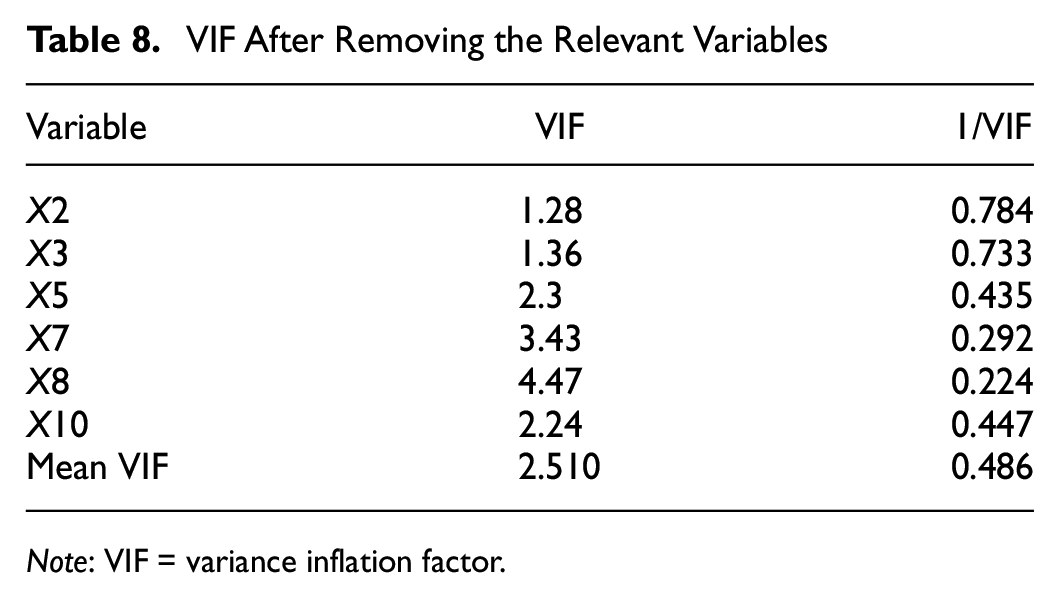
Note: VIF = variance inflation factor.
Empirical Results
Port-Efficiency Analysis
This paper employs the DEARUN software and the Super-SBM model to calculate the efficiency of the selected 11 port companies from 2010 to 2022, and obtains the values of TE, PTE, and SE and returns to scale for each company, as listed in Tables A, B, C, and D of the Appendix. Global efficiency values are calculated for intertemporal comparison, using a total of 128 DMUs with each port company every year as a DMU. Compared with contemporaneous comparison of small samples in the same year, the efficiency values calculated for intertemporal large samples are obviously more likely to be relatively low ( 22 ). The average efficiency of each port company and the year-by-year average efficiency of all listed port companies are shown in Table 9 and Figure 3.
Mean of the Values of TE, PTE, and SE for Each Listed Port Company
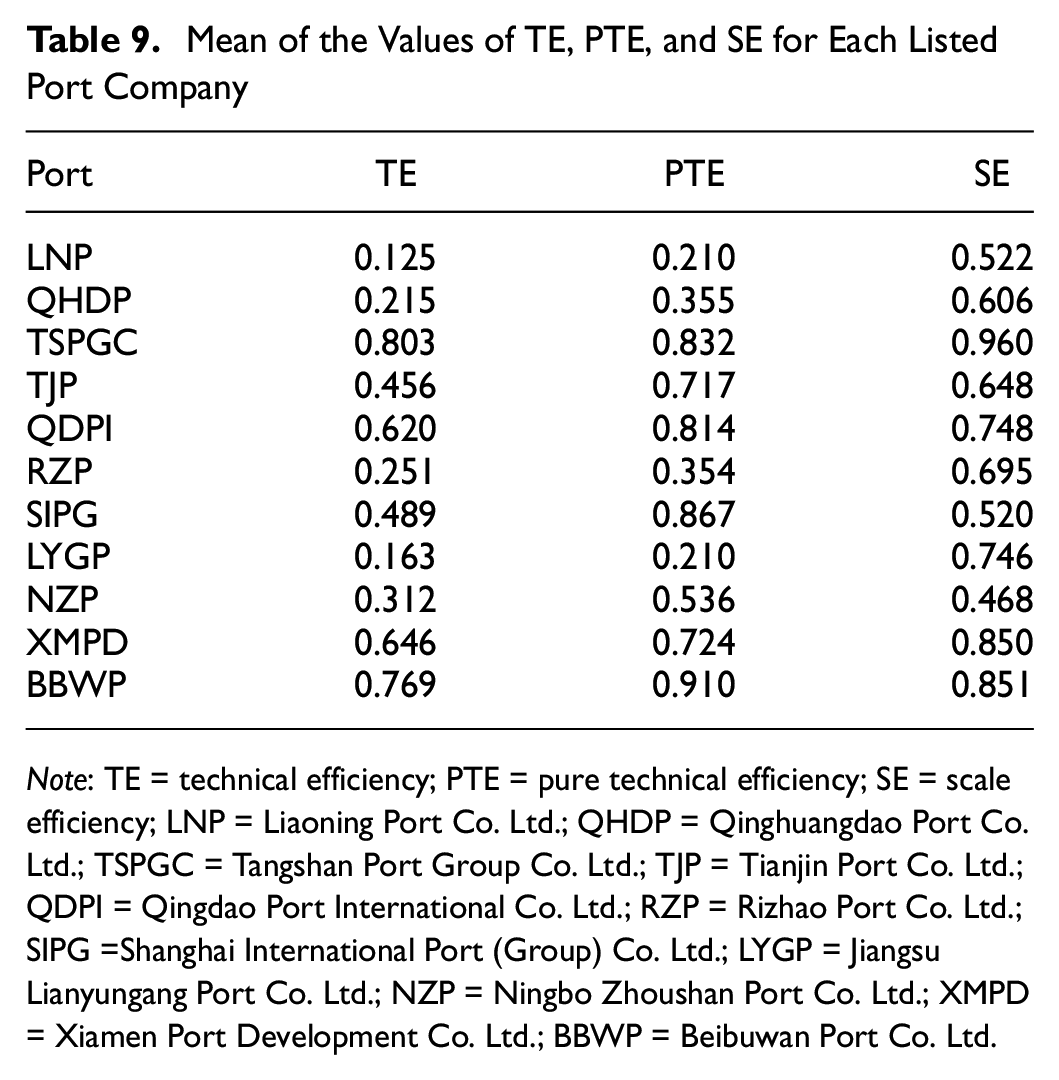
Note: TE = technical efficiency; PTE = pure technical efficiency; SE = scale efficiency; LNP = Liaoning Port Co. Ltd.; QHDP = Qinghuangdao Port Co. Ltd.; TSPGC = Tangshan Port Group Co. Ltd.; TJP = Tianjin Port Co. Ltd.; QDPI = Qingdao Port International Co. Ltd.; RZP = Rizhao Port Co. Ltd.; SIPG =Shanghai International Port (Group) Co. Ltd.; LYGP = Jiangsu Lianyungang Port Co. Ltd.; NZP = Ningbo Zhoushan Port Co. Ltd.; XMPD = Xiamen Port Development Co. Ltd.; BBWP = Beibuwan Port Co. Ltd.
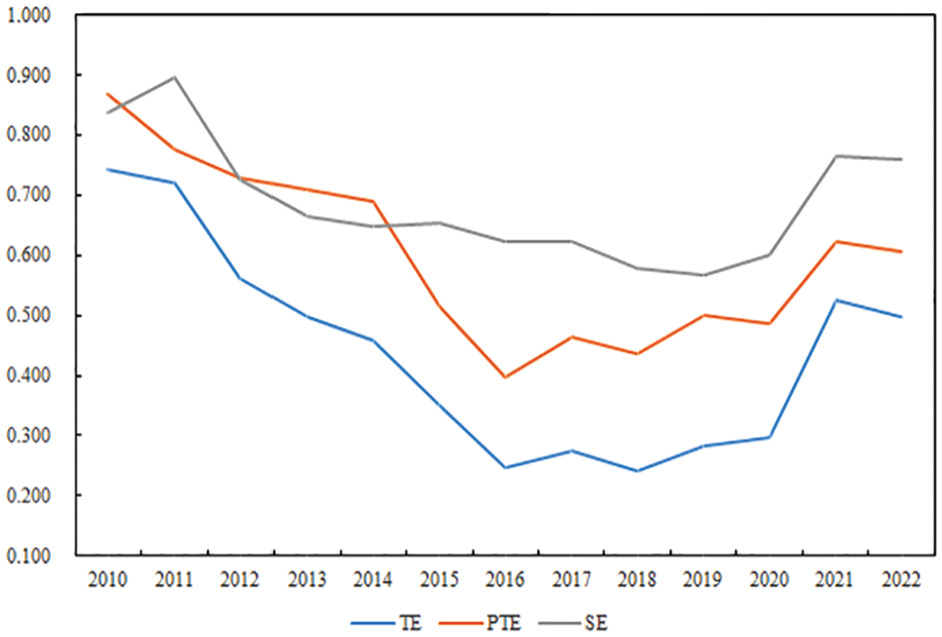
Average port efficiency from 2010 to 2022.
TE consists of PTE and SE. TE indicates the overall efficiency. PTE represents the role of technology and management level while SE indicates the impact of scale on efficiency. From 2010 to 2022, the average TE, PTE, and SE of the 11 port companies were 0.438, 0.600, and 0.688, respectively. Both of the average values of PTE and SE are lower than 1, leading to a relatively low TE. SE is slightly higher than PTE. The result indicates that both internal management technology and scale factors are the main constraints on the overall efficiency of those port companies, with the former having a greater inhibiting effect. As observed in Table D of the Appendix, most listed port companies exhibit decreasing returns to scale in most years, indicating that there is a certain degree of excess scale and overcapacity over these years.
Figure 3 shows the changes in the average efficiency values of TE, PTE, and SE for all listed port companies year by year. As observed, all the TE, PTE, and SE of listed port companies show a trend of first decreasing and then increasing. The TE decreases from 0.742 in 2010 to 0.350 in 2015, then rebounds to 0.498 in 2022. The relatively high efficiency value in 2010 may support that the port-decentralization reform in 2001 improved the efficiency of port companies. With the rapid development of the port industry, the problems of the duplication of port construction, capacity oversupply, and excessive competition have become increasingly prominent, and the efficiency of listed port companies has also begun to decline. To overcome the problems, the port-recentralization reform integrated ports at the provincial level, and the port efficiency may further improve.
From the perspective of horizontal comparison, Tangshan Port, Beibuwan Port, Xiamen Port, and Qingdao Port have larger mean values of TE, with values exceeding 0.6, followed by Shanghai Port, Tianjin Port, and Ningbo Port, with values between 0.3 and 0.5. As regionally important ports, these ports have regional strengths and achieve relatively higher efficiency. The TE values of Rizhao Port, Qinhuangdao Port, Lianyungang Port and Liaoning Port are relatively low, and the values are 0.251, 0.215, 0.163 and 0.125, respectively. The competition and crowding out of benefits from the core ports within the port cluster have resulted in port inefficiency for these four ports. Compared with other ports, the factor input mix, output level, and management level of these four listed port companies listed need to be optimized.
Impact of Port Recentralization on Port Efficiency
T-Test Result
This paper compares the difference in the mean value of port efficiency of listed port companies before and after the establishment of PPG and CSC through a t-test (see Tables 10 and 11). The results confirm that after the establishment of a PPG, the mean value of TE of the selected listed port companies increased by 0.116, which is significant at 10% level, the mean value of PTE increased by 0.194 at the 1% level of significance, and the mean value of SE decreased by 0.036 with no statistical significance. After the changes of corporate structure, the mean value of TE decreased by 0.015, which is not significant, the mean value of PTE increased by 0.122 at the 5% level of significance, and the mean value of SE decreased by 0.137 at the 1% level of significance.
T-Test Results of Port Efficiency Before and After PPG
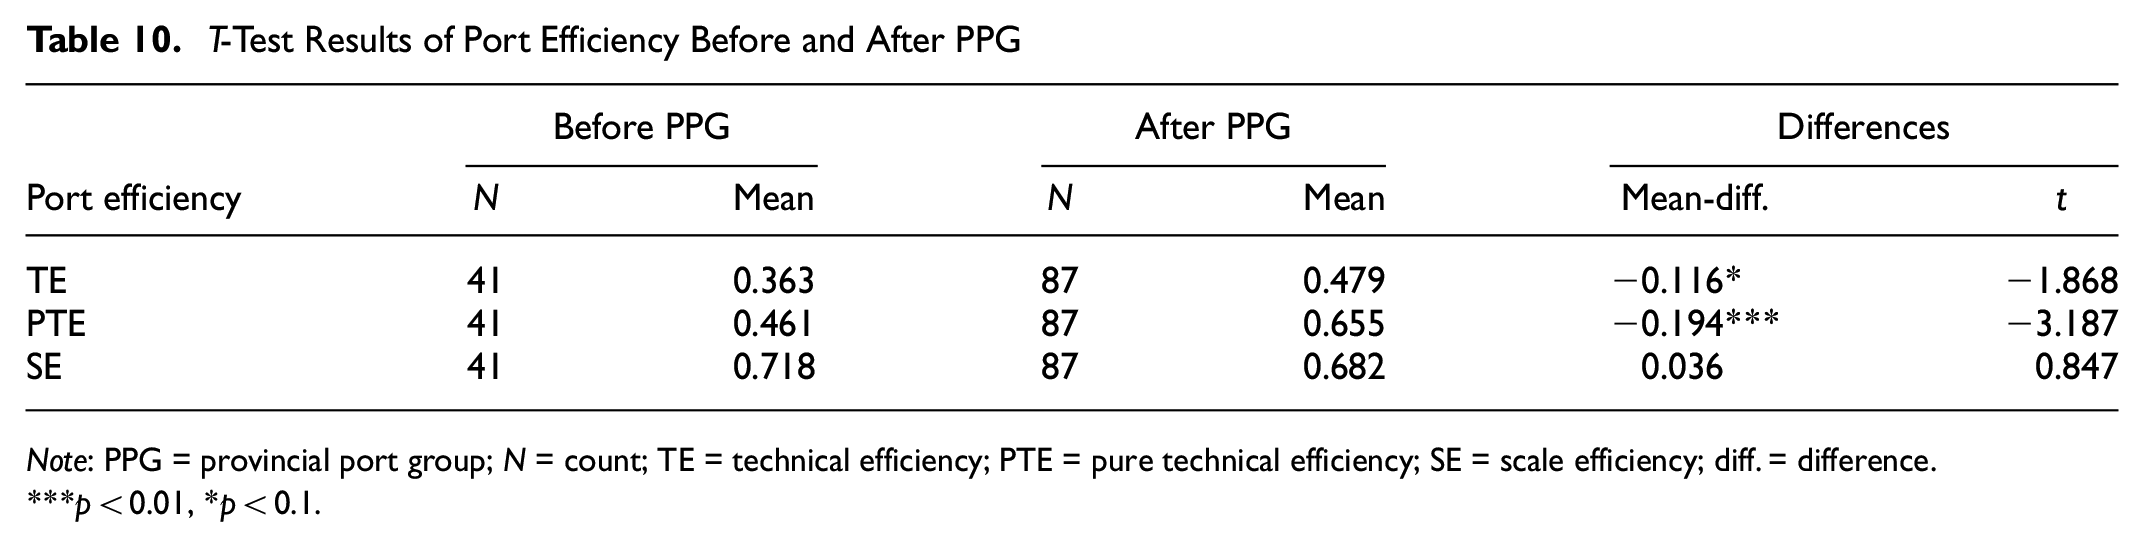
Note: PPG = provincial port group; N = count; TE = technical efficiency; PTE = pure technical efficiency; SE = scale efficiency; diff. = difference.
p < 0.01, *p < 0.1.
T-test Results of Port Efficiency Before and After CSC
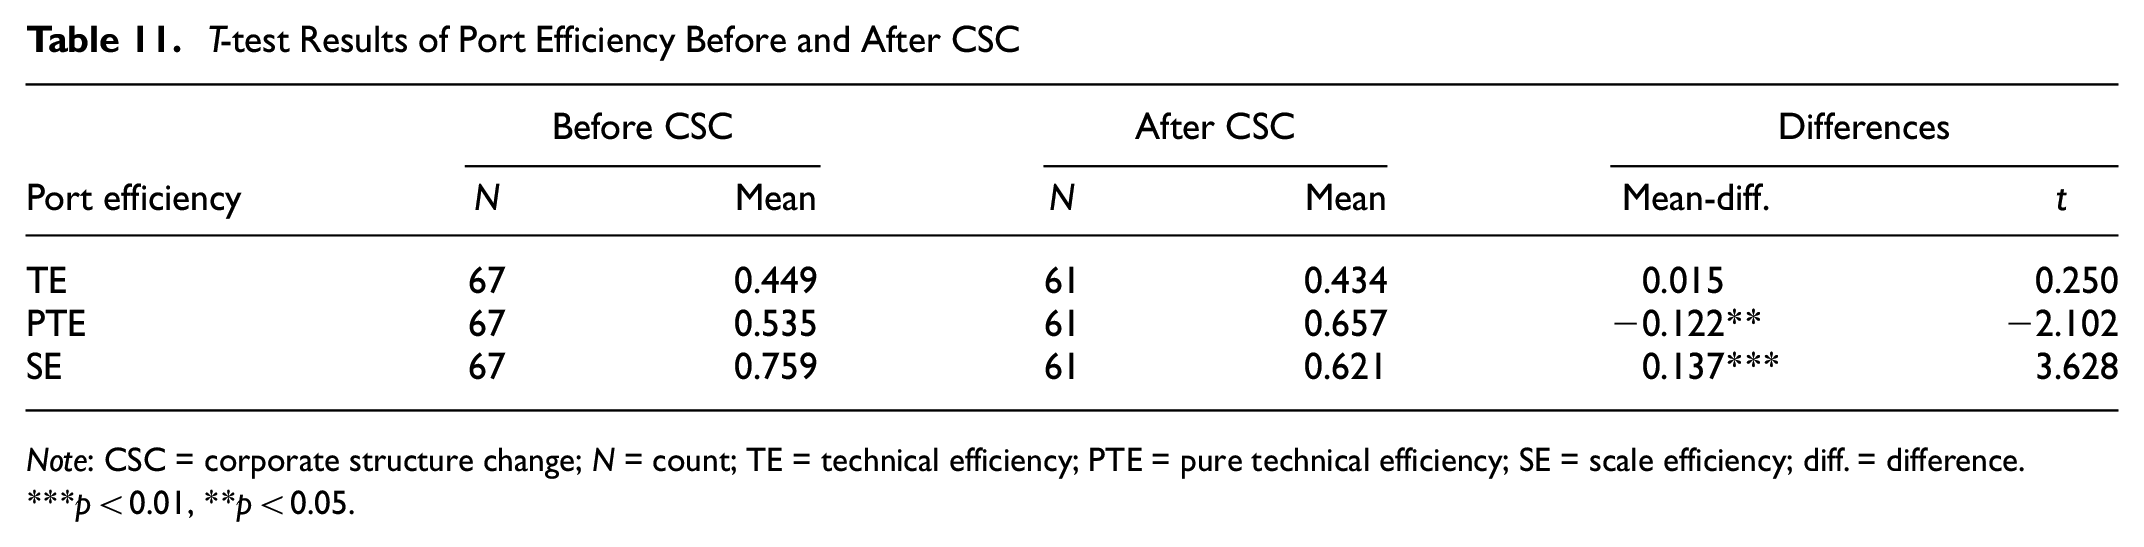
Note: CSC = corporate structure change; N = count; TE = technical efficiency; PTE = pure technical efficiency; SE = scale efficiency; diff. = difference.
p < 0.01, **p < 0.05.
That is, without consideration of other factors, the establishment of a PPG significantly improves the TE and PTE of listed port companies and has an insignificantly negative effect on SE. Changes of corporate structure increase the negative impact on SE, but also improve PTE.
Tobit Regression Analysis
Considering other factors that may affect the efficiency, we conduct the next step of Tobit regression analysis. From the descriptive statistical analysis of the control variables, the data of each control variable differ greatly. To narrow the absolute difference between the data and eliminate the impact of individual extreme values and heteroscedasticity in regression, after taking the logarithm of the control variables X3, X5, X8, X10, the variable symbols are changed to lnX3, lnX5, lnX8, and lnX10.
Stata software is used to perform the Tobit regression on port efficiency and its influencing factors, and the estimation results are presented in columns 1, 2, and 3 of Tables 12 and 13. The regression results are basically consistent with the t-test. After controlling other influencing factors, the establishment of PPG on TE of the port companies has a positive coefficient of influence (0.108), but this positive effect is not significant; the impact coefficient on PTE is positive (0.174) at the 5% level of significance; and the impact coefficient on SE is negative, not significant. The impacts of CSC on TE and PTE of the port companies are not significant, and the impact on SE is significantly negative.
The Impact of PPG on Port Efficiency
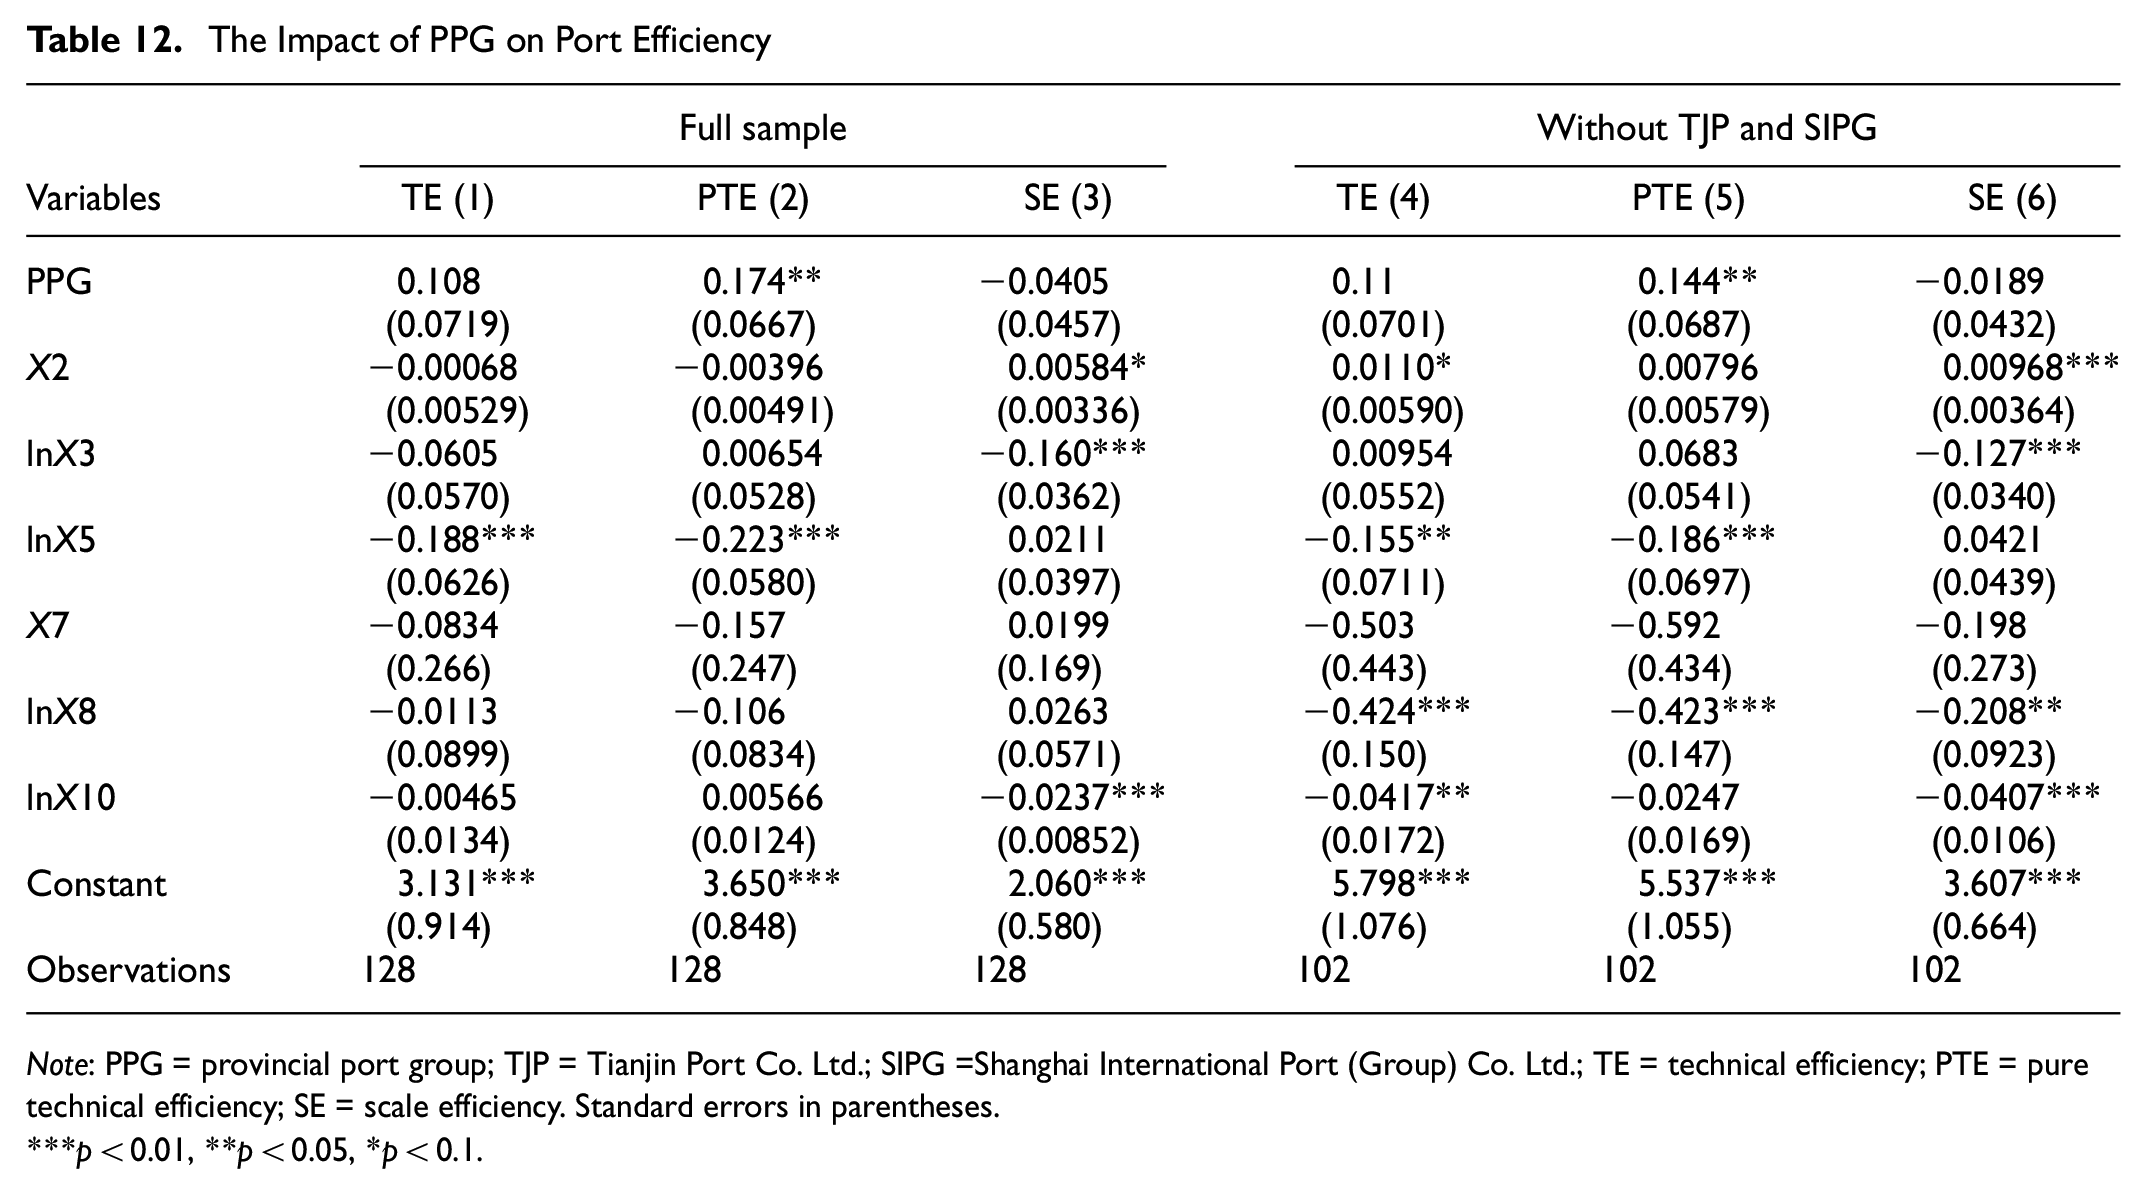
Note: PPG = provincial port group; TJP = Tianjin Port Co. Ltd.; SIPG =Shanghai International Port (Group) Co. Ltd.; TE = technical efficiency; PTE = pure technical efficiency; SE = scale efficiency. Standard errors in parentheses.
p < 0.01, **p < 0.05, *p < 0.1.
The Impact of Corporate Structure Change on Port Efficiency
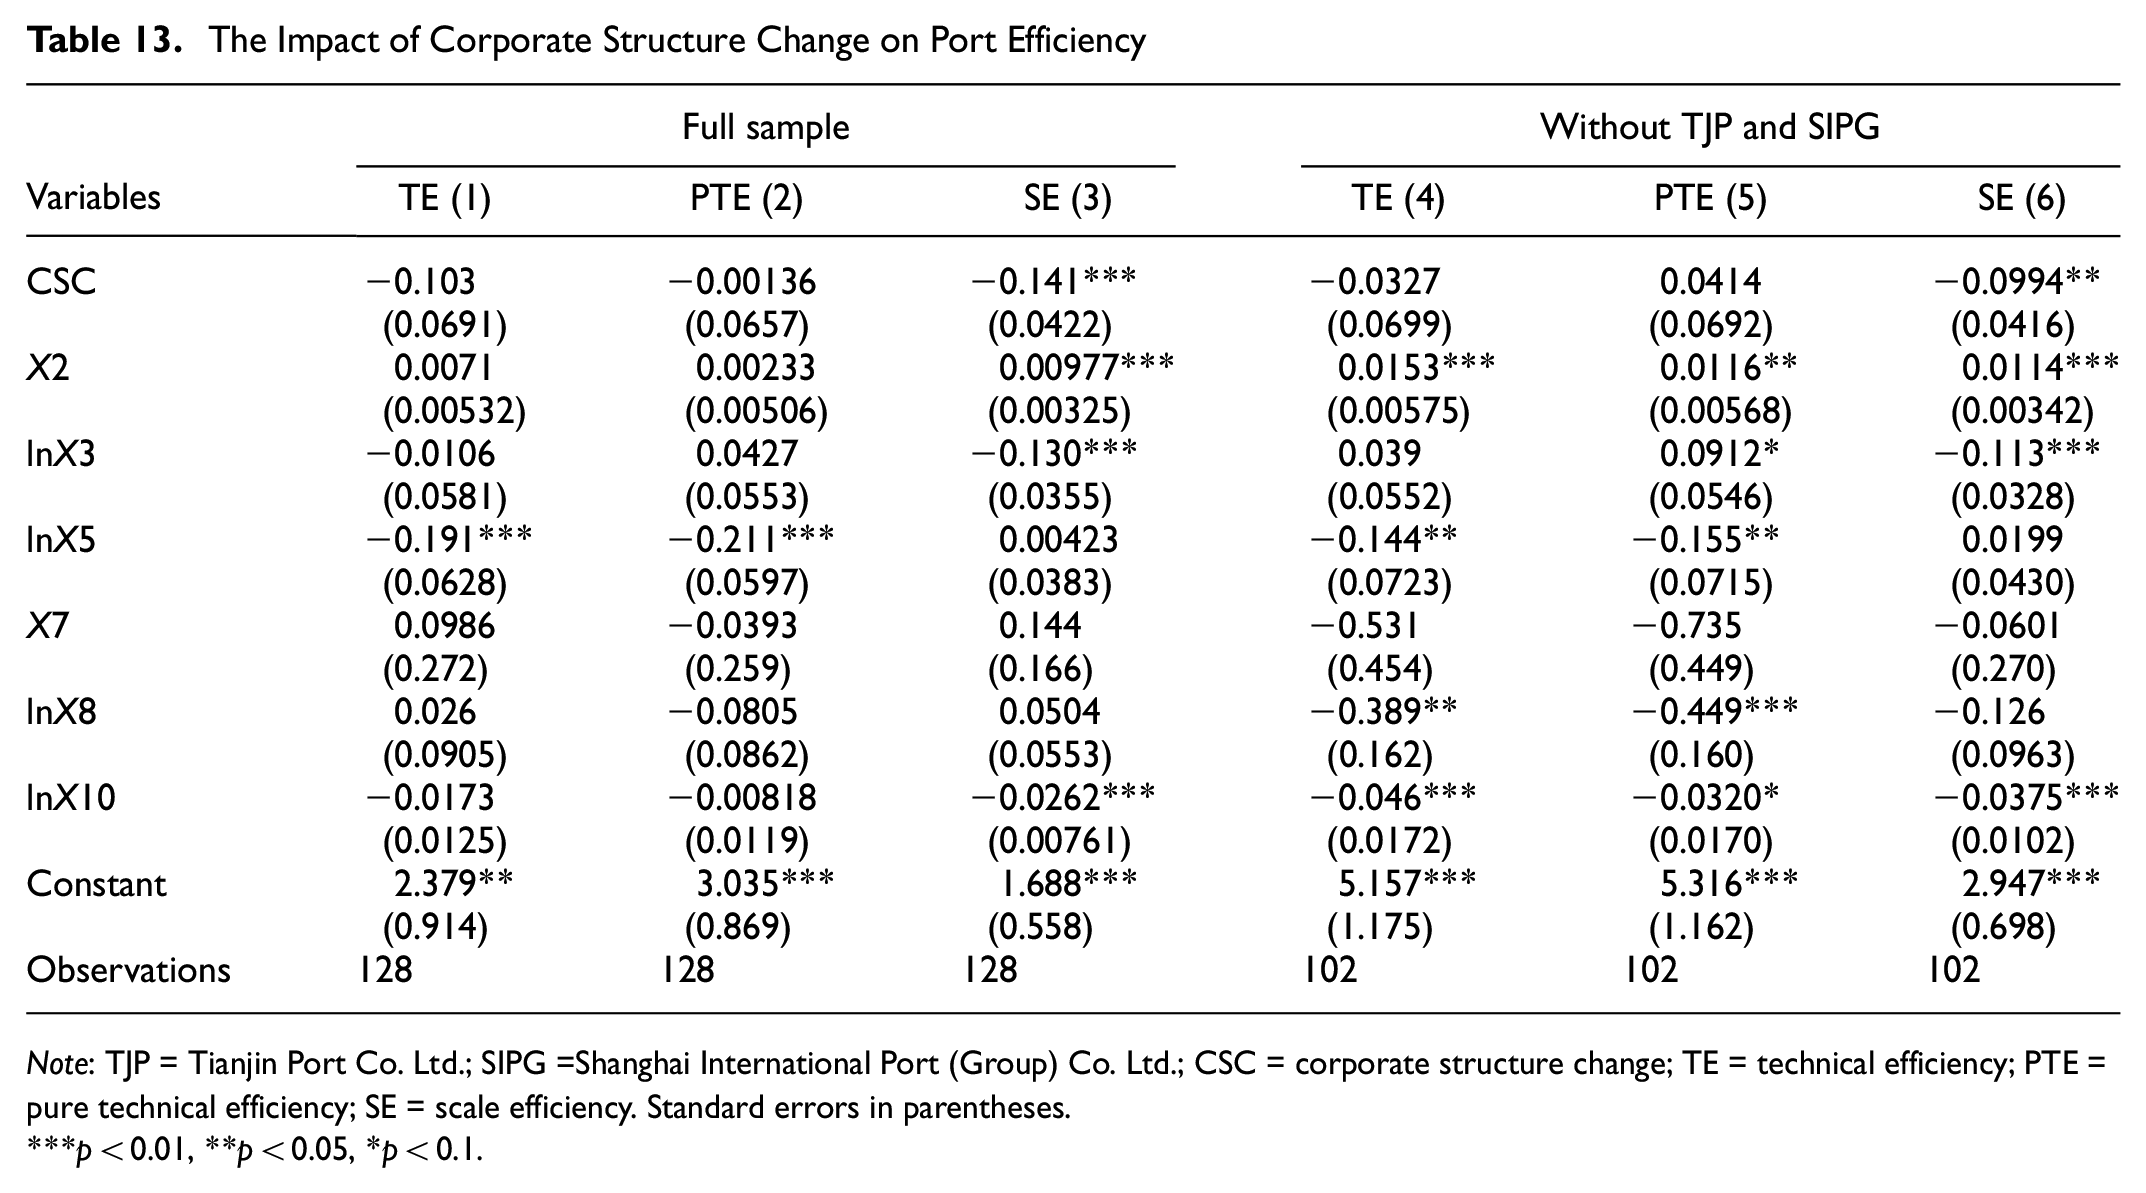
Note: TJP = Tianjin Port Co. Ltd.; SIPG =Shanghai International Port (Group) Co. Ltd.; CSC = corporate structure change; TE = technical efficiency; PTE = pure technical efficiency; SE = scale efficiency. Standard errors in parentheses.
p < 0.01, **p < 0.05, *p < 0.1.
The potential reasons for the above findings are as follows: after the establishment of a PPG, the advantageous resources of all parties can be gathered to realize financial synergy, management synergy, and operational synergy of each port by strengthening inter-enterprise ties and business cooperation. The establishment of a PPG significantly improves the internal operation and management level of listed port companies, but there is no enhancement of scale efficiency, even a certain inhibition, though this inhibition effect is not significant. Changes of corporate structure increase the negative impact on SE. After the offset of PTE improvement and SE reduction, the effect on the improvement of overall TE is not significant.
Robustness Test
Since Tianjin (TJP) and Shanghai (SIPG) are provincial-level municipalities, and their local port groups (Shanghai International Port [Group] Co. Ltd. and Tianjin Port Group Co. Ltd.) already belonged to the PPGs when the ports were decentralized to the cities ( 13 , 43 ), some studies on port integration excluded Tianjin and Shanghai from their study samples ( 17 ). Likewise, this paper regresses the data of the adjusted sample after deleting TJP and SIPG for the robustness test, and the new results are shown in columns 4, 5, and 6 of Tables 12 and 13. The results are basically consistent with columns 1, 2, and 3 of the full-sample regression analysis. The coefficient of PPG on PTE is positive, and it is still significant at the level of 5%, and the effects on TE and SE are not significant.
In the sample without TJP and SIPG, the inhibitory effect of CSC on SE is still significant. The CSC of the listed port companies did not enhance the TE and PTE of the companies, while there is a significant inhibition on SE. The results indicate that the gap between the actual scale efficiency and the optimal scale efficiency expands after the company’s shareholding change. There is a certain degree of excess in port scale, leading to a reduction in the scale efficiency, and the focus of the reform is on how to utilize the scale effect while maintaining advanced management and technology.
Discussion
From the empirical results, port recentralization cannot necessarily contribute to the overall technical efficiency of publicly listed port companies, as the increase in PTE is canceled out by the decrease in SE. The increase in PTE suggests that PPI is conducive to the improvement of the internal management and technical level of the enterprise. PPGs consolidate provincial ports by combining the resources, capabilities, and core competencies of each port and using them together. Through the sharing and coordination of resources such as terminals, yards, warehouses, and ports, management resources can be more fully and effectively utilized, centralized management can be achieved, management costs can be reduced, and management capacity and efficiency can be comprehensively improved. In particular, the construction of smart ports and green ports, digitalization, and decarbonization require more resources and information-sharing networks as well as legal-system support ( 30 ). By strengthening inter-enterprise ties and business cooperation, the advantageous resources of all parties can be gathered to realize financial synergy, management synergy, technical synergy, and operational synergy for each port. For example, Shandong Port Group integrates the resources of routes, capacity, and customers of all ports in Shandong Province. Other ports can make use of Qingdao Port’s international route resources. Fed by the latter, Qingdao Port’s service efficiency has been greatly improved, with more customers, more cargo sources, and denser international routes. Domestic cargoes arriving at any port in Shandong can be shipped directly to the destination country through international routes without further transit through Busan Port.
However, the decrease in SE indicates the need to focus on the adverse impact of reform. Port recentralization is accompanied by an increase in company scale, and in a situation of diminishing returns to scale, the inability to achieve greater output implies a reduction in scale efficiency. The decrease in SE warns managers to pay attention to the scale expansion during the reform. They need to find a balance between scale growth with operational efficiency to avoid the negative impact of diminishing returns to scale. Therefore, during the reform process, the positive effects of port reform on corporate management and technology levels need to be fully utilized, while the adverse effects on returns to scale should also be noted.
Comparing with similar studies, most existing research focuses on the impact on overall efficiency, overlooking the complex relationship between different efficiency components. However, this research reveals that port recentralization does not necessarily enhance the overall TE of listed port companies. For example, some previous studies simply assume that the integration of port resources always leads to a direct improvement in overall efficiency, while we find that the increase in PTE can be offset by the decrease in SE. This more nuanced finding enriches the existing literature on port-governance reform. It helps the case-study enterprises to better understand their own operational status. They can learn from the successful experiences of resource integration to improve internal management, while being vigilant about the potential negative impacts of scale expansion. At present, port-recentralization reform is not yet common in many countries around the world. However, in countries where it has been implemented, such as Italy and Brazil, the research methods adopted in this study can be applied to evaluate the impact of the reform. This will help understand whether the results are consistent with those of our case study or whether there are differences between countries. These differences may result from various factors such as different economic structures, geographical locations, and regulatory environments. Through further comparative analysis, we can gain a more comprehensive understanding of the port-recentralization reform and provide more targeted suggestions for other countries considering similar reforms.
Conclusion
Port governance in China has been undergoing a reform from decentralization to recentralization, shifting to large-scale port integration at the provincial level. PPI is an important initiative to promote the coordinated development of regional ports and the transformation and upgrading of ports at this stage. Adhering to the government-led corporatization and market operation, PPGs have been established one after another in provinces since 2015. With the transformation from OCOP to OPOP, publicly listed port companies have become the subsidiaries of PPGs, changing from the municipal port groups. Some port companies have carried out shareholding changes and asset restructuring to change the corporate structure. As this is a reversed reform of port devolution, it is of great practical significance to assess the impact of the recentralization on the efficiency of those listed port companies.
From the perspective of economics, this paper takes 11 listed port companies as research objects and employs the Super-SBM model to measure port efficiency, with financial indicators reflecting the operation status of port companies as input and output variables. It not only examines the evolution of port efficiency through decomposing TE into PTE and SE, but also takes the establishment of PPGs and CSC as the core independent variables to conduct empirical study on the effect of the recentralization of port governance on port efficiency.
The main conclusions are as follows. First, the results of port-efficiency measurement show that the average values of TE, PTE, and SE of the listed port companies over 2010–2022 presented a trend of first decreasing and then increasing. It indicates that the promotion effect of the port-decentralization reform in 2001 on port efficiency has gradually weakened, and the problems of overcapacity and efficiency reduction in the port industry have come to the forefront, which provides empirical evidence for the port-recentralization reform in 2015. Most publicly listed port companies exhibit decreasing returns to scale in most years, indicating that there is a certain degree of excess scale and overcapacity. Second, the establishment of a PPG significantly improves the PTE of the listed port companies; however, the improvement of TE is not significant, and there is a certain inhibition of SE, which is not significant. Finally, the CSC of the listed port companies does not appear to enhance their TE and PTE, while there is a significantly inhibitory effect on SE. The CSC expands the enterprise scale to a certain extent, and the gap between the actual scale efficiency and the optimal scale efficiency is enlarged.
This study contributes by empirically revealing the complex micro-level impacts of port-recentralization reform. It offers decision-making insights for port managers and related enterprises, maximizing the positive effects of port reform on management and technology while minimizing its negative impacts on returns to scale. There are still some limitations in this paper that need to be improved in the future. One is that this study measures port efficiency of listed port companies from the perspective of economics, and the input–output variables do not take environmental factors into account, without consideration of green ports and sustainable development. Second, the establishment time of PPGs in some provinces is relatively short, and the business synergy and management synergy within the PPGs need to be integrated for a longer period. Because of the short time span of the existing data, there is a certain limitation in testing the effect of port recentralization on port efficiency of the listed port companies. In the future, efforts can be made to further demonstrate the long-term impact of the reform by collecting data on both financial and infrastructure variables over a longer period. Third, future research can account for regional heterogeneity and include group fixed effects in the modeling, exploring ways to combine elements of different models to provide a more comprehensive analysis.
Supplemental Material
sj-docx-1-trr-10.1177_03611981251344897 – Supplemental material for Impact of Port Recentralization on Efficiency of Chinese Coastal Listed Port Companies
Supplemental material, sj-docx-1-trr-10.1177_03611981251344897 for Impact of Port Recentralization on Efficiency of Chinese Coastal Listed Port Companies by Weiwei Huo, Wenming Shi, Shu-Ling (Peggy) Chen and Wei Liu in Transportation Research Record
Footnotes
Acknowledgements
Thanks to Doubao for assisting with grammar checking.
Author Contributions
The authors confirm contribution to the paper as follows: study conception and design: Weiwei Huo, Wenming Shi, Shu-Ling (Peggy) Chen, Wei Liu; data collection: Weiwei Huo; analysis and interpretation of results: Weiwei Huo, Wenming Shi, Shu-Ling (Peggy) Chen; draft manuscript preparation: Weiwei Huo, Wenming Shi, Shu-Ling (Peggy) Chen. All authors reviewed the results and approved the final version of the manuscript.
Declaration of Conflicting Interests
The author(s) declared no potential conflicts of interest with respect to the research, authorship, and/or publication of this article.
Funding
The authors disclosed receipt of the following financial support for the research, authorship, and/or publication of this article: This research was supported by the Major Project of National Social Science Fund of China (Grant number: 20&ZD070), Top Innovative Graduate Talent Cultivation Project of Shanghai Maritime University (Grant number: 2019YBR015), China Scholarship Council (CSC NO.201908310161).
Data Accessibility Statement
The public data that support the findings of this study are available on request from the authors. Proprietary data used in this study are already presented at aggregate level in the main body of the paper.
Supplemental Material
Supplemental material for this article is available online.
References
Supplementary Material
Please find the following supplemental material available below.
For Open Access articles published under a Creative Commons License, all supplemental material carries the same license as the article it is associated with.
For non-Open Access articles published, all supplemental material carries a non-exclusive license, and permission requests for re-use of supplemental material or any part of supplemental material shall be sent directly to the copyright owner as specified in the copyright notice associated with the article.