
Abstract
The disproportionately high crash rates among young drivers in the U.S. stem from a complex interaction of individual maturity, driving skills, vehicle dynamics, social and financial backgrounds, and environmental factors. Research has found that some of these factors disproportionately affect economically disadvantaged groups in various rural/urban settings. Driver education and training have been employed in many states as mandatory for under-18-years-old drivers to secure junior licenses to equip them with safe driving skills. However, there is a gap in understanding how driver training, economic factors, and urbanicity correlate with developing specific driving skills among young drivers. This study leverages a unique dataset from Ohio, comprising Virtual Driving Assessment (VDA)-measured skills, driver licensing data, and home Census tract characteristics from 2017 to 2019 to analyze 22,490 young drivers aged under 25 years. We analyzed the data using visualization tools and inferential statistics to understand the differences in young drivers’ new skills by three separate variables: their completion of driver training and young driver licensure (DTYL) (licensed before 18 years old), urbanicity of residence, and home neighborhood income level. Results indicated that formal DTYL correlated with better adherence to traffic regulations, consistent braking, and lane position control. Young drivers from lower-income neighborhoods exhibited skill deficiencies in traffic rule compliance, throttle control, and lane management, potentially because of limited access to quality training and vehicle safety features. Conversely, rural young drivers excelled in consistent speed management and traffic rule adherence. These insights underscore the necessity to reevaluate driver education curricula and roadway design to align more closely with comprehensive safety outcomes, and to enhance young drivers’ safety awareness and skill proficiency.
Keywords
Teenage driving embodies a crucial conflict in transportation planning between enhancing mobility and ensuring safety. In the U.S., driving is often essential for teenagers to gain independence, yet it places them at a significantly higher risk of collisions. Despite average miles driven per young driver per year being only half that of adult drivers, 16–19-year-olds faced a fatal crash rate nearly triple that of other age groups in 2022 (1–3). The high incidence of collisions among teenage drivers is influenced by a complex interplay of individual maturity, vehicle dynamics, and environmental factors. Developmental aspects, such as incomplete brain maturation, affect their judgment, reaction times, and hazard perception, heightening their vulnerability on the roads ( 4 , 5 ). Additionally, social and financial background and community infrastructure play pivotal roles in shaping driving behaviors and framing risks, with teenagers from lower economic backgrounds being disproportionately affected by motor vehicle crashes ( 6 , 7 ). Moreover, the specific urban or rural settings where these young drivers live also significantly affect their risk profiles and driving experiences, necessitating location-specific approaches in driver education and safety planning ( 8 ).
Initiatives such as driver education and graduated driver licensing (GDL) have been central to preparing young drivers, though their efficacy in reducing traffic collisions has been debatable ( 9 , 10 ). GDL programs are designed to mitigate risks by progressively increasing driver competence, imposing restrictions on high-risk driving situations, and integrating driver education. Research indicates that drivers who complete formal training and obtain their licenses before turning 18 years old tend to exhibit safer driving outcomes than those who do not undergo such training ( 11 ). However, the accessibility of driver education varies, particularly affecting teenagers from economically disadvantaged backgrounds, suggesting that the lack of such training could become a barrier to acquiring essential driving skills ( 12 ). Despite the recognized links between economic factors, urbanicity factors, and driver training with crash risks, there remains a gap in understanding how these factors are associated with the development of specific driving skills—including observation, hazard anticipation, space management, decision-making, and making changes predictably and smoothly—among diverse groups of young drivers. Filling this research gap is critical for designing targeted driver training modules and implementing infrastructure measures to enhance young drivers’ driving skills and safety.
This study utilizes a unique dataset from Ohio, including Virtual Driving Assessment (VDA) metrics, licensing data, and economic variables, to explore how driver training and different economic factors correlate with specific driving skills. VDA, an innovative driving simulation tool, allows for the assessment of operational, tactical, and cognitive driving skills in a controlled environment, offering insights beyond traditional on-road exams ( 13 ). Our analysis revealed marked behavioral differences among young drivers based on their completion of driver training and young driver licensure (DTYL), the urbanicity of their residence, and income status, with potential implications for targeted driver education interventions. This research enriches our understanding of the intersections between driver education and training, income level, and young drivers’ competencies, aiding policymakers and planners in developing more effective training and infrastructural strategies to reduce traffic crashes involving young drivers. Ultimately, this study contributes to the ongoing dialogue on refining driver training programs to ensure safer driving practices among young drivers.
Literature Review
In the U.S., although teenagers drive less than any other age group, they face a disproportionately high risk of traffic crashes. In 2022, drivers aged 16–19 years, on average, logged about 7,600 mi annually per person—only half the average annual miles per American driver ( 1 ). However, on average, seven teenagers in this age group died per day in motor vehicle crashes, and the fatal crash rate per mile driven for this age group was nearly three times the rate for the rest ( 2 , 3 ). The young drivers are primarily newly licensed, and crash rates are highest immediately following licensure, decreasing substantially within the first 1–2 years of having a license (14–16). Furthermore, the elevated death and injury rates of young drivers stem from a variety of factors, encompassing both environmental influences and personal characteristics. Young drivers transitioning from childhood to adulthood are susceptible to incomplete brain maturation and physical development. Several critical incomplete adolescent developments are closely associated with safe driving, including abilities to render and make judgments, working memory, speed of processing, and so forth ( 5 , 17–19). Also, teenage and young adult drivers are novice drivers who lack the experience to properly attend to hazards because of incomplete development of situational awareness and hazard detection ( 20 , 21 ). Compared with older drivers, teenagers are more likely to speed and accelerate unsafely, abruptly change lanes, follow too closely, drive under the influences of alcohol and substances, and drive without wearing seat belts ( 22 , 23 ).
Young drivers are also influenced by their driving environments, which encompass a range of physical, social, and economic factors that contribute to driving behaviors and crash risks. Physical conditions such as road infrastructure, traffic dynamics, and land uses all play a critical role in crash risks ( 24 , 25 ). Urbanicity serves as a broad proxy delineating spatial distributions of such factors, delineating the unique challenges and risks associated with different areas. For example, urban environments often feature complex road networks and high traffic density, and young urban drivers face a higher risk of multi-vehicle crashes than their peers in rural areas ( 8 ). In contrast, rural areas typically have less congested roads, but the driving conditions—such as the prevalence of curved roads—are associated with higher likelihood of single-vehicle crashes caused by speeding ( 8 ). These environmental differences crucially shape the risk profiles for young drivers and raise important questions about how frequent driving exposure to various driving contexts influences the development of specific driving skills differently between young urban and rural drivers.
Furthermore, social influences from family and peers also shape young drivers’ driving behaviors, with the presence of other teenage passengers linked to increased crash risks ( 6 ). Additionally, economic factors determine young drivers’ access to well-maintained vehicles, the purpose of their ordinary driving trips, and how much training and insurance they may have. State and local policies—such as seat belt laws, drinking restrictions, and auto insurance policies—influence their perception of safe driving ( 27 ).
Significantly, crash risks and severities are not uniform across all populations of young drivers. Like other public health challenges, road traffic safety in the U.S. is an equity issue. Numerous studies have examined the extent to which financially disadvantaged groups are disproportionately represented in traffic crashes ( 7 , 28–30). These disparities in death, disability, and injury continue to exist for vulnerable teenagers ( 31 , 32 ). Research of risky driving behaviors among economically disadvantaged teenagers attempts to find the reasons underlying these disparities, yet no holistic picture has been revealed. A study using the Fatality Analysis Reporting System found that higher percentages of those with only a high school education had high blood alcohol concentrations or did not use seat belts compared with those with a higher level of education ( 7 ). The remaining question is, apart from the higher propensity of risk-taking behaviors, are these disadvantaged teenage drivers adequately and equally equipped with knowledge and skills for safe driving?
Driver education and GDL programs have been implemented in the U.S. to better equip teenagers with necessary driving skills ( 33 , 34 ). However, the effectiveness of driver education programs in reducing crash rates has been debated, with studies such as the DeKalb study indicating minimal impact on long-term safety outcomes ( 9 , 35 ). This controversy has led to significant shifts in policy and educational approaches, including the adoption of GDL systems that emphasize gradual skill acquisition and incorporate driver education, to varying extents across different states ( 10 , 36 , 37 ). As of 2022, only 29 states required driver education and behind-the-wheel (BTW) training in addition to GDL ( 37 ). For instance, Ohio’s GDL laws require that a teenager under the age of 18 years must engage in a minimum of 8 h of BTW instruction with a licensed instructor—costing up to $600—in addition to 24 h of in-person or online driver education and 65 h of practice with a licensed guardian if they intend to secure a probationary license before the age of 18 years.
The introduction of GDL laws and, thus, the addition of the requirement for more time and formal and/or informal driver training before licensure, appears to have reduced the rate of teenagers receiving early driver’s licenses ( 38 ). Studies have shown that socioeconomic status significantly influences the age at which teenagers are licensed, with youths from lower-income families less likely to obtain their licenses early ( 12 , 39–43). This delayed driver licensing has significant safety implications, as it may limit driving experience as well as the acquisition of adequate driving knowledge and skills. Specifically, recent research revealed that teenagers who completed the requirements of GDL—including driver education and formal BTW training—were less likely to crash than older teenagers who were not required to engage in formal and informal training ( 11 , 44 ). What remains unclear to researchers is how completing GDL-required driver education and training and obtaining young driver licensure are associated with developing specific driving skills.
Despite decade-long research on the efficacy of driver education and GDL programs, gaps remain in our understanding of how effectively these programs address the disparities in driving skills acquisition among young drivers. Traditional metrics, such as crash counts and passing on-road exams, often fall short in comprehensively capturing and evaluating nuanced young driver skills ( 34 , 45 , 46 ). Crashes are rare and do not accurately reflect everyday driving behavior or near-miss incidents, which are critical to understanding actual driving competence. Moreover, on-road exams may not consistently expose drivers to varied traffic conditions or sufficiently test their readiness, highlighting the need for more reliable evaluation methods ( 47 ).
In response to these evaluation challenges, recent advancements have led to the development of driving simulators such as VDA. Driving simulators, in general, have advantages in providing a safe, systematic, and reliable way for evaluating novice drivers’ skills in various settings, without real-world risks and external distractions ( 48 , 49 ). Implemented as a supplement to traditional testing methods in the Ohio Bureau of Motor Vehicles (BMV) workflow, VDA—a compact, computer-based, self-directed simulator designed by Diagnostic Driving Inc.—assesses drivers in ecologically relevant scenarios that reflect common severe crash situations ( 13 ). VDA features an automatic transmission and contains 10 routes, randomly assigned to each participant, which vary in settings (urban and suburban), road features, and the presence of other road users, such as construction zones, school buses, and pedestrians ( 13 ). Each VDA includes an introductory practice drive to allow participants to get familiar with the simulated driving controls and to practice starting, stopping, and turning, with a quiz to check knowledge of the driving controls before starting the assessment. VDA’s capabilities extend beyond traditional testing by systematically evaluating a range of driving skills from basic operational to complex tactical abilities, such as car control, lane positioning, headway maintenance, and hazard awareness. Notably, VDA has demonstrated a strong predictive validity for licensing outcomes and post-licensure crash probabilities, underscoring its potential as a transformative tool in driver education research ( 11 , 13 ).
Therefore, while prior work has shown variability in VDA skills at the time of licensure, there is a gap in understanding why teenage drivers develop different levels of safe driving skills ( 13 ). Are these disparities in safe driving skills acquisition associated with driver education and training, home neighborhood urbanicity, and income level? This paper aims to address these questions, utilizing access to a unique dataset from Ohio that includes VDA-measured driving skills at the time of license examination, linked to the driver licensing database, and now census tract data. This approach not only highlights the disparities in skill development but also provides a critical evaluation of current educational strategies in the context of real-world driving environments.
Methodology
Study Area
This study focuses on the state of Ohio, in light of the access to a unique dataset and the state’s generalizability and practical significance. First, the close partnership of our research team with the state of Ohio and its VDA program allows us to access extensive and exclusive driver licensing and VDA data (see more in the Data Sources section). Geographically, Ohio encompasses densely urbanized cities (e.g., Cincinnati, Cleveland, and Columbus), suburban areas, and rural lands (see Figure 1). The variety of typologies makes Ohio a robust study area for understanding how various geographic contexts may influence young drivers’ skill development. Additionally, Ohio’s GDL laws require a teenager under 18 years old to complete the paid driver education program to receive an intermediate license, which is not mandatory in many states, such as the neighboring state of Pennsylvania. This requirement means accessing and completing driver education and BTW training is critical for Ohio teenagers to gain mobility and safety compared with teenagers in many other states. Thus, studying DTYL’s relationship with specific driving behaviors and skills is critical for suggesting targeted driver training modules. The state of Ohio has expressed interest in investing in its ongoing driver education scholarship program and future GDL policymaking, highlighting the timeliness of this research.
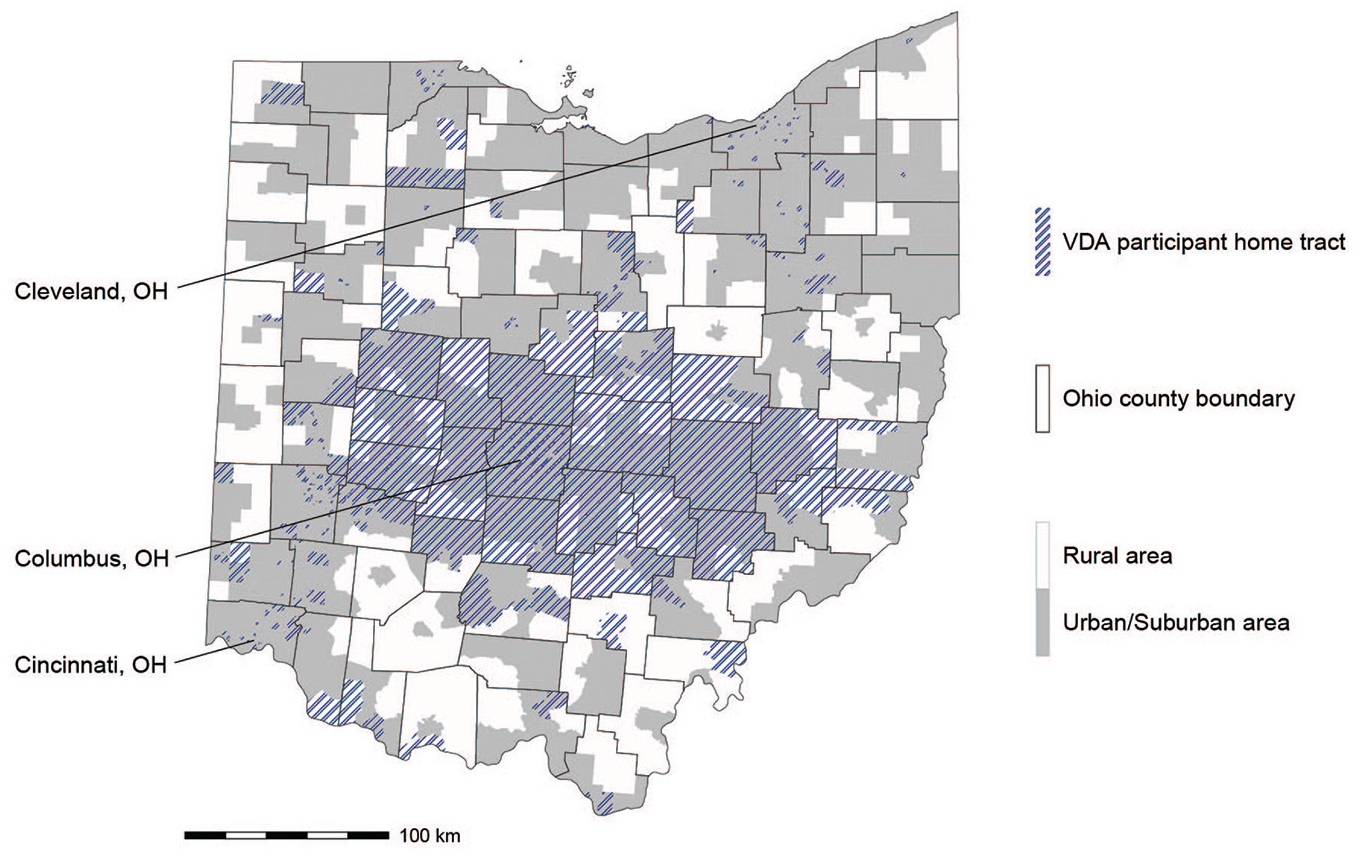
A map showing Virtual Driving Assessment (VDA) home tracts, rural areas, and urban/suburban areas in Ohio.
Most VDA young participants came from urban or suburban tracts. Over 83.5% of the participants lived in the Columbus Metropolitan Area, over 14.5% of the participants lived in the counties bordering the Columbus Metropolitan Area, and less than 2% of the participants lived in north and south Ohio.
Data Sources
This quantitative study leverages a novel dataset for researching young driver behaviors: the Ohio VDA test data, obtained through a collaborative effort with the state of Ohio. In 2015, the Ohio legislature endorsed House Bill 53, which allocated funds to the Ohio BMV for integrating simulated driving assessments into the licensing process. This initiative led to the “Ohio–Ready, Test, Drive!” program, which implemented VDA at five BMV locations in and around the Columbus Metropolitan Area, allowing license applicants to take a virtual driving test right before their on-road exam. A data operations team at the Children’s Hospital of Philadelphia (CHOP) prepared a de-identified dataset for analysis, adhering to the data privacy agreements established between the state of Ohio and CHOP. Consequently, CHOP determined that this study was exempt from Institutional Review Board oversight.
We linked the VDA dataset collected from 2017 to 2019 with the BMV licensing database, which includes variables for license status and outcomes, and a variable indicating if driver license applicants completed driving training before the license examination. This integration utilized de-identified customer identifiers and matched VDA test dates with driver’s license issue dates, since a small portion of driver license applicants participated in VDA tests multiple times on different days. The resulting dataset allowed us to identify young drivers (under 25 years old) who had completed DTYL before the age of 18 years.
Further enriching this dataset, we incorporated socioeconomic data by extracting the median household income for each driver’s home Census tract from the American Community Survey (2014–2018 5-year estimates). Then, we categorized the tracts into low-, middle-, and high-income levels based on U.S. Department of Housing and Urban Development guidelines, which use less than 80% (low-income), between 80% and 120% (middle-income), and more than 120% (high-income) of the area’s median family income to define households’ eligibility for certain programs. The Ohio Housing Finance Agency estimated a median income of approximately $56,000 for the state of Ohio in 2018. Therefore, we used the breakdowns of ≤$44,800, $44,800–$67,200, and >$67,200 to categorize Ohio Census tracts’ median household income levels as low, middle, and high, respectively.
To ensure robust and straightforward urbanicity comparisons, we classified urban typologies using the 2018 U.S. Census Bureau TIGER/Line® Urban Areas Shapefiles, which is the mapping file documenting the Census Bureau’s urban-rural classification system. This clear, binary classification delineates geographic areas as urban or rural based on well-defined criteria. An urban area comprises a densely settled core of census tracts and/or blocks that meet specific population density, housing density, and adjacent land use requirements. Rural areas encompass all population, housing, and territory not classified within an urban area. In this study, to capture the fundamental differences between urban and rural settings, we defined “urban/suburban” tracts as Census tracts containing urban areas, and “rural” tracts as tracts containing no urban areas.
We carefully selected VDA metrics from an initial set of 69 potential variables that measure various operational skills and behavioral outcomes. In a previous paper, the study analysis team reduced the VDA dataset to 32 variables that had sufficient variability, based on an initial visual inspection of histograms ( 13 ). The 32 VDA variables belong to eight skill domains; in this paper, we excluded the “route following” skill domain and the “crash avoidance” skill domain, focusing instead on the six domains that involve transportation planning-related, action-oriented skills. Our choice was driven by the desire to streamline the analysis and provide clear, actionable insights, especially for interventions aimed at improving specific driving skills. However, we recognize the importance of a more holistic approach to fully capture the complexities of driving behavior.
To select representative variables from these six domains, we employed two methods: 1) we calculated the pairwise Spearman’s correlation coefficients for all the variables within each domain and then selected the variable that had the highest average correlation coefficient with the other variables, and 2) we ran principal component analysis (PCA) for each skill domain and selected the variable with the most significant loading of each domain’s first principal component, which accounts for about 43% to 76% of the variance within each skill domain. We decided to use specific driving skills rather than composite indexes such as PCA scores because specific driving skills allow us to produce more straightforward interpretations and recommend more targeted interventions. Both methods resulted in the same six VDA variables: mean throttle, standard deviation of (SD) acceleration, SD brake, mean heading error, time with time-to-collision (TTC) <3 s, and failures to stop (see Table 1 for descriptions). These variables, which demonstrate the highest variances and strongest correlations within their respective domains, were then used for data visualization and inferential statistical tests. The 3 s TTC variable measures the following distance and is a useful indicator of tailgating. However, it may not fully capture the complexities of different driving contexts and should be interpreted with caution.
Selected Virtual Driving Assessment (VDA) Variables and Brief Explanation
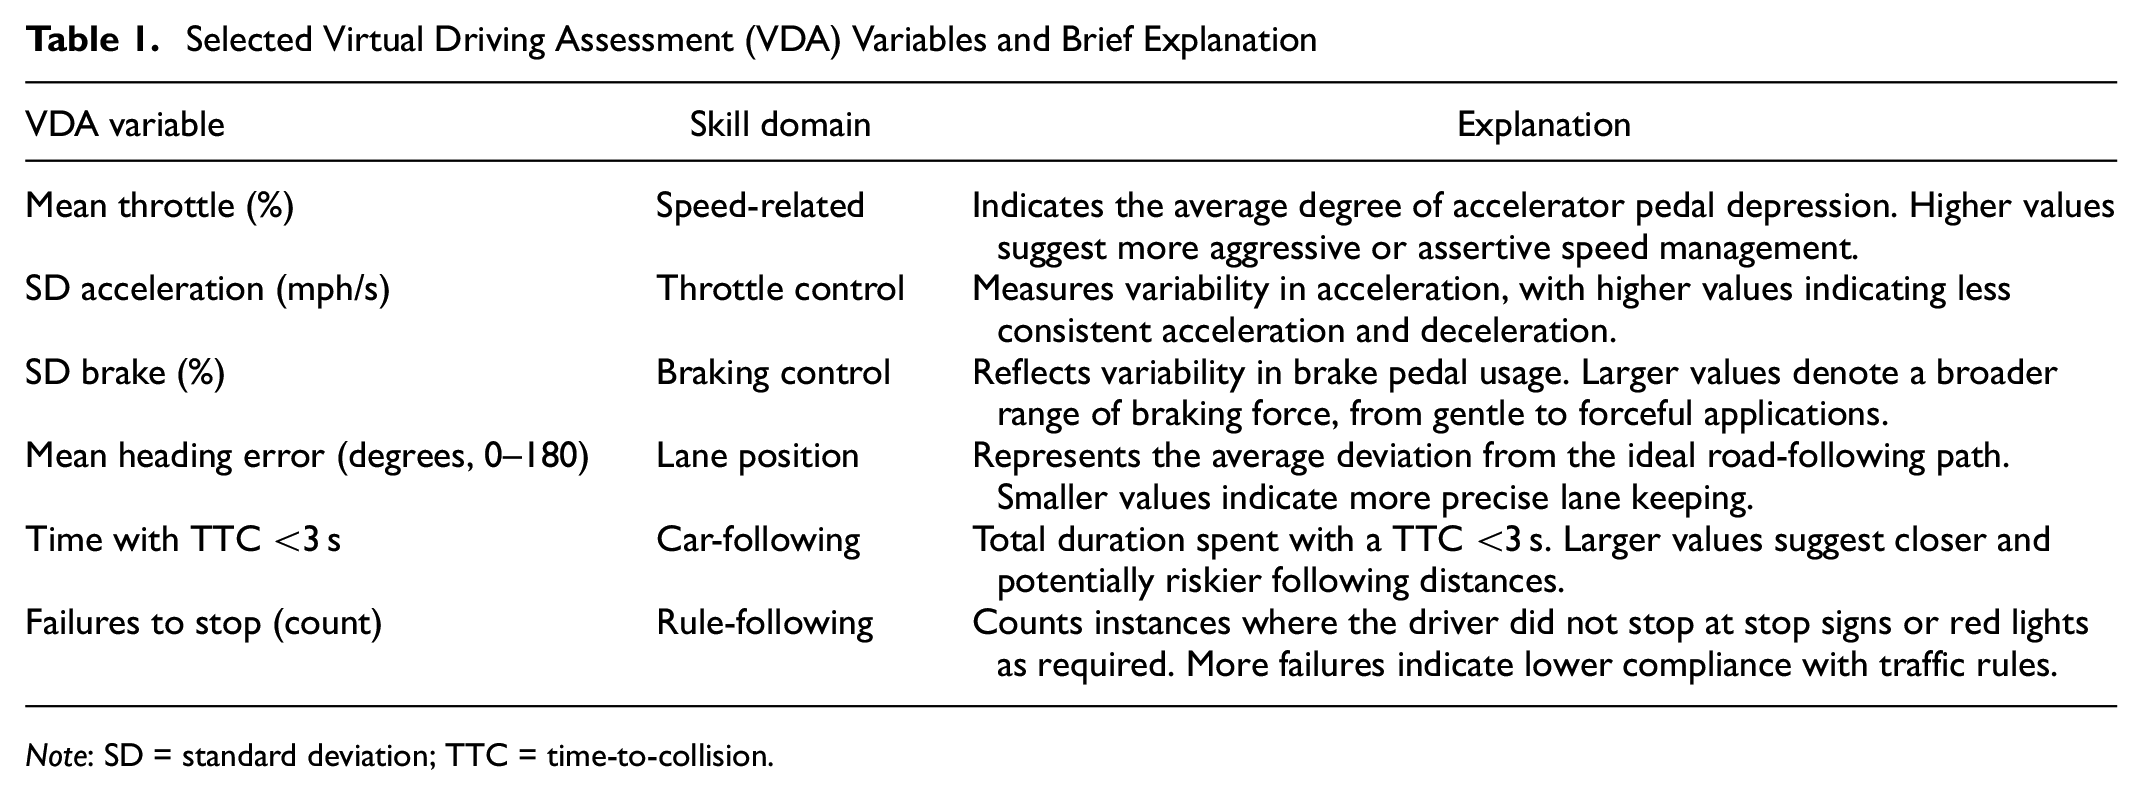
Note: SD = standard deviation; TTC = time-to-collision.
The selected driving skills were measured by VDA as continuous or numeric variables. Given the skewed nature of the VDA data, especially with the rarity of certain driving errors—such as 68% of young participants adhered to stop signs and red lights—and extreme outliers in operational skills (e.g., the 75th percentile and maximum of mean heading error were 2.55 and 20.34 degrees), we categorized VDA variables for a separate set of data analysis, in addition to the analysis using the variables on their original continuous scale. VDA variables were grouped based on their statistical distribution (e.g., above median versus below median) and compliance with traffic rules, distinguishing between no failure to stop and any failure to stop. Categorizing VDA skills allowed us to effectively compare groups and highlight significant behavioral patterns among young drivers, as detailed in Table 2.
Summary of Virtual Driving Assessment (VDA) Metrics and Personal Characteristics
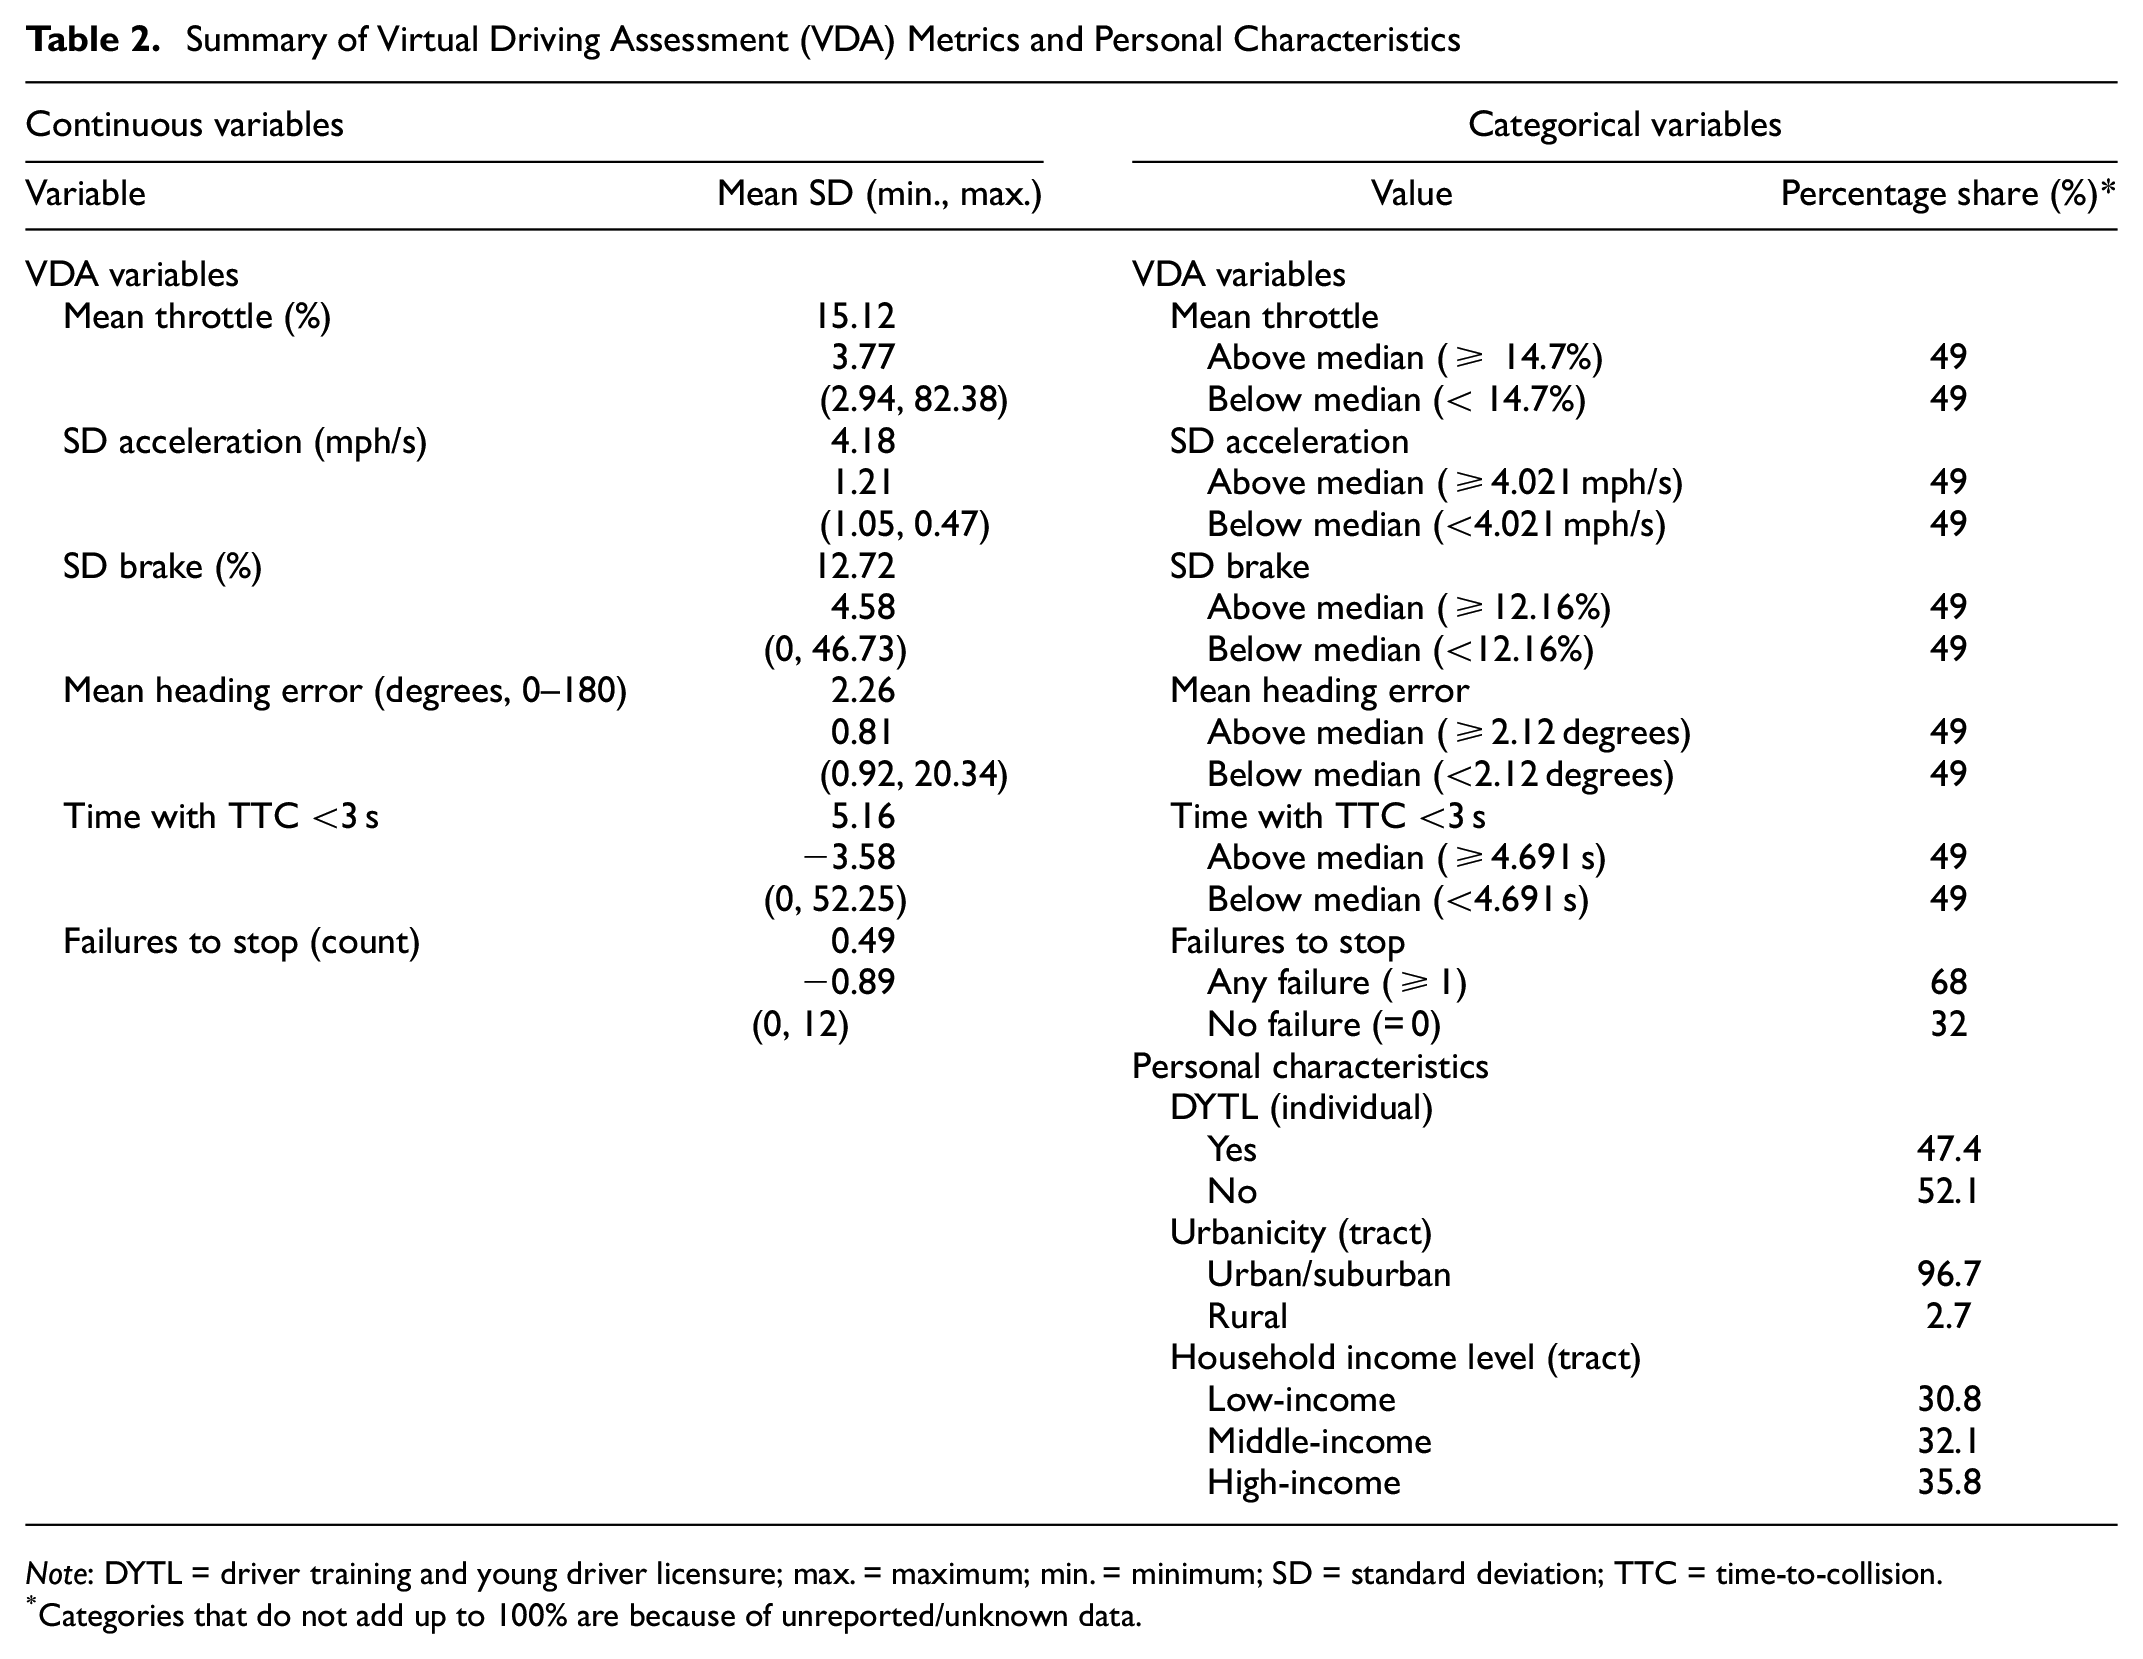
Note: DYTL = driver training and young driver licensure; max. = maximum; min. = minimum; SD = standard deviation; TTC = time-to-collision.
Categories that do not add up to 100% are because of unreported/unknown data.
We only used each participant’s first complete VDA test results for analytical rigor, focusing on 22,490 unique young drivers. This approach helped maintain data independence and completeness. Figure 2 illustrates the comprehensive workflow from data collection through analysis. In this sample, about 47.5% of young participants had completed DTYL on or before the VDA test day, and the majority (96.7%) resided in urban/suburban tracts. Notably, these two groups—the young participants with DTYL and those from urban or suburban tracts—had a higher proportion of participants from high-income tracts compared with the rest of the sample: approximately 51% of young participants with DTYL lived in high-income tracts, while less than 22% of those without DTYL were from such tracts. Similarly, 36% of urban/suburban participants were from high-income tracts, in contrast to only about 16% of those living in rural areas. The interplay between DTYL status, home neighborhood urbanicity, and income may influence their associations with individual VDA variables.
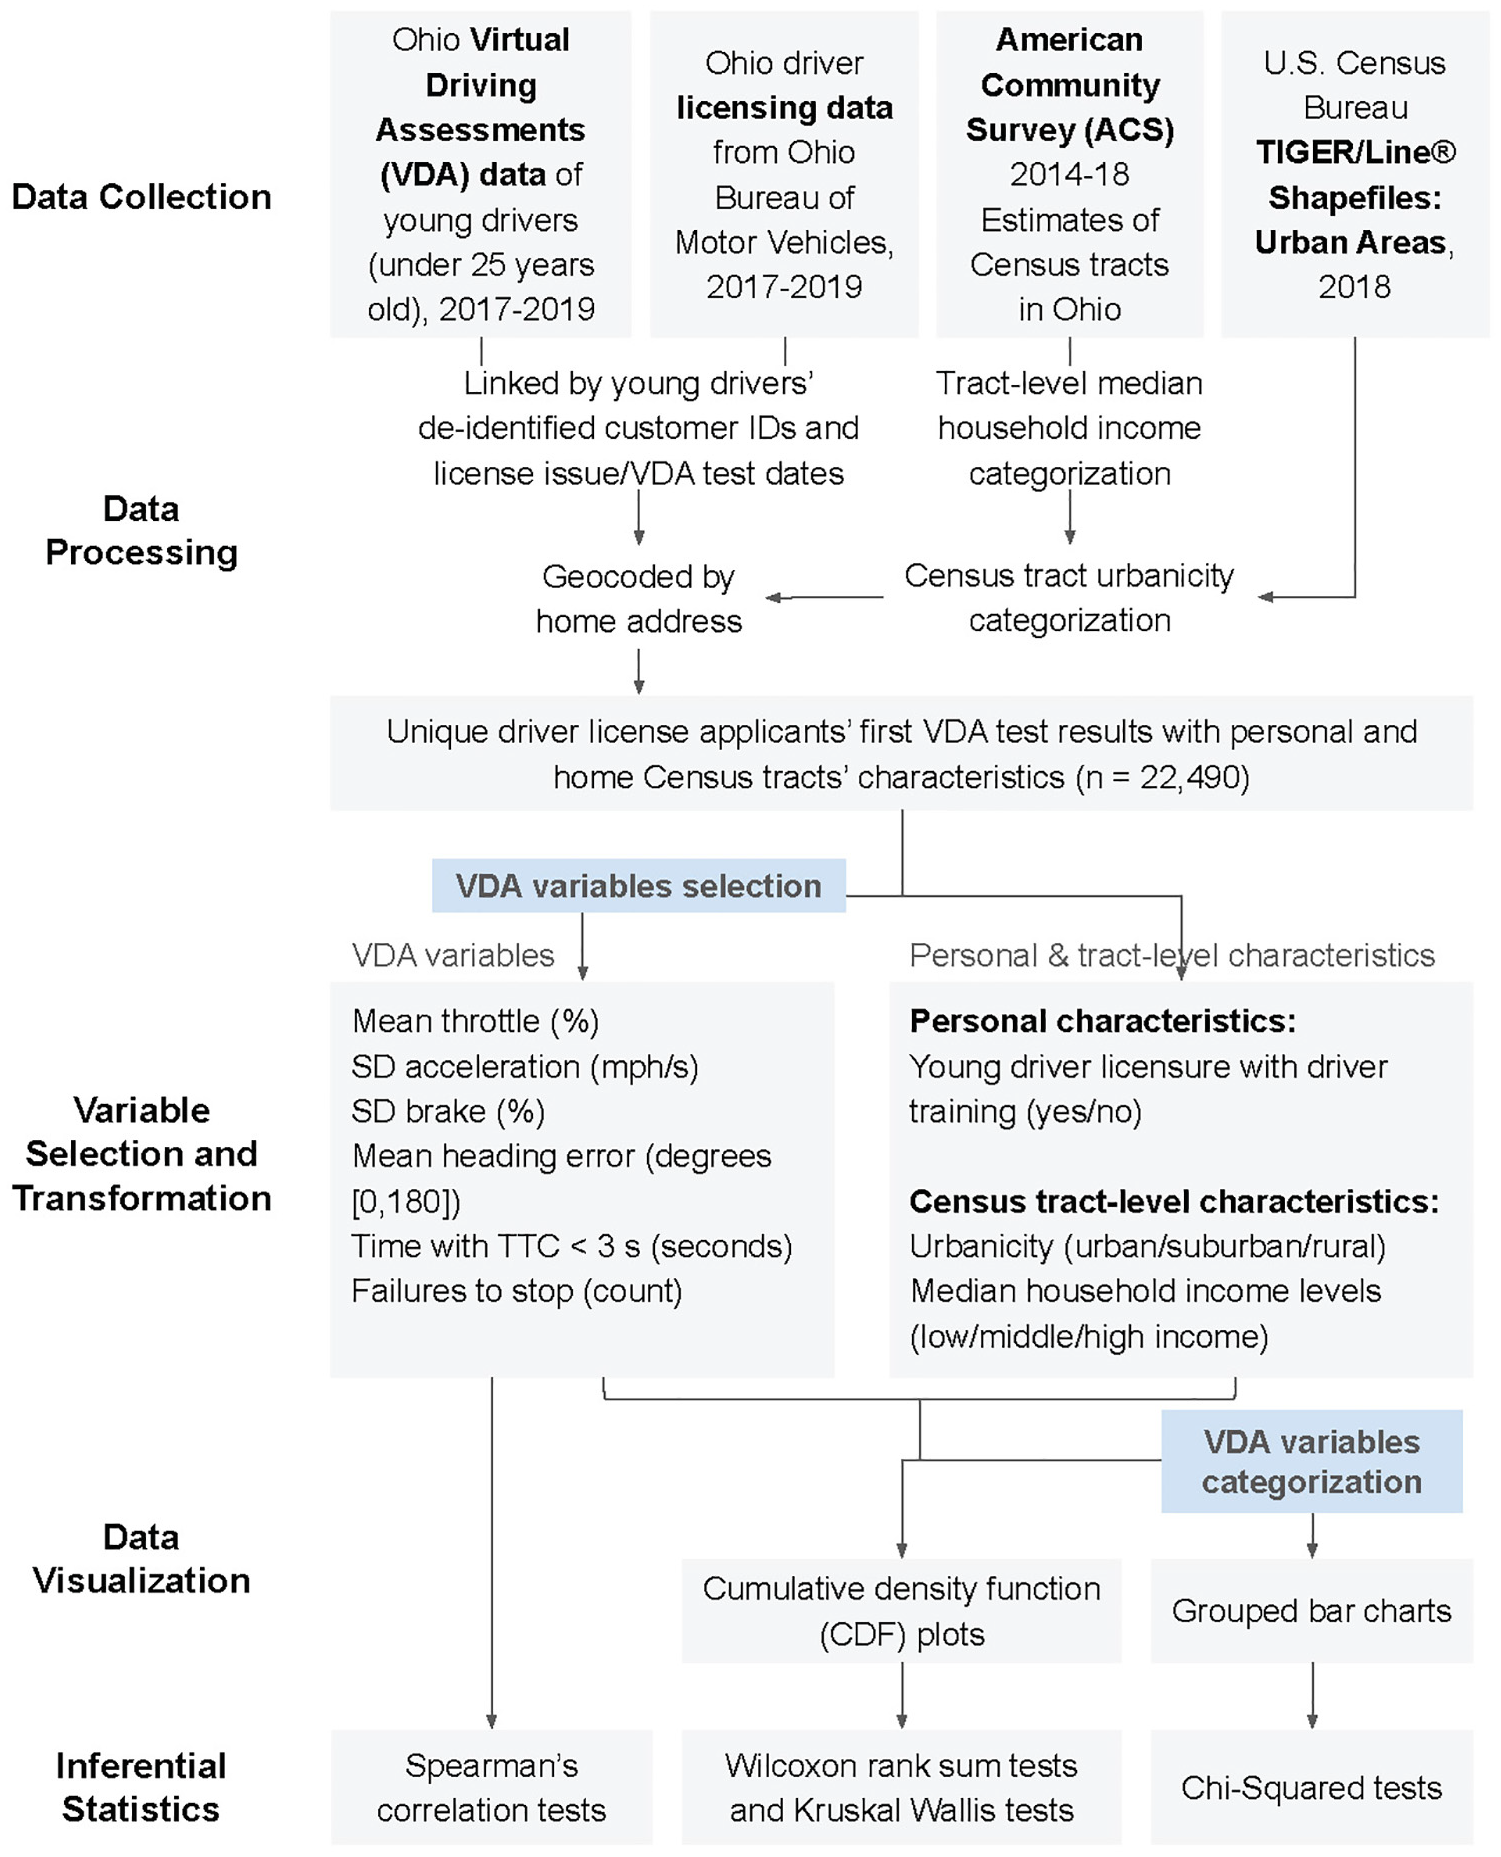
Analysis framework.
Analysis Methods
We conducted two sets of analyses. Analysis set I treated VDA variables as continuous, while analysis set II treated the variables as categorical. For analysis set I, we started visualizing the data using cumulative density function (CDF) plots, which helped assess the probability distribution of VDA variables. To statistically validate observed differences, we applied non-parametric tests, including Wilcoxon rank sum tests for binary groups and Kruskal Wallis tests for multilevel categorical groups, because of the skewness of continuous VDA variables. These tests assessed differences in median values across groups, with statistical significance determined by p-values lower than 0.05. As statistical significance is sensitive to large sample sizes, we also included analyses of effect sizes using Cliff’s delta to support Wilcoxon rank sum tests. This approach aids in interpreting the practical significance of observed differences in VDA variables across two-group comparisons. For comparisons involving three groups, such as variations by home neighborhood income level, we note the absence of a standardized multi-group version of Cliff’s delta equipped with predefined thresholds (small, medium, large) for non-parametric statistics. Consequently, we refrained from reporting pairwise Cliff’s delta for multi-group comparisons. This decision stems from the methodological limitation that such adaptations would incorrectly assume independence among groups, and multiple pairwise tests after non-directional Kruskal Wallis tests may increase the likelihood of Type I errors.
For analysis set II, we first used grouped bar charts to compare young driver groups’ performances within and across various VDA metrics. Then, we applied chi-squared tests to evaluate the independence between VDA skills and young driver groups. We analyzed χ2 statistics against critical values to determine if observed frequencies significantly deviated from expected frequencies at a 95% confidence level. Additionally, we used contingency tables to display the observed and expected frequencies, χ2 contributions, and standardized residuals. The standardized residuals were analyzed using critical z-score values of −1.96 and +1.96 to identify significant discrepancies at a 95% confidence level.
Lastly, we examined the relationships between various VDA skills utilizing Spearman’s correlation tests to understand the potential interplay between driving skills. A closer-to-one absolute value of Spearman’s correlation indicates that two continuous driving skill variables are highly correlated. Spearman’s correlation is a non-parametric method commonly used to handle data that do not conform to the normality assumptions required for Pearson’s correlation. Spearman’s correlation is particularly effective at identifying monotonic relationships between variables with non-normal distributions, a common characteristic in the distribution of VDA skills data. We conducted all statistical analyses using stat and gmodels packages in RStudio ( 50 , 51 ).
Results
This section summarizes key findings from data visualizations and inferential statistical tests. We grouped the results by driver training and licensure status, income, and urbanicity. Then, we analyzed correlations between VDA variables to understand the interplay between young drivers’ skills.
Driver Training and Young Driver Licensure (DTYL)
The comprehensive analysis revealed varied correlations between young drivers’ DTYL status and driving skills. Notably, skills such as SD brake, mean heading error, and failure to stop showed robust correlations with DTYL, marked by slight divergences in their CDF plots (see Figure 3). In contrast, plots for other variables nearly overlapped, indicating minimal behavioral differences between trained and untrained young drivers. By breaking down VDA variables into two groups—better or worse than average (corresponding to below or above median)—grouped bar charts further delineated these patterns, emphasizing differences in performance in areas such as braking variability and compliance with traffic rules among drivers with DTYL (see Figure 4).
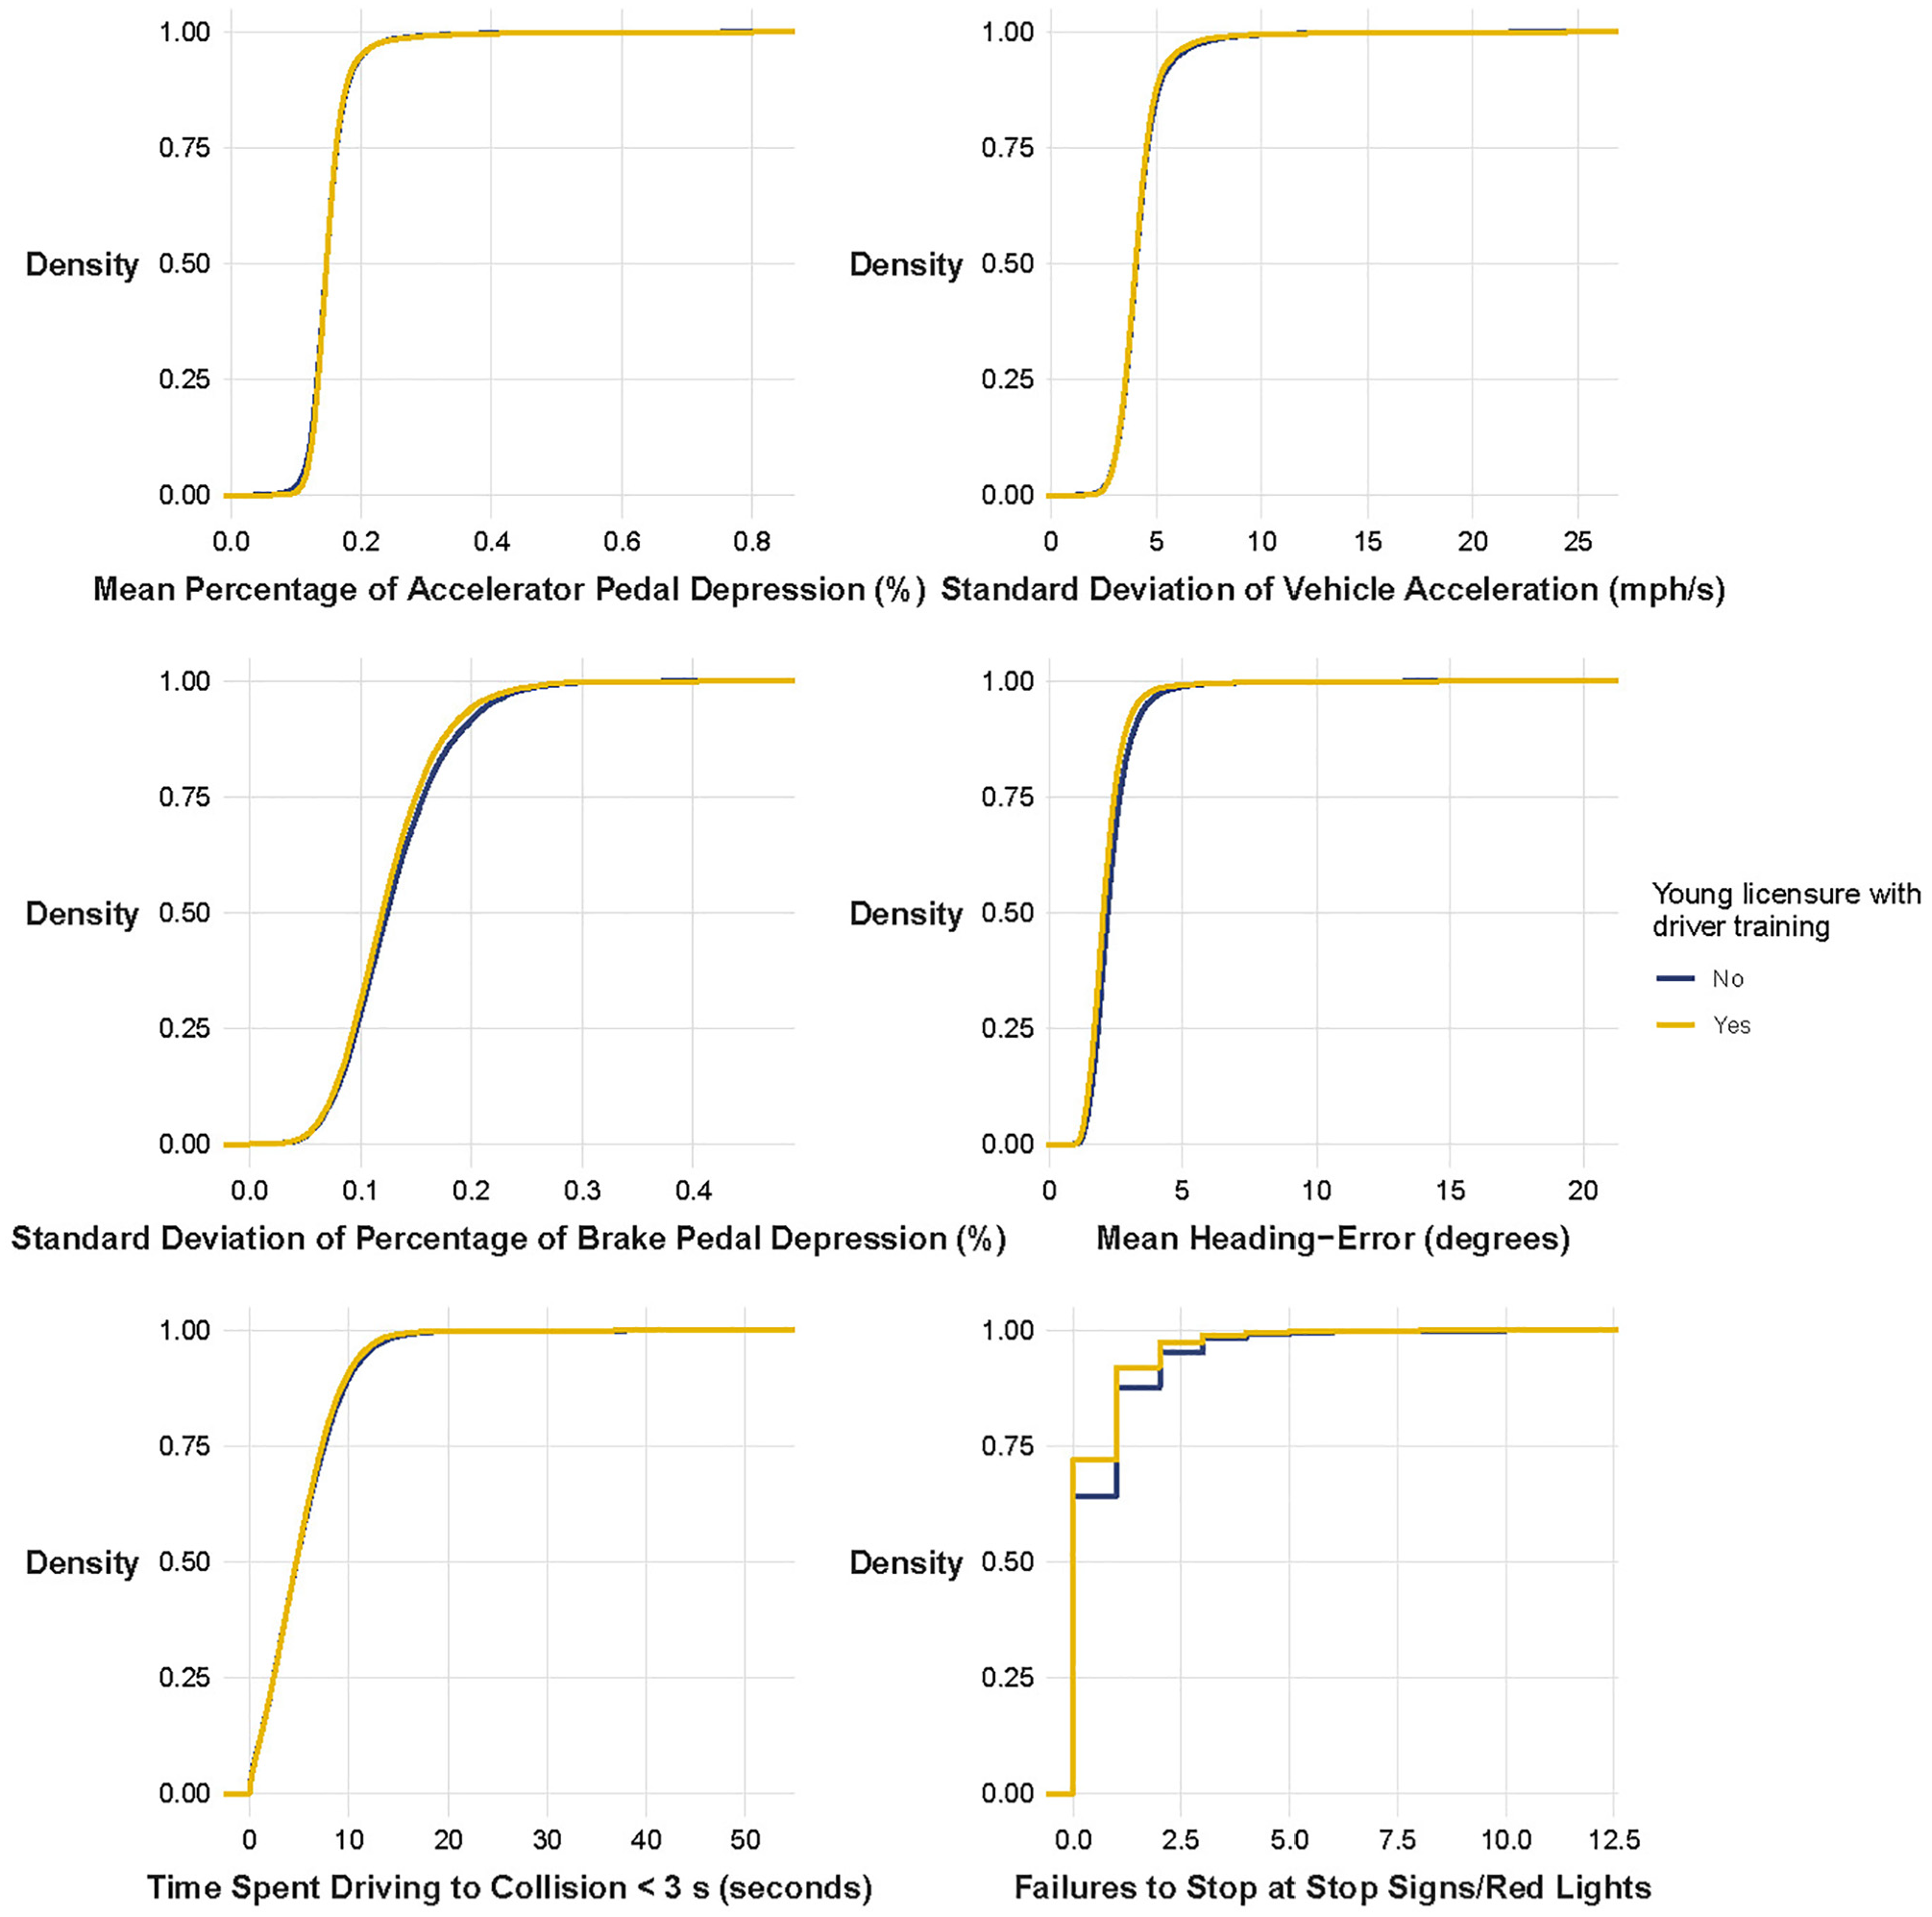
Continuous distributions of selected Virtual Driving Assessment (VDA) variables by driver training completion and young driver licensure status: (top left) mean percentage of accelerator pedal depression, (top right) standard deviation of vehicle acceleration, (middle left) standard deviation of percentage of brake pedal depression, (middle right) mean heading-error, (bottom left) time spent driving to collision < 3 seconds, and (bottom right) failures to stop at stop signs/red lights.
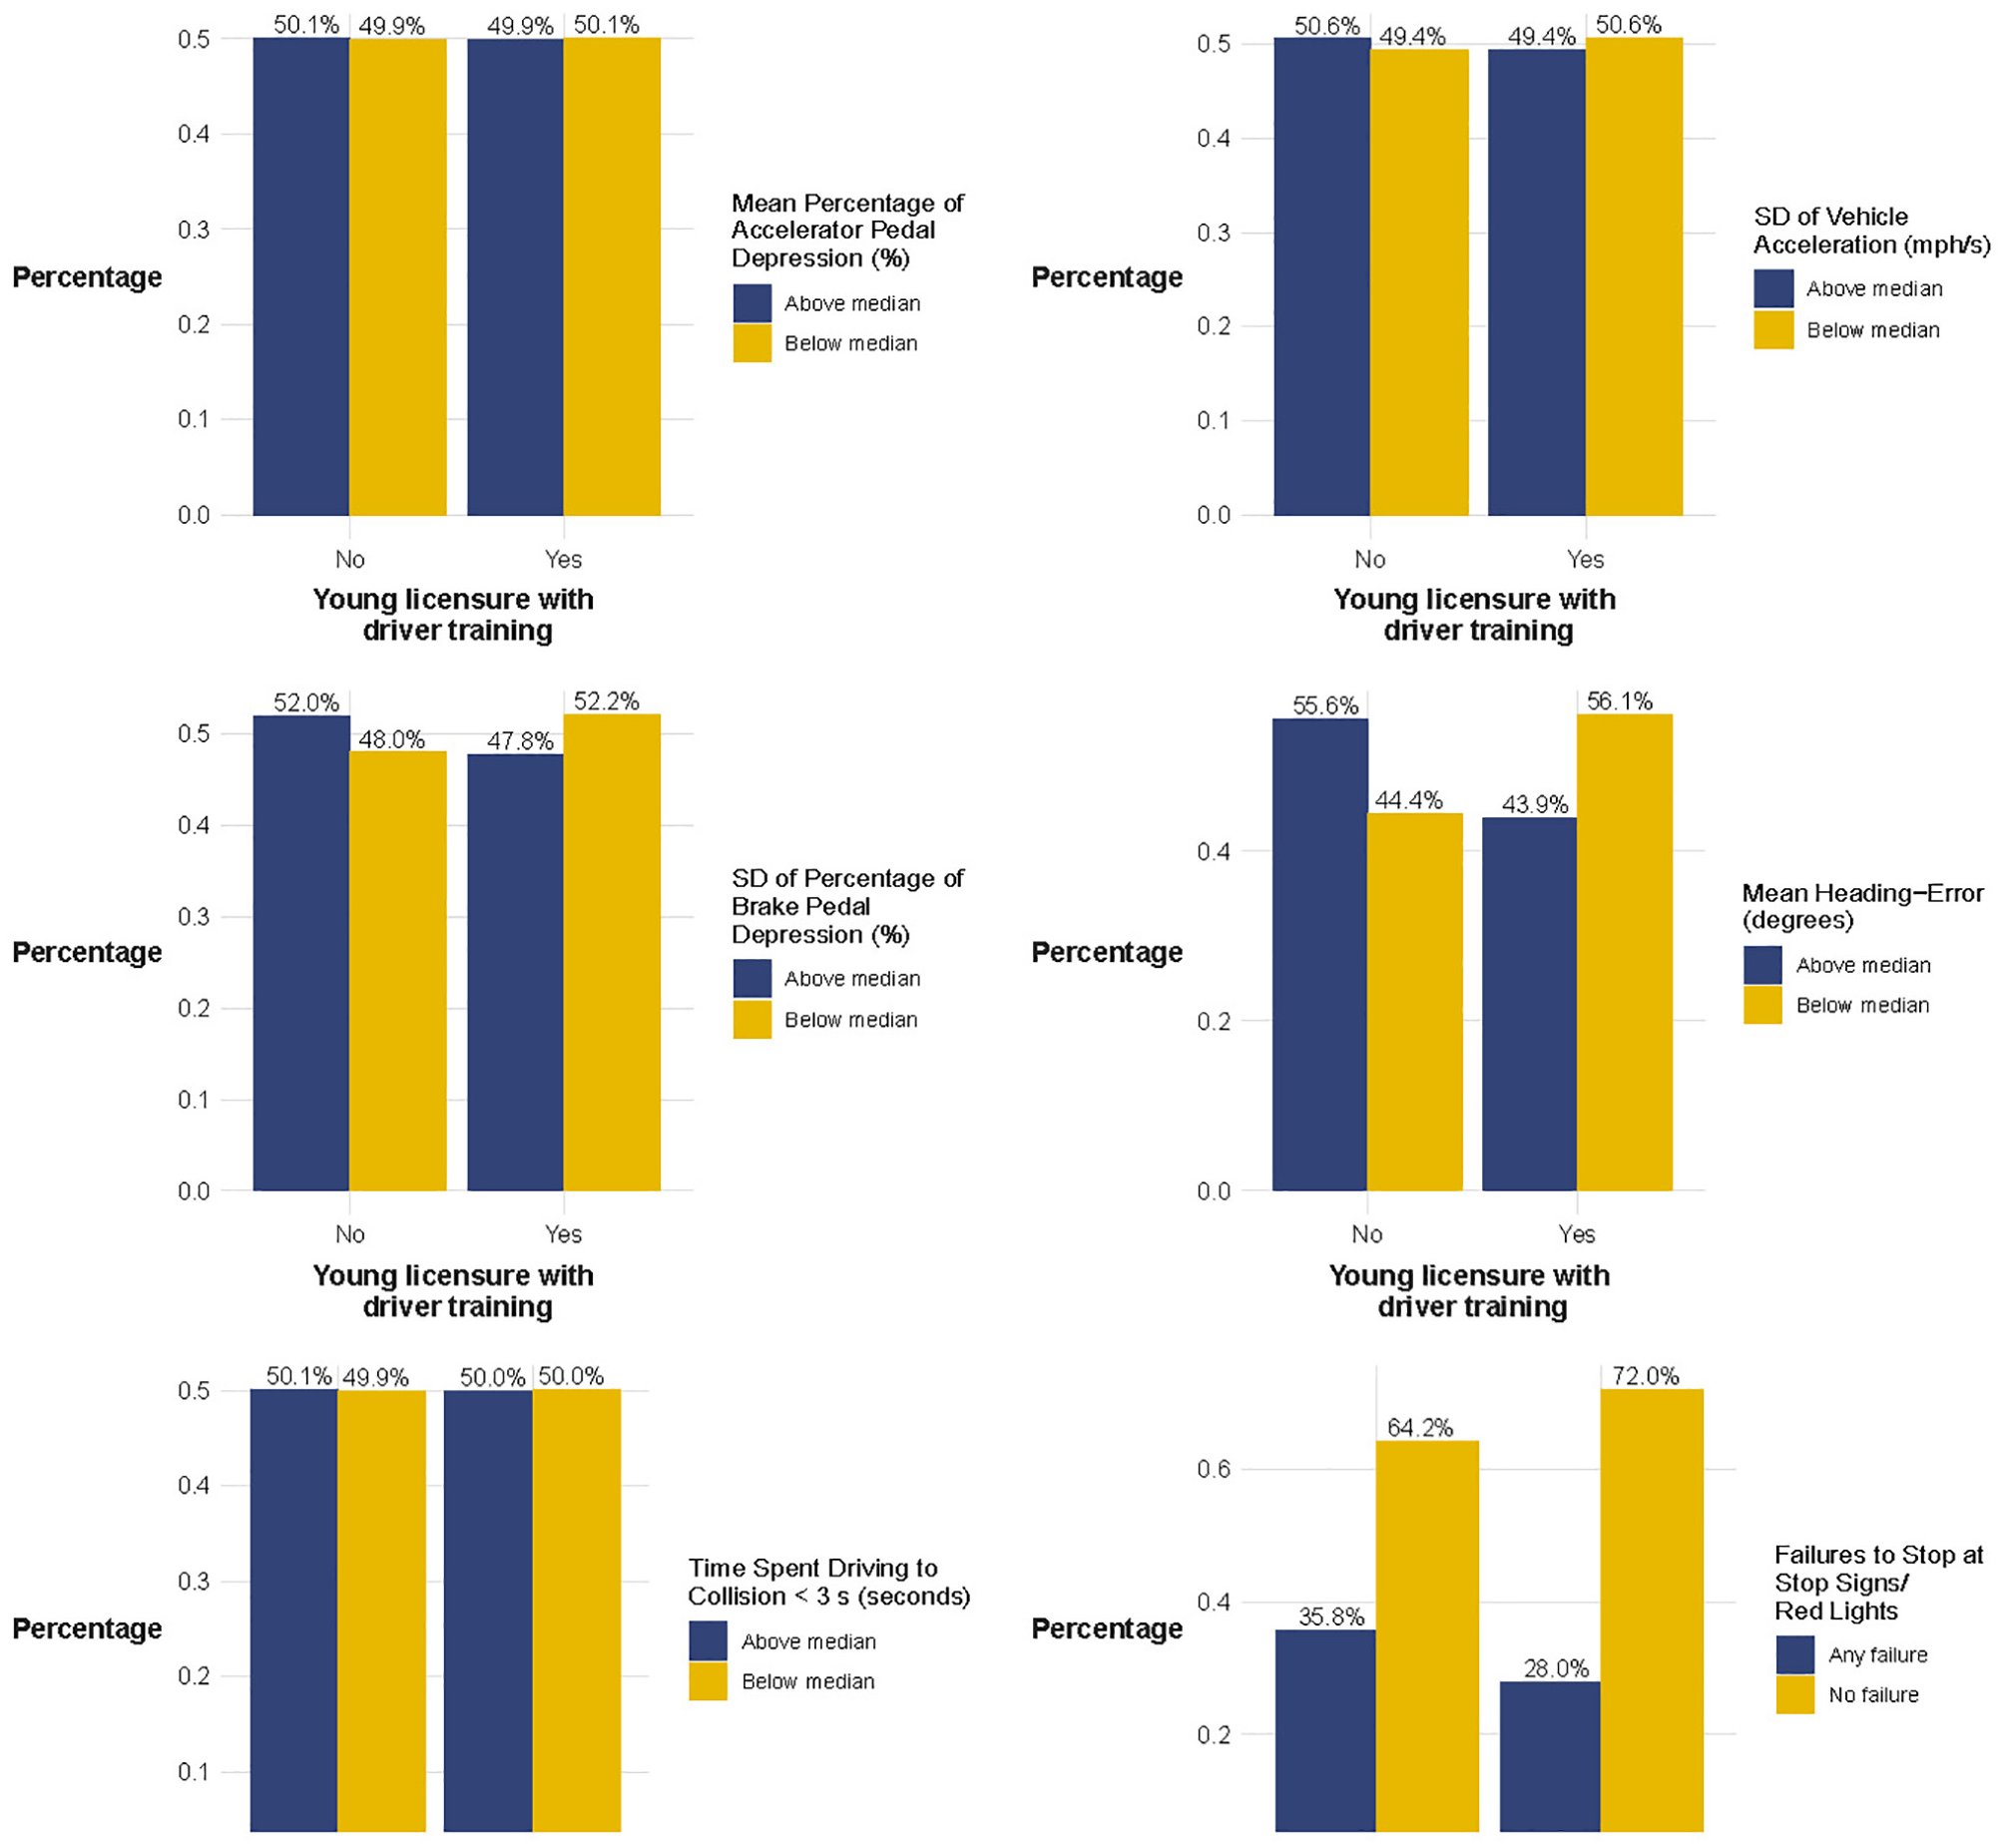
Categorical distributions of selected Virtual Driving Assessment (VDA) variables by driver training completion and young driver licensure status: (top left) mean percentage of accelerator pedal depression, (top right) standard deviation of vehicle acceleration, (middle left) standard deviation of percentage of brake pedal depression, (middle right) mean heading-error, (bottom left) time spent driving to collision < 3 seconds, and (bottom right) failures to stop at stop signs/red lights.
Specifically, young drivers with and without DTYL exhibited significant differences in braking behavior variability, as evidenced by a notable p-value (<0.001) from the Wilcoxon test and supported by chi-squared results (χ2 = 38.10, d.f. = 1, p < 0.001, see Table 3). A slightly higher proportion of trained young drivers in the below-median group (52.2%) for braking variability than that of untrained young drivers (48%) suggests that DTYL might be related to more consistent braking. Young drivers with DTYL were also significantly more likely to score below the median for heading errors and less likely to fail to stop at stop signs, with strong statistical backing (Wilcoxon p < 0.001 for both variables; χ2 = 299.86 and 156.26, respectively, both d.f. = 1 and p < 0.001). These findings suggest that DTYL was effectively associated with enhanced lane-keeping accuracy and compliance with traffic rules. Cliff’s delta values provide insights into the practical significance of these differences: the Cliff’s delta of −0.158 revealed a medium effect of DTYL on young drivers’ reduced heading errors (see Table 4). Meanwhile, DTYL’s effects on braking variability and stop sign compliance were smaller (Cliff’s delta values of −0.057 and −0.085, respectively), indicating less pronounced practical differences in these areas between young drivers with and without DTYL.
Chi-Squared (χ2) Test Results and Contingency Tables of Categorized Virtual Driving Assessment Variables across Young Drivers with and without Driver Training and Young Driver Licensure (DTYL)
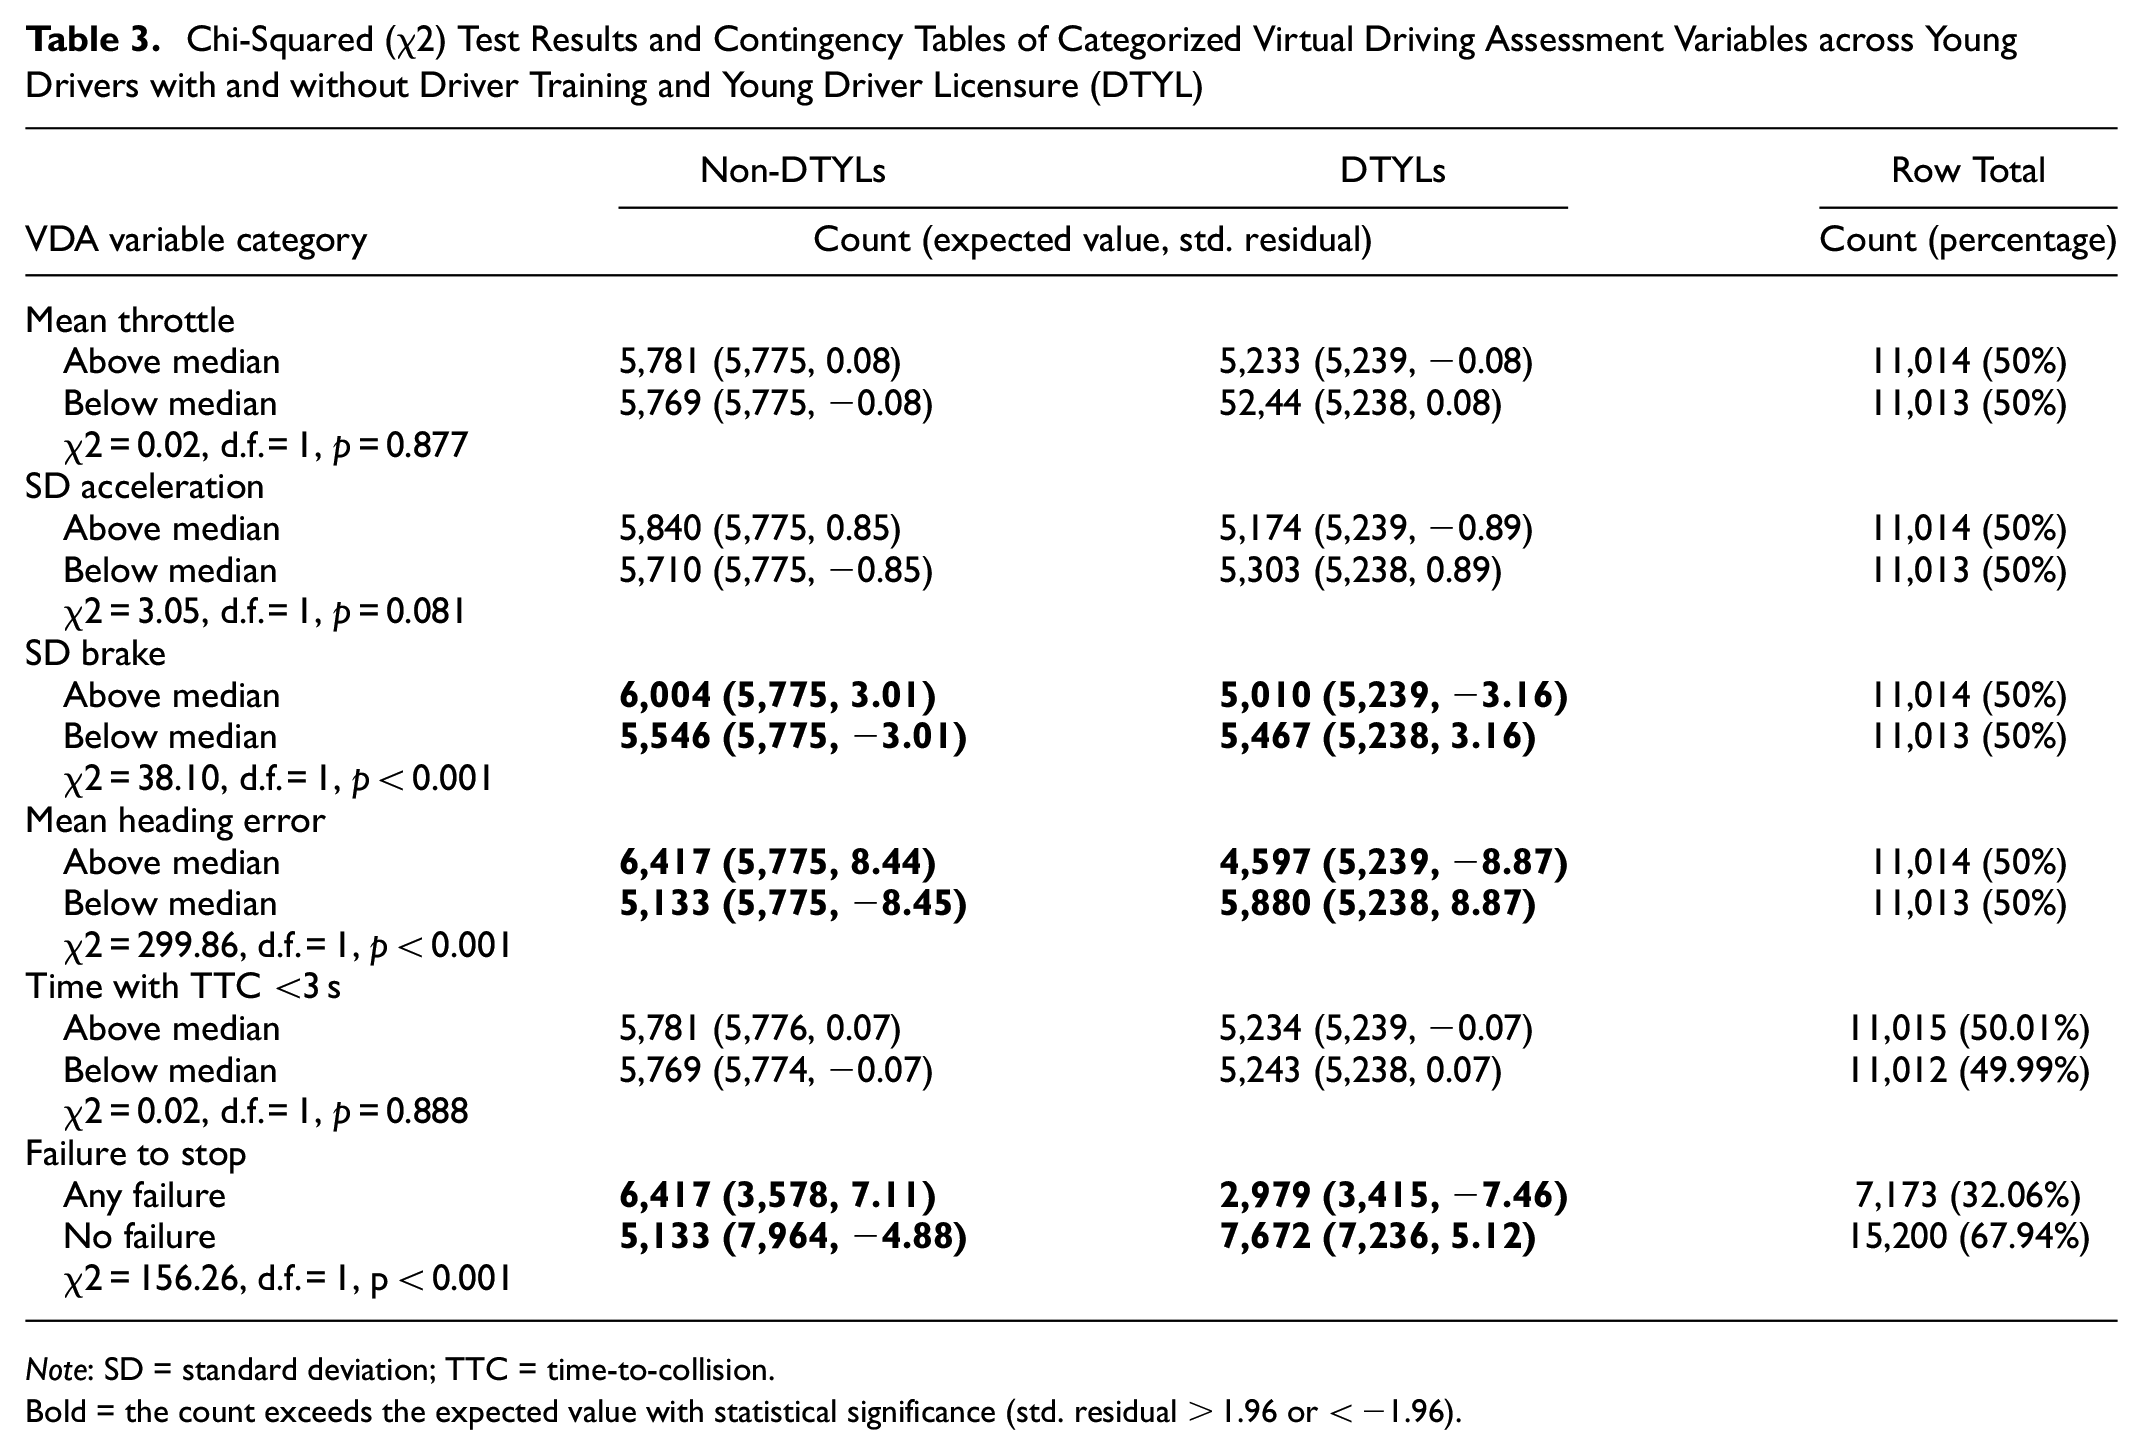
Note: SD = standard deviation; TTC = time-to-collision.
Bold = the count exceeds the expected value with statistical significance (std. residual > 1.96 or < −1.96).
Cliff’s Delta Values* of Selected Virtual Driving Assessment Variables by Young Drivers’ Driver Training Completion and Young Driver Licensure Status and Home Tract Urbanicity
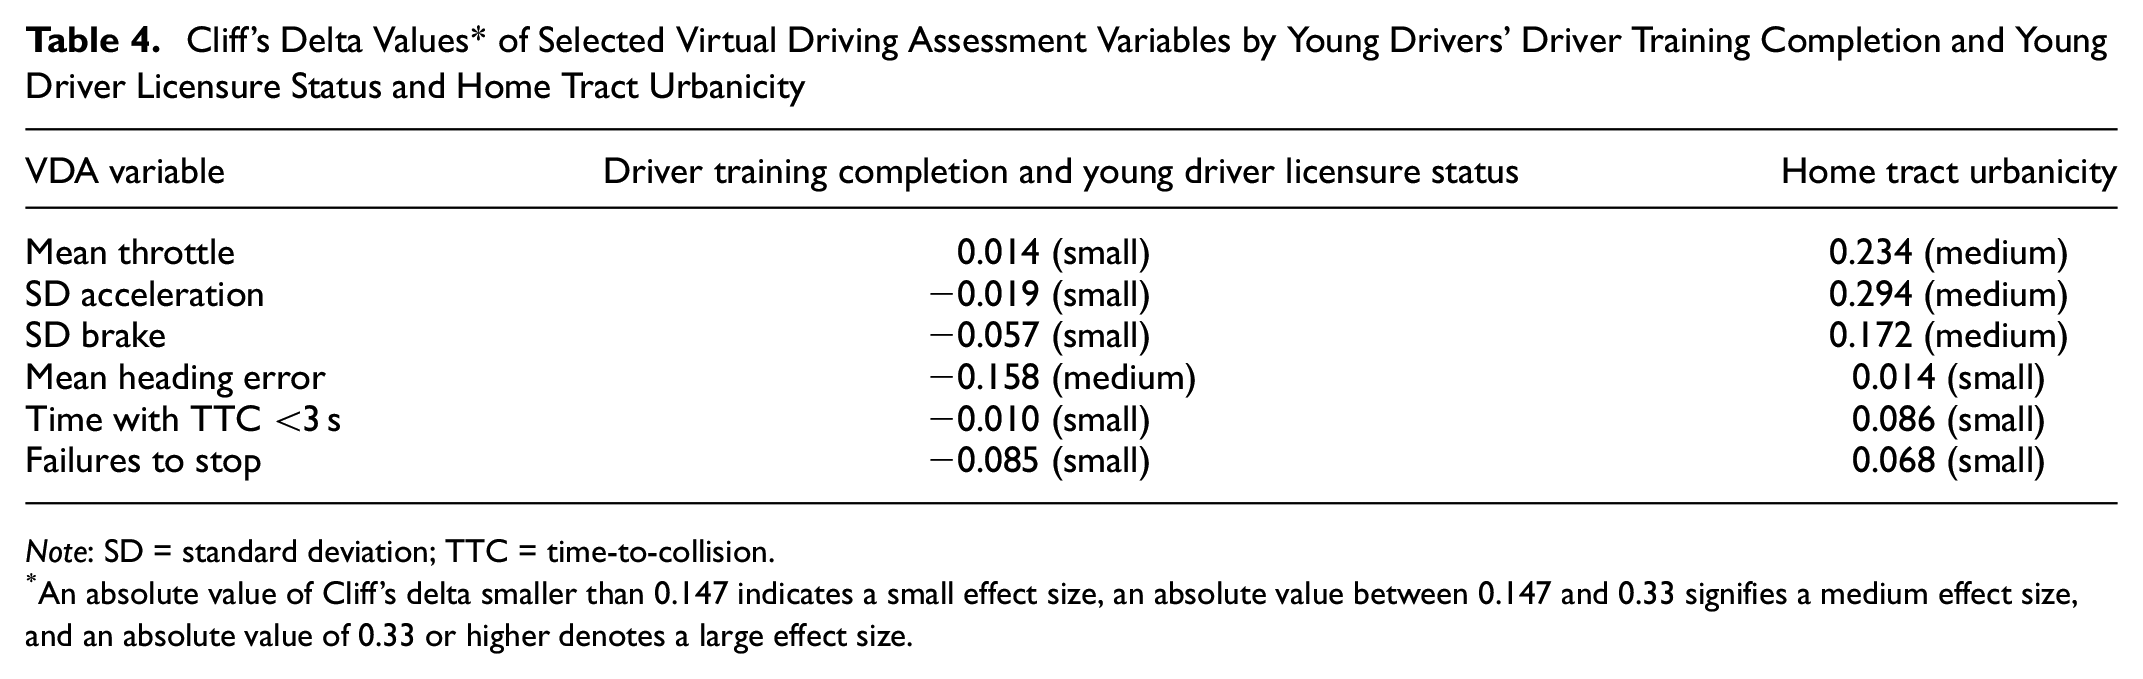
Note: SD = standard deviation; TTC = time-to-collision.
An absolute value of Cliff’s delta smaller than 0.147 indicates a small effect size, an absolute value between 0.147 and 0.33 signifies a medium effect size, and an absolute value of 0.33 or higher denotes a large effect size.
Conversely, skills related to speed regulation, such as mean throttle, showed no statistical association between trained and untrained young drivers. The Wilcoxon test, with a p-value of 0.077, did not reach statistical significance, suggesting no strong evidence of an association between DTYL status and mean throttle usage. This statistically insignificant relationship was corroborated by chi-squared test results (χ2 = 0.02, d.f. = 1, p = 0.877) and Cliff’s delta (0.014), alongside the nearly balanced distribution in the grouped bar charts (see Figure 4). The equal proportion of young drivers above and below the median of throttle usage, regardless of DTYL, indicates that training did not correlate with how hard young drivers press the accelerator pedal.
Similarly, the analysis of acceleration variability and proximity to collision scenarios showed minimal-to-no association with DTYL (Wilcoxon p = 0.014 and 0.1851, respectively; chi-squared tests χ2 = 3.05 and 0.02, d.f. = 1, and p = 0.081 and 0.888, respectively). Aligning with the statistical significance test results, the effect size analyses also revealed negligible-to-small effects of DTYL on young drivers’ acceleration variability and car-following skills (Cliff’s delta values of −0.019 and −0.010, respectively). Regardless of DTYL status, both groups of young drivers had almost equal chances of scoring above or below the median in acceleration variability and car-following, meaning that DTYL was not associated with young driver behaviors in managing acceleration or tailgating.
Income
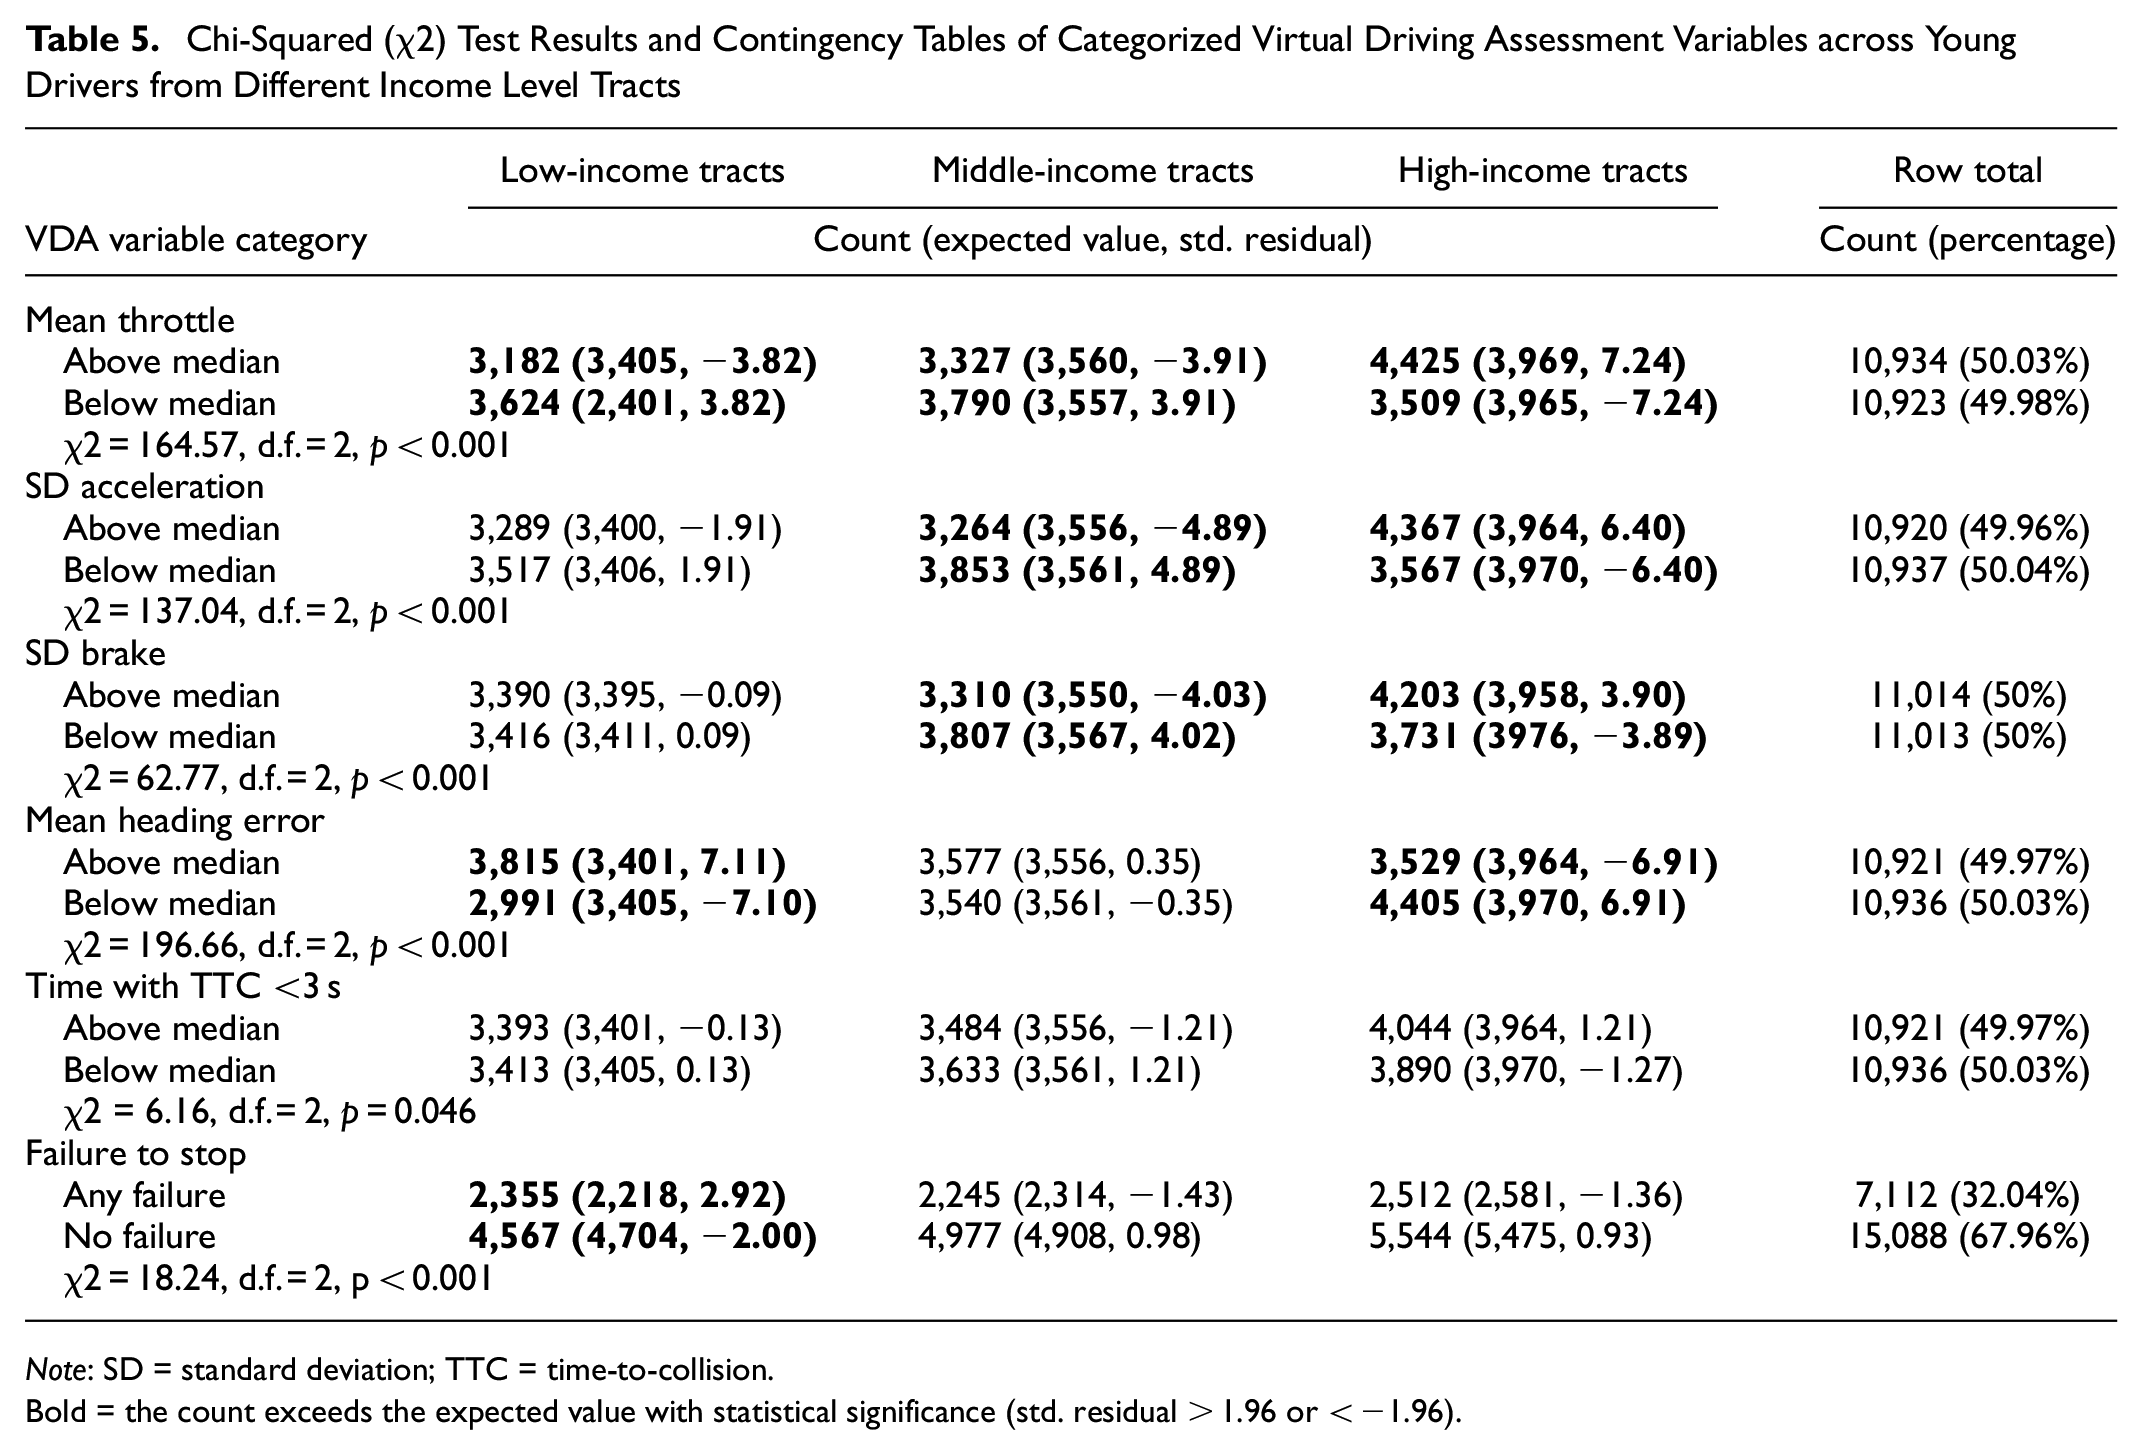
The integration of statistical and visual data analysis underscored the profound association between young drivers’ home neighborhood median household income and their driving skills development, with significant disparities noted in throttle control, braking variability, heading accuracy, and compliance with traffic regulations. First, young drivers who lived in high-income tracts tended to exhibit higher throttle usage and greater variability in braking and acceleration, potentially indicating more assertive or aggressive driving styles. This pattern is evident in CDF plots and bar charts (see Figures 5 and 6), where young drivers from high-income tracts frequently exceeded the median values for throttle usage and demonstrated less consistency in their braking and acceleration patterns. These disparities in driving skills were found statistically significant across young drivers from different income-level neighborhoods (Kruskal Wallis test χ2 = 220.97, 198.08, and 94.351, respectively, d.f. = 2, p < 0.001 for all; chi-squared test χ2 = 164.57, 137.04, and 62.77, respectively, d.f. = 2, p < 0.001 for all, see Table 5).
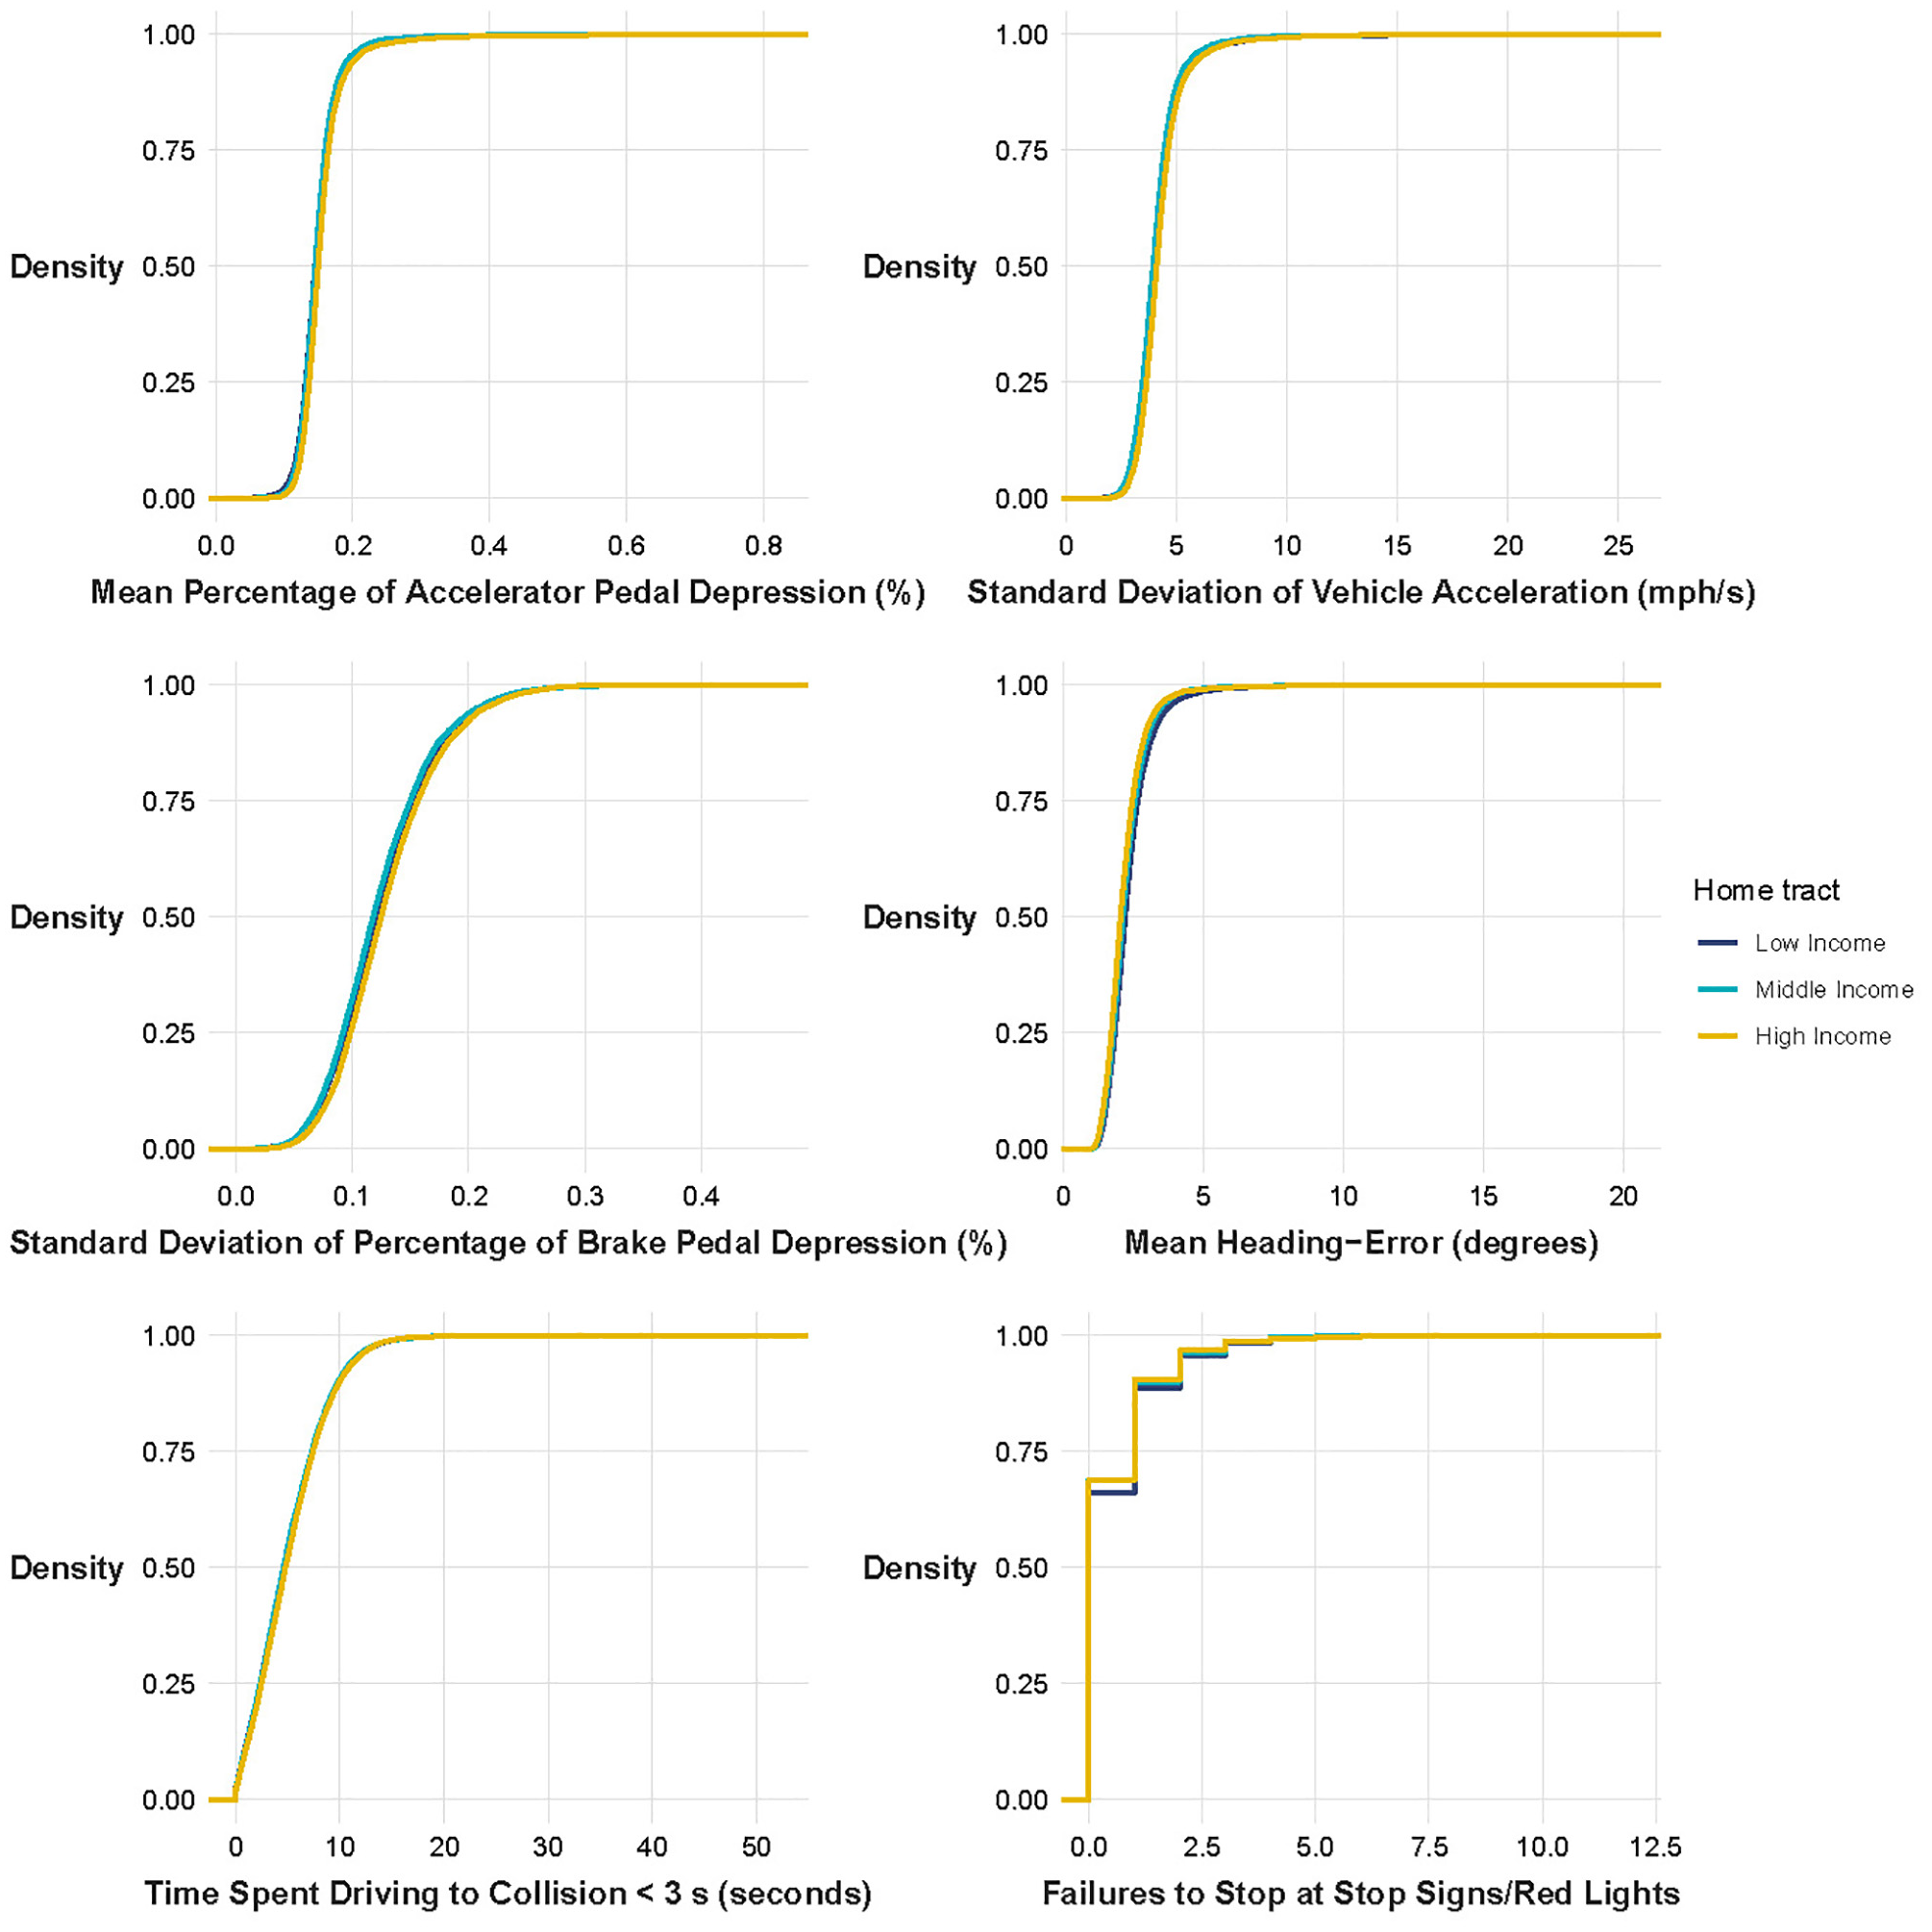
Continuous distributions of selected Virtual Driving Assessment (VDA) variables by young drivers’ home tract income level: (top left) mean percentage of accelerator pedal depression, (top right) standard deviation of vehicle acceleration, (middle left) standard deviation of percentage of brake pedal depression, (middle right) mean heading-error, (bottom left) time spent driving to collision < 3 seconds, and (bottom right) failures to stop at stop signs/red lights. Note: SD = standard deviation.
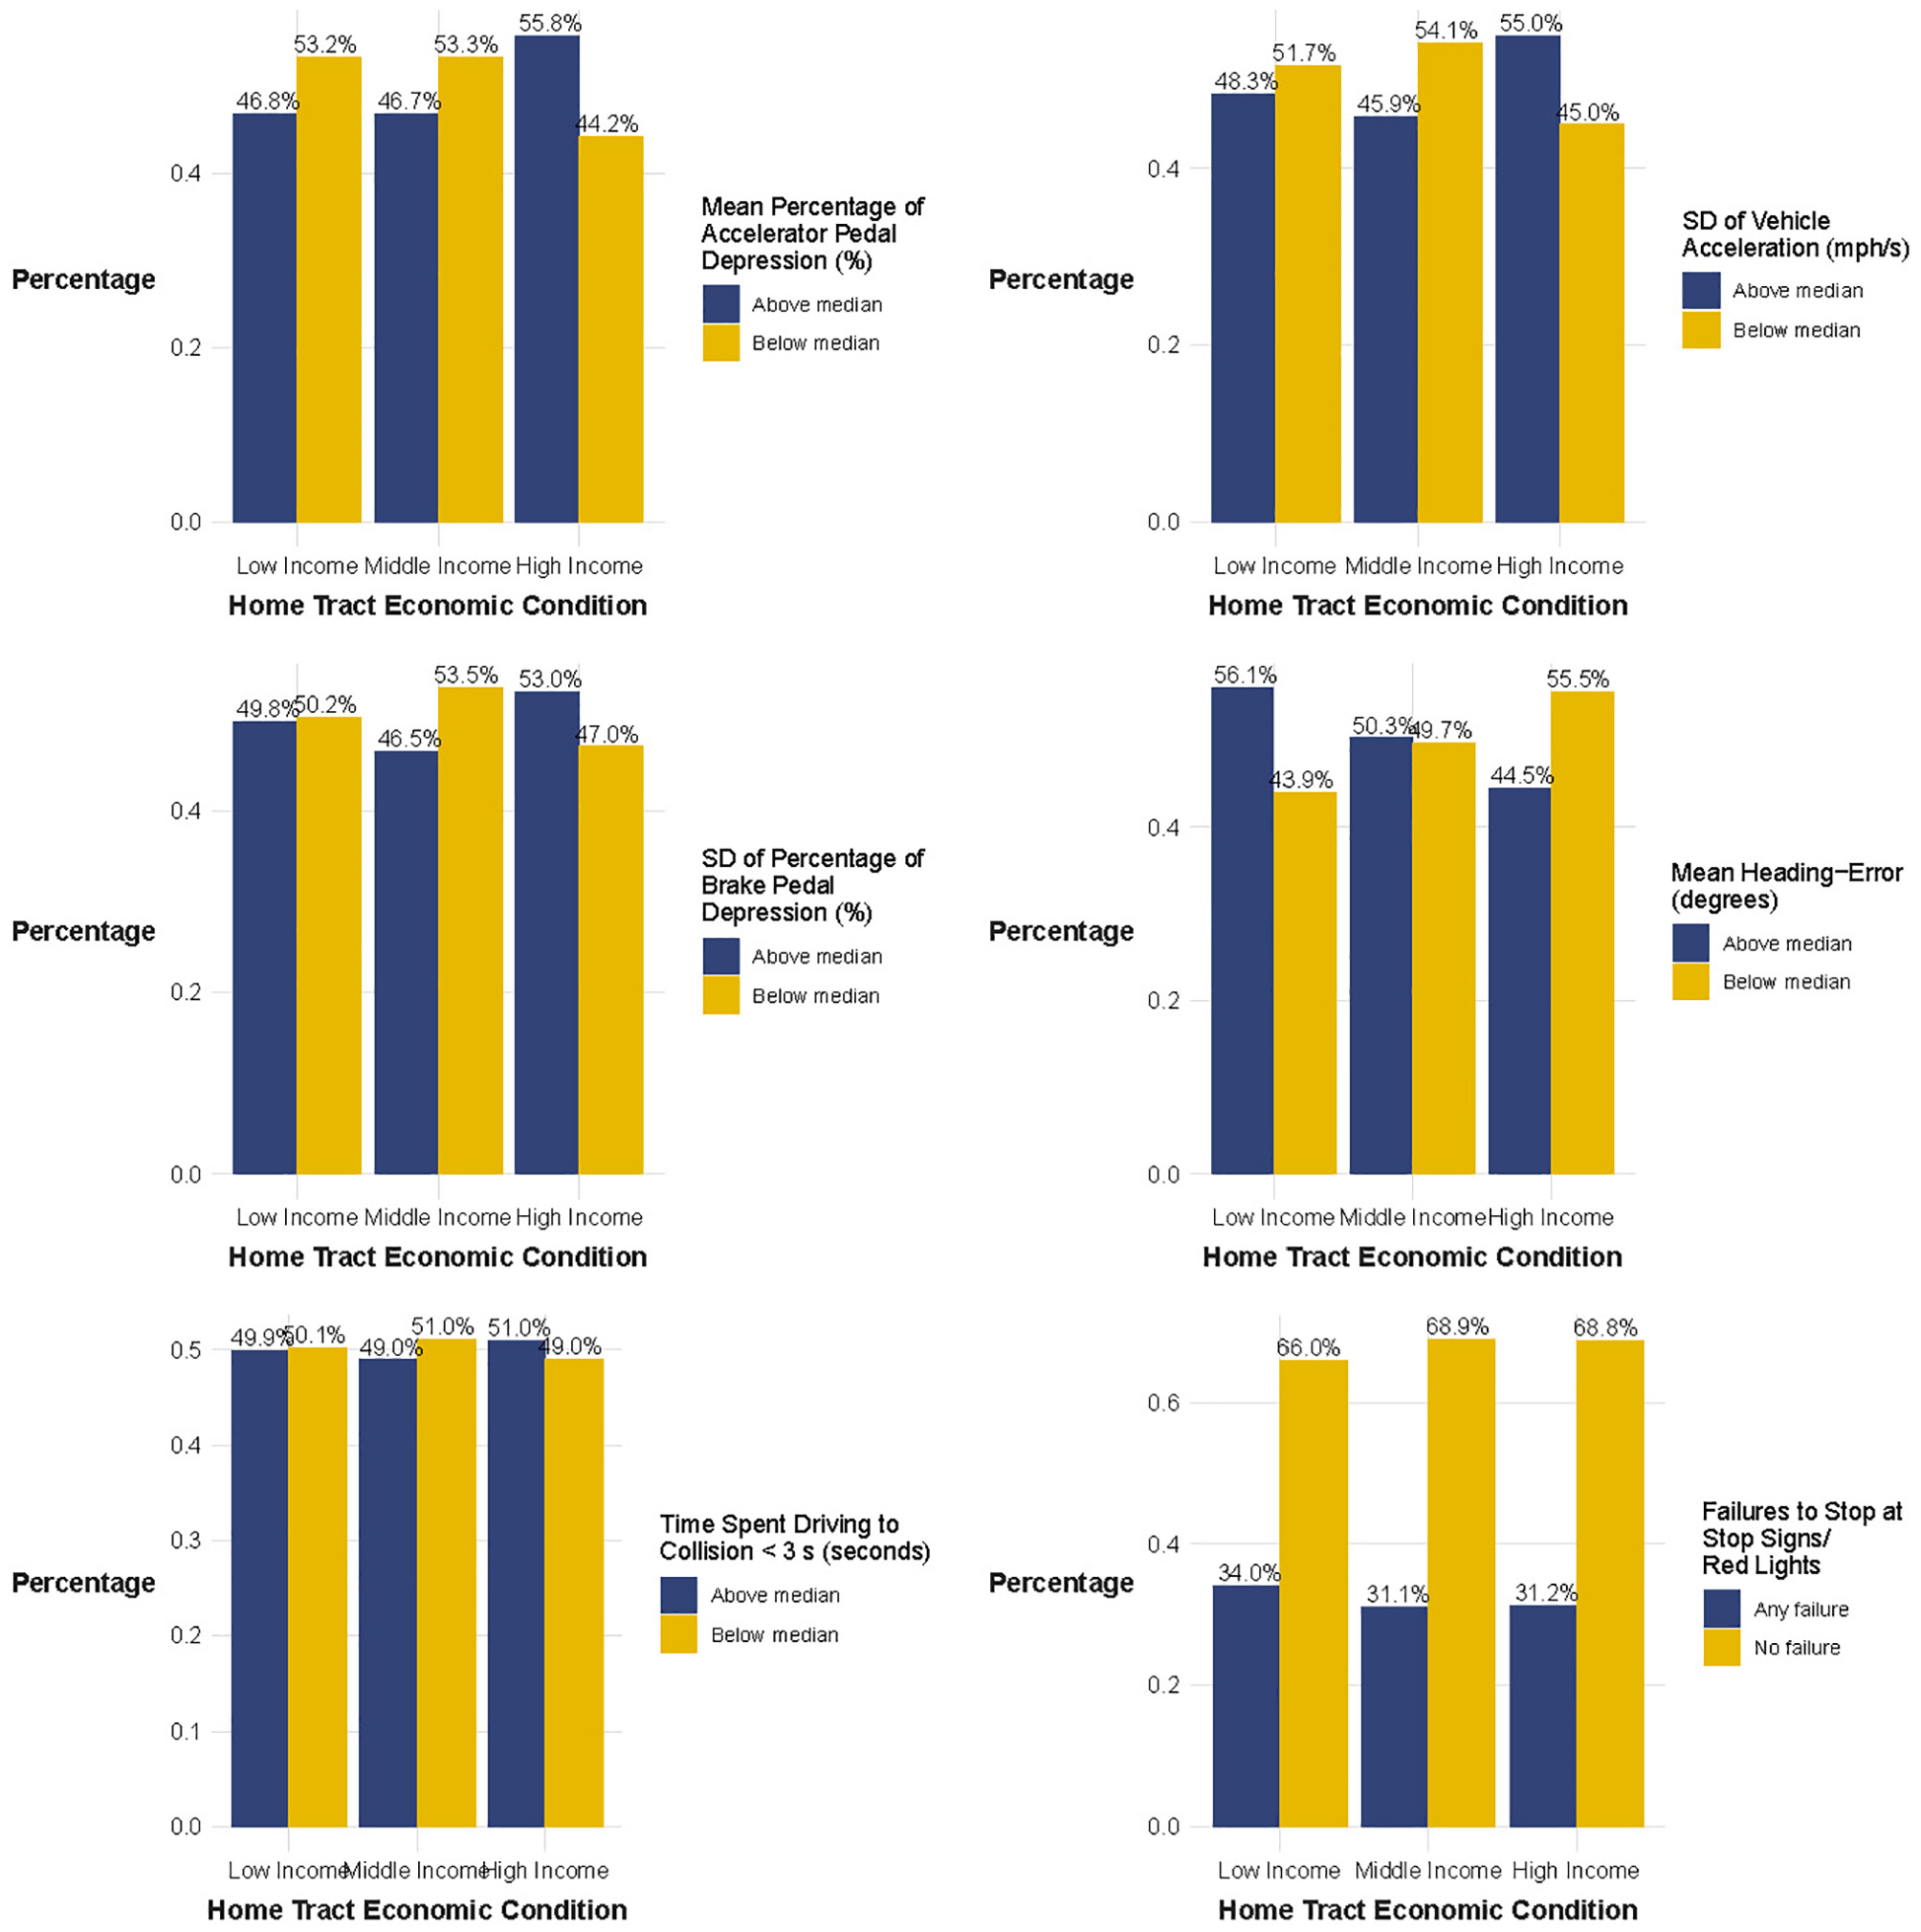
Categorical distributions of selected Virtual Driving Assessment (VDA) variables by young drivers’ home tract income level: (top left) mean percentage of accelerator pedal depression, (top right) standard deviation of vehicle acceleration, (middle left) standard deviation of percentage of brake pedal depression, (middle right) mean heading-error, (bottom left) time spent driving to collision < 3 seconds, and (bottom right) failures to stop at stop signs/red lights.
Chi-Squared (χ2) Test Results and Contingency Tables of Categorized Virtual Driving Assessment Variables across Young Drivers from Different Income Level Tracts
Note: SD = standard deviation; TTC = time-to-collision.
Bold = the count exceeds the expected value with statistical significance (std. residual > 1.96 or < −1.96).
Conversely, young drivers from high-income tracts also displayed superior heading accuracy, with a significant portion (55.5%) scoring below the median in heading errors compared with their counterparts from low-income areas (43.9%). Unlike CDF plots for mean throttle, SD acceleration, and SD brake, the high-income CDF curve for mean heading error rises earlier, indicating better lane-keeping accuracy (see Figure 5). Both Kruskal Wallis and chi-squared tests support the significance of these observed differences across income levels (Kruskal Wallis test χ2 = 245.44, d.f. = 2, p < 0.001; chi-squared test χ2 = 196.66, d.f. = 2, p < 0.001).
Despite these differences, the time spent driving near collisions showed negligible differences across income levels (Kruskal Wallis test χ2 = 6.883, d.f. = 2, p-value = 0.046), indicating a uniform risk exposure behavior among all young drivers regardless of income, as depicted in the closely overlapping CDF curves and consistent bar charts (see Figures 5 and 6). However, a stark contrast emerged in compliance with traffic rules. Young drivers from low-income neighborhoods showed the highest rates of failures at stop signs and red lights (chi-squared test χ2 = 21.447, d.f. = 2, p < 0.001).
Urbanicity
Our study further investigated the relationships between home neighborhood urbanicity and young drivers’ driving skills, revealing distinct behavioral patterns based on their residential environments. Significantly, urban and suburban young drivers tended to use the throttle more intensely than their rural counterparts, as depicted in the CDF plots and bar charts (see Figures 7 and 8): about 68.5% of rural young drivers exhibited below-median usage compared with 49.5% of urban/suburban young drivers. Statistical results (Wilcoxon p < 0.001; chi-squared χ2 = 85.54, d.f. = 1, p < 0.001, see Table 6) underscored these differences, and the Cliff’s delta of 0.234 indicates a medium effect size, emphasizing the practical impact of home tract urbanicity on young drivers’ throttle usage.
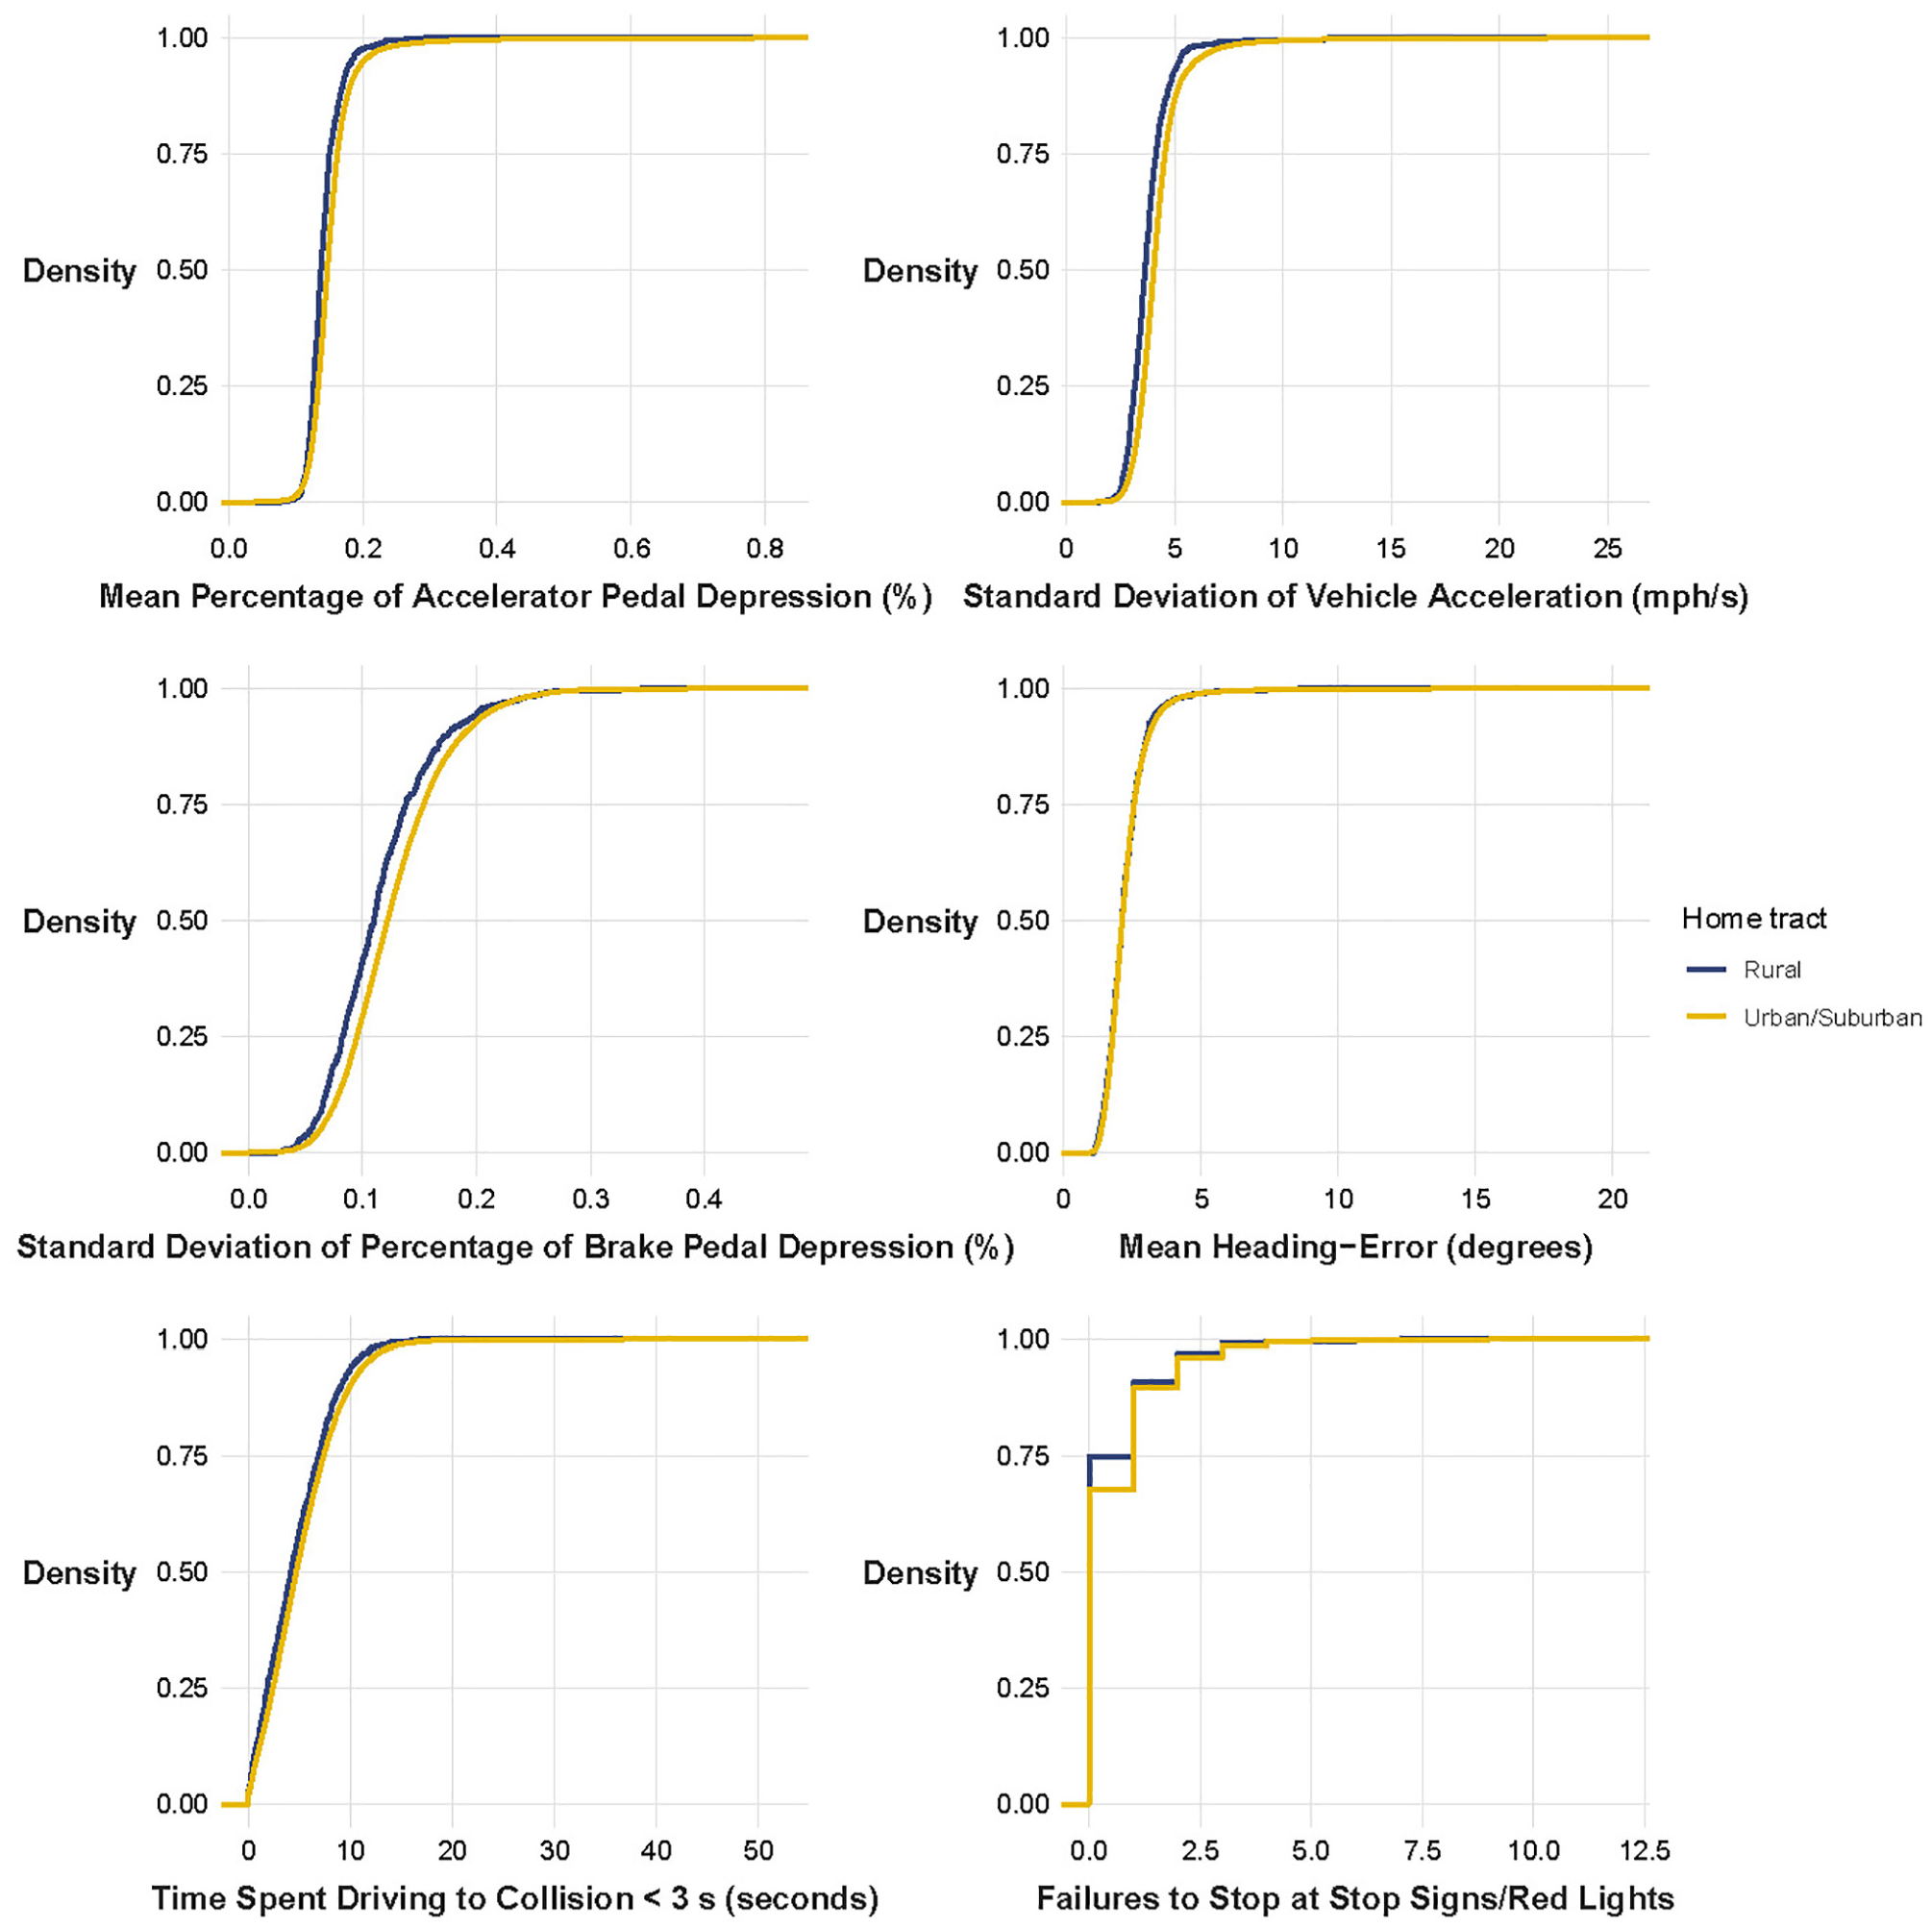
Continuous distributions of selected Virtual Driving Assessment (VDA) variables by young drivers’ home tract urbanicity: (top left) mean percentage of accelerator pedal depression, (top right) standard deviation of vehicle acceleration, (middle left) standard deviation of percentage of brake pedal depression, (middle right) mean heading-error, (bottom left) time spent driving to collision < 3 seconds, and (bottom right) failures to stop at stop signs/red lights. Note: SD = standard deviation.
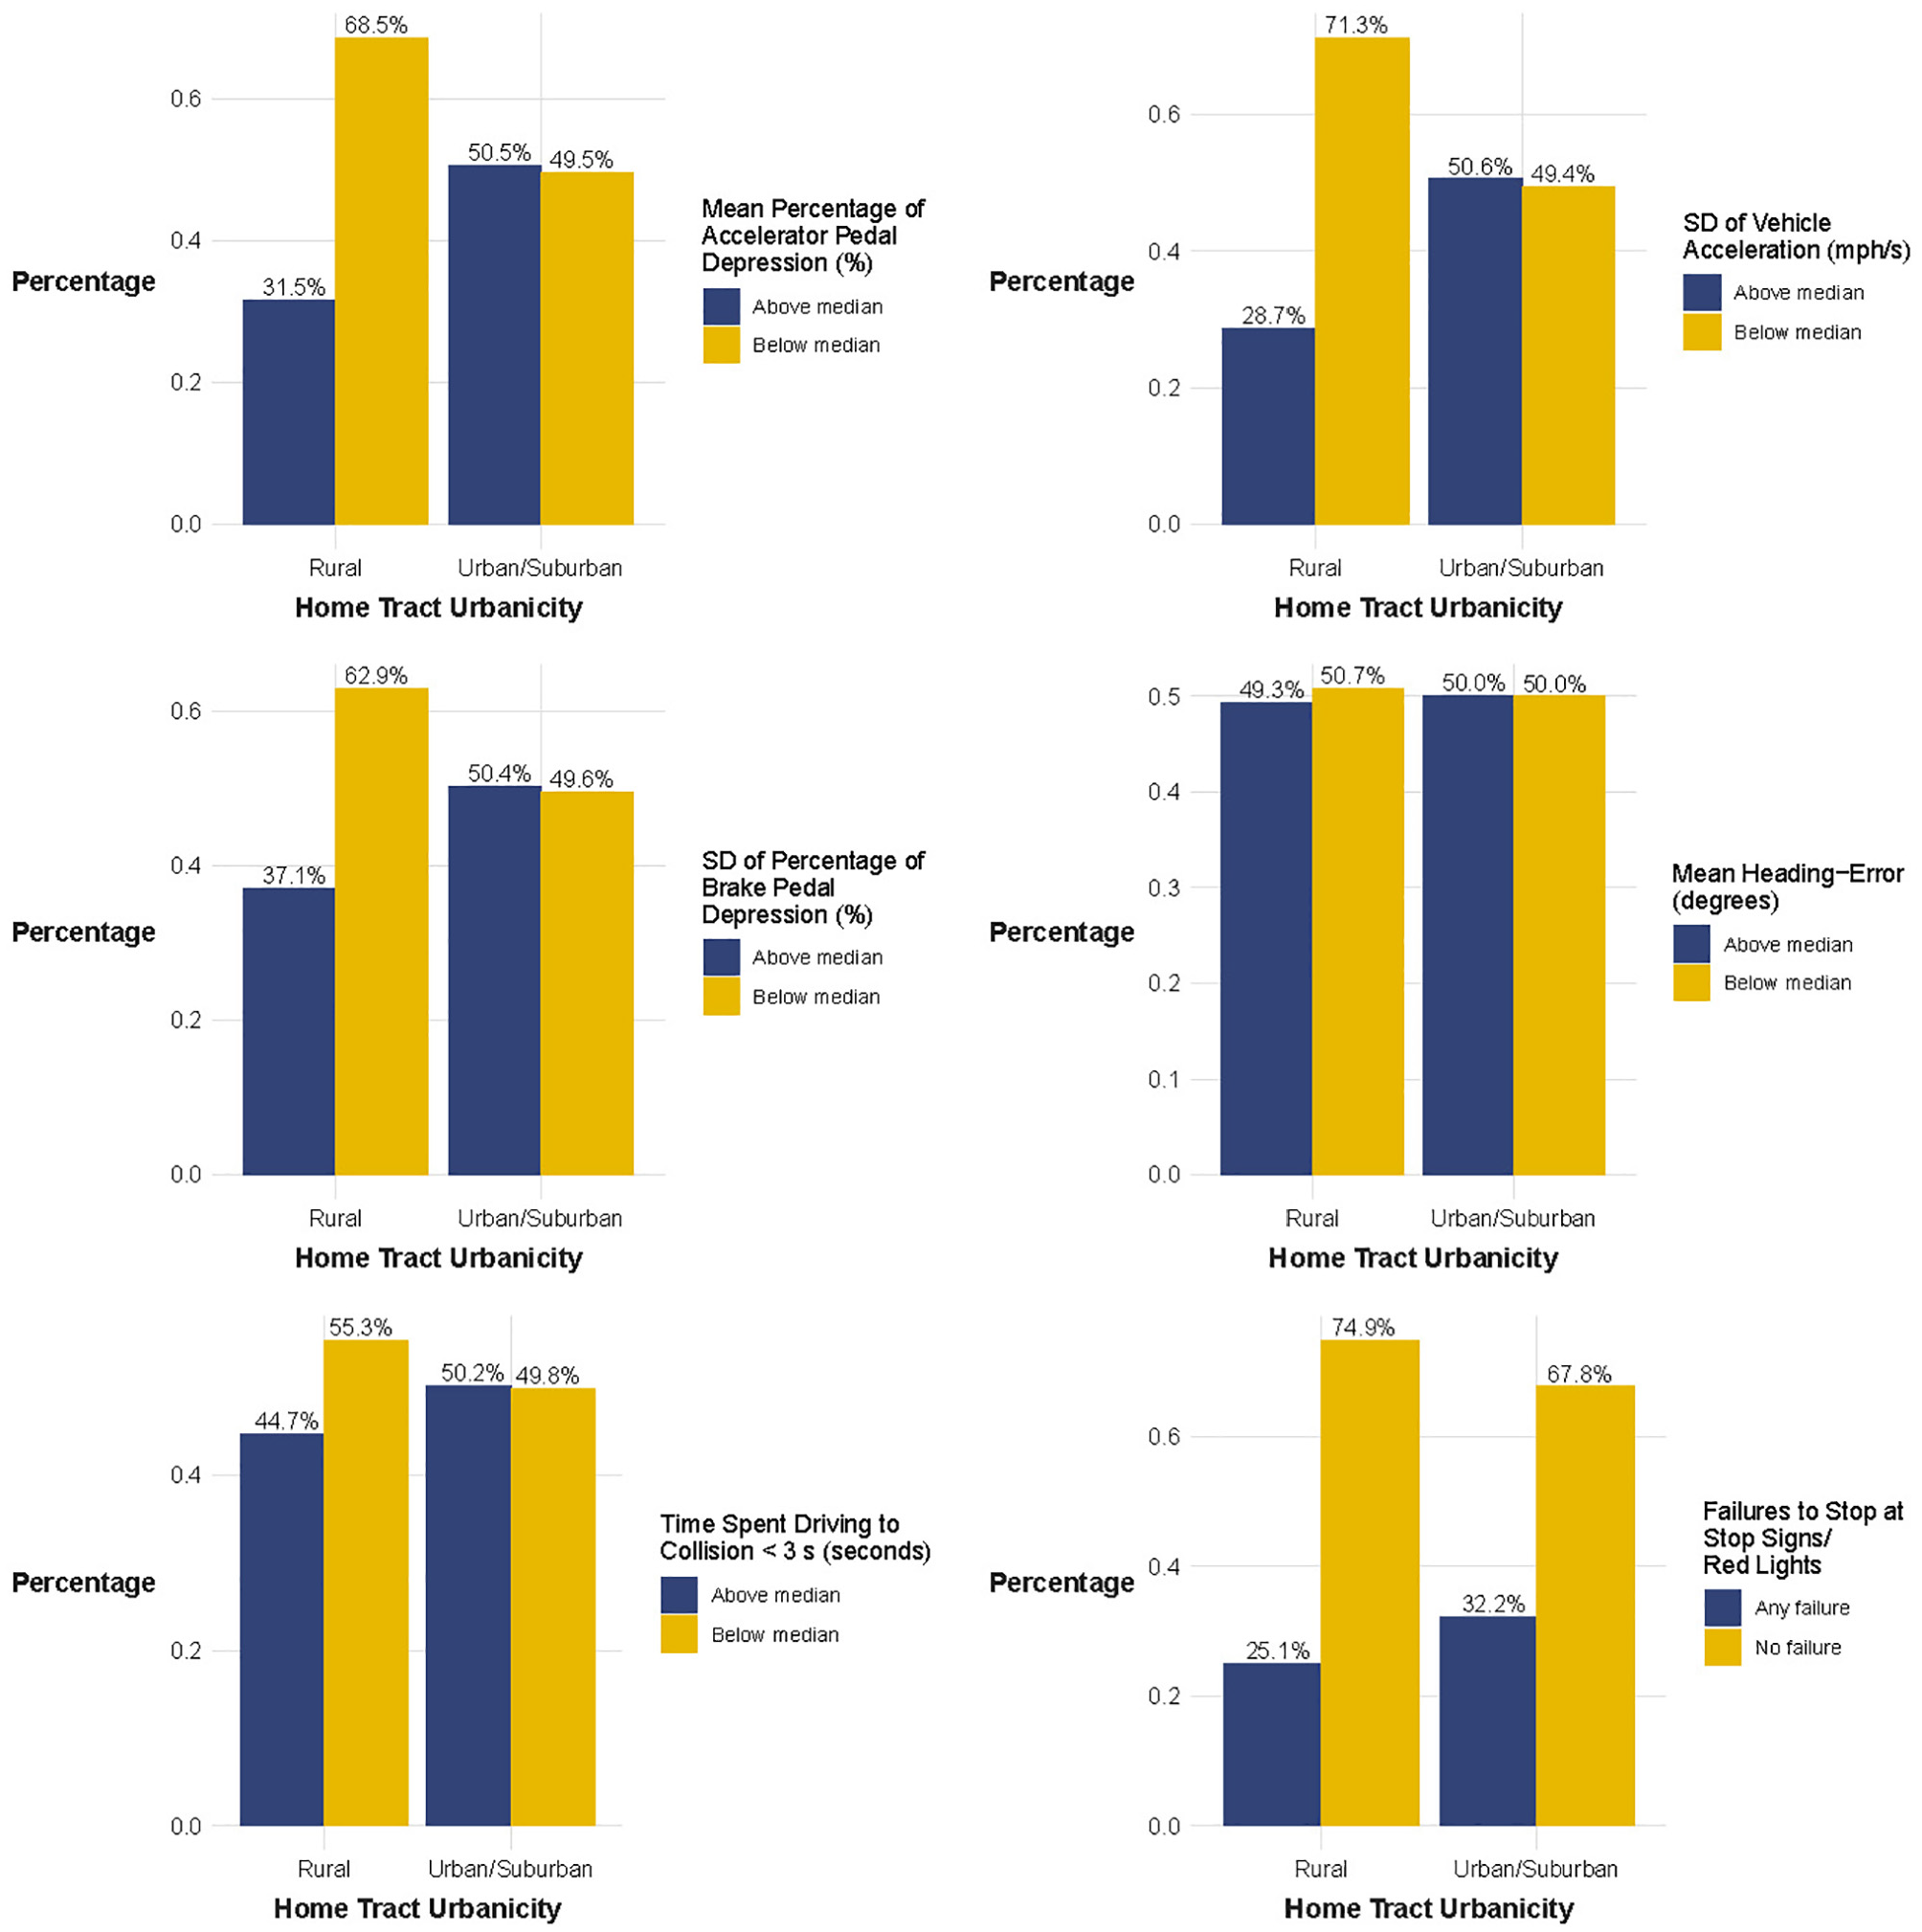
Categorical distributions of selected Virtual Driving Assessment (VDA) variables by young drivers’ home tract urbanicity: (top left) mean percentage of accelerator pedal depression, (top right) standard deviation of vehicle acceleration, (middle left) standard deviation of percentage of brake pedal depression, (middle right) mean heading-error, (bottom left) time spent driving to collision < 3 seconds, and (bottom right) failures to stop at stop signs/red lights.
Chi-Squared (χ2) Test Results and Contingency Tables of Categorized Virtual Driving Assessment Variables across Young Drivers from Urban/Suburban and Rural Tracts
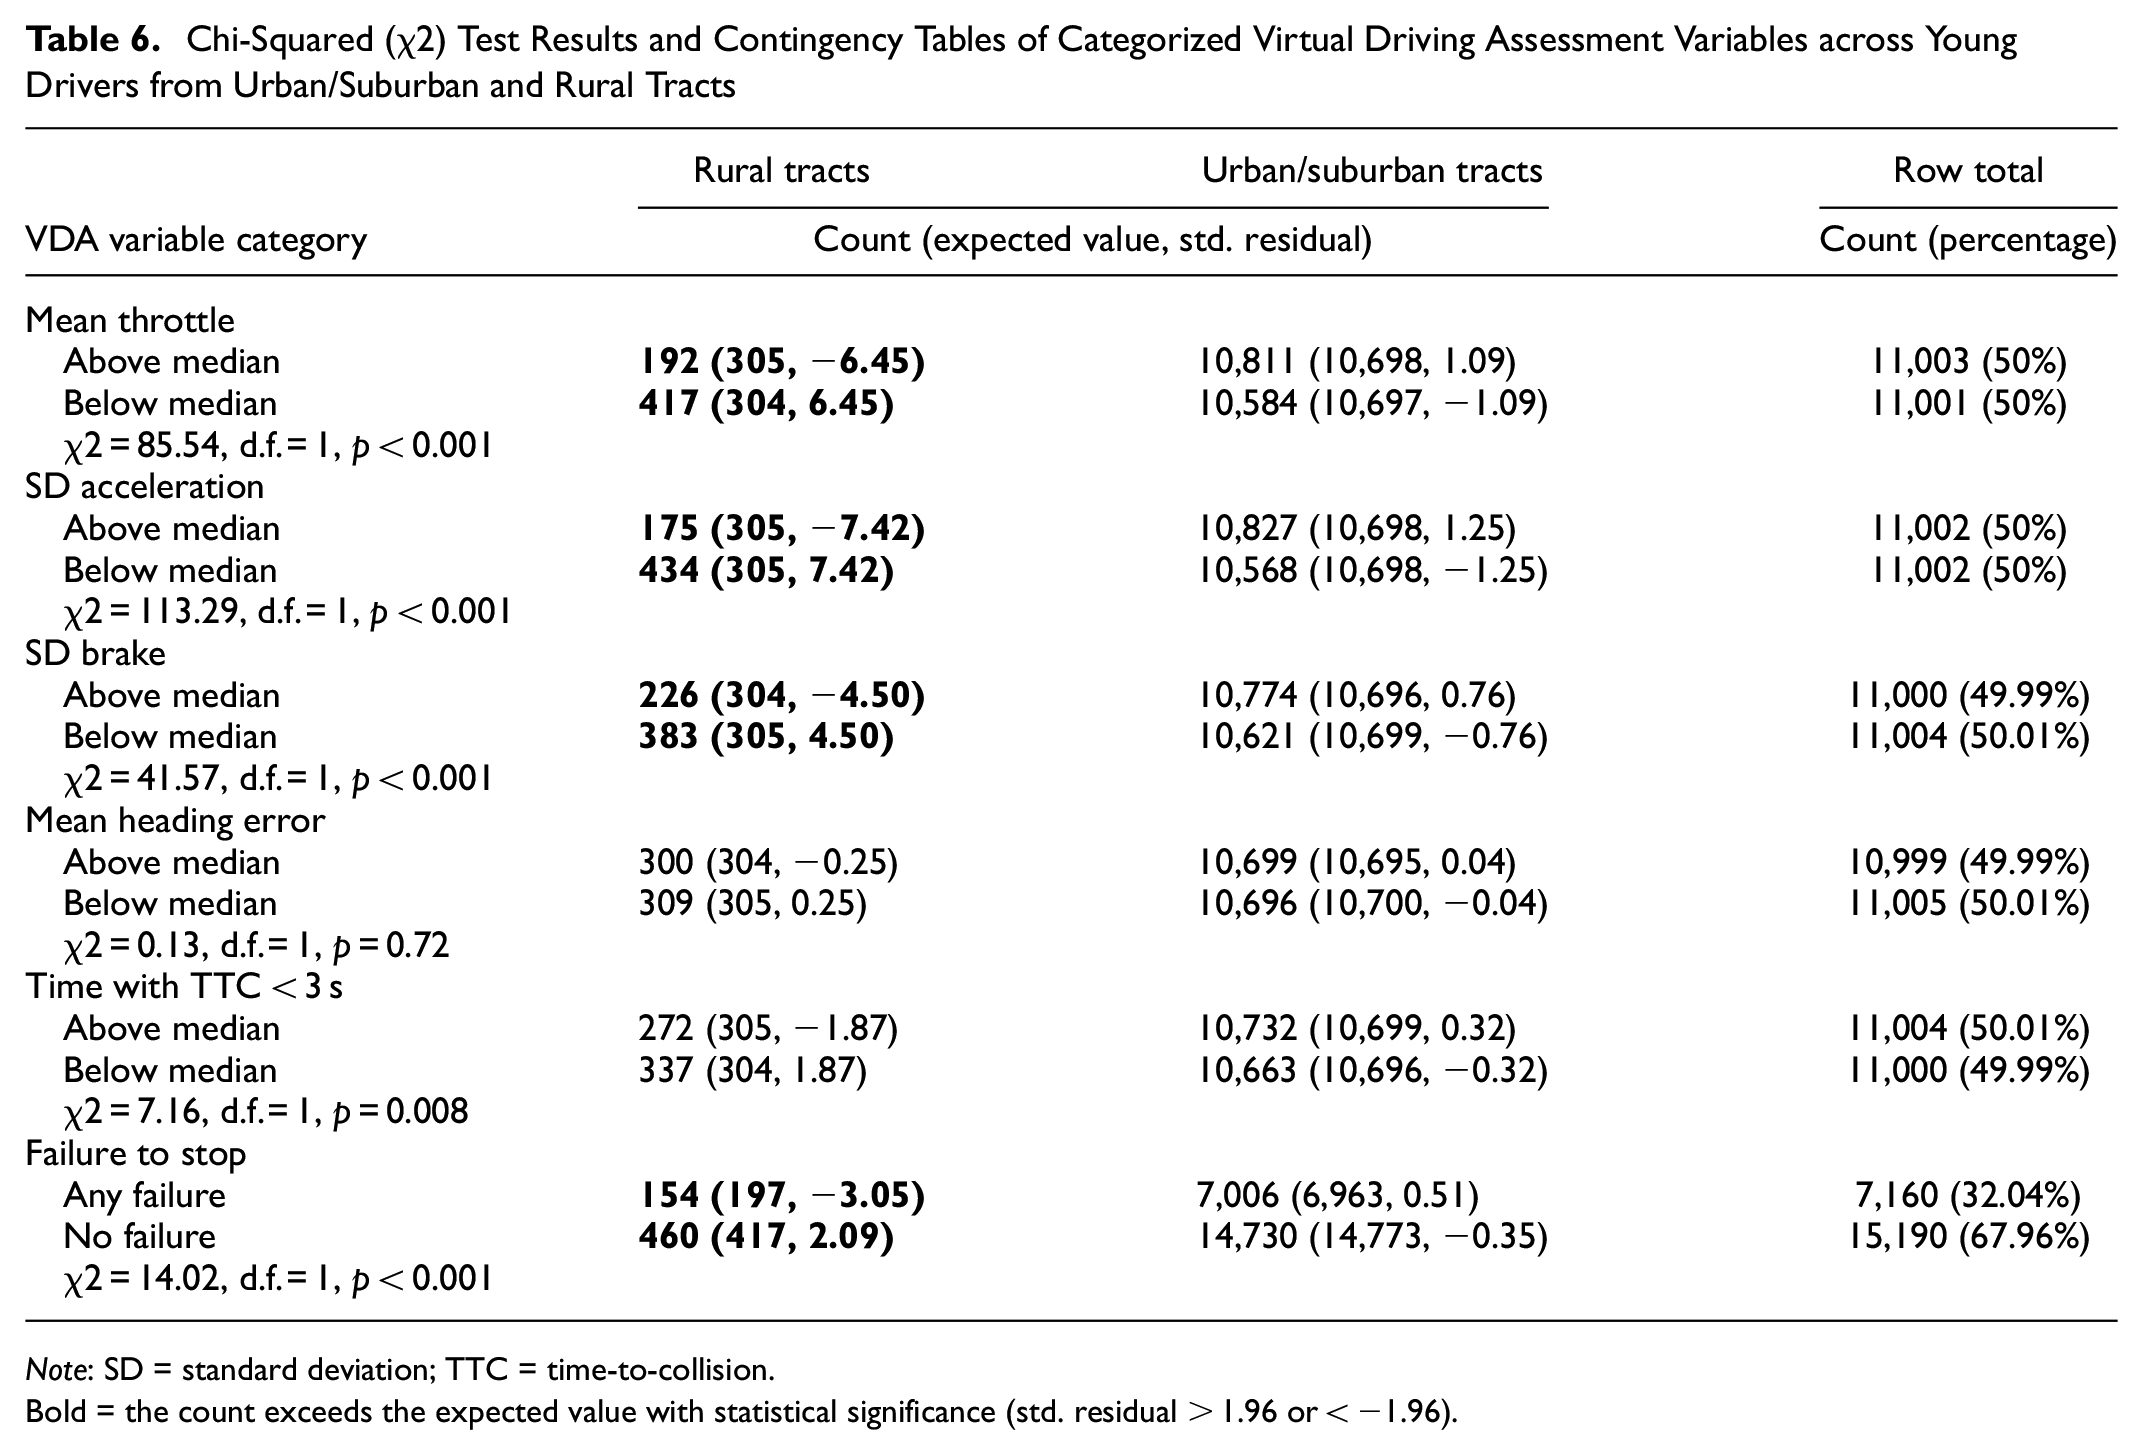
Note: SD = standard deviation; TTC = time-to-collision.
Bold = the count exceeds the expected value with statistical significance (std. residual > 1.96 or < −1.96).
Further analysis highlighted that young drivers from urban and suburban areas drove with greater variability in throttle and brake usage, potentially reflecting the stop-and-go traffic that is more typical of congested, densely populated areas. These differences were substantiated by significant findings in the Wilcoxon rank sum tests (p < 0.001 for both) and chi-squared tests (χ2 = 113.29 and 41.57, respectively, d.f. = 1, p < 0.001), indicating more frequent adjustments in acceleration and braking among urban/suburban drivers. The observed differences in acceleration and brake variability hold practical significance as well; Cliff’s delta values of 0.294 and 0.172, respectively, suggest medium effects of home tract urbanicity on young drivers’ acceleration and braking behaviors.
In contrast, mean heading error did not show significant differences between rural and urban/suburban young drivers (Wilcoxon p = 0.56; chi-squared χ2 = 0.13, d.f. = 1, p = 0.72). The Cliff’s delta of 0.014 also indicates a negligible effect of home tract urbanicity on young drivers’ lane position management skills, suggesting that drivers from all urbanicity levels perform similarly in maintaining lane position.
However, time spent driving with TTC less than 3 s differed notably across urban typologies (Wilcoxon p < 0.001; chi-squared χ2 = 7.16, d.f. = 1, p = 0.008). Rural drivers spent less time in this near-collision state, possibly indicating a lower frequency of close interactions with other vehicles or obstacles, which aligns with less-congested driving environments in their home neighborhoods. This pattern also extends to compliance with traffic rules, where rural drivers showed better adherence to stop signs and traffic lights than their urban/suburban peers (Wilcoxon p < 0.001; chi-squared χ2 = 14.02, d.f. = 1, p < 0.001). While only 25.1% of young drivers from rural tracts failed to stop appropriately, 32.2% of urban/suburban peers did so (see Figure 8). It is noteworthy that, although the differences in car-following distances and stop sign compliance between young drivers from rural and urban areas were statistically significant, the Cliff’s delta values of 0.086 and 0.068, respectively, indicate that the effect sizes of home tract urbanicity on these two VDA variables were small.
Interplay between Driving Skills
The analysis of the interplay between driving skills revealed the strongest correlations among speed-related, throttle-control, and braking-control skills, suggesting young drivers who exhibited a particular pattern in one of these areas (such as stable acceleration) were likely to show similar patterns in the others. Notably, a strong positive correlation (r = 0.74, see Table 7) was observed between mean throttle usage and SD acceleration. This correlation indicates that young drivers who frequently pressed the accelerator more intensely also exhibited greater variability in their acceleration rates. Additionally, a moderate correlation (r = 0.48) was found between SD acceleration and SD brake pedal depression, indicating that young drivers who changed speeds more inconsistently also tended to hit the brake more inconsistently. This pattern underscores a consistency in vehicle control variability, which could reflect a “jerky” driving style or the inexperience typical of novice drivers. Furthermore, a moderate correlation (r = 0.44) between mean throttle and SD brake indicates a co-occurrence of aggressive throttle use with inconsistent braking behaviors.
Spearman’s Correlation Test Results of Selected Virtual Driving Assessment Variables
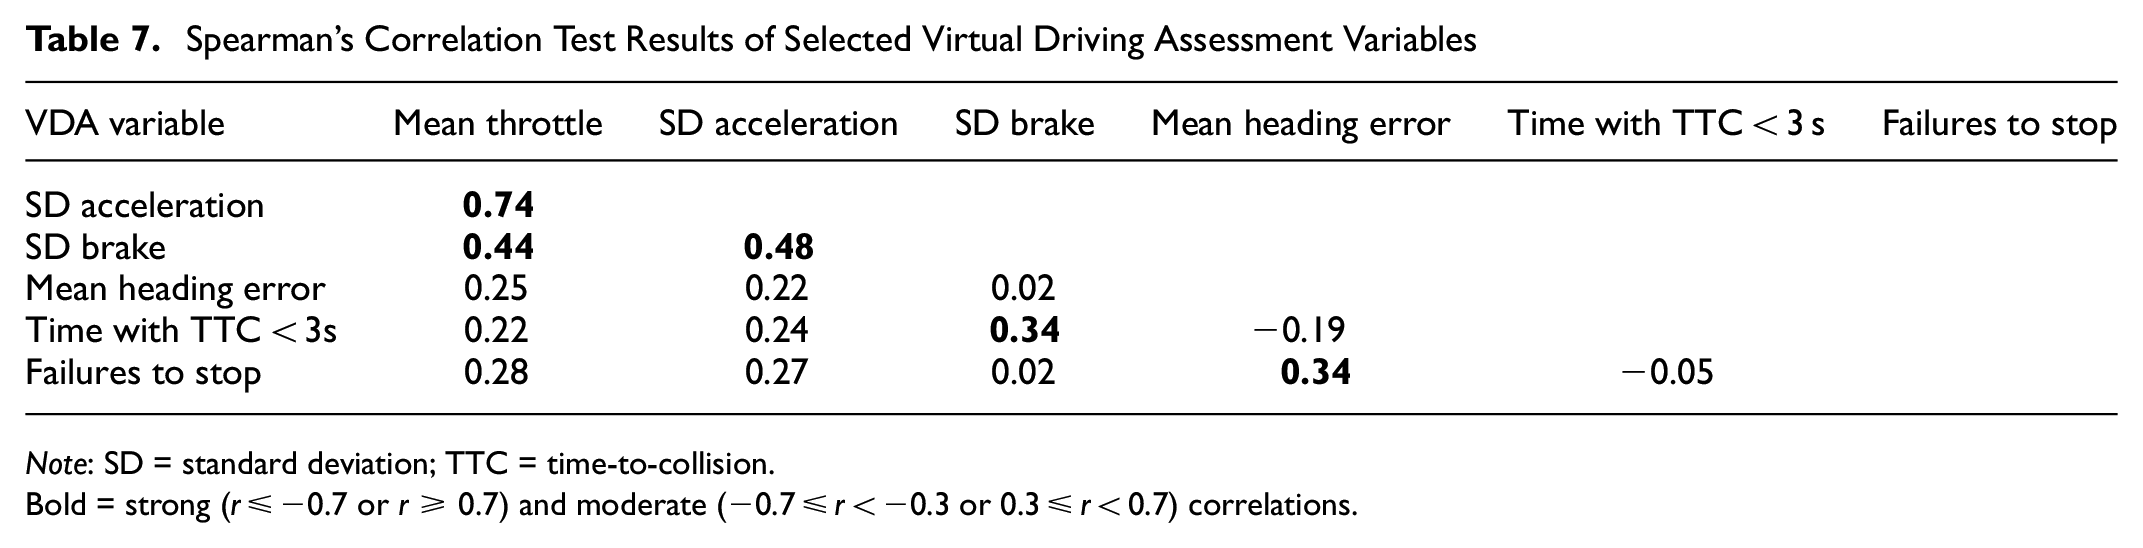
Note: SD = standard deviation; TTC = time-to-collision.
Bold = strong (r ≤ −0.7 or r ≥ 0.7) and moderate (−0.7 ≤ r < −0.3 or 0.3 ≤ r < 0.7) correlations.
Another moderate positive correlation (r = 0.34) is between the time spent driving with TTC less than 3 s and SD brake: in other words, young drivers who frequently tailgated also displayed more variable braking patterns. Additionally, the positive moderate correlation (r = 0.34) between mean heading error and failures to stop at stop signs/traffic lights (i.e., difficulties in maintaining lane position) are associated with an increased likelihood of violating stop signals.
Discussion
While research on young driver safety and crash risks has increased, investigation into deficits in specific driving skills is still incomplete, partly because of the lack of consistent, validated measures for young driver driving skills. A unique dataset of driving skill evaluations measured by a novel VDA enabled our analysis of skill disparities between young driver groups. In this section, we structure the analysis’ implications on drivers’ education and future research on young driver safety around the key findings.
We found that, compared with young drivers who had yet to complete driver training and obtain young driver licensure, those who had done so ran stop signs less frequently and could maintain lane position better. Notably, there was a moderate effect (−0.158) for DTYL on lane keeping, reflecting a statistically significant and practically meaningful improvement in performance that exceeds the threshold typically considered small by conventional standards (−0.33 to −0.147, or 0.147 to 0.33). Studies have shown that young drivers who have completed driver training have better overall driving skills, as indicated by their higher likelihood of passing the on-road examination for licensure ( 13 ). Furthermore, Ohio requires young drivers under the age of 18 years to complete 65 h of adult-supervised practice and 8 h of BTW training before taking the licensing examination. Thus, young drivers who have completed driver training and obtained licensure likely have better operational skills and greater familiarity with driving tasks. However, as the data collected were generated during administrative processes at Ohio BMV locations, data that captured young drivers’ experience or exposure pre-licensure driving exposure/experience were limited. Therefore, we were unable to account for potential variations in driving experience across young drivers from different levels of urbanization or economic backgrounds. Future research that gathers and controls for more nuanced measures of driving experience is recommended to enhance our understanding of how such experience influences the development of driving skills.
Meanwhile, our findings showed that, regardless of driver training completion and licensure status, those who failed to stop at stop signs were also more likely to deviate from travel lanes. Running stop signs and veering off from lanes reflect potential behavioral deficits of the driver. What remains to be clarified is whether the outcomes result from a lack of experience or a lack of adequate attention to regulatory signs or lane markings while driving. Future research might find merits in determining the causes of failing to stop at stop signs or maintain lane position through post-VDA interviews and/or questionnaires with the participants. Findings could help inform course design of driver education and BTW training to mitigate such behaviors that have been linked to elevated crash risks.
Furthermore, our finding that, even among formally trained and licensed young drivers, there were participants who ran stop signs and tailgated during the VDA highlights the importance of roadway design and management strategies that recognize the inevitability of human error. An example of such strategies is the Vision Zero policies many U.S. cities have adopted. These policies anticipate human error and promote infrastructure design and management countermeasures, such as traffic calming measures and speed cameras, that reduce the consequences of human error instead of trying to eliminate it.
We found no statistical differences in acceleration variability and tailgating measures between young drivers with and without driving training and licensure. An immediate implication is for future research to investigate whether these skills are related to crash risks among young drivers. If so, it might indicate that the current driver training programs have limited effectiveness in enhancing skills in these areas, as young drivers with driver training and licensure are as likely to have acceleration and tailgating issues as those without.
Our analysis also found significant associations between driving skill deficits and the urbanicity of the participants’ home neighborhoods. Young drivers who resided in rural tracts exhibited less intense throttle use and less variability in acceleration and braking behaviors, suggesting more consistent and potentially cautious driving patterns than their urban or suburban peers. This supports the notion that environmental factors play a crucial role in shaping driving behaviors ( 52 ). Future research could examine the effect of the dynamic and congested nature of urban environments versus the less congested, less dynamic rural environments in which young drivers learn to drive on their driving styles. In addition, future research should use comprehensive observational methods (e.g., structured observations) or experiments to explore the value of diverse driving experiences in developing a broader set of adaptable driving skills. This finding of the links between acceleration and braking behaviors and young drivers’ home neighborhood urbanicity also echoes another result: the association of inconsistent acceleration and braking with intense throttle use and close following suggests a consistent deficit in vehicle control among some young drivers. The association between braking variability and frequent tailgating possibly reflects a tendency toward more aggressive and risky driving behaviors—characterized by frequent sudden braking. This pattern of skill deficits highlights the importance of targeted driver training programs that aim to enhance the stability and predictability of young drivers’ vehicle control. Adapting teaching content and methods is crucial to meet the specific needs dictated by both urban and rural driving conditions. While the binary classification system used in this study highlights the distinct impacts of highly urbanized versus rural environments on the young drivers’ skills development, it may overlook the subtle variations within urban and rural classifications. Future research could benefit from integrating a more detailed classification system to better capture these transitions and their unique impacts.
While income was significantly correlated with certain driving skill deficits, the correlation was primarily driven by very few highly significant subgroups. For example, the significant associations between running stop signs/red lights and income were caused mainly by the higher-than-expected number of failures to stop among participants living in low-income Census tracts. For the other income groups, none of the observed numbers of failures to stop were significantly different from the expected values. Intriguingly, young drivers from high-income tracts were more likely to engage in more assertive yet unstable driving behaviors, such as intense throttle use and variable acceleration. Previous research has found that young drivers from lower-income areas have higher crash and fatal crash risk, and has attributed the elevated risks to younger drivers being more likely to drive older, less safe vehicles ( 53 ). By directly examining the participants’ driving skill deficits, our study revealed a potential mediator (i.e., driving training and licensure) to the association between income and driving skills. Previous studies in Ohio found that teenagers living in lower-income neighborhoods were less likely to complete driver training and obtain licensure than their peers in wealthier neighborhoods ( 12 ). Future studies investigating income and crash risks among young drivers should consider incorporating driver training and licensure status into the analysis to examine whether income’s connection with crash risks is mediated through driver training and licensure.
Relatedly, given the complexities and the potential overlapping influences identified among DTYL status, home tract income level, and urbanicity, there is a clear necessity to adopt multivariate models in future research. Initially, this study focused on isolating and thoroughly understanding the impact of each factor independently on young drivers’ acquisition of safe driving skills, which was crucial for the preliminary stages of our research. Moving forward, utilizing multivariate analysis would provide a more comprehensive understanding of how these variables, along with mediators such as access to driver training, interact and potentially compound to influence young drivers’ behaviors. The nuanced results obtained from such analyses could significantly enhance the development of targeted, effective interventions that address the underlying causes of risky driving behaviors.
Although VDA effectively records essential tactical and operational driving skills in potential common crash situations, because of perceived privacy concerns, Ohio did not allow for the inclusion of eye tracking as this required face-directed recordings. Therefore, the provided VDA database did not include metrics on visual scanning—another critical skill set that could further highlight individual differences between drivers living in different areas. Current studies in other field settings including both eye tracking and VDA capture visual-scanning performance, giving us the opportunity to explore scanning behavior in subsequent research when data become available. The addition of eye tracking recording will allow further exploration of the root causes of skill deficits as measured by VDA.
Furthermore, recognizing the importance of braking dynamics, we aim to develop refined metrics that capture both the frequency and intensity of braking actions. These metrics will be designed to provide insights into how adjustments are made by drivers, whether smoothly and predictably or abruptly, which could pose safety hazards. We also recognize the need for more comprehensive metrics that gauge a driver’s situational awareness and decision-making abilities. Effective hazard observation, recognition, and response, supported by adequate space management, are essential for safe driving. A structured, comprehensive approach is crucial for diagnosing and addressing hazard perception and decision-making faults in driving.
Lastly, while VDA encompasses 10 routes that vary in settings, road features, and the presence of other road users, it does not simulate specific rural driving environments, which often involve unique scenarios such as collisions with commercial vehicles and animals. Research has underscored the profound differences in the built environments and driving contexts between urban and rural areas, which are associated with varied driving behaviors, crash types, and risks (54–56). Future studies should, therefore, enrich VDA with a broader range of rural driving situations. This enhancement will facilitate deeper insights into the performance disparities between teenage drivers from urban and rural backgrounds under various urbanicity conditions. Also, because of differences in licensing laws, road infrastructure, and vehicle types, caution should be taken in generalizing the findings in this study to other countries. Future research should aim to replicate this study in diverse international settings.
Conclusion
This study leverages a novel VDA dataset to explore young drivers’ new skill disparities, revealing links between young drivers’ new skills development and DTYL, home neighborhood urbanicity, and income level. Our analysis showed that DTYL were associated with adherence to certain traffic regulations, such as stopping at stop signs and red lights, consistent brake usage, and better lane position control. Home neighborhood income levels were linked with some driving behaviors but not uniformly across all behaviors. Notably, young drivers from lower-income neighborhoods exhibited specific driving skill deficits, such as traffic rule compliance, throttle use, and lane position control, which might be mediated by factors such as access to quality driver training and vehicle safety. We found that rural young drivers were significantly better at consistent speed management and compliance with traffic rules. These insights contribute to an emerging body of literature that can be used to inform reevaluations of driver education curricula to better align with comprehensive safety outcomes, enhancing driving safety awareness and skill training. VDA provides a reliable assessment of critical safety driving skills by exposing drivers to common and serious crash scenarios. By doing so, it not only identifies errors in driving but also provides feedback on potential ways to improve skills. Future research should further investigate the root causes of these skill deficits for individual young drivers to inform training strategies that are tailored to individual needs. Findings could help unravel the complex interplay between economic factors and driving behaviors, which could, in turn, help refine educational and policy interventions to reduce young driver risks. By adopting a holistic approach that considers individual and home neighborhood factors, traffic safety researchers can better design interventions to promote safer driving practices among young drivers and, ultimately, contribute to broader road safety goals. We encourage researchers to consider developing customizable materials and strategies that can be utilized by examiners, instructors, and young drivers themselves for more effective testing, training, and self-evaluation. Potential intervention strategies include creating training materials that can be tailored to each learner’s distinct needs as identified by diagnostic tools such as VDA.
Footnotes
Acknowledgements
The authors would like to acknowledge Mr. Alexander Gonzalez, Mr. Shukai Cheng, Arcus, and the Data Science and Biostatistics Unit at the Children’s Hospital of Philadelphia for their support in data management. We also extend thanks to the Ohio Bureau of Motor Vehicles and Diagnostic Driving Inc. for their valuable support during the course of this research.
Author Contributions
The authors confirm contribution to the paper as follows: study conception and design: J. Wu, X. Dong, E. Walshe, F. Winston, M. Ryerson; data collection: J. Wu; analysis and interpretation of results: J. Wu, X. Dong, E. Walshe, F. Winston, M. Ryerson; draft manuscript preparation: J.Wu, X. Dong, E. Walshe, M. Ryerson. All authors reviewed the results and approved the final version of the manuscript.
Declaration of Conflicting Interests
The author(s) declared the following potential conflicts of interest with respect to the research, authorship, and/or publication of this article: Flaura K. Winston has intellectual and financial interests in Diagnostic Driving, Inc., which provided the Virtual Driving Assessment in Ohio. This research utilized proprietary data provided by Diagnostic Driving, Inc. through its virtual driving assessment product, Ready-Assess TM (![]() ). This potential conflict of interest is managed under a conflict-of-interest management plan from CHOP and the University of Pennsylvania.
). This potential conflict of interest is managed under a conflict-of-interest management plan from CHOP and the University of Pennsylvania.
Funding
The author(s) disclosed receipt of the following financial support for the research, authorship, and/or publication of this article: Research reported in this publication was supported by the U.S. National Highway Traffic Safety Administration through the Ohio Traffic Safety Office, as well as a gift from New Jersey Manufacturers Insurance Group to the Children’s Hospital of Philadelphia.
Data Accessibility Statement
The driver licensing and virtual driving assessment (VDA) data used in this study were obtained from the Ohio Bureau of Motor Vehicles and Diagnostic Driving Inc. and are subject to licensing restrictions. The American Community Survey (ACS) data and TIGER/Line® Shapefiles are publicly available from the U.S. Census Bureau websites.