
Abstract
This paper evaluates the half-life performance of the first three 40 year design life jointed plain concrete pavements built in California, in the early 2000s. The projects, two on I-15 and one on I-40, have a combined total length of 420 lane kilometers (260 lane miles), are in desert areas, and have heavy truck traffic. The pavement performance evaluation used data from the California Department of Transportation (Caltrans) pavement-management system (PMS) databases, including pavement condition surveys, field data, and construction histories. An in situ evaluation of the projects done in 2022 included measurement of international roughness index (IRI), visual inspection, coring, and falling-weight deflectometer testing. Cores were extracted to explain the field performance based on the modulus of elasticity, compressive strength, electrical resistivity, coefficient of thermal expansion, water absorption, and degree of hydrations of concrete. Overall, the performance of the projects has been excellent so far: the transverse and third-stage cracking (slabs with two or more cracks) is essentially zero in all lanes, faulting is also essentially zero, longitudinal cracking is not severe, and the IRI has been stable since construction. Concrete mix designs and properties from cores correspond to durability observations. AASHTOWare Pavement ME analysis supports the excellent performance of the projects. Further, none of the three projects has required any maintenance or rehabilitation activity since their construction. The outcomes of this study support Caltrans’ adoption of 40 year designs as the standard design life of concrete pavements and encourage the consideration of longer design lives.
The goals of upgrading pavement design and construction practices are to improve the cost-effectiveness of investments in road infrastructure by reducing life-cycle costs (LCC) and to improve the environmental performance of road infrastructure by reducing life-cycle global warming impact and other priority environmental impacts, particularly air pollution in California.
For many decades, Caltrans designed new concrete and asphalt pavements for a 20 year life and major asphalt pavement rehabilitation for a 10 year life, without standards for concrete-pavement rehabilitation. In 1996, an internal Caltrans study was undertaken to compare the LCC of rehabilitating an existing Portland cement concrete (PCC) pavement using a standard 10 year asphalt concrete (AC) overlay strategy with LCC using a 35 year PCC pavement strategy. The Caltrans term for this new approach was “Long Life Pavement Rehabilitation Strategy (LLPRS).” The primary goal of the LLPRS was to achieve fast construction and thereby reduce road-user traffic delay while also seeking longer life and less life-cycle maintenance. The study found that for annual average daily traffic (AADT) above about 150,000 or truck traffic higher than about 15,000 trucks per day, user costs were dominant in strategy selection compared with agency costs, and that concrete LLPRS typically had lower LCC than the conventional 10 year AC overlay ( 1 ).
In April 1997, Caltrans created the LLPRS Task Force and commissioned it with the goal of implementing longer-life pavement design, construction, and maintenance/rehabilitation strategies in California. The focus of the LLPRS Task Force was originally concrete pavements, and several initiatives were undertaken. One was the construction of several 40 year design life jointed plain concrete pavements (JPCP) in Southern California. The positive experience gained from the construction and initial performance of these 40 year JPCP design projects, built in the early 2000s, contributed to the idea of expanding the design life of concrete pavement beyond 20 years. Other factors that contributed to the same idea are listed below:
Advancements in materials science, construction quality control/quality assurance practices, and pavement design, including the introduction of the AASHTO Mechanistic-Empirical Pavement Design Guide (MEPDG) in 2004 ( 2 ).
Evidence of some JPCP performing well beyond the expected 20 year design life, including experiences in the U.S. ( 3 ) and Europe ( 4 ).
Accelerated pavement testing in the late 1990s and early 2000s that evaluated joint spacing, concrete materials, use of dowels, slab thicknesses, slab widths, and drying shrinkage effects ( 5 ).
Thinking and paying attention to the development of best practices contributing to longer concrete-pavement lives (materials, joint spacing, dowels, drainage, consideration of climate regions, consideration of axle load spectra, and curing, among other practices), many documented in a 2008 publication about concrete-pavement design for 100 year life ( 6 ).
Assessment of the LCC benefits associated with longer-life designs (7–9).
Caltrans implemented the 40 year design life for concrete pavements in its Highway Design Manual catalog in 2007. The catalog was initially developed by the University of California Pavement Research Center (UCPRC) using the MEPDG version 0.8 ( 10 ) and was adjusted by Caltrans based on experience. The 40 year design life is still in place; it is mandatory for all JPCP and continuously reinforced concrete pavements built in Caltrans’ highway network, and it was followed in the development of the 2022 update of the concrete-pavement design catalog ( 11 ). The 2022 catalog has been developed employing AASHTOWare Pavement ME version 2.5.5 ( 12 ) and calibrated using more than 40 years of Caltrans pavement-management system (PMS) data for the entire concrete-pavement network ( 13 ). The proof that the initiatives implemented by Caltrans worked is that its concrete pavements are outperforming nationally calibrated Pavement ME predictions ( 12 , 13 ). Overall, the Caltrans-calibrated Pavement ME designs result in slabs that are 15 mm (0.6 in.) thinner than the nationally calibrated Pavement ME ( 13 ).
Around 20 years have passed since the first JPCP 40 year design projects were built in Southern California. The 20 year (half design life) performance can provide information to assess whether these projects are on track to meet the expected life. That assessment constitutes the goal of the study presented in this paper.
While Caltrans JPCPs are now designed for 40 year lives, the term “longer life” is used in this paper for referring to the first set of JPCP 40 year designs as, back in the early 2000s when they were built, their design life was twice the design life adopted by JPCP standard practice on the Caltrans road network and the rest of the U.S.
The research presented in this paper is based on the half-life performance evaluation of the JPCP longer-life projects (40 year design life) that were built in Southern California in the early 2000s. The goals of the research are to determine whether these pavements are on track to meet the expected life, to assess design hypotheses, and to learn lessons from the half-life performance of these pavements.
Methodology
PMS Data
The experimental data for the study presented in this paper come mainly from Caltrans PMS databases, in particular:
The pavement condition survey (PCS) database. This database includes the PCS conducted by Caltrans every 1 or 2 years, including automated PCS (APCS) since 2011. These surveys provide per-lane condition data for the entire Caltrans road network. The last PCS included in this study was conducted in 2022. For JPCP, the PCS database includes:
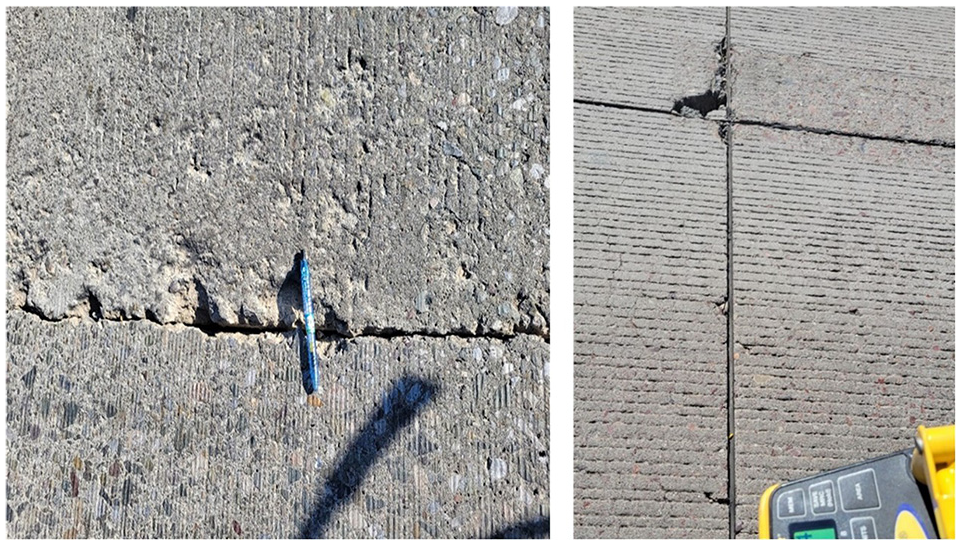
Slab cracking, quantified in different ways: percentage of slabs with longitudinal, transverse, and corner cracking, referred to as first-stage cracking (1st Stg. Cr.), and third-stage cracking (3rd Stg. Cr.). The first-stage cracking consists of a single crack, either longitudinal or transverse, in the slab; the third-stage cracking consists of two or more longitudinal and/or transverse cracks, frequently two cracks that intersect each other and break the slab into three or more pieces (Figure 1).
Transverse joint faulting, quantified as a percentage of 0.16 km (0.1 mi) segments with 3.8 mm (0.15 in.) faulting or more.
Smoothness, quantified as International Roughness Index (IRI).
A pavement as-built database, which includes all maintenance, rehabilitation, and reconstruction activities conducted in the Caltrans road network. The pavement layers (type and thickness) placed in each pavement maintenance, rehabilitation, and reconstruction activity are also included in this database.
A traffic database, which includes the traffic volume, the trucks percentage, and truck-traffic weight-in-motion (WIM) axle-load-spectrum intensity number (1 lightest to 5 heaviest axle loading per number of axle passes) for each highway location and lane ( 14 ). The WIM number is used by Caltrans for pavement design and management. Each WIM intensity number comes from grouping data from the more than 100 WIM stations into characteristic groups. The five WIM numbers represent truck-traffic characteristics that exist on the Caltrans road network.
A climate database, which includes the climate region for each highway location. Caltrans considers nine climate regions, based on pavement surface temperature and rainfall, for pavement design and management ( 15 ). The pavements included in this study are located in the “desert” climate region.
The project plans database, which includes the construction plans for each pavement project executed in Caltrans’ road network. The plans for each of the three JPCP projects were downloaded from the database and reviewed for this study.
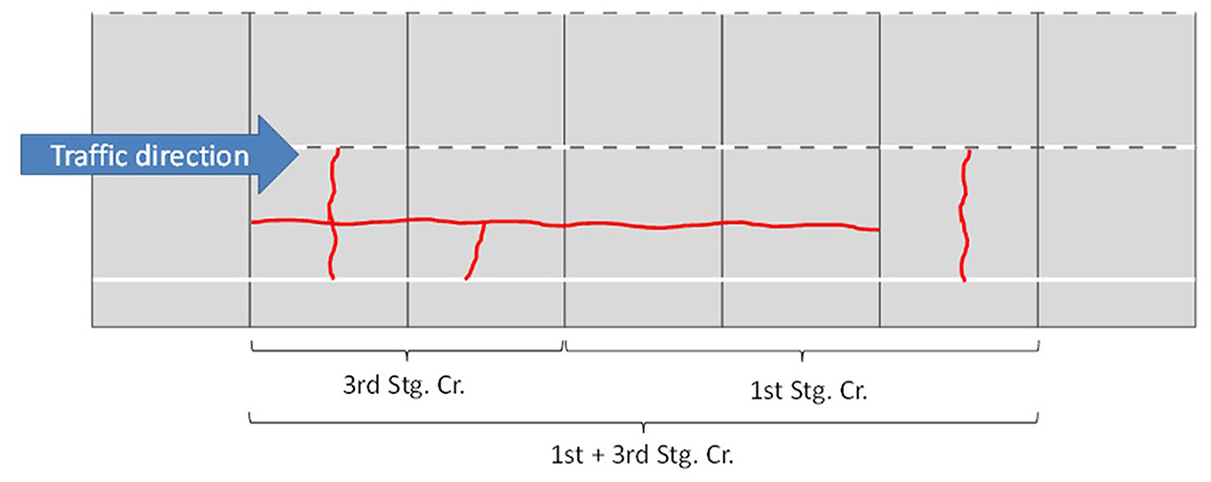
Depiction of first- and third-stage pavement cracking.
Field Evaluation
In addition to the PCS and APCS data, the present condition of the three JPCP projects was assessed by an in situ evaluation conducted by the UCPRC in 2021 and 2022. The in situ evaluation included the laser profiler evaluation of the complete projects (all lanes), in September 2021, and road closure of 1.6 km (1 mi) per project (located in the truck lane), in February–March 2022, pursuing several goals which included visual inspection, coring (to verify slab thickness and base type and to measure compressive strength, modulus of elasticity, electrical resistivity, coefficient of thermal expansion, water absorption, and degree of hydration in the laboratory), and falling-weight deflectometer (FWD) evaluation (to determine the transverse-joints load-transfer efficiency [LTE]).
Performance Assessment Approach
The assessment of the performance of the projects is based on the following criteria, which are related to PMS decision-tree treatment trigger values:
Maintenance/rehabilitation activities that each project has required since construction.
Comparison of measured distress levels (cracking, faulting, and IRI) versus the different threshold values that trigger some type of maintenance/rehabilitation action in the Caltrans road network. These threshold values are as follows:
Third-stage cracking: 3% triggers individual slab replacement; 10% triggers reconstruction.
Faulting: 25% triggers grinding.
IRI: 2.7 mm/m (170 in./mi) triggers grinding.
Comparison of measured transverse cracking versus the transverse cracking predicted by AASHTOWare Pavement ME (only transverse cracking is considered since this software cannot predict longitudinal cracking or third-stage cracking).
In situ evaluation of a 1.6 km (1 mi) segment per project:
Visual inspection;
LTE of the transverse joints, based on the FWD evaluation;
Laboratory testing of the extracted PCC cores.
Coring
Seven to eight cores, each 150 mm (6 in.) in diameter, were extracted from each of the projects. The cores were extracted at the middle of the slabs. Overall, the thicknesses measured from the PCC cores were similar to or slightly above the design thicknesses, as expected. Based on the extracted cores, the base type was AC in all the three projects, and the base was debonded from the PCC in most cores.
Laboratory Test Methods
Cores of 150 mm (6 in.) diameter were extracted from the three pavement sections for laboratory evaluation. The cores were cut at the ends to produce specimens with height as close as possible to 300 mm (12 in.). The following mechanical tests were performed on the cores: modulus of elasticity (MOE) per ASTM C469 ( 16 ), and compressive strength testing according to ASTM C39 ( 17 ).
Concrete durability in harsh desert conditions, with generally low humidity, high day/night and seasonal temperature gradients, and periodic high-intensity rainfall events, depends significantly on its ability to resist water penetration that carries harmful ions through its pore system and on the coefficient of thermal expansion. For pore connectivity and indicators of the durability performance of the concrete, the following tests were performed.
Bulk electrical resistivity (ER) of the cores (ASTM C1876) is important to identify the pore connectivity, durability, and quality of concrete and was performed on 100 mm × 200 mm (4 in. × 8 in.) core cylinders ( 18 ).
A water absorption test (ASTM C1585) ( 19 ) was performed on cores extracted from the pavement to identify the permeability and durability of the concrete. Two 50 mm (2 in.) cores were cut from the top and middle of the field cores and used for this test.
Coefficient of thermal expansion (CTE) testing. CTE is an important design parameter for concrete pavements, and is necessary for the evaluation of pavement performance, particularly in desert environments. The CTE test was done on one core of size 100 mm × 177.8 mm (4 in. × 7 in.) for each section, according to AASHTO T336-19 ( 20 ).
Thermogravimetric analysis (TGA). Representative paste samples weighing a few grams were taken from various areas of the broken cylinders and crushed into powder. The powdered samples were freeze-dried for 24 h to remove any free water. The samples were then subjected to a temperature range from 25°C to 1000°C (77°F to 1832°F). The mass loss in known temperature regions 400°C to 500°C (752°F to 932°F) was analyzed to determine the amount of calcium hydroxide (portlandite) consumption, which is an indicator of the reactivity. TGA was also used to measure the amount of calcium carbonate (CaCO3) in the powdered samples. The mass loss in the temperature range between 600°C to 780°C (1112°F to 1436°F) was considered as the decomposition of the CaCO3. The bound water was calculated as the mass loss between 105°C to 1000°C minus the mass loss arising from the decomposition of CaCO3. Finally, the degree of hydration was calculated by normalizing the bound water with the maximum possible hydration of ordinary cement paste, which is 0.23 g/g of cement.
Scope
This study’s experimental data come from three pavements located in a desert climate area in California. Some of the conclusions are not directly applicable to other climates, particularly where wet-freezing conditions exist.
Overview of the JPCP Projects
Location and General Information
All projects are located in the Mojave desert, northeast of Los Angeles in Southern California (Figure 2). The three JPCP projects include a total of 423 lane kilometers (263 lane miles). They were built between March 2001 and July 2005.
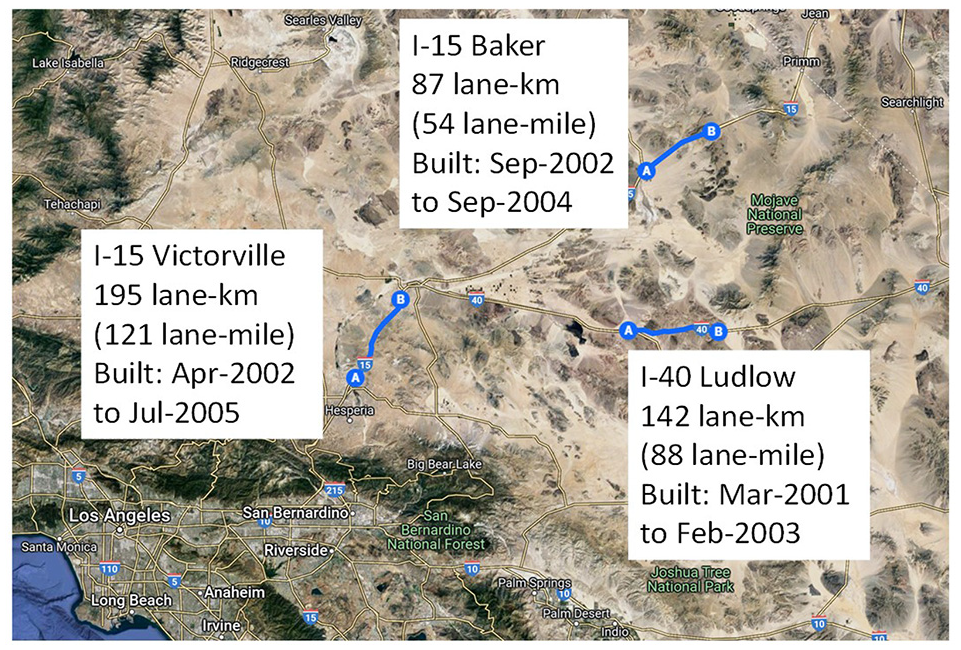
JPCP longer-life projects location.
Structural Section, Truck Traffic, and Design Features
Figure 3 shows the pavement cross section of each project, the construction years, the annual average daily truck traffic (AADTT) of the truck lane, and some design features. The WIM spectra intensity number is 4 for I-15 Baker and 5 for I-15 Victorville and I-40 Ludlow. As explained above, the WIM spectra 5 is the heaviest in Caltrans highway network, with an average truck accounting for around 0.33 18 kip equivalent single axle loads (ESALs). For the WIM spectra 4, an average truck accounts for around 0.30 ESALs. The truck lanes of the projects have supported the following truck traffic between construction and the year 2022, the end of the evaluation period considered in this paper: I-15 Baker 19.1 million trucks (5.7 million ESALs), I-15 Victorville 33.5 million trucks (11.1 million ESALs), and I-40 Ludlow 19.4 million trucks (6.4 million ESALs).
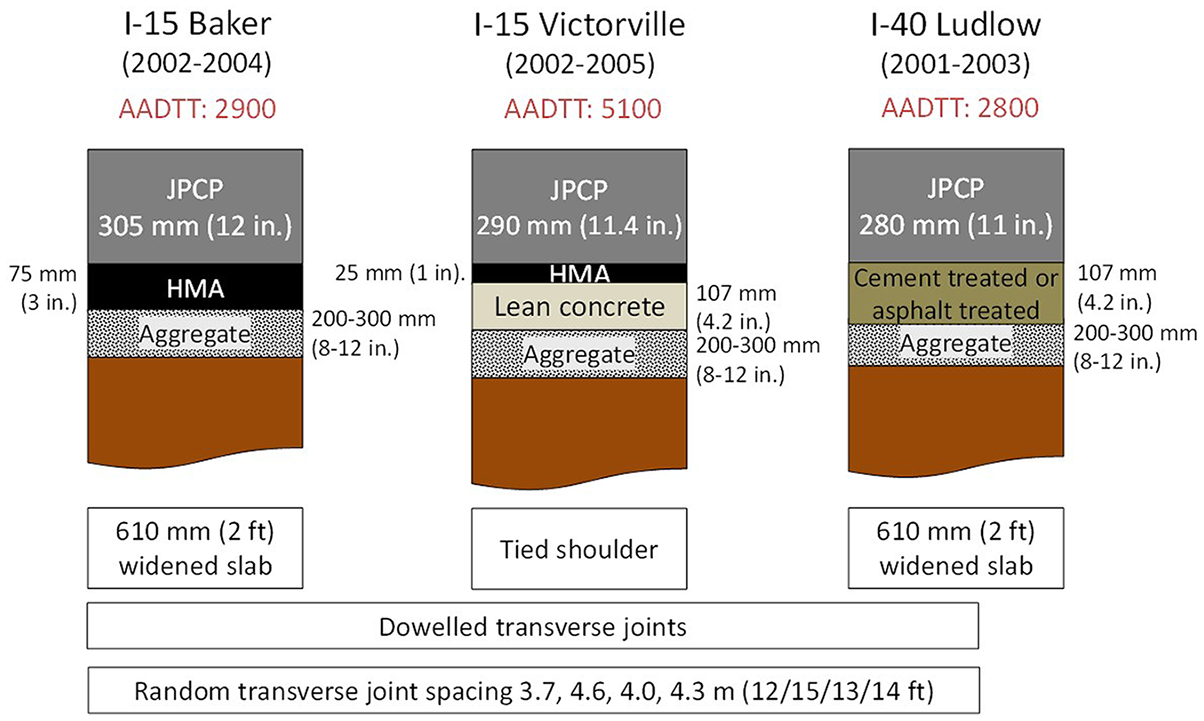
JPCP longer-life pavement sections and design features.
The base type varied from project to project. The base was hot-mix asphalt (HMA) in I-15 Baker, and lean concrete with an HMA interlayer in I-15 Victorville. Cement-treated and asphalt-treated bases were used on I-40 Ludlow. All sections were provided with a crushed-aggregate subbase. The three projects include tied longitudinal joints and dowelled transverse joints with epoxy coated dowels. The mandatory use of dowels at the transverse joints was implemented by Caltrans in the early 2000s when these projects were built, and the practice is still in place. The three projects have random transverse joint spacing of 3.7, 4.6, 4.0, and 4.3 m (12, 15, 13, and 14 ft), a practice that was discontinued by Caltrans around 2010. Current Caltrans practice for new JPCP is 4.3 m (14 ft) fixed transverse joint spacing.
Concrete Mix Designs
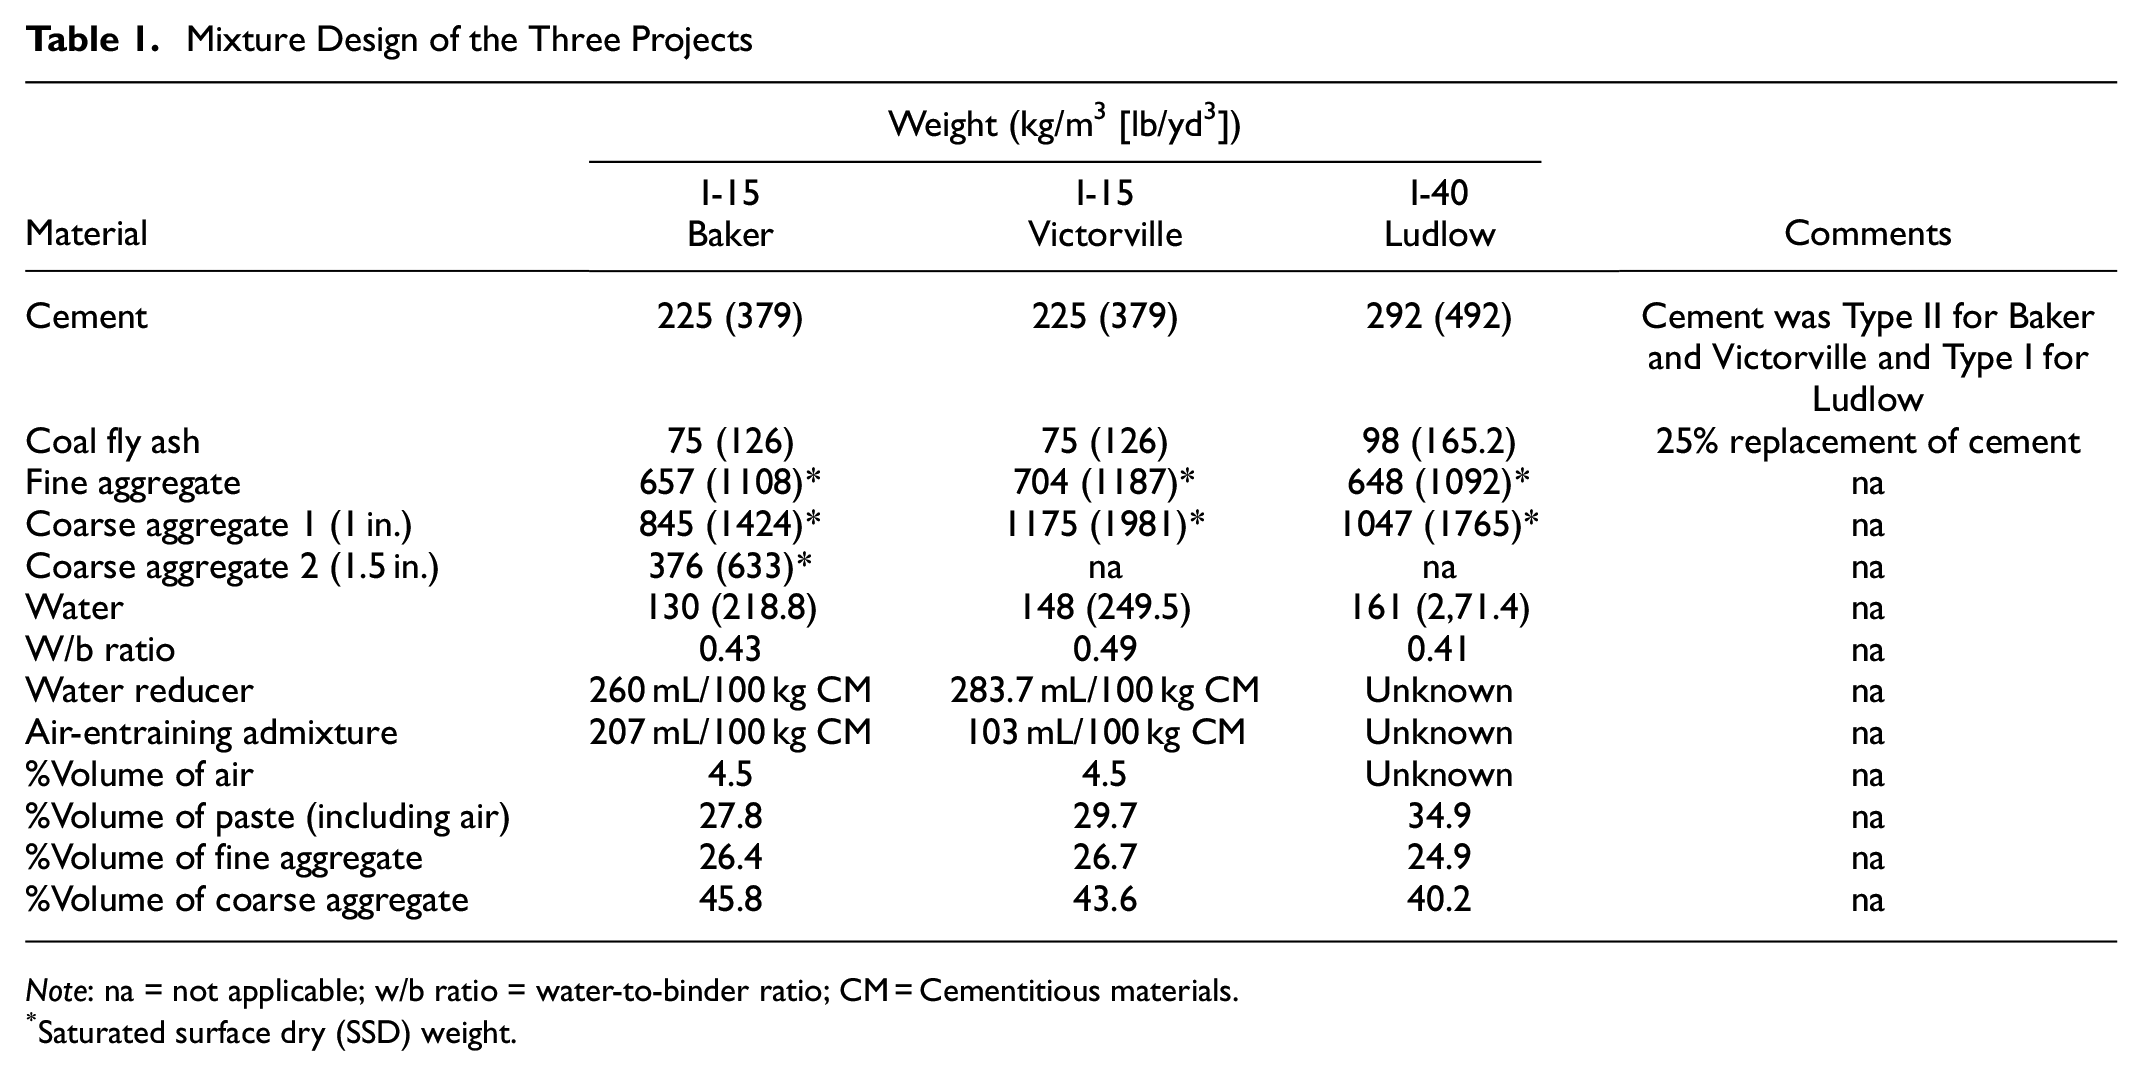
The concrete mix design used in the construction of the slabs of each of the three projects is presented in Table 1. The total cementitious content for both I-15 projects at Baker and Victorville was 300 kg/m3 (505 lb/yd3). However, for the I-40 project at Ludlow, a higher binder content of 390 kg/m3 (657 lb/yd3) was used. All three projects used 25% fly ash as a replacement for Type II cement for I-15 Baker and I-15 Victorville and Type I cement for I-40 Ludlow. The water-to-binder ratios (w/b) for I-15 Baker, I-15 Victorville, and I-40 Ludlow were 0.43, 0.49, and 0.41, respectively. Water-reducing admixtures were used in all three projects. The design air content for the Baker and Victorville section of I-15 was 4.5%, whereas the air content was not reported in the mix design of the I-40 Ludlow section.
Mixture Design of the Three Projects
Note: na = not applicable; w/b ratio = water-to-binder ratio; CM = Cementitious materials.
Saturated surface dry (SSD) weight.
For the Victorville project, the maximum aggregate size was 25 mm (1 in.). However, for the I-15 Baker project, both 25 mm (1 in.) and 38 mm (1.5 in.) aggregate were used. The gradations of the aggregates for I-15 Baker and I-15 Victorville are presented in Figure 4. For the I-40 Ludlow project, concrete aggregate size and grading were not available in the mix design.
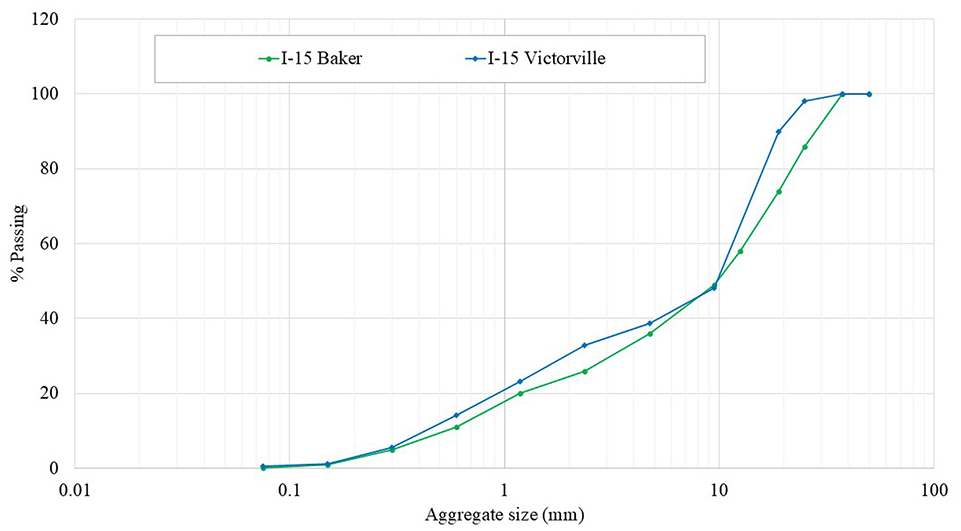
Combined gradation of the aggregates used for concrete.
No information was found on the types of aggregates used in the three projects, which were all sourced locally.
Maintenance and Performance Histories
Maintenance History
None of the three JPCP projects have required any maintenance/rehabilitation activity (e.g., individual slab replacement or grinding) since their construction. An example H-Chart output from the Caltrans as-built database for one of the project’s lanes (I-15 Baker, lane 3 northbound) is shown in Figure 5. The H-Chart is a plotting tool used by Caltrans for pavement-management purposes. The plot shows the highway segment boundaries on the x-axis and the timing on the y-axis for different maintenance and rehabilitation activities. The H-Chart in Figure 5 shows the I-15 Baker project construction in 2004 (end of construction) and an HMA overlay applied on the previous pavement in 2001. No activity occurred after the JPCP project was built in 2004. The H-Charts showed similar results for all the other projects, with no work since their construction.
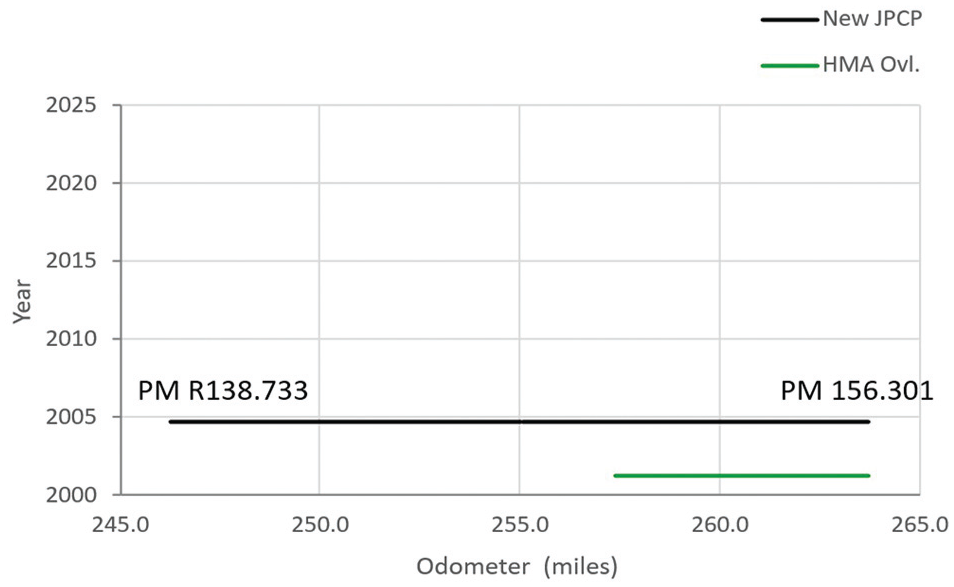
H-Chart for I-15 Baker, lane 3 northbound.
Cracking Performance
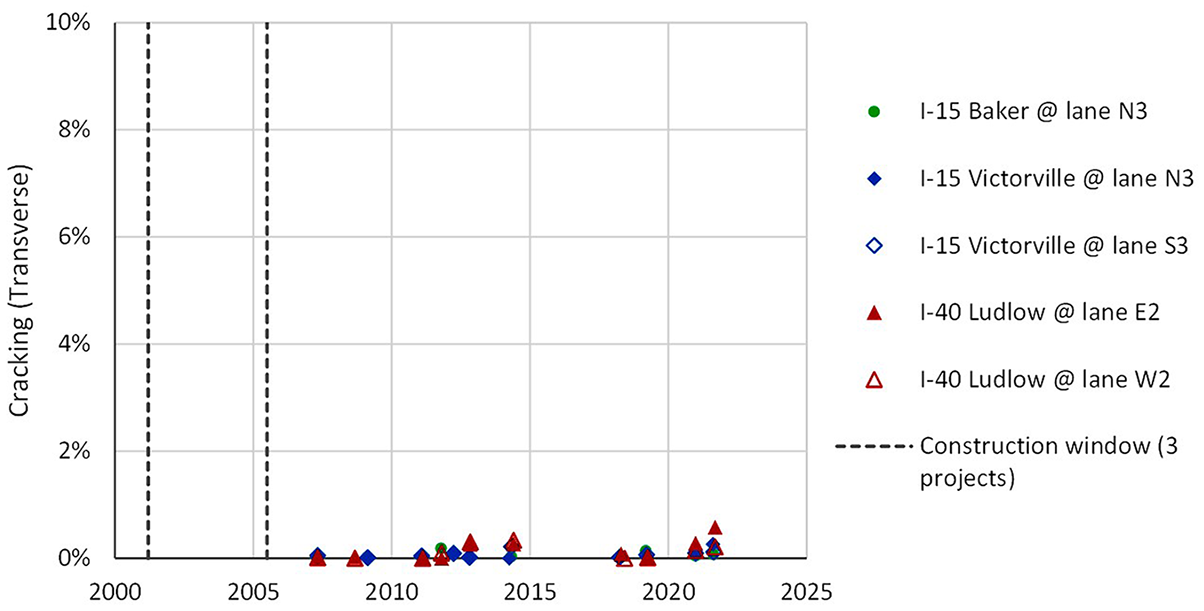
The percentage of slabs with third-stage cracking (two or more longitudinal and/or transverse cracks) measured in the projects is shown in Figure 6. Only the truck lanes of each project are shown in the figure. Overall, cracking performance is excellent as the third-stage cracking remains essentially zero in all truck lanes.
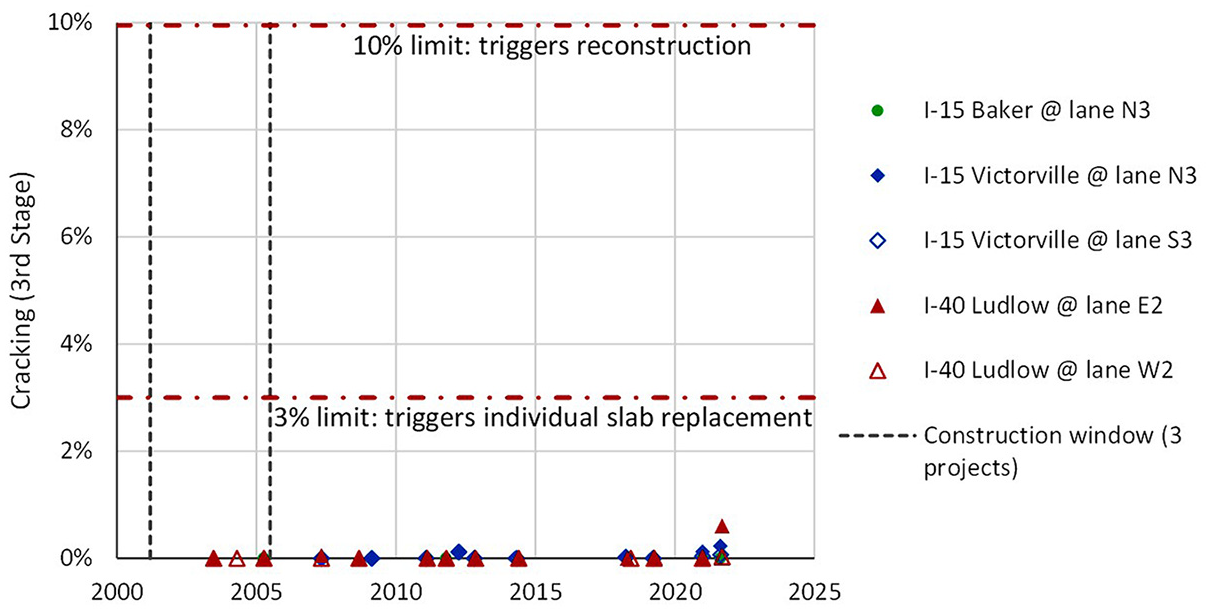
Measured third-stage cracking, from PCS and APCS data, truck lanes.
Some of the truck lanes presented longitudinal cracking, up to 4% of the slabs at I-15 Victorville (both directions), and up to 7% of the slabs at I-40 Ludlow in the eastbound direction (Figure 7). Transverse cracking was negligible in all truck lanes (Figure 8).
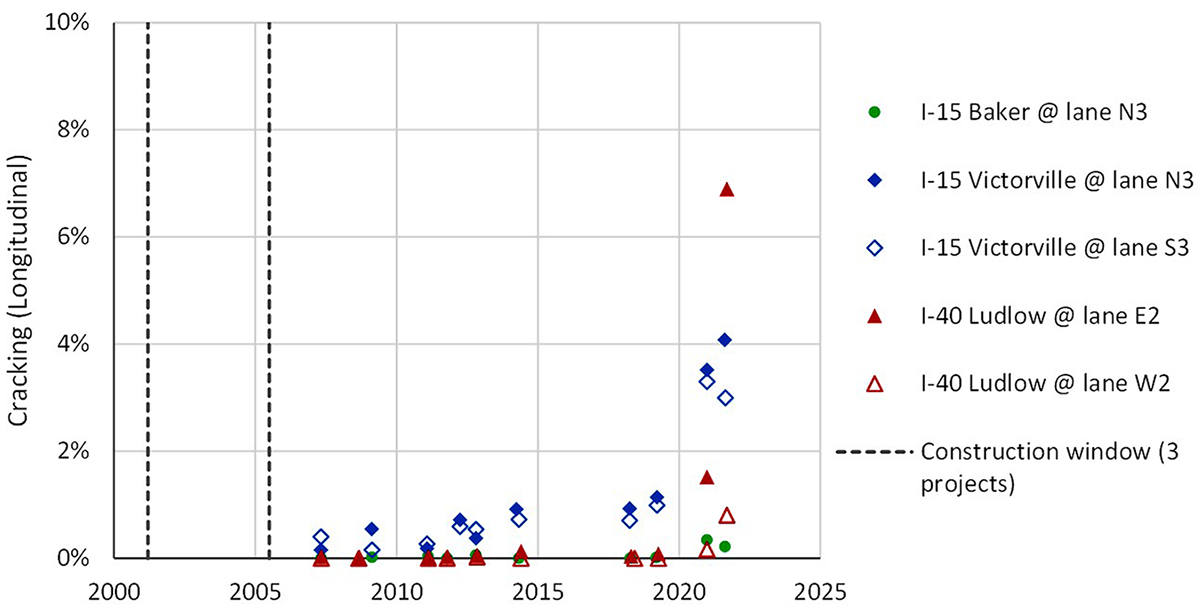
Measured longitudinal cracking, from PCS and APCS data, truck lanes.
Measured transverse cracking, from PCS and APCS data, truck lanes.
Faulting Performance
The percentage of lane length with faulted transverse joints, defined as joints with more than 3.8 mm (0.15 in.) faulting, is shown in Figure 9. Only the truck lanes of each project are shown in the figure. Overall, performance is excellent as the measured faulting remains essentially zero.
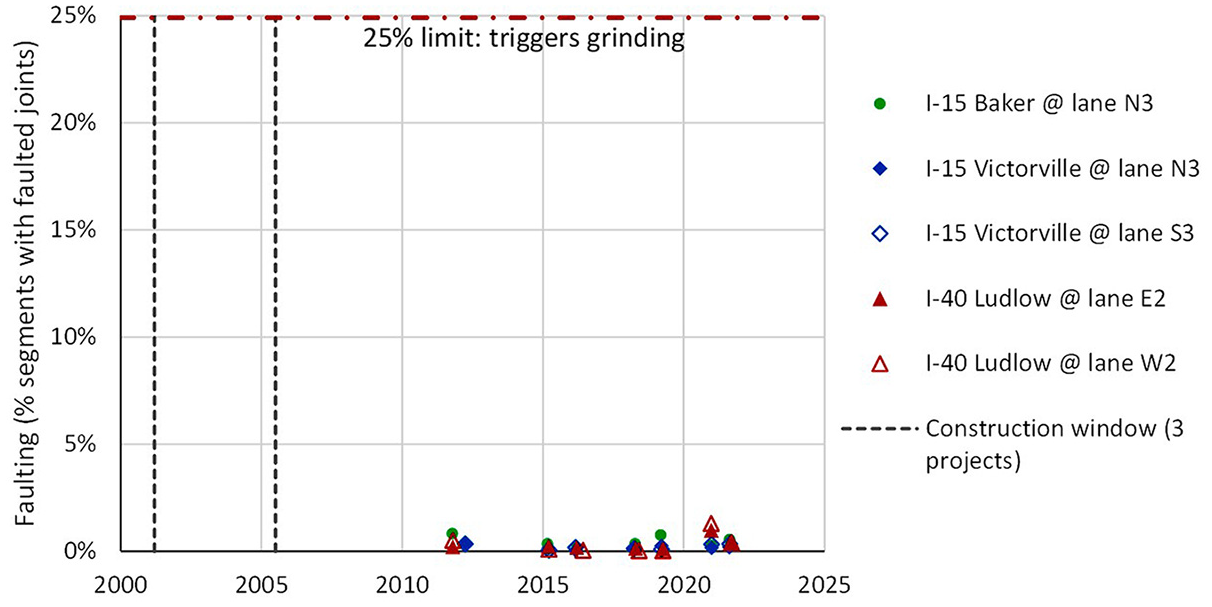
Measured faulting, from PCS and APCS data, truck lanes.
Smoothness Performance
The measured IRI is shown in Figure 10. Only the truck lanes of each project are shown in the figure. Some of the variability in the IRI is a result of changes in equipment, in particular changing from a point to a line laser in 2015. Overall, the IRI remains around 1.5–2.0 mm/m (95–125 in./mile) in all projects. This is little change from the initial constructed IRI values. From a structural performance point of view, the main observation is that the IRI remains stable in all lanes in the three projects, an outcome that is consistent with the low faulting measured in the projects and the lack of third-stage cracking. Caltrans did not have an IRI-based construction smoothness specification in place at the time of construction of these projects, therefore the relatively high initial IRI values compared with current practice.
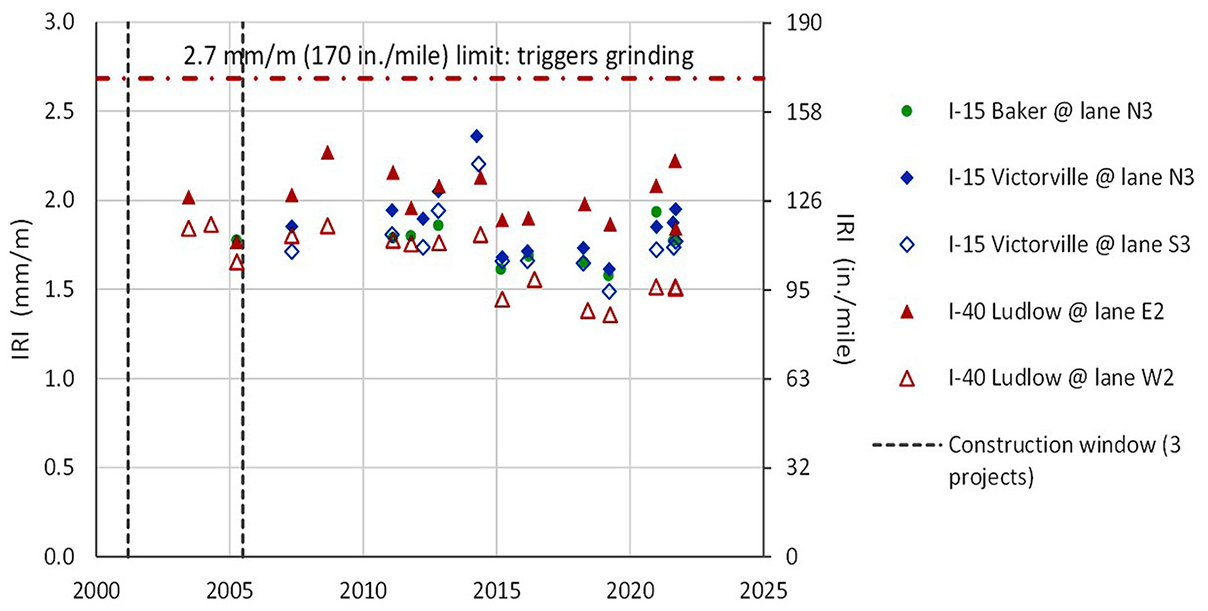
Measured IRI, from PCS and APCS data, truck lanes.
In Situ Evaluation of the Projects
In addition to the PCS and APCS data, the present condition of the JPCP longer-life projects was assessed by an in situ evaluation conducted by UCPRC. The in situ evaluation included laser profiling of the projects, in September 2021, and a truck lane closure of 1.6 km (1 mi) per project for visual inspection, coring, and FWD testing in February–March 2022. The evaluation methodology followed principles and practices included in the Caltrans Site Investigation Guide ( 21 ) and Federal Highway Administration (FHWA) Distress Identification Manual for the Long-Term Pavement Performance Program ( 22 ).
Laser Profiler Evaluation
The smoothness of the projects was evaluated using an inertial laser profiler to verify the IRI values from the PMS database; in all cases, the measured IRI matched the database values.
Visual Inspection
A visual inspection was conducted by walking the 1.6 km lane closures using the FHWA Distress Identification Manual to identify and measure pavement distresses. The inspections, done in clear daytime conditions, confirmed the projects’ excellent structural condition: no shattered slabs, unnoticeable transverse joint faulting, and few low-severity cracks (width <3 mm [0.12 in.], no spalling, no measurable faulting), as in the examples shown in Figures 11 and 12.
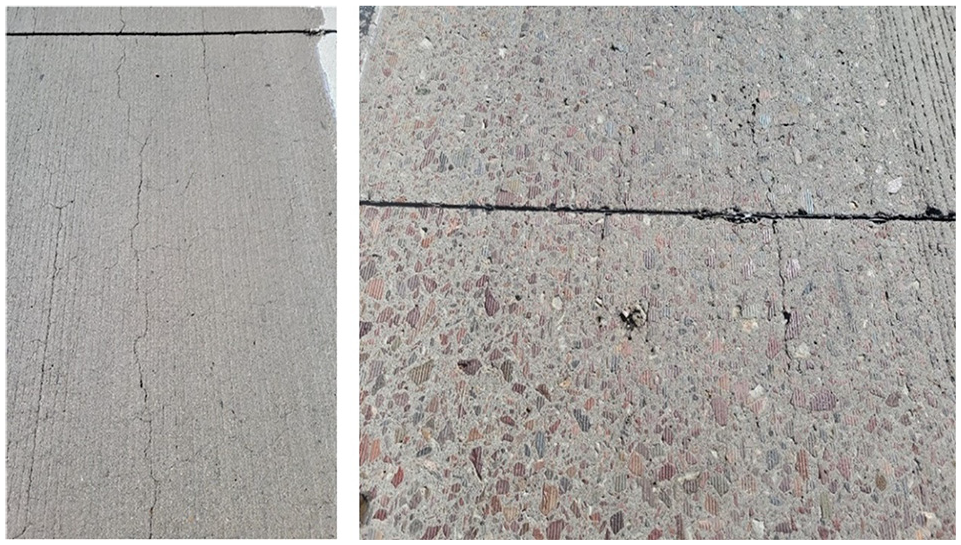
Low-severity longitudinal cracking: (left) I-15 Victorville and (right) I-40 Ludlow.
Spalling: (left) low-severity spalling on a transverse joint, I-15 Baker; (right) corner spalling and surface cracking (middle and bottom left part of picture), I-40 Ludlow.
Localized grinding, which was likely carried out during construction, was observed at some locations. Some longitudinal and transverse joints presented low-severity spalling as shown in the Figure 12 example. Surface cracking was observed at some areas, as also shown in the Figure 12 example. Surface cracking can be also seen in Figure 11. This cracking is most likely a result of the drying shrinkage.
FWD Evaluation
Each project was tested with the FWD at five sets of slabs. Each set consisted of five consecutive slabs as shown in Figure 13. The five sets were uniformly distributed along the 1.6 km (1 mi) lane closure. Each slab was tested at two locations along the right wheelpath: mid slab and the approaching edge of the transverse joint. Each location was tested twice, first in the morning and second in the afternoon, to capture possible thermal effects on the LTE of the transverse joints. The concrete temperature was measured by using a thermocouple inserted in a drill at 10 mm (0.4 in.) depth. The measured temperature varied from 28°C to 36°C (82°F to 97°F) in I-15 Baker and from 18°C to 30°C (64°F to 86°F) in I-15 Victorville and I-14 Ludlow.
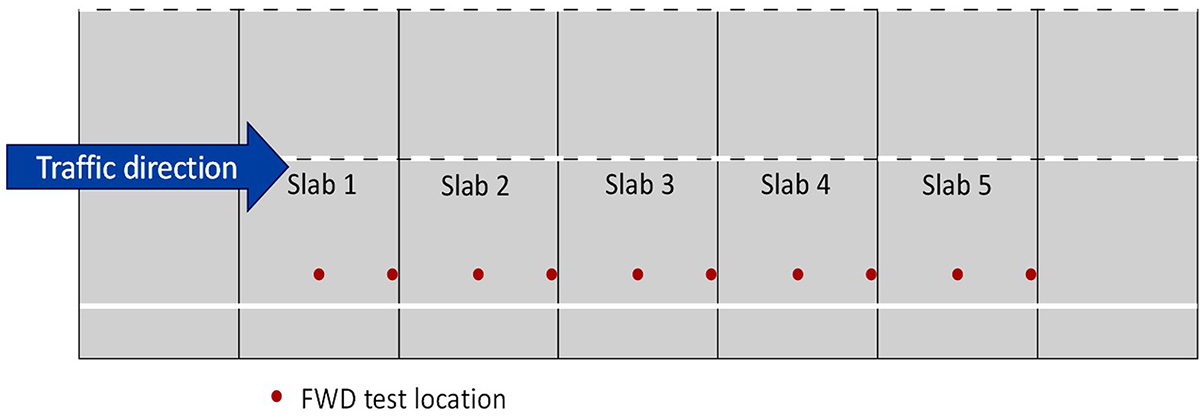
Layout of one set of slabs (five consecutive slabs) for FWD testing.
The LTE measured in all the projects was high, as expected from JPCP with well performing dowels ( 23 , 24 ). The average LTE was 83%, 84%, and 80% for I-15 Baker, I-15 Victorville, and I-40 Ludlow, respectively, with LTE defined as D12/D0, where D0 is the deflection measured under the loading plate and D12 is the deflection measured at 300 mm (12 in.) distance from the loading plate center (at the other side of the transverse joint). Further, the LTE was very uniform along the sections and presented minimal diurnal variation (morning versus afternoon) indicating that the dowels have not loosened. The LTE values shown in Figure 14 correspond to I-15 Baker. Similar LTE was observed in I-15 Victorville and I-40 Ludlow.
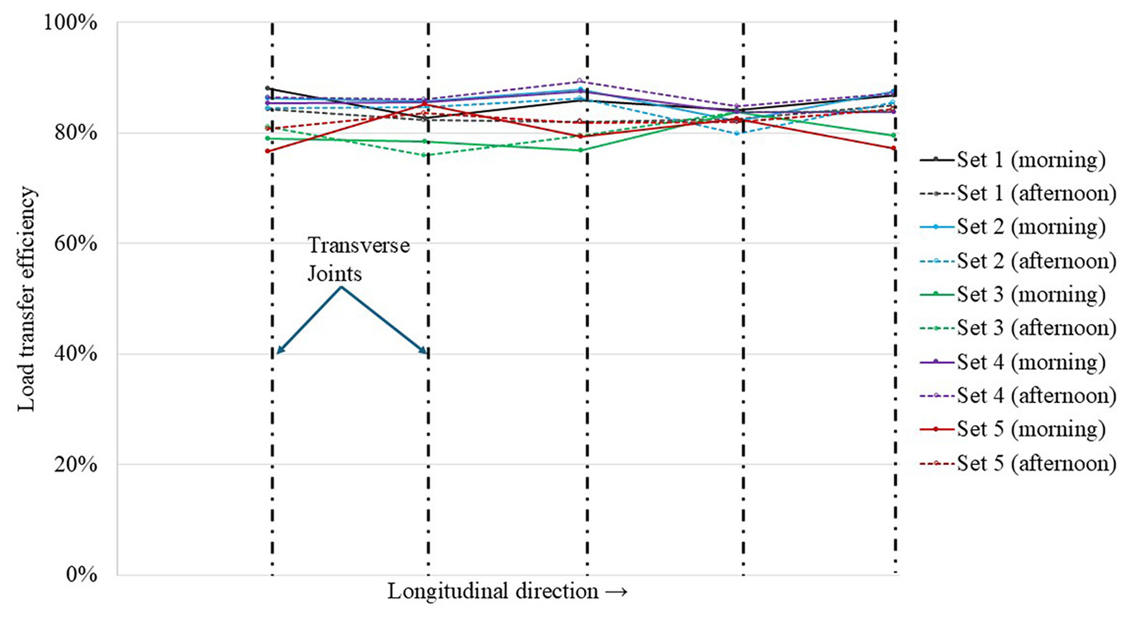
LTE measured with the FWD, I-15 Baker, FWD Load = 70 kN (15.7 kips).
Three load levels were applied in each FWD test: 30, 50, and 70 kN (6.7, 11.2, and 15.7 kips). The LTE was roughly constant versus the load and the deflection changed linearly versus the load, which indicates that it is unlikely that there are gaps between the concrete and the asphalt base below the transverse joints. The LTE versus load results shown in Figure 15 correspond to I-15 Baker. Similar LTE versus load pattern was observed in I-15 Victorville and I-40 Ludlow.
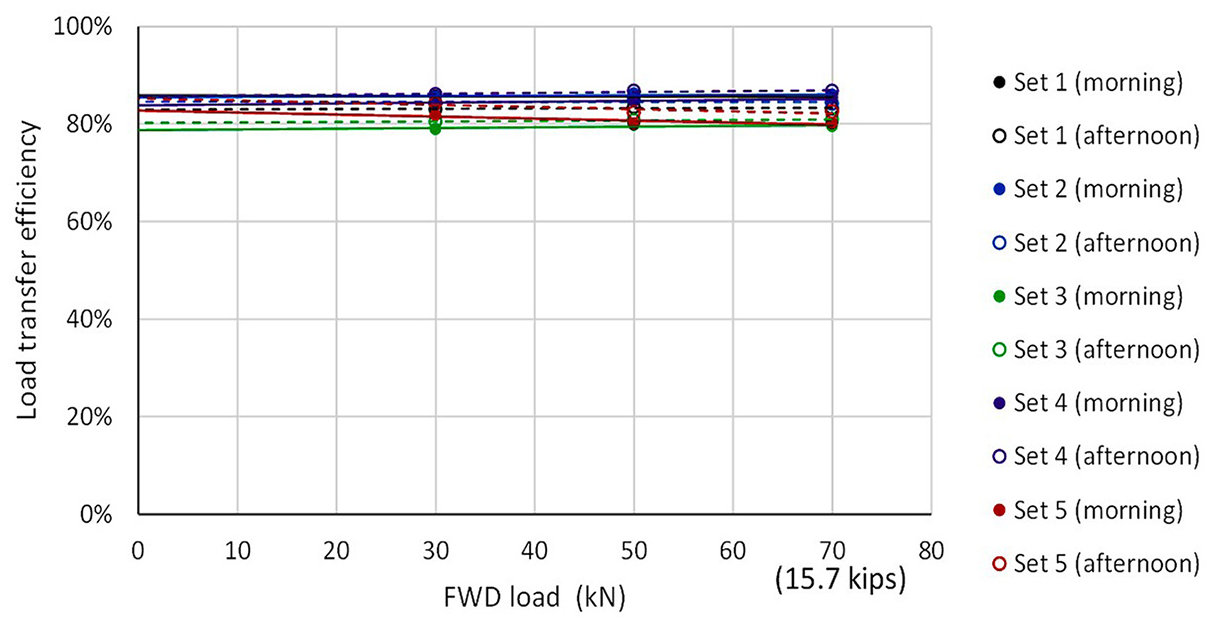
LTE versus load level, I-15 Baker.
Mechanistic-Empirical Modeling of the Pavements
The JPCP cracking performance was modeled with AASHTOWare Pavement ME (version 2.5.5). An HMA base, 75 mm (3.0 in.) thick, was selected for modeling I-15 Baker while a lean concrete base, 107 mm (4.2 in.) thick, was selected for modeling I-15 Victorville and I-40 Ludlow. A coarse-grained soil A-3 (AASHTO soil classification system) subgrade, with no subbase, was assumed in all cases. The concrete properties were assumed to be the same as those used recently for developing the Caltrans rigid pavement design catalog, which are based on PCC testing from almost 100 projects built throughout California during the last two decades ( 12 ). The PCC properties collection includes 4.4 MPa (640 psi) 28 day flexural strength (equivalent to 31 MPa [4500 psi] compressive strength), MOE computed internally by the software, 8.6 μè/°F (4.8 μè/°F) CTE, and 650 μè ultimate drying shrinkage. The concrete slabs and the base were assumed to be debonded. The design slab thickness (Figure 3) was used in the calculations. The truck-traffic volume and characteristics (associated to each WIM number) of the truck lanes were adopted in the modeling of the three projects. Only transverse cracking performance was modeled since Pavement ME cannot predict JPCP longitudinal cracking or third-stage cracking. The predicted cracking was compared against the measured cracking. Similar comparison has been done by others ( 25 ).
The transverse cracking predicted by Pavement ME, at 50% reliability level, in the truck lanes at year 20 was essentially zero in the three projects. The lack of transverse cracking predicted by Pavement ME agrees with the measured performance.
Based on Pavement ME and the assumptions used for developing the new Caltrans rigid pavement design catalog, including 95% within-project reliability (performance variability within each project) and 95% between-project reliability (difference of project means) ( 12 ), the slab thickness of the three JPCPs would be somewhat below the original design thickness: 65 mm (2.6 in.), 15 mm (0.6 in.), and 40 mm(1.6 in.) thinner for I15-Baker, I15-Victorville, and I40-Ludlow, respectively. The original designs were developed using the Caltrans concrete-pavement design catalog from the late 1990s, which was primarily built on empirical evidence and judgment.
Laboratory Test Results
Mechanical Properties
The mechanical-property test results for the cores from the three pavement sections are shown in Figure 16. The figure shows the average of three cores for both MOE and compressive strength for each of the three pavement sections. The MOE was highest for the section from I-15 Baker, with a value of 36.5 GPa (5294 ksi), followed by I-15 Victorville, which had an average value of 33.07 GPa (4796 ksi). The MOE of the I-40 Ludlow was 23.54 GPa (3414 ksi), which was 35% lower than the I-15 Baker.
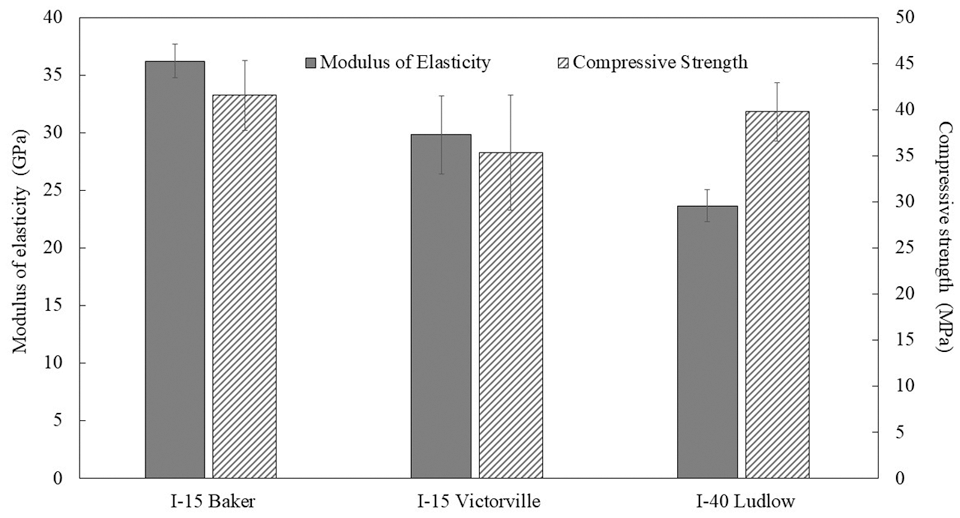
MOE and compressive strength of the cores extracted from the field.
The statistical paired Student’s t-test at the 95% confidence level shows that I-15 Baker MOE is statistically significantly higher than I-40 Ludlow (p-value 0.009 < 0.05). However, the difference in the MOE between I-15 Victorville and I-40 Ludlow is not statistically significant (p-value 0.068 > 0.05). Aggregate usually constitutes 60%–75% of the total concrete volume. Aggregate type, maximum aggregate size, and aggregate volume in concrete can affect the MOE of the concrete ( 26 ). I-15 Baker contains a larger aggregate of 1.5 in. (37 mm), which may result in a higher MOE for the section.
The compressive strength test results in Figure 16 show that I-15 Baker had an average compressive strength of 42 MPa (6090 psi). I-15 Victorville and I-40 Ludlow had compressive strengths of 35 (5075 psi) and 40 MPa (5800 psi), respectively. The statistical paired t-test at the 95% confidence level was performed, and it was found that all three sections had statistically the same compressive strength (p-value between 0.147 and 0.439 > 0.05).
Durability Indicators
The CTE is an important design parameter for concrete pavements, particularly in desert environments. For optimal pavement performance, the joint design of JPCP sections must select materials with appropriate CTE that are suited to the environmental condition. CTE directly affects the thermal expansion and contraction, and curling of the slab, which affects cracking. Incompatibility of CTE of the constituent materials in concrete may cause durability issues ( 27 ).
The CTE was evaluated on one core of each pavement section and was found to be similar for the three sections, as shown in Figure 17; the CTE were 11.55, 10.55 and 10.62 με/°C (6.42, 5.86, and 5.90 με/°F ) for I-15 Baker, I-15 Victorville, and I-40 Ludlow, respectively. The CTE for the Victorville and Ludlow sections was 8% less than the CTE of the Baker section. The paste of the concrete has the highest CTE, and its movements are restricted by the aggregate. Aggregate fills more than 60% of the concrete volume and has the highest influence on the CTE. Different aggregate types have different CTEs and are most likely the reason for the slight variability seen in the results. As mentioned before, information about the aggregate types is not available.
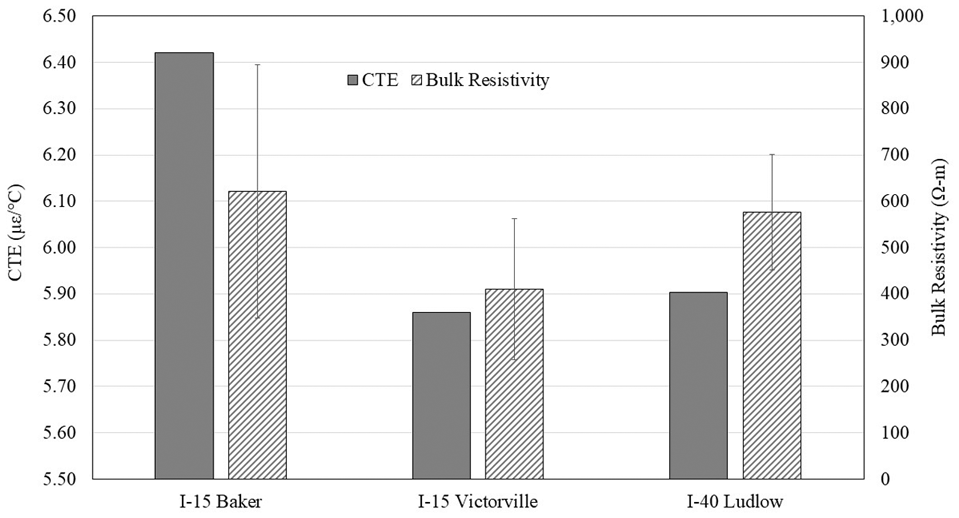
CTE and bulk resistivity of the cores extracted from the field.
The bulk ER of the cores from the sections is also presented in Figure 17. The ER of the I-15 Baker sections was 621 Ω-m, which is the highest among the three sections, followed by 577 Ω-m of the I-40 Ludlow and 410 Ω-m of I-15 Victorville. All three sections are statistically the same because of large variability, and all three sections are in good condition. A bulk ER value between 16 and 190 KΩ-cm indicates that concrete will have very low chloride penetration susceptibility, which means that all the tested cores are highly durable and indicates a very low chloride penetration risk ( 28 ).
The higher ER suggests a more refined pore structure and a less interconnected pore system for ion transport ( 29 ).
The water absorption test was performed on two cut samples from two different depths of the cores. The test results are shown in Figure 18. The cores of I-40 Ludlow showed the highest water absorption compared with the I-15 Baker and Victorville sections. I-15 Baker cores had the lowest absorption. This suggests that I-15 Baker has the least interconnected pores, which reduces water absorption. More absorption can be correlated with more evaporation of water, and therefore more drying shrinkage. These results align with the longitudinal-cracking issues observed in the field at Victorville and Ludlow.
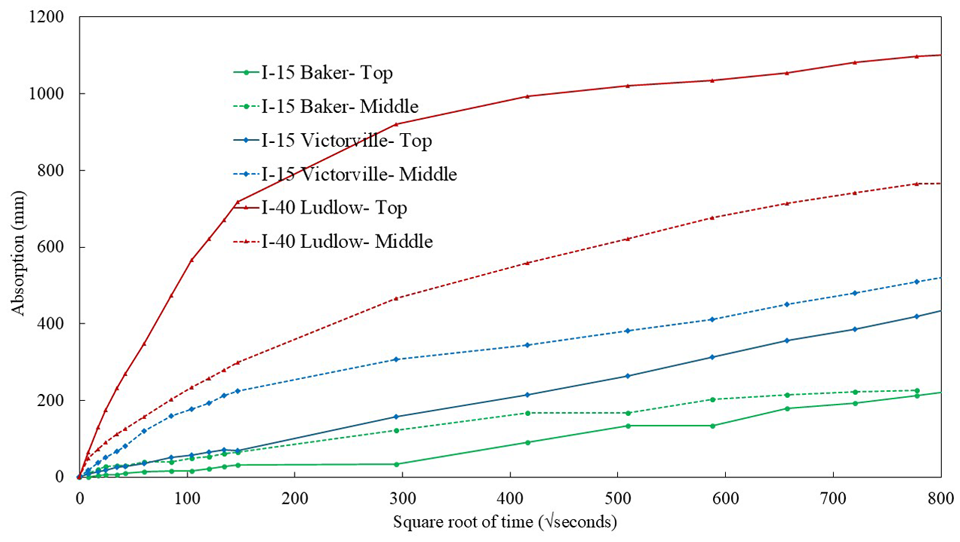
Absorption of the extracted cores from three sections at the surface and in the middle of the cores.
TGA analysis was performed to investigate the hydration characteristics of the paste collected from the cores of the three sections. The TGA curve was used to identify the amount of Ca(OH)2 and CaCO3 in the powder samples. Figure 19 shows the Ca(OH)2, CaCO3 content, and the amount of bound water.
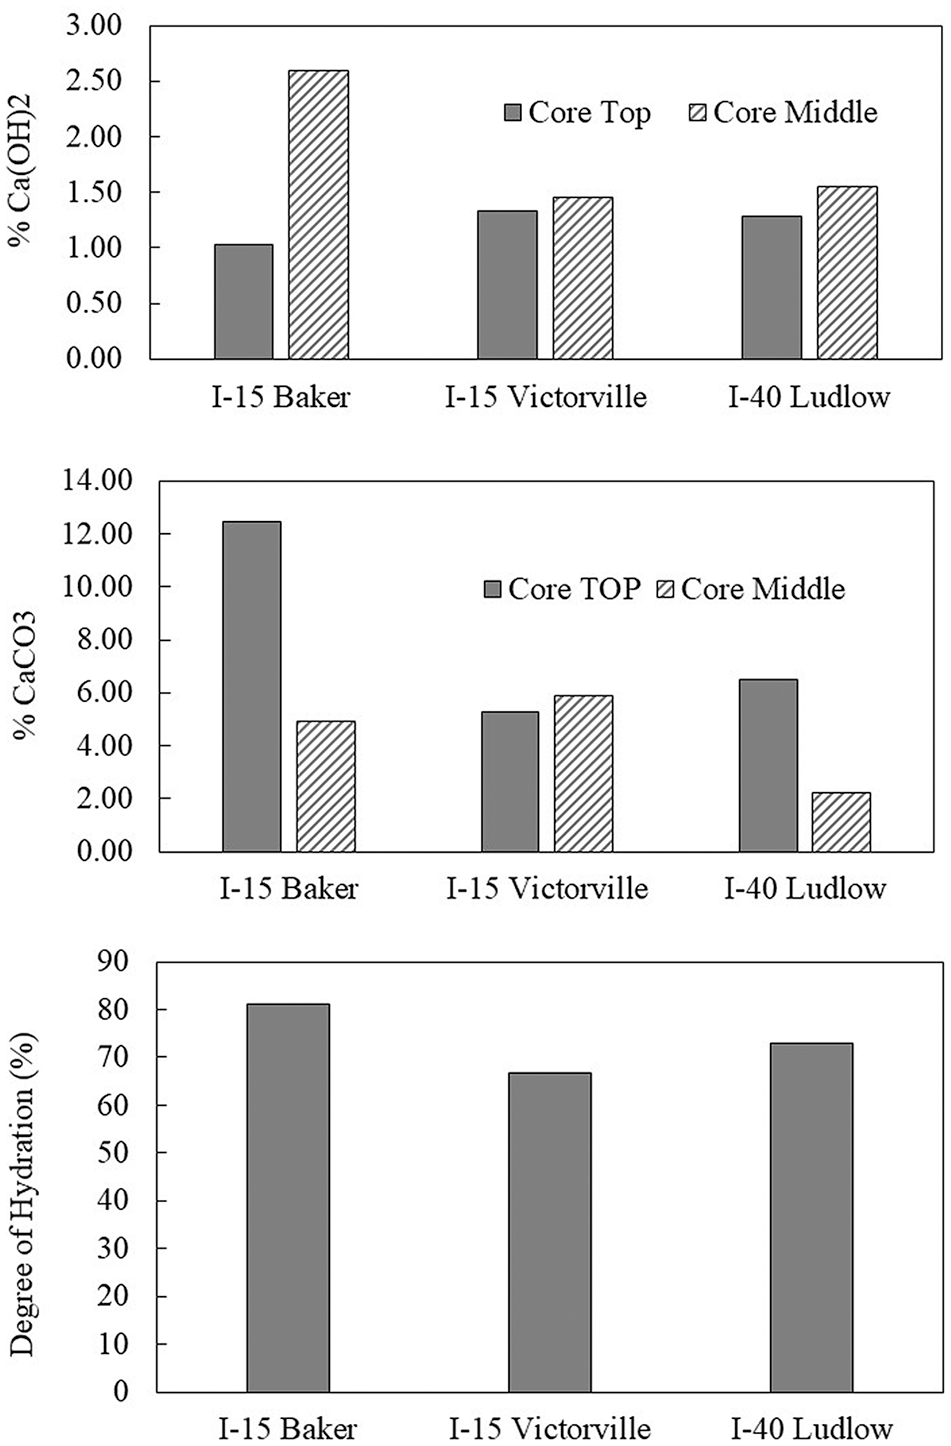
TGA analysis: (top) Ca(OH)2 and (center) CaCO3 content; and (bottom) degree of hydration.
For the samples collected from the surface of the core I-15 Victorville shows the highest Ca(OH)2. However, for the samples collected from middle of the cores, I-15 Baker had the highest Ca(OH)2 content, followed by I-40 Ludlow and I-15 Victorville sections. Lower Ca(OH)2 content may imply that more Ca(OH)2 may have been converted to calcium silicate hydrates. For the samples collected from the surface of the cores, I-15 Baker showed the highest CaCO3 content, which indicates higher carbonation for the section. The degrees of hydration of the cement paste collected from the cores of the three sections are shown in the bottom panel of Figure 19. I-15 Baker showed the highest degree of hydration, followed by I-40 Ludlow. I-15 Victorville showed the least degree of hydration because of the high w/b ratio.
Discussion of Results
The experimental results reveal that the performance of the three JPCP longer-life projects has been excellent so far. The truck lanes of the three projects have supported between 19 and 33 million trucks between the construction, around 2002–2004, and the year 2022, the end of the evaluation period considered in this paper. The performance of the projects can be summarized as follows:
The third-stage cracking (% of slabs with two or more cracks) is essentially zero in all lanes (Figure 6). The cracking is well below the 3% limit that would trigger an individual slab replacement rehabilitation, and even further from the 10% limit that would trigger the pavement reconstruction based on Caltrans PMS decision trees.
The faulting (percentage of transverse joints with more than 0.15 in. faulting) is essentially zero in all lanes (Figure 9), and well below the 25% limit that would trigger a grinding operation based on Caltrans PMS decision trees. The excellent faulting performance is consistent with the high LTE measured with the FWD (Figures 14 and 15). This outcome validates current Caltrans and other state department of transportation specifications that require the use of dowels at JPCP transverse joints.
The IRI has been stable since the construction of the projects (Figure 10). While the IRI values are relatively poor based on current Caltrans construction smoothness standards, they are far from the 2.7 mm/m (170 in./mi) limit that would trigger a grinding operation based on Caltrans PMS decision trees.
None of the projects has required any maintenance or rehabilitation activity (e.g., individual slab replacement or grinding) since the construction. Further, the three condition indexes considered in Caltrans PMS decision trees for JPCP (third-stage cracking, faulting, and IRI) are, for all projects and lanes, far below the levels that would trigger any maintenance or rehabilitation activity.
The laboratory testing of cores extracted from each of the three projects slabs reveals that the concrete is in good condition with desired mechanical strength and modulus and durable in respect of ingress of deleterious ions (like chloride) as indicated by the ER and water absorption tests.
As shown in Figure 7 earlier, some of the truck lanes presented longitudinal cracking at I-15 Victorville and I-40 Ludlow. On the contrary, no longitudinal cracking is present in I-15 Baker. This outcome is likely related to a lower drying shrinkage susceptibility of the concrete used in I-15 Baker compared with I-15 Victorville and I-40 Ludlow, as explained below. The use of 610 mm (2 ft) widened slabs in the desert environment where there is high drying shrinkage may have contributed to the relatively high longitudinal cracking observed in I-40 Ludlow.
The transverse cracking was negligible in all truck lanes (Figure 8). The relevance of longitudinal cracking versus transverse cracking was not a surprise. Recent research at the UCPRC has shown that longitudinal cracking is as relevant as transverse cracking in the Caltrans road network JPCP ( 13 ), an outcome that has been attributed to the high drying shrinkage in the dry and warm environment present in most of California, particularly the desert region ( 30 , 31 ).
The IRI has been stable since the construction (Figure 10) but the pavements were constructed rougher than is allowed under the current Caltrans construction smoothness specifications. The three pavements were built with construction smoothness standards from the early 2000s that were not based on IRI and typically delivered relatively rough pavement compared with current standards. The stability of the IRI emphasizes the relevance of achieving a good initial IRI. This outcome supports recent Caltrans smoothness specifications that include pay-factor adjustments tied to the post-construction IRI.
Some of the laboratory evaluations performed provided valuable insights into the field performance of the three sections, as discussed below.
I-15 Baker cores had the highest MOE. This was attributed to its highest aggregate content and lowest amount of paste, along with the specific aggregate type used. Further characterization of the aggregate by x-ray diffraction (XRD) will be performed to gather more information about the aggregate types used in each section and further narrow the reason for the high MOE. Naturally, it would be expected that this section would have the highest compressive strength. However, because of high variability in the test results for compressive strength (and ER), these tests did not yield conclusive interpretations of the field performance of the three sections.
On the other hand, the water absorption test results were very informative in explaining the field performance of the three projects. The water absorption capacity of the concrete is a measure of its drying susceptibility. The test results clearly showed that I-40 Ludlow, with the highest paste content (34.9%) and highest cement content (390 kg/m3 [657 lb/yd3]), exhibited the highest water absorption. In particular, the initial portion of the absorption–time curve, which is indicative of capillary pores, had a much steeper slope than had I-15 Baker and Victorville. This distinct behavior demonstrates the benefits of the reduced cement content used in I-15 Baker and Victorville. It is also interesting that the test was able to differentiate between I-15 Baker and I-15 Victorville, which had the same cement content but different w/b ratios. The tested samples from the top and middle portions of the cores showed higher water absorption for Victorville (w/b ratio: 0.49) than for Baker (w/b ratio: 0.41).
Based on this test, the durability rankings of the three sections from best to worst are as follows: I-15 Baker (cement content: 300 kg/m3 [505 lb/yd3], w/b ratio: 0.41, paste content 28%) > I-15 Victorville (cement content: 300 kg/m3 [505 lb/yd3], w/b ratio: 0.49, paste content 30%) > I-40 Ludlow (cement content: 390 kg/m3 [657 lb/yd3], w/b ratio: 0.41, paste content 35%).
The order of longitudinal-cracking performance for the three test sections reflects their design differences. The high paste content and w/b ratio in I-15 Victorville likely contributed to its longitudinal cracking, unlike in Baker, where aggregate with a larger maximum nominal aggregate size helped limit drying shrinkage and cracking. Information about other factors like weather conditions and curing methods, which also affect cracking performance, was not available. Each project was built over many months, with varying conditions. Night-time and early morning paving was used during much of the construction because of Caltrans construction temperature limits for concrete in place at the time.
Field testing, inspection, structural design, and core lab testing show that Caltrans made the right decision with the 40 year design. Using lower total cement content at a low water-to-cement ratio, high-quality aggregate, and increasing aggregate content and larger maximum nominal aggregate size were excellent strategies for I-15 Baker, contributing to its stellar performance over 20 years.
Conclusions and Recommendations
Conclusions
This paper evaluates the half-life performance of three longer-life JPCPs that were designed for a 40 year life and built in the Mojave desert, Southern California, in the early 2000s. The performance of the projects has been evaluated mainly based on Caltrans PMS databases, which were complemented with an in situ evaluation of the projects and laboratory testing of concrete cores extracted from the slabs.
The projects have excellent performance to date, supporting 19 to 33 million trucks with some of the heaviest axle load spectra in the state without significant third-stage cracking or faulting. Longitudinal cracking was up to 7% in some lanes, a result of widened slab shoulders (600 mm [2 ft.]) and high drying shrinkage in the desert environment. The IRI has remained stable, though initial construction was rougher than current specifications. No maintenance or rehabilitation has been needed, and overall conditions show good concrete quality with average compressive strengths over 35 MPa (5075 psi) and low water and deleterious material penetrability.
Recommendations
It is recommended that a JPCP longitudinal-cracking model be developed and implemented in Pavement ME. It is also recommended that the impact of 600 mm (2 ft.) widened slab shoulders with JPCP in dry climate regions be investigated further and that considerations of safety, maintenance, and pavement longitudinal cracking be included in any updating of design standards.
It should be noted that all of the projects had asphalt bases. The calibration conducted for developing the 2022 Caltrans concrete-pavement design catalog showed that use of lean concrete bases resulted in significantly shorter cracking lives compared with asphalt bases. It is recommended that a specification for asphalt base for concrete pavement be developed, instead of current use of asphalt specifications primarily intended for surface mixes on asphalt pavements.
In respect of PCC, minimum cement content with a low water-to-binder ratio, optimum paste content, high-quality aggregate, and the right proportions and size of aggregate are recommended for good performance. No other changes are proposed for the Caltrans JPCP design and construction practices after this half-life evaluation of the three JPCP longer-life projects.
The excellent performance of the three long-life projects has saved Caltrans and highway users significant costs by avoiding maintenance and rehabilitation. It is recommended to conduct life-cycle cost analysis and life-cycle assessment to quantify the economic and environmental benefits of 40 to 100 year concrete pavements compared with shorter-lived, lower-cost alternatives, respectively.
Footnotes
Acknowledgements
Caltrans sponsorship is gratefully acknowledged. The technical review by Caltrans, led by Dulce Rufino Feldman from the Office of Concrete Pavement, and oversight by Somayeh Mafi of the Division of Research, Innovation and System Information, is appreciated. The authors would like to thank also Leif Wathne (National Concrete Pavement Technology Center) and Sathis Sathiskumar and Parwaz Khasraw (Caltrans District 8) for finding the concrete mix designs used in the projects.
Author Contributions
The authors confirm contribution to the paper as follows: study conception and design: John Harvey, Angel Mateos, Somayeh Nassiri, Jeremy Lea and Dulce Rufino Feldman; data collection: Jeremy Lea, and Md Mostofa Haider; analysis and interpretation of results: Angel Mateos, Somayeh Nassiri, Md Mostofa Haider, and Ali Azhar Butt; draft manuscript preparation: Angel Mateos, Somayeh Nassiri, and Md Mostofa Haider. All authors reviewed the results and approved the final version of the manuscript.
Declaration of Conflicting Interests
The author(s) declared no potential conflicts of interest with respect to the research, authorship, and/or publication of this article.
Funding
The author(s) disclosed receipt of the following financial support for the research, authorship, and/or publication of this article: This paper describes research activities that were requested and sponsored by the California Department of Transportation (Caltrans).
The contents of this paper reflect the views of the authors and do not necessarily reflect the official views or policies of the State of California or the Federal Highway Administration. This paper does not represent any standard or specification.