
Abstract
This research’s goal is to develop recommendations for improving the interlayer (“bond breaker”) used between jointed plain concrete pavement (JPCP) slabs and lean concrete base (LCB). A full-scale test track was built and monitored to study the slab-base interaction. The test track included four independent slabs, one with asphalt concrete (AC) base and three with LCB and one of the following interlayers: curing compound, geotextile, and microsurfacing. The curing compound interlayer represents current practice in California, U.S., for JPCP with LCB. Test track monitoring included slab curling/warping and falling weight deflectometer (FWD) deflection. Experiment data collected from the track indicate that AC provides much better support to the slab than LCB with curing compound interlayer. When the slab curvature was very high, the corner deflection under FWD loading in the section with LCB and curing compound was up to three times larger than the corner deflection in the section with AC base. The geotextile performed similarly to the curing compound interlayer. However, the microsurfacing considerably improved the performance of the curing compound interlayer. The corner deflection in the section with LCB and microsurfacing interlayer was similar to the corner deflection in the section with AC base. This study demonstrates that, by using the appropriate interlayer, the cracking performance of JPCP with LCB can be improved and potentially match the performance of JPCP with AC base. This outcome results in the recommendation to allow continued use of LCB for JPCP construction in California if a microsurfacing or other interface with similar performance-related properties is used.
Keywords
The California Department of Transportation (Caltrans) implemented a new rigid pavement design catalog in 2023 ( 1 ). The new design catalog considers two types of base for jointed plain concrete pavement (JPCP): asphalt concrete (AC) and lean concrete base (LCB). Compared with AC, LCB offers advantages for construction logistics (e.g., use of the same paving machine for the base and the pavement) and the possibility of using lower quality aggregates, including greater percentages of recycled materials ( 2 ). However, research conducted by the University of California Pavement Research Center (UCPRC) and others has strongly indicated that JPCP has better performance with an asphalt base than with LCB. The research is briefly summarized below.
Long-Term Pavement Performance (LTPP) SPS-2 sections were designed to evaluate the effect of several structural factors on the performance of JPCP ( 3 ). One such factor is the type of base material. The SPS-2 sections included three types of base: dense-graded aggregate base, LCB, and permeable asphalt-treated base (PATB). The cracking performance was much worse for the sections with LCB than for the sections with PATB, as shown in Figure 1 (extracted from the Federal Highway Administration publication) ( 4 ).
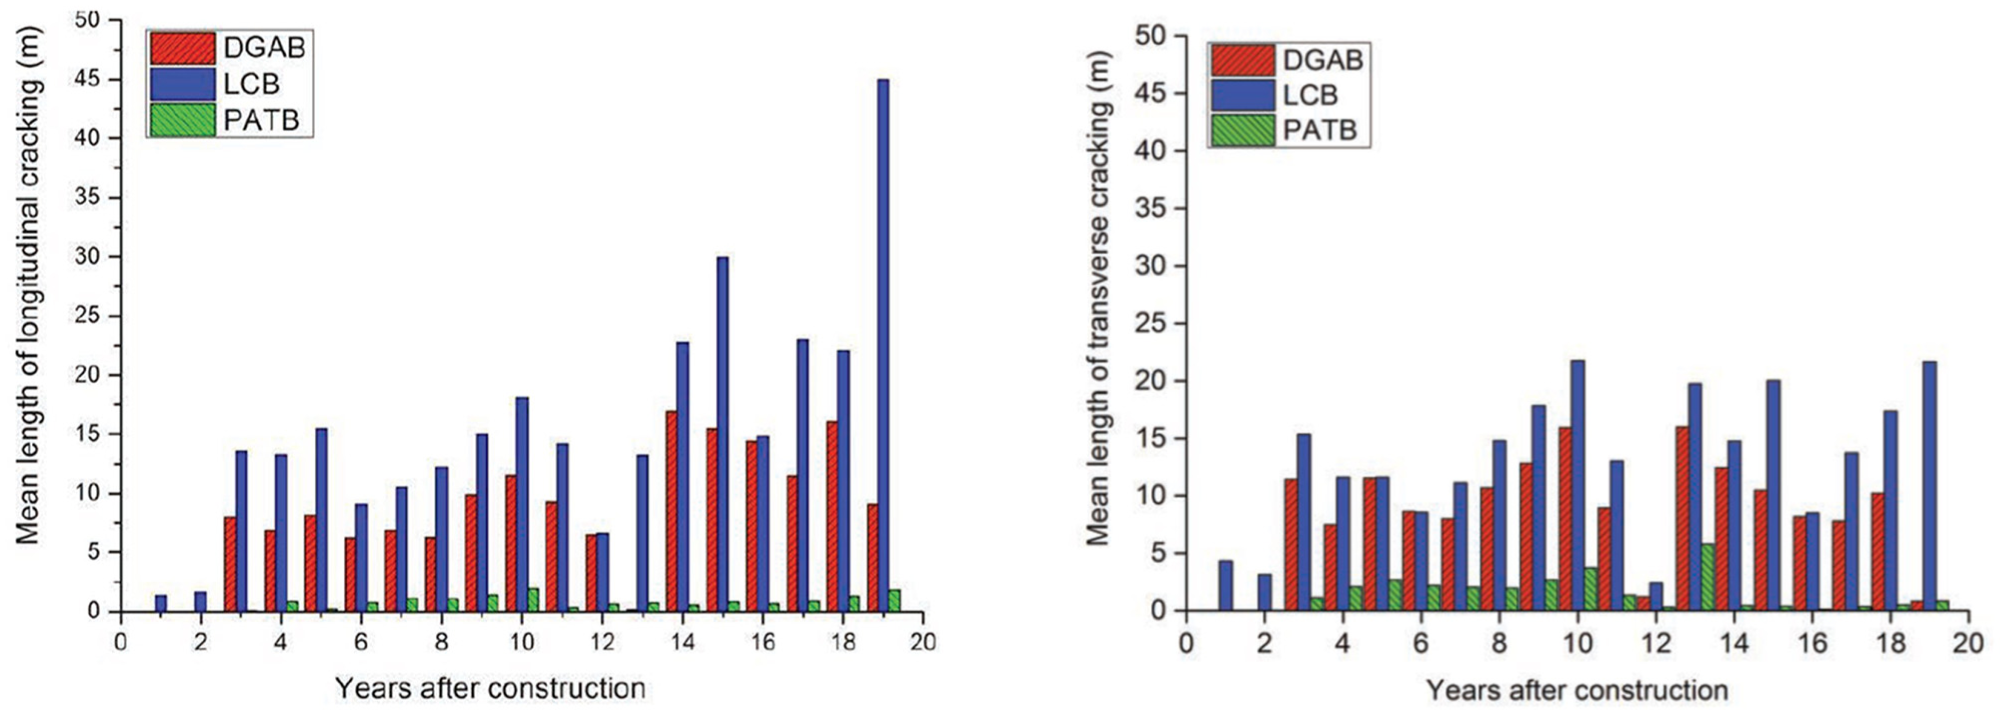
Cracking performance of the Long-Term Pavement Performance (LTPP) SPS-2 sections for different types of base: (Left) Longitudinal cracking and (Right) Transverse cracking.
The poor performance of JPCP with LCB was also shown by a recent study conducted at UCPRC ( 5 ). That study used multinomial logistic regression to analyze the JPCP cracking data from the Caltrans Pavement Condition Survey (PCS) database. The study included manual (1978–2013) and automated (2010–2018) PCS data from 446 new construction and reconstruction JPCP projects, which total around 7,050 lane-km (4,380 lane-mile). The calibrated statistical model was used to quantify the effect of different factors on JPCP cracking performance. The factors included in the analysis were climate, axle load spectrum (Weigh-in-Motion class from 1 [lightest] to 5 [heaviest] loads—a number that defines truck traffic characteristics and is used by Caltrans for pavement design and management), truck traffic volume, base material type, slab thickness, use of dowels, slab length, and shoulder type ( 6 ). The base material type (LCB versus AC) effect was statistically significant and the calibrated model indicated that JPCP with LCB developed cracking much faster (180% faster) than JPCP with AC base (e.g., the same level of cracking may take 40 years with AC base and 14.3 years [40 divided by 2.8] with LCB).
Past research at UCPRC suggested that the combination of the dry climate (high drying shrinkage), present in many California regions, together with a stiff base material (such as lean concrete) increases the risk of JPCP cracking ( 7 ). The hypothetical mechanism explaining why the combination of high drying shrinkage and stiff base is believed to increase the risk of JPCP cracking is outlined in Figure 2 and briefly explained below:
JPCP slabs are seldom flat; they curl and warp because of temperature and drying shrinkage differential across the slab depth. (Note: The term “curl” is typically used to refer slab curvature resulting from thermal gradient [gradient versus depth] while the term “warp” is typically used to refer to slab curvature resulting from differential drying shrinkage [differential versus depth].)
As the slabs curl/warp up at the corners, they lose support if the base is not able to creep and adapt to the slab’s new shape.
Because LCB is a rigid material, likely exhibiting minimal creep or capacity to adapt under stress, a separation or gap results between the slabs and the LCB; consequently, the corners and edges of the slabs lose contact with the base.
Because of the lack of contact with the base, the slabs function as cantilever slabs rather than as slabs supported by a multilayer structure; consequently, the traffic loading applied close to or at the joints will produce considerably higher tensile stresses at the top of the slabs compared with fully supported slabs; these stresses may result in top-down cracking.
In contrast, the AC base has a large capacity to creep/adapt so it can follow slabs curling/warping deformations; the slabs do not lose contact with the base. Consequently, they can resist traffic loading in an effective way, as slabs supported by a multilayer structure rather than acting as cantilever slabs.
The mechanism outlined above is a hypothesis validated by the experiment data and analysis presented in this paper. The main conclusion is that a rigid base together with a rigid contact between the slab and the base is NOT desirable when the slab curling/warping is high, as may occur as a result of the drying shrinkage in dry climatic regions.
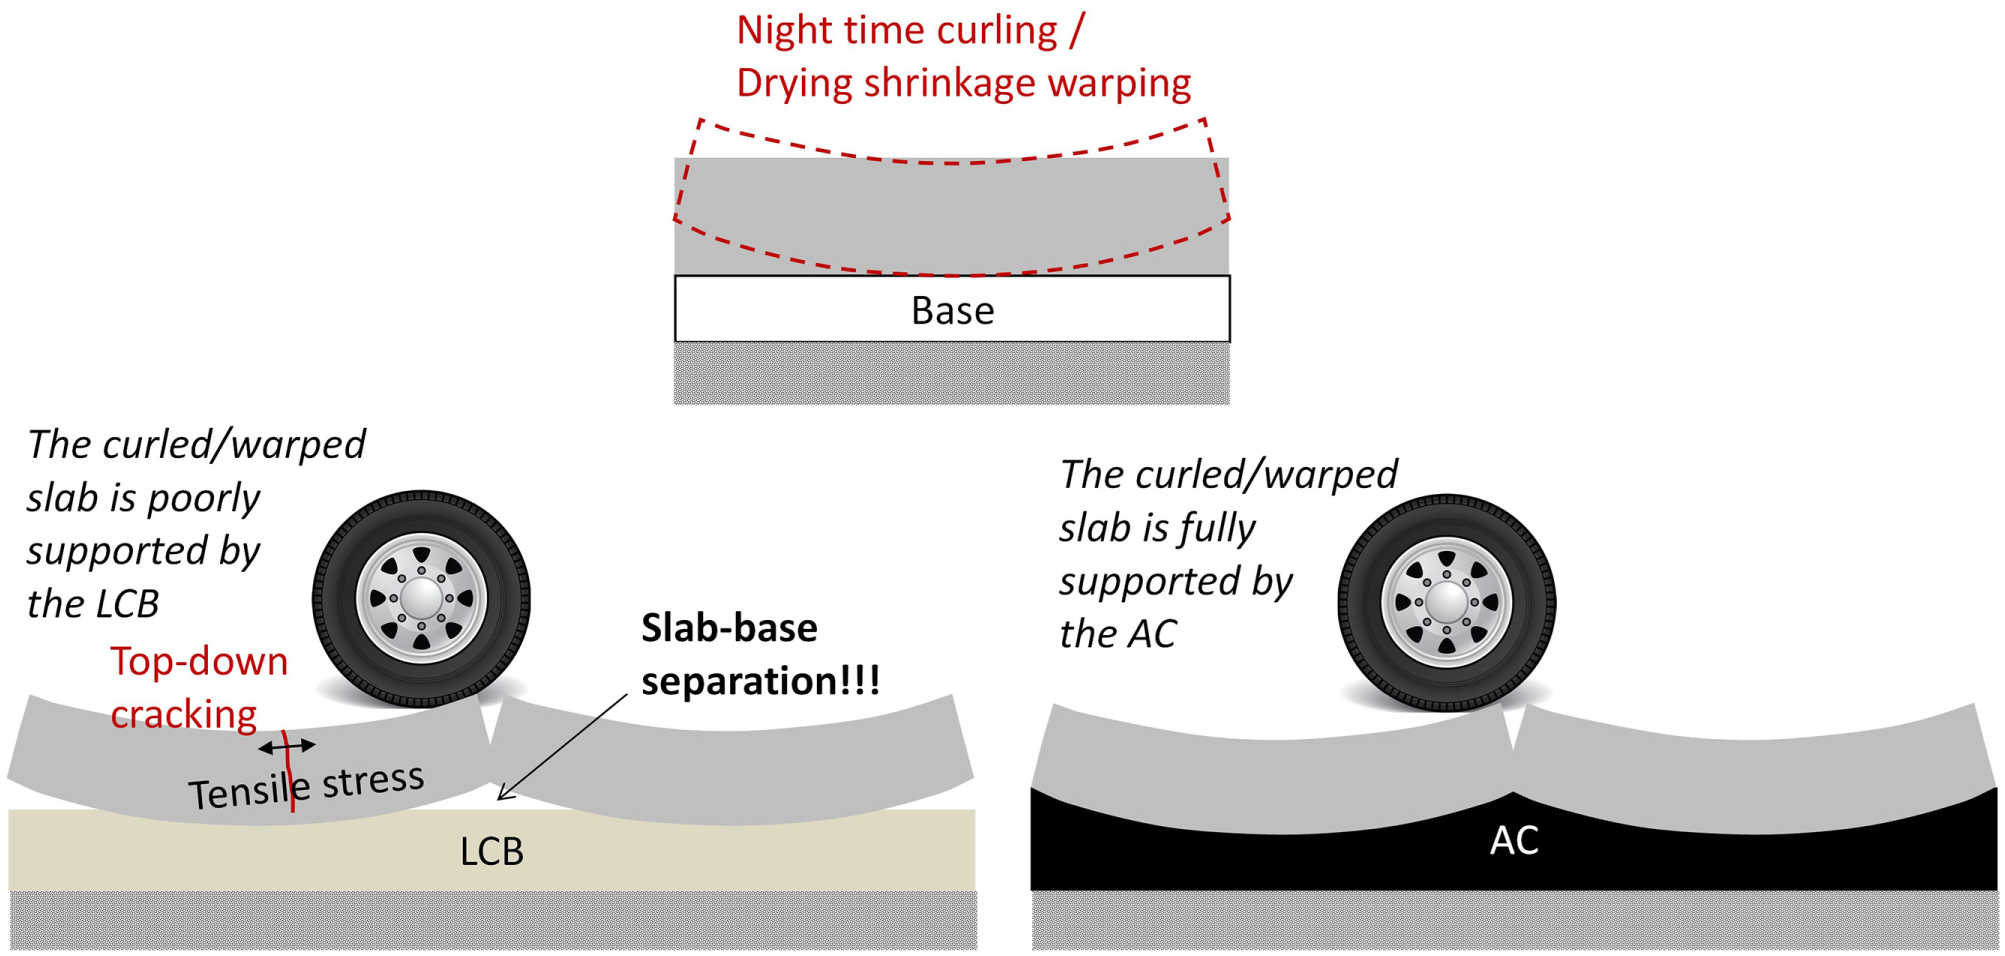
Interaction between curled/warped slab (concave upwards) and base: (Top) Slab curling/warping, (Bottom left) Slabs with poor base support, and (Bottom right) Slabs with good base support.
Despite the relatively poor performance of JPCP with LCB compared with the AC base, because of the construction advantages that the LCB offers there is interest in continuing to use LCB in JPCP ( 8 ). It is believed that the poor performance of JPCP with LCB is a result of the low capacity of the lean concrete to creep/adapt to the curling/warping of the slabs. Consequently, the main hypothesis behind this study is that, by using an interlayer with sufficient creep capacity between the concrete slabs and the LCB, the performance of JPCP with LCB should match or improve the performance of JPCP with AC base.
The practice of JPCP includes the use of a bond breaker between the concrete slabs and the rigid base. The corresponding Caltrans requirements are included in the Standard Specifications Section 36-2 “Base Bond Breaker ( 9 ).” For LCB, the specifications require the use of any of three bond breakers: sprayed PG 64-10 asphalt binder, curing compound, and geosynthetic. For new JPCP construction and JPCP lane reconstruction projects, the curing compound is the most commonly used bond breaker in California. Polyethylene film and white curing paper, both following ASTM C171 specifications, are allowed with rapid-strength concrete bases and are frequently used in individual slab replacements that take place overnight.
The curing compound bond breaker prescribed by Caltrans specifications consists of one or more applications of ASTM C309 Type 2 (white pigmented) compound to achieve a total coverage rate of at least 0.54 L/m2 (0.12 gal/yd2). While the curing compound film is expected to break the bond between the concrete slabs and the LCB, it is too thin to provide any cushioning effect from creep or elastic deformation between the slabs and the LCB and, consequently, it may result in an undesirable rigid contact between the two (slabs and LCB). This hypothesis is also validated by the experiment data and analysis presented later in this paper.
A major limitation in developing an interlayer material between concrete slabs and LCB is the lack of understanding of slab-base interaction mechanisms. Current mechanistic-empirical modeling oversimplifies the slab-base interaction problem by considering, among other simplifications, that slab and base are fully bonded in the vertical direction, while two extreme conditions—fully bonded or unbonded—are typically considered in the horizontal direction ( 10 , 11 ). The horizontal bond is assumed to be broken after a certain period. This approach fails to reproduce the differences in cracking performance between JPCP with LCB and JPCP with AC base.
Research Goal
The goal of the research presented in this paper is to develop recommendations for improving the interlayers for use between JPCP slabs and LCB. In particular, the study was designed to address the following two questions:
1) Why does JPCP perform considerably better, with regard to cracking, with an AC base than with LCB?
2) Can the performance of JPCP with LCB be improved by using an engineered interlayer? If yes, then which interlayer?
Experiment Approach
Answering the two questions formulated above would be difficult—if not impossible—without a good understanding of the slab-base interaction mechanisms in JPCP. Studying these interaction mechanisms is the main reason for including the evaluation of a full-scale test track in this research project. The test track includes an AC base and an LCB with three different interlayers: curing compound, geotextile, and microsurfacing. The rationale for each selection is provided below.
The monitoring of the test track includes the concrete hygrothermal strains, in particular the curling/warping of the slabs, and the deflection under falling weight deflectometer (FWD) loading. As the slab curls/warps concave upwards (night-time type curvature), the slab loses the base support, starting at the corner. Consequently, the deflection under FWD loading applied at the corner of the slabs provides a measure of the ability of the base to provide support to the slab. The slabs were instrumented with vibrating wire strain gauges (VWSG) to measure the curling/warping.
The monitoring period presented in this paper goes from the construction of the test track in June, 2022, to the end of the research project in September, 2023.
Finite element method (FEM) modeling constitutes another main pillar of this research. The FEM model developed for this research simulates the structural response of curled/warped slabs under traffic and FWD loading for different scenarios of slab-base bonding. The FEM model was developed with Abaqus software and was calibrated with results of FWD testing and the laboratory testing conducted on materials (AC, LCB, and concrete) sampled during the construction of the test track.
Scope
While this research focuses on JPCP, the recommendations for slab-LCB interlayer can be extrapolated to concrete overlays on concrete pavements.
Thin concrete overlays on asphalt, referred to also as JPCP with thin and short slabs (short-JPCP), is not specifically addressed in this research.
This research focuses on highway pavements. The interlayers for rigid bases in other concrete pavement applications, including ports and airports, are subjected to mechanical and hydrothermal conditions that may considerably differ from the standard highway concrete pavement.
Test Track Design and Construction
Materials Selection
Base Materials
As explained above, the Caltrans rigid pavement design catalog considers two types of base for JPCP: AC and LCB. Only one AC and one LCB were used for the test track construction because of budget and time limitations. The two materials were designed and built according to Caltrans Standard Specifications.
The selected AC is a Superpave design, rubberized gap-graded mix, with 19 mm (3/4 in.) nominal maximum aggregate size (NMAS) and 7.5% asphalt rubber binder content (% by total weight of mix). The asphalt rubber binder contains 18% recycled tire crumb rubber, 2% extender oil, and 80% PG 64-16 base binder. This AC is commonly used for 60 mm (2.4 in.) thick surface overlay in Caltrans asphalt pavements. While only one AC was used for the test track construction, other AC mixes were evaluated in the laboratory following a methodology for testing AC as a JPCP base that was developed as part of this research ( 12 , 13 ). The testing indicates that the rubberized AC used for the test track construction provides similar support to the JPCP slabs compared with other non-rubberized AC typically used for building JPCP bases ( 12 , 13 ). Consequently, the AC selected for the test track construction can be considered to represent the standard practice for JPCP AC bases in the Caltrans road network.
The LCB contains 161 kg/m3 (271 lb/yd3) of Type II (ASTM C150) Portland cement and no supplementary cementitious material. Its design slump is 50 ± 25 mm (2 ± 1 in.), compatible with slip-form paving. This LCB is commonly used for the construction of Caltrans JPCP bases. The Portland cement provides the LCB with its mechanical properties, including its limited capacity to creep compared with an AC.
Interlayers
The curing compound interlayer was selected because it is the most commonly used bond breaker in new JPCP construction and JPCP lane reconstruction projects in California. The geotextile was selected because it has been recommended by Concrete Pavement Technology Center as a “separation layer” for unbonded concrete overlay of existing concrete pavements—an application that has similarities with the JPCP-LCB interlayer studied in this research project—and because the geotextile is already included in Caltrans repertory of bond breakers ( 14 , 15 ).
Following Caltrans specifications, the curing compound interlayer consisted of two applications of ASTM C309 Type 2 (white pigmented) compound to achieve a total coverage rate of 0.54 L/m2 (0.12 gal/yd2). The geotextile was a nonwoven polypropylene geosynthetic, 500 g/m2 (14.7 oz/yd2), meeting AASHTO M288.
While the curing compound and the geotextile were expected to effectively break the bond between the slabs and the LCB, neither of the two was expected to provide the cushion effect required to prevent the rigid contact between the slabs and the LCB. Consequently, a third interlayer, microsurfacing, was selected for the test track construction.
Microsurfacing can be regarded as a high-quality slurry; and a slurry is a “homogenous mixture of emulsified asphalt, water, well-graded fine aggregate and mineral filler that has a creamy fluid-like appearance when applied” ( 16 ). Compared with the slurry, microsurfacing emulsified asphalt is polymer-modified, and the filler must include Portland cement; quality control/quality assurance requirements are somewhat stricter for microsurfacing than for slurry.
The reasons for selecting microsurfacing were: 1) it was believed to be capable of providing the aforementioned cushion effect and preventing the rigid contact between the slabs and the LCB; 2) it presents several constructability advantages (listed below); and 3) no technical, economical, or environmental reason was found that would discourage microsurfacing use as a JPCP-LCB interlayer. Below is a list of constructability advantages that microsurfacing would present if used as a JPCP-LCB interlayer:
The cost is relatively low, comparable to geotextile, and much lower than AC.
The application is very fast (microsurfacing can be placed faster than walking speed).
Microsurfacing can be open to construction traffic in 2 h.
The microsurfacing paving operation requires minimum equipment and no compaction.
The microsurfacing used for the test track construction is a Type II gradation (4.75 mm [#4] NMAS) with 9% asphalt residue and 1% Type II Portland cement (% by weight of aggregate), applied at a rate of 5.4–9.8 kg/m2 (10–18 lb/yd2), which results in a thickness of around 5 mm (0.2 in.). It meets Caltrans Standard Specifications Section 37-3 “Slurry Seals and Micro-Surfacings.”
Concrete
The concrete pavement was built with Portland limestone cement (PLC) as this type of cement is progressively replacing Portland cement in California because of its lower embodied carbon ( 17 ). The concrete mixture is based on an existing design provided by Cemex, the concrete supplier for the test track construction. The PLC concrete (PLCC) mixture design, shown in Table 1, meets Caltrans Standard Specifications Section 40 “Concrete Pavement” and Section 90 “Concrete.”
Portland Limestone Cement Concrete Mixture Design
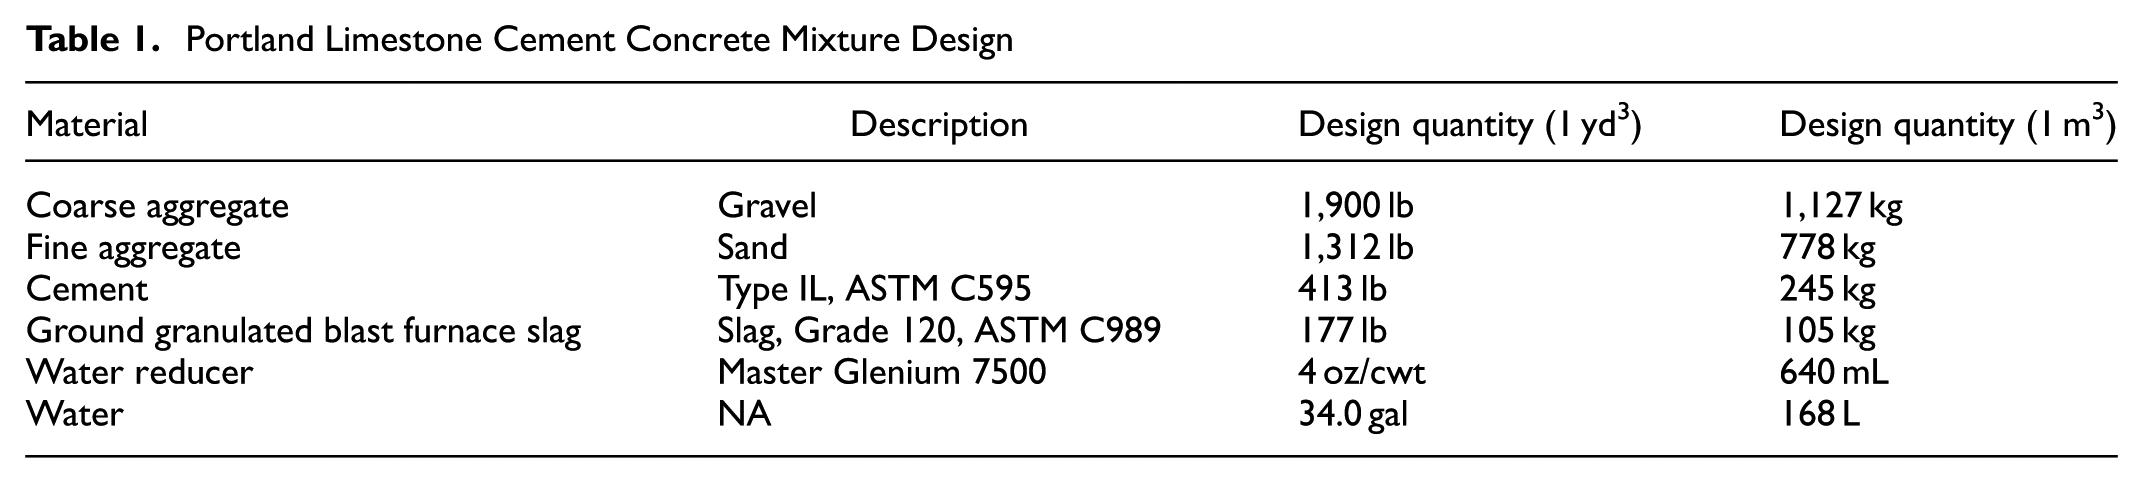
The PLCC water reducer was dosed with the goal of achieving a slump of 150 mm (6 in.), compatible with fixed-form paving and vibrating rolling screed consolidation.
Geometric Design
Only one slab per section was built because of space and budget limitations. This means that the transverse joints had no load transfer efficiency (LTE); this choice of design is not regarded as a limitation, as explained below. The goal of the test track was to evaluate how the type of base and the interlayer affect the capacity of the slab to support loading. For that reason, large curling/warping deformations of the slabs is desired. Curling/warping is expected to be larger for single (isolated) slabs than for jointed slabs with doweled transverse joints, as dowels restrict slab curling/warping. Further, the corner deflections under FWD loading will be larger on a single slab than on slabs with LTE, particularly if the transverse joints are provided with dowels. Consequently, the effect of the type of base and interlayer will be better captured on single (isolated) slabs than on jointed slabs with LTE.
The thickness of the slab was 178 mm (7 in.), which is relatively thin for JPCP. This design choice is not considered a limitation, as the objective of the test track was to assess how the base type and interlayer affect the capacity of the slab to support loading. To that end, significant curling and warping deformations is desired, and the relatively thin slabs help promote such behavior.
The thickness of the AC and LCB were 76 mm (3 in.) and 107 mm (4.2 in.), respectively, following Caltrans practice.
The configuration of the test track is shown in Figure 3.
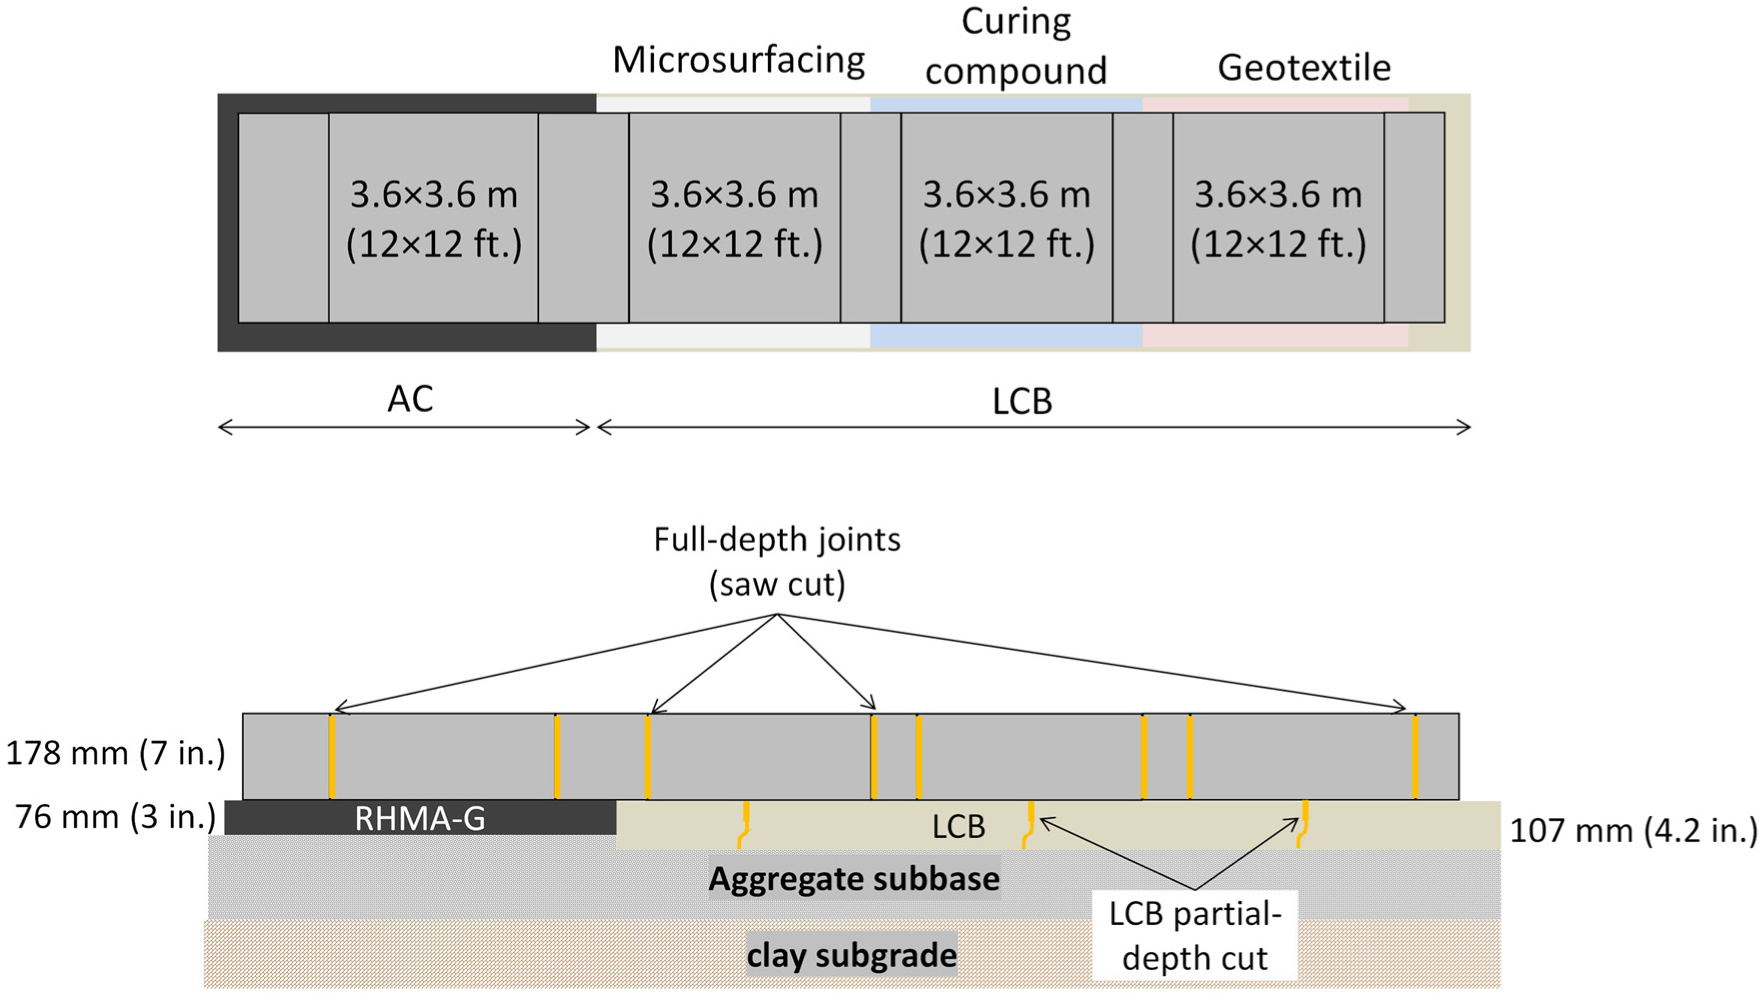
Test track layout: (Top) Plan view and (Bottom) Cross view.
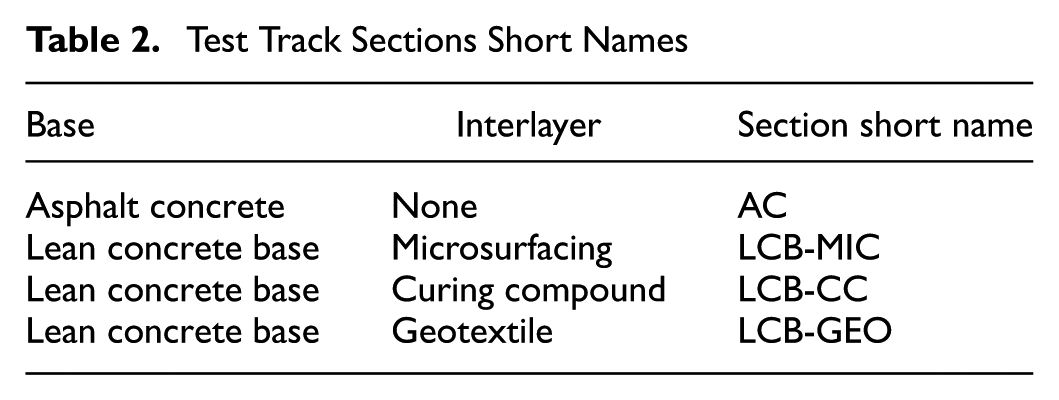
Sections Naming
The different test track sections are referred to in Table 2. The short names are used in several figures in this paper.
Test Track Sections Short Names
Instrumentation
The instrumentation installed in each of the four slabs, shown in Figure 4, focuses on measuring the response to the ambient environmental loading (slab curling/warping in particular). The instrumentation of each slab includes two thermocouple rods for measuring temperature profile in the slab and base and two pairs of GeoKon 4200 VWSG, located at two corners. Each pair consists of a VWSG close to the top of the slab and another VWSG close to the bottom of the slab (Figure 5).
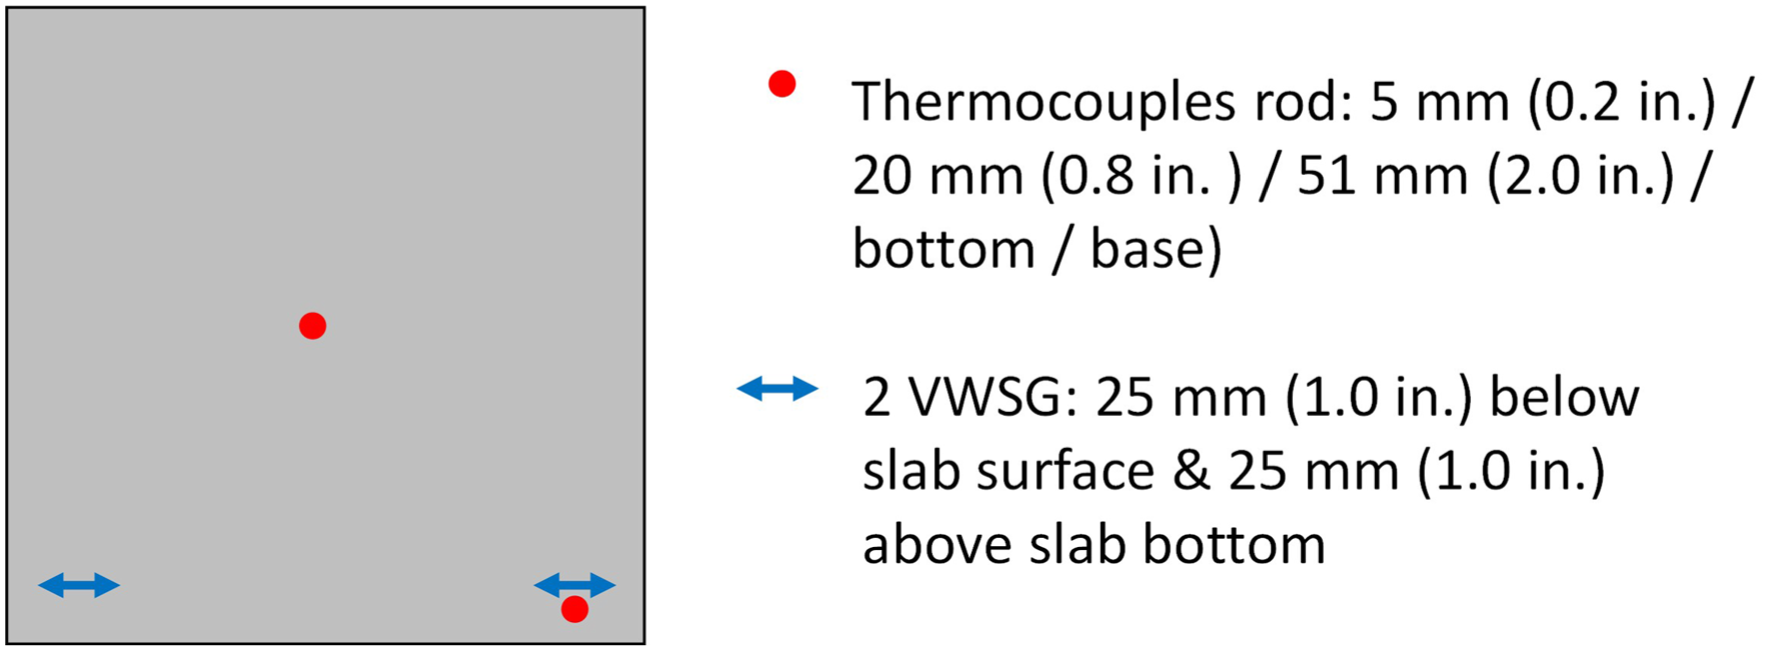
Test section instrumentation layout.
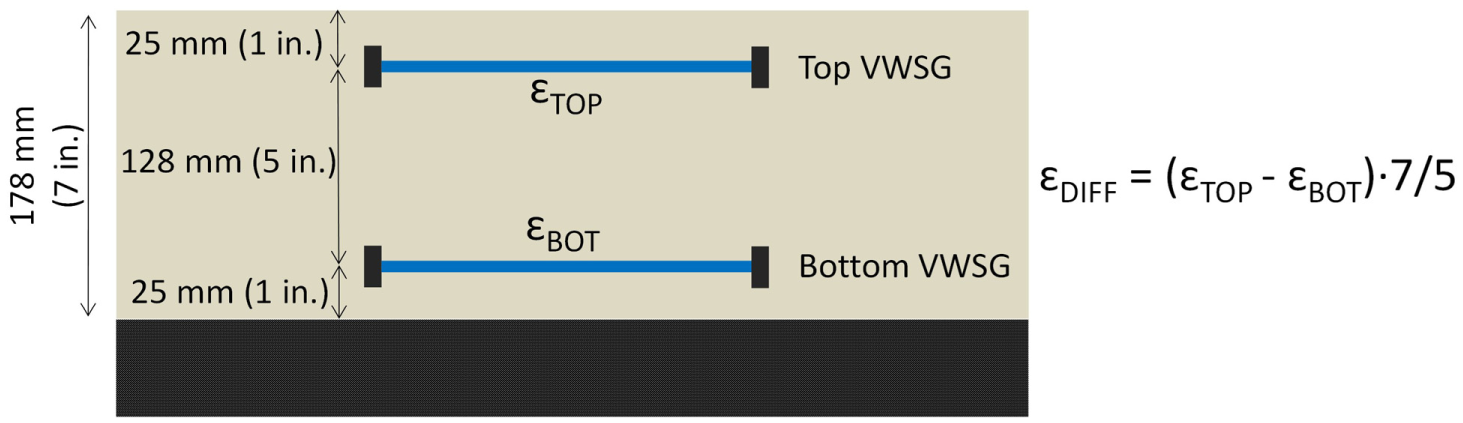
Calculation of differential strain (ε DIFF).
The manufacturer’s calibration factor was used for strain calculation. According to the manufacturer’s specifications, the sensor has an accuracy of 15 με.
The strain data collected by the VWSG was used to calculate the differential strain (ε DIFF), which is the difference between the strain at the top and bottom of the slab (as shown in Figure 5) and quantifies slab curling/warping.
Sensor data was collected by a Campbell Scientific data acquisition system located by the test sections. Sensor data was collected every 10 min, starting before the construction of the concrete slabs.
Test Track Location and Climate
The test track is situated in Davis, in the California central valley. The climate features very dry, warm summers and mild, wet, cool winters. During summer, air relative humidity often drops to around 20%, and daytime temperatures rise up to 40°C (104°F) or higher. In winter, temperatures rarely drop below freezing. Davis typically receives around 450–500 mm (18–20 in.) of rainfall annually. Nearly all of this precipitation occurs between November and April. A weather station positioned near the test track monitored the weather conditions.
Test Track Construction
The lean concrete was supplied by a local plant located at 72 km (45 mi) distance from the test track site, and placed and consolidated by a paving contractor using slip-form paving, in May, 2022 (Figure 6). The LCB was saw-cut every 6.1 m (20 ft) approximately, matching the mid-slab locations (as shown in Figure 3).
Lean concrete base construction.
The AC was supplied by a local plant located at 25 mi (40 km) distance from the test track site, and placed and compacted by a paving contractor in May, 2022.
The geotextile was installed several days before the concrete paving, while the curing compound interlayer was applied the day before the concrete paving, following California practice. The sections with curing compound and geotextile interlayers, before PLCC paving, are shown in Figures 7 and 8, respectively.
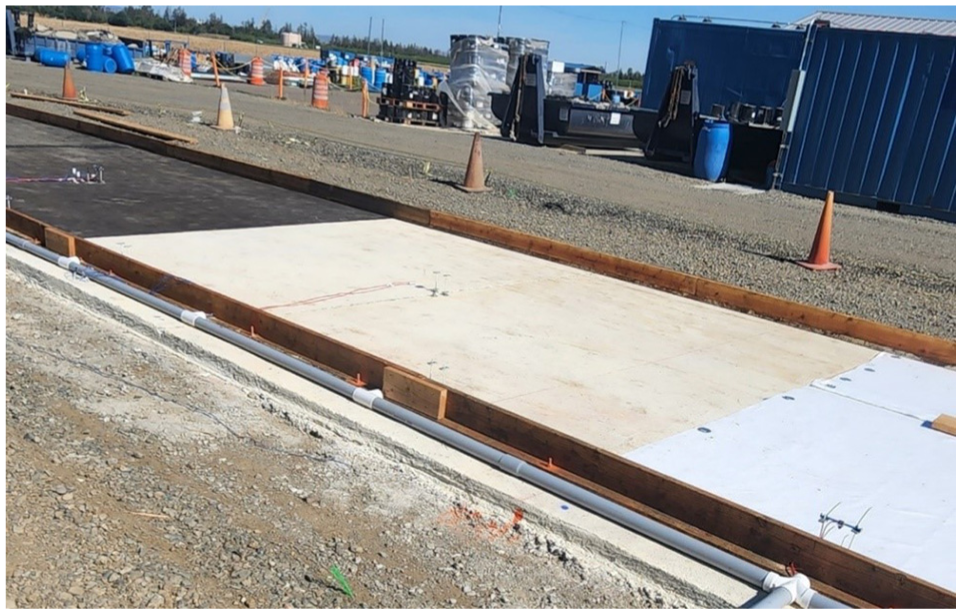
Section with curing compound interlayer, before Portland limestone cement concrete paving.
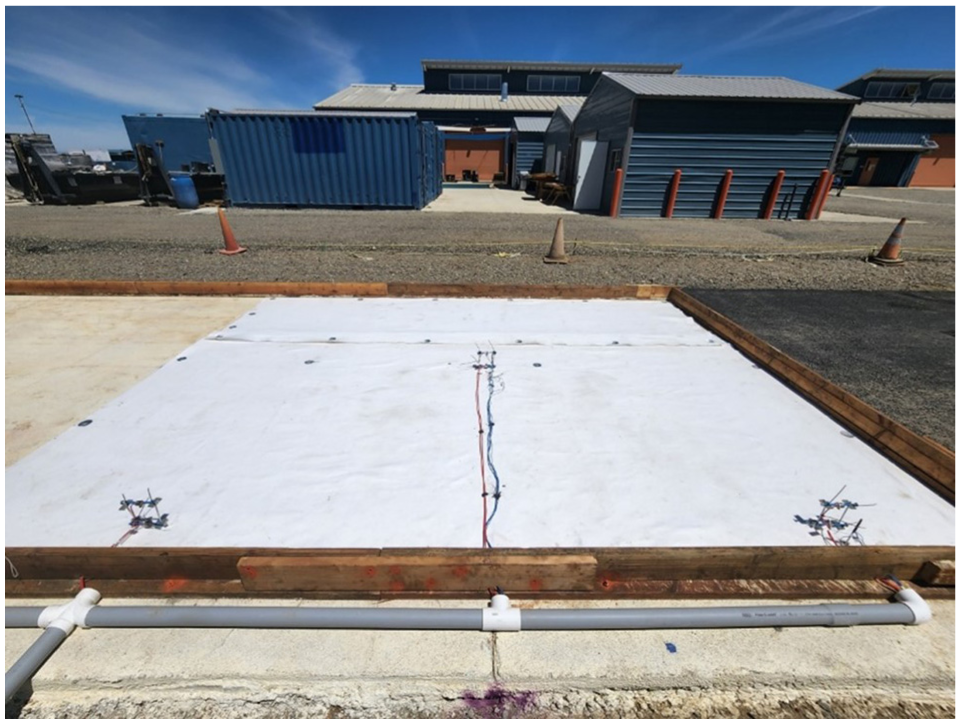
Section with geotextile interlayer before Portland limestone cement concrete paving.
The microsurfacing was produced and placed by VSS International in May, 2022. The paving operation is shown in Figure 9 and the finalized interlayer (microsurfacing on top of the LCB) in Figure 10.
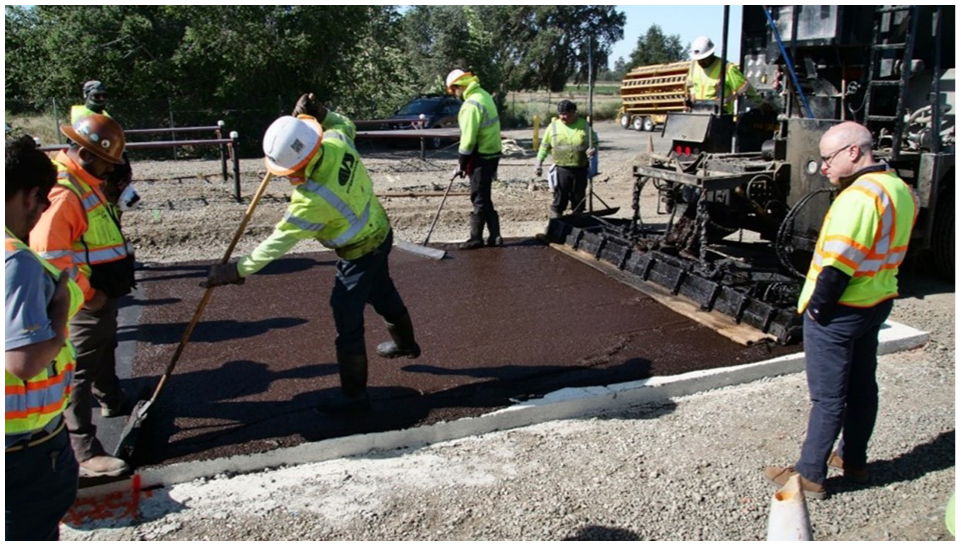
Microsurfacing paving.
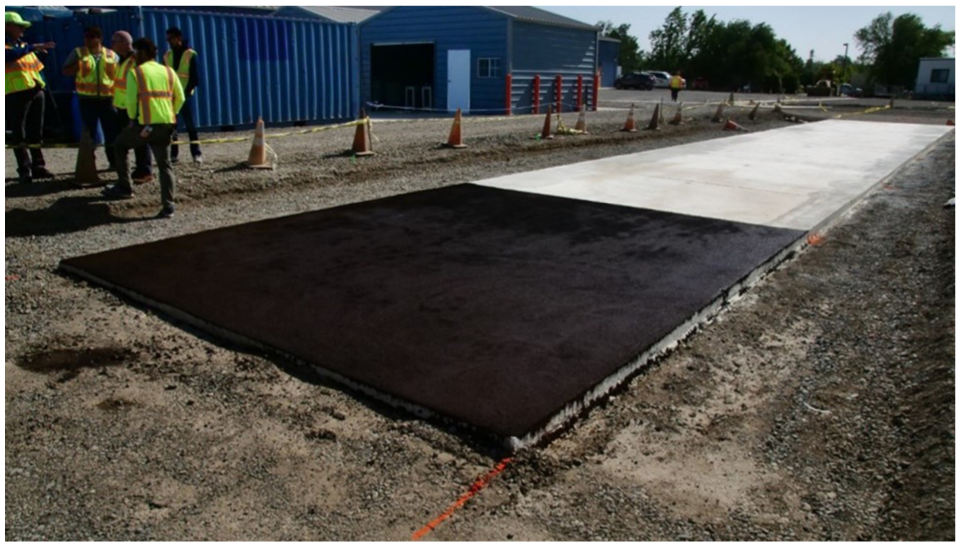
Lean concrete base with microsurfacing on top.
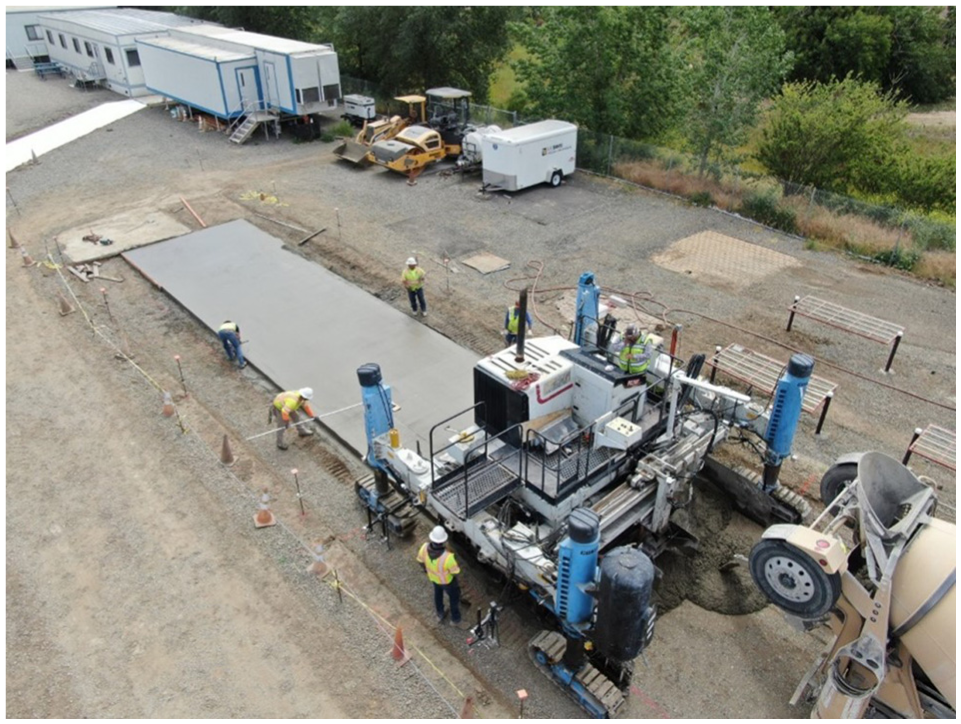
The PLCC used for building the slabs was supplied by a local plant (with Cemex), located 25 mi (40 km) distance of the test track site, and placed and consolidated by UC Davis Transportation of Parking Services masons in June, 2022.
The PLCC was consolidated with a vibrating rolling screed (Figure 11) and finished with a trowel. No surface texturing was applied. The curing was conducted with white pigmented resin-based curing compound meeting ASTM C309 Type 2B specifications, applied at a nominal rate of 0.27 L/m2 (1 gal/150 ft2). The curing compound was sprayed immediately after the concrete was finished with the trowel, and before any drying could take place. The transverse joints (see the location of transverse joints in Figure 3) were sawed full-depth once the PLCC was hard enough to resist cutting without spalling.
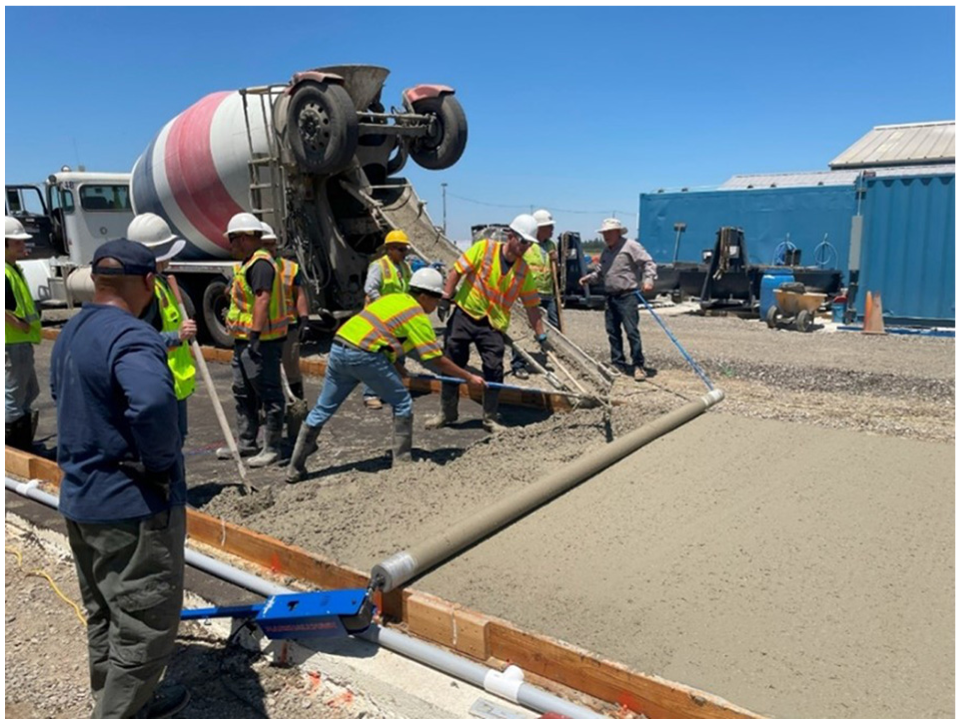
Portland limestone cement concrete construction.
All materials used in the test track construction were subjected to standard quality control/quality assurance (QC/QA) to verify compliance with the corresponding Caltrans specifications.
Materials Sampling and Testing
The AC loose mix was sampled in metal buckets during the construction of the test track. The loose mix buckets were stored at room temperature and subsequently used to produce asphalt specimens for laboratory testing.
Similarly, the LCB and the PLCC specimens were prepared from fresh mixture sampled during the construction of the test track. The specimens were prepared following ASTM C31-21 “Making and Curing Concrete Test Specimens in the Field,” stored in a curing box, and subsequently used for laboratory testing.
In addition to the QC/QA testing, the AC, LCB, and PLCC were mechanically characterized in the laboratory. One of the goals of the testing was providing material property inputs to the FEM modeling. The testing encompasses the following:
LCB: ○ Compressive strength following ASTM C39-21. Testing ages: 7 days, 28 days, and 1 year. ○ Modulus of elasticity following ASTM C469-02. Testing ages: 7 days, 28 days, and 1 year.
AC: ○ Axial dynamic modulus following AASHTO T 378-22. The testing was conducted at four temperatures: 4°C, 21°C, 38°C, and 54°C (40°F, 70°F, 100°F, and 130°F), applying sinusoidal loading with a frequency of 0.1 to 25 Hz. The testing results were fitted with a dynamic modulus sigmoidal master curve that can be used to estimate the modulus at any combination of temperature and frequency (
18
).
PLCC: ○ Compressive strength following ASTM C39-21. Testing ages: 10 days, 28 days, and 1 year. (See strength evolution in Figure 12.) ○ Modulus of elasticity following ASTM C469-02. Testing ages: 10 days, 28 days, and 1 year. ○ Coefficient of thermal expansion (CTE) following AASHTO T 336-15. Testing age: 42 days. The average CTE was 10.0 µε/°C (5.6 µε/°F).
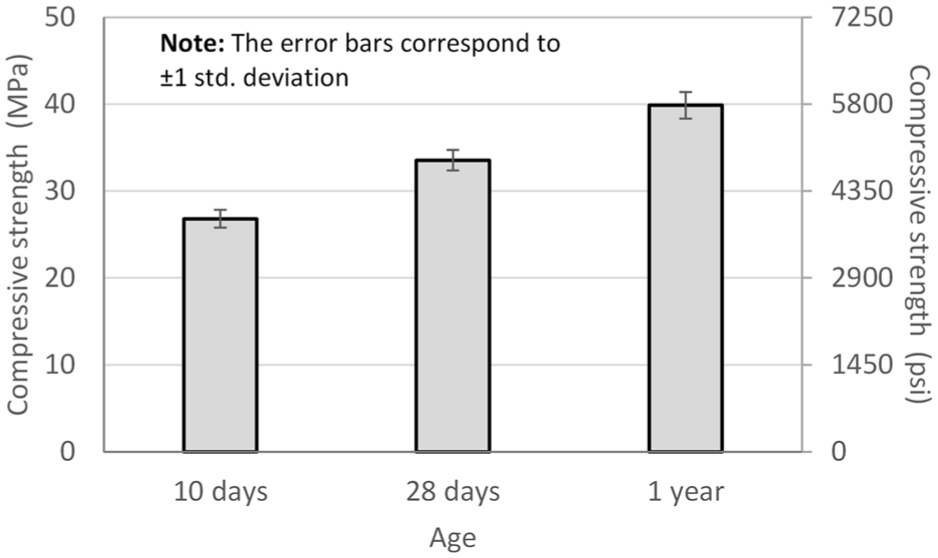
Compressive strength (Portland limestone cement concrete).
The interlayers were not tested in the laboratory. An ongoing UCPRC research project for Caltrans encompasses the development of a methodology for laboratory testing of slab-rigid base interlayers.
Test Track Monitoring Results
Slab Curling/Warping
The ε DIFF measured throughout the evaluation period presented in this paper (June, 2022, to September, 2023) is shown in Figure 13. The negative sign of ε DIFF indicates that the slabs’ curvature is concave upwards (night-time type curvature). As shown in the Figure 13, ε DIFF presents strong seasonal variation. It reaches the minimum values during the summer, as low as −600 µε, because of the high differential drying shrinkage as the top of the slab dries more than the bottom. The −600 µεε DIFF means that the top of the slab shrinks 600 µε compared with the bottom. Such high drying shrinkage agrees with values measured in instrumented JPCP slabs, also in central California, from past research projects ( 19 – 22 ). The intense drying is caused by summer solar radiation, high daytime air temperatures often exceeding 40°C (104°F), and low relative humidity, which frequently falls below 20% during the day.
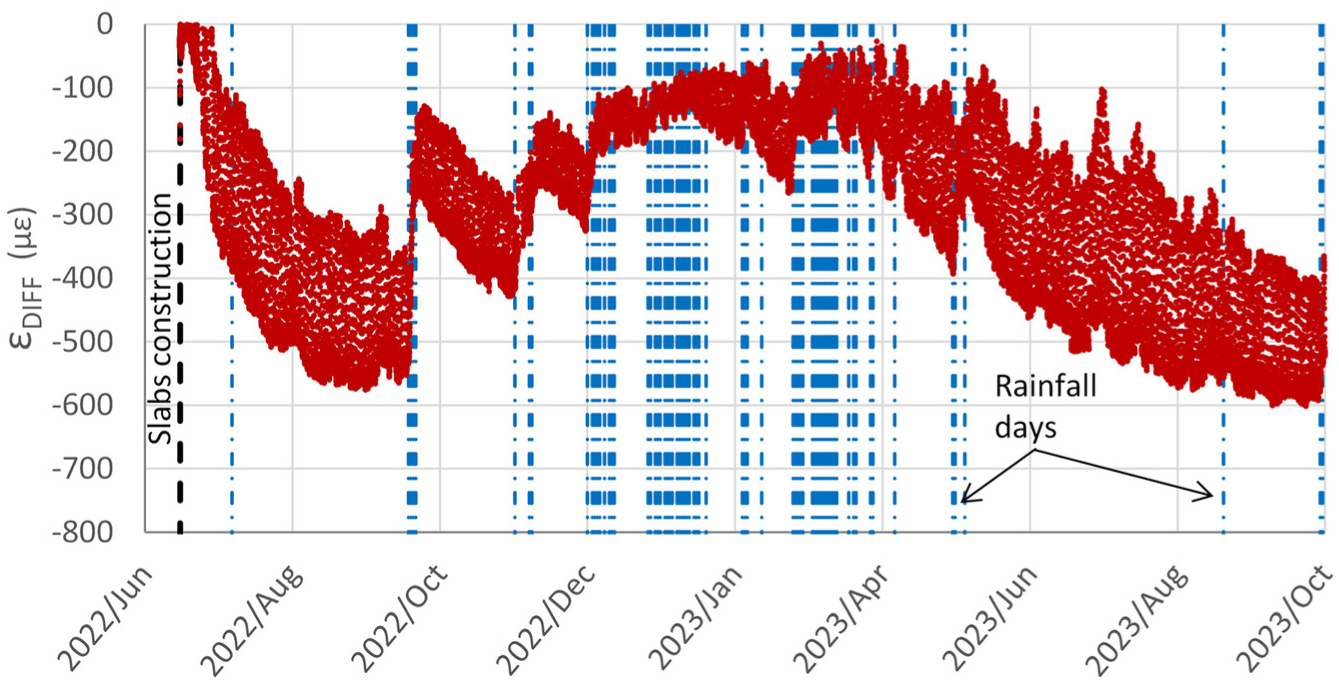
Differential strain (ε DIFF) at the corner of the slabs (average four slabs).
Figure 14 shows an example of the diurnal variations of ε DIFF and the difference between the top and bottom of the slab temperatures (TDIFF). In the Figure 14, the parallel between the variation of the two variables is evident. ε DIFF increases as TDIFF increases, and vice versa. When plotted, ε DIFF exhibits a linear relationship with TDIFF, where ε DIFF serves as the response variable and TDIFF as the explanatory variable.
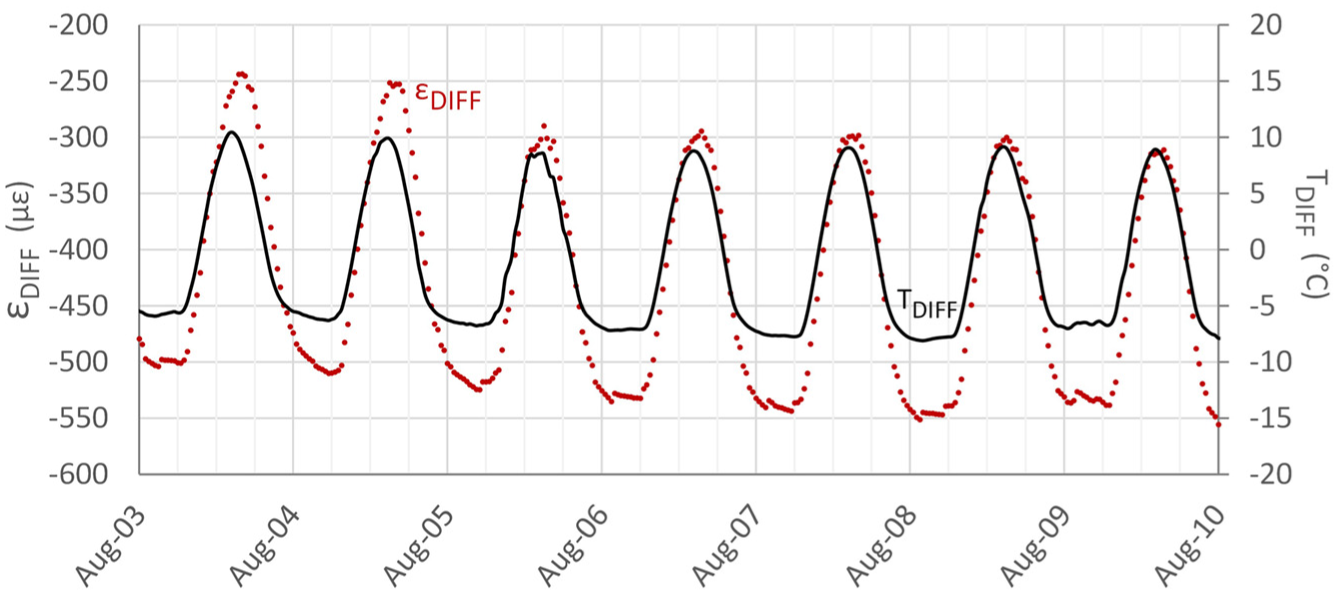
Example of diurnal variation of strain and temperature at the corner of the slabs.
The curvature of the slabs is expected to affect the deflections measured at the corner under the FWD loading. As the corner lifts up because of the curvature (curling and warping), the slab loses support below the corner and, consequently, the deflection produced by the FWD loading increases ( 23 – 25 ). While this is expected to affect all sections regardless of the base type and interlayer, the magnitude of the impact is expected to be different from one section to another.
This research does not aim to link environmental conditions to slab curvature (curling and warping). However, the curvature measured in the slabs using VWSG is used as the explanatory variable for the variations in deflection under FWD loading, as shown below.
FWD Deflections
The sections were periodically evaluated with the FWD. The goal of the FWD evaluations was to determine how the corner deflection changes versus the curvature of the slab and how the change varies from section to section.
Six FWD evaluations were conducted between June, 2022, and September, 2023. In each of the six evaluations, each slab was tested at the center and corners (Figure 15) twice a day (morning and afternoon). The curvature of the slabs varied considerably from one evaluation to another and also from morning to afternoon. Three load levels were applied: 30, 50, and 70 kN (6.7, 11.2, and 15.7 kip).
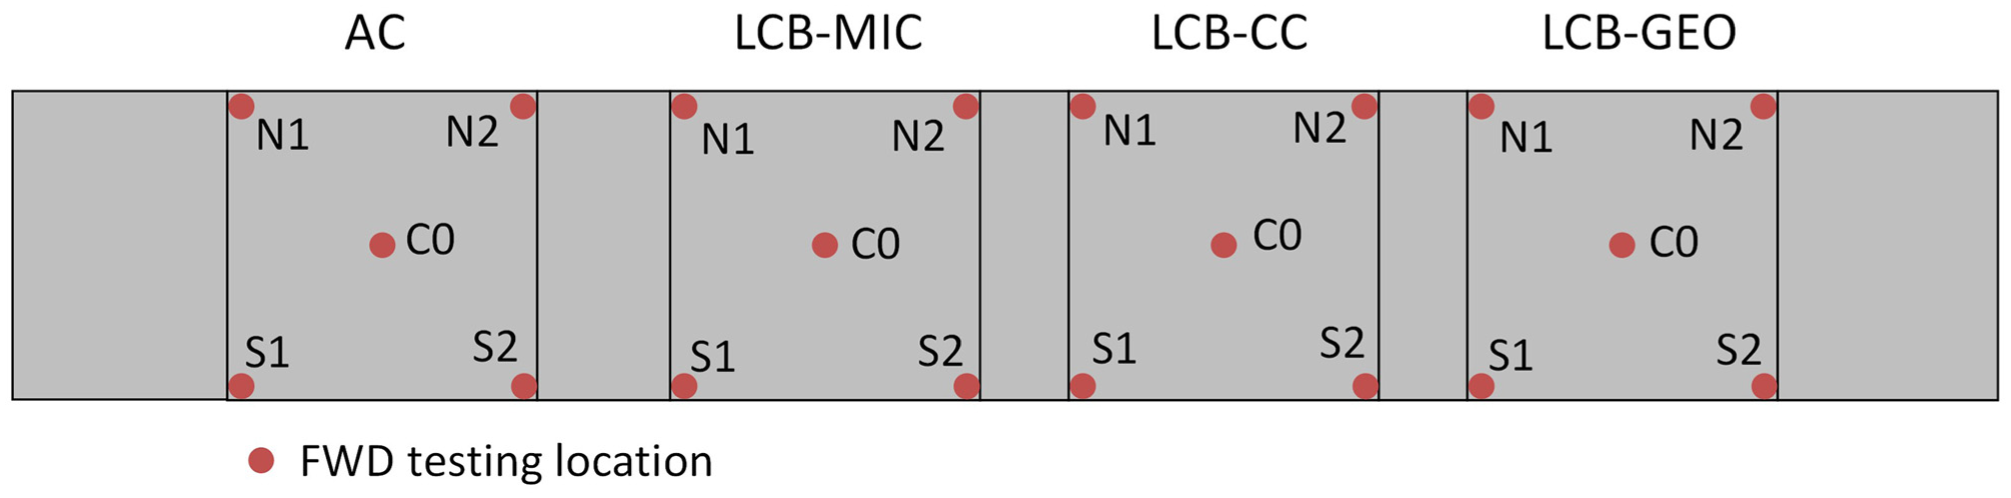
Falling weight deflectometer (FWD) evaluation locations.
For example, the deflections measured in the section with LCB and curing compound interlayer in the evaluation conducted on August 19, 2022, are shown in Figure 16. The lower deflection at the center of the slab compared with the corners is evident in the figure. The higher corner deflection in the morning than in the afternoon is also evident in Figure 16. Considerable corner-to-corner variability is also evident in the figure.
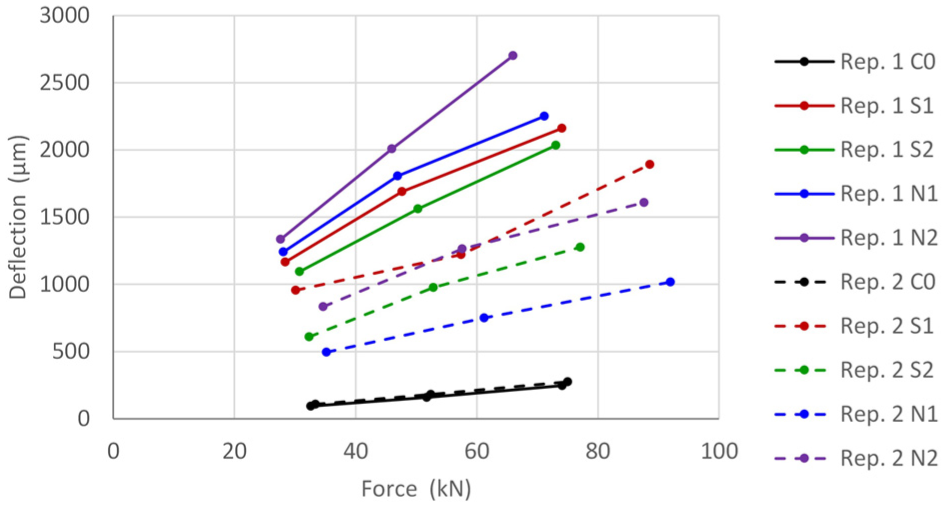
Example of falling weight deflectometer evaluation @ section lean concrete base-curing compound (LCB-CC); August 19, 2022.
The corner deflection varied considerably between the four sections, between the five evaluations, and between replicates (Rep. 1 in the morning and Rep. 2 in the afternoon).
According to the hypothesis formulated in the introduction (depicted in Figure 2) the large variations in corner deflection between evaluations and between replicates, within the same section, are because of the differences in the curvature of the slabs. To test the hypothesis, a single load level was selected (70 kN [15.7 kip]), and the corner deflections (average of four corners per section) were plotted versus ε DIFF (Figure 17). The negative sign of ε DIFF in Figure 17 indicates that the slabs are curled concave upwards (night-time type curvature). As shown in Figure 17, the corner deflections for each section condense into a single line when plotted versus ε DIFF. This outcome supports the aforementioned hypothesis.
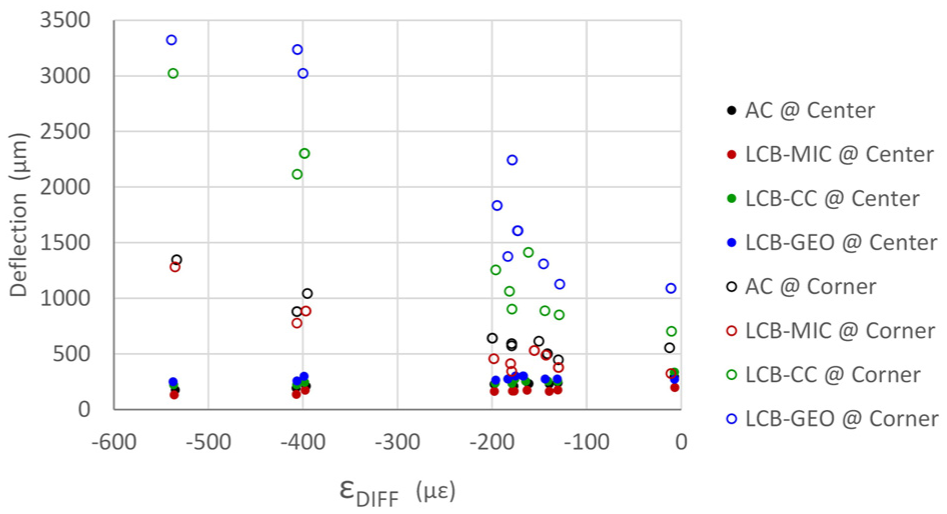
Summary of falling weight deflectometer evaluations @70 kN (15.7 kip) loading.
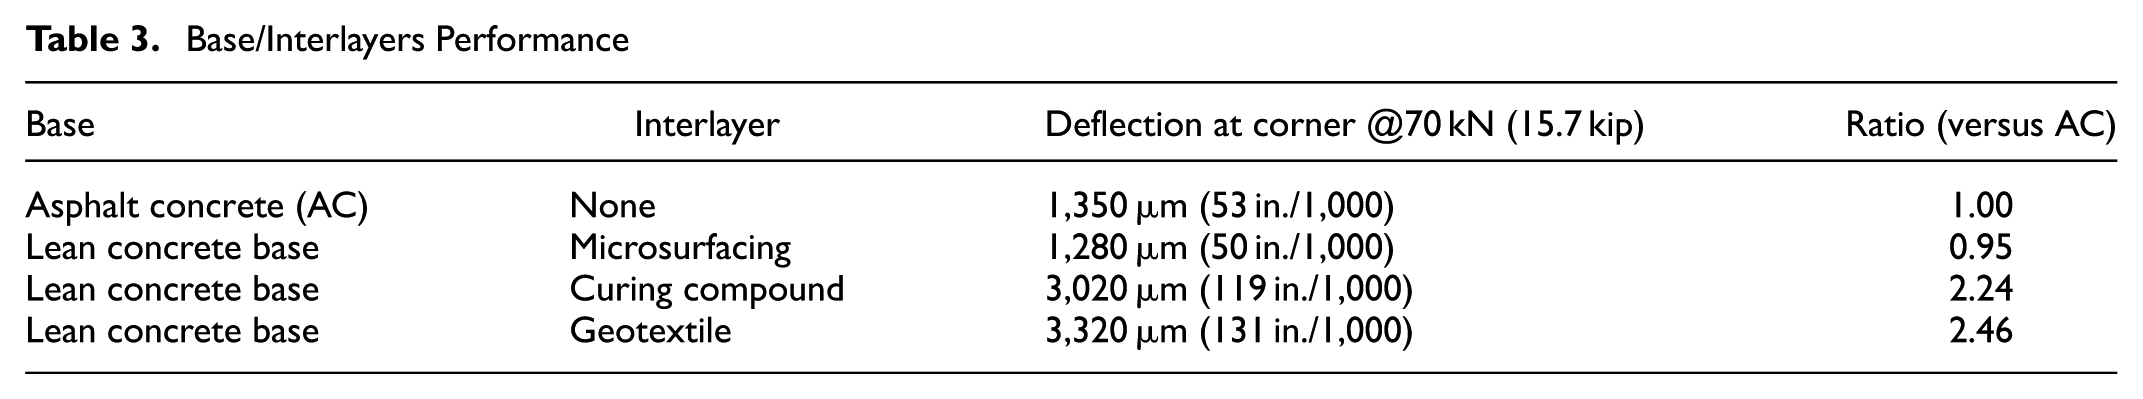
The performance of the different interlayers can be evaluated using the ratio of corner deflection measured at −500 μεε DIFF to the corner deflection in the section with an AC base (Table 3). The lower the ratio, the better the performance. Microsurfacing showed the best performance with a ratio of 0.95, while geotextile exhibited the worst performance with a ratio of 2.4. The high ratio of 2.2 for the curing compound interlayer aligns with the poor performance observed in the field, as discussed in the introduction.
Base/Interlayers Performance
Several conclusions can be extracted from Figure 17:
While the deflection at the center of the slab remains stable versus εDIFF and varies little from section to section, the deflection at the corner considerably changes versus εDIFF and from one section to another.
As expected, the corner deflection increases as the magnitude of εDIFF increases.
The relationship between corner deflection and εDIFF strongly depends on the type of base and interlayer.
The corner deflection in the section with LCB-CC increases versus curling/warping (εDIFF) much more than in the section with AC base.
The geotextile did not improve the performance of the section with curing compound interlayer.
The microsurfacing considerably improved the performance of the curing compound. In fact, the corner deflection in the section with LCB and microsurfacing interlayer (LCB-MIC) was similar to the corner deflection in the section with AC base.
FEM Modeling of Slab’s Structural Response
Model Description
The goal of the FEM modeling is to predict the structural response of the slabs under the FWD loading. Except for the slab-base interaction, the modeling was conducted with Abaqus software following current standard practice for the mechanistic-empirical design of concrete pavements. Following such practice, the structural problem is assumed to be static, concrete and asphalt are regarded as linear elastic materials, and the subgrade is modeled as a tension-less liquid foundation. The FWD loading was uniformly distributed on a circular area. No aggregate interlock was assumed, because the slabs were independent from each other. Slab and base finite element type was 8-node linear brick element with incompatible modes and second-order accuracy (C3D8I). The problem was modeled in three steps: 1) self-weight of the slabs and base; 2) slab curling/warping; and 3) FWD loading. Asphalt stiffness is determined for a frequency of 30 Hz that is representative of the loading pulse applied by the FWD used in this research. Only two sections were modeled: AC and LCB-curing compound (LCB-CC). The other two sections were not modeled because the mechanical properties of the geotextile and the microsurfacing interlayers, necessary for FEM characterization, were not available. The FEM model layout and cross-section are shown in Figure 18. Because of paper length limitations, only the output of the FEM modeling is presented here. FEM modeling details can be found in Mateos et al. and Fernandez ( 12 , 13 ).
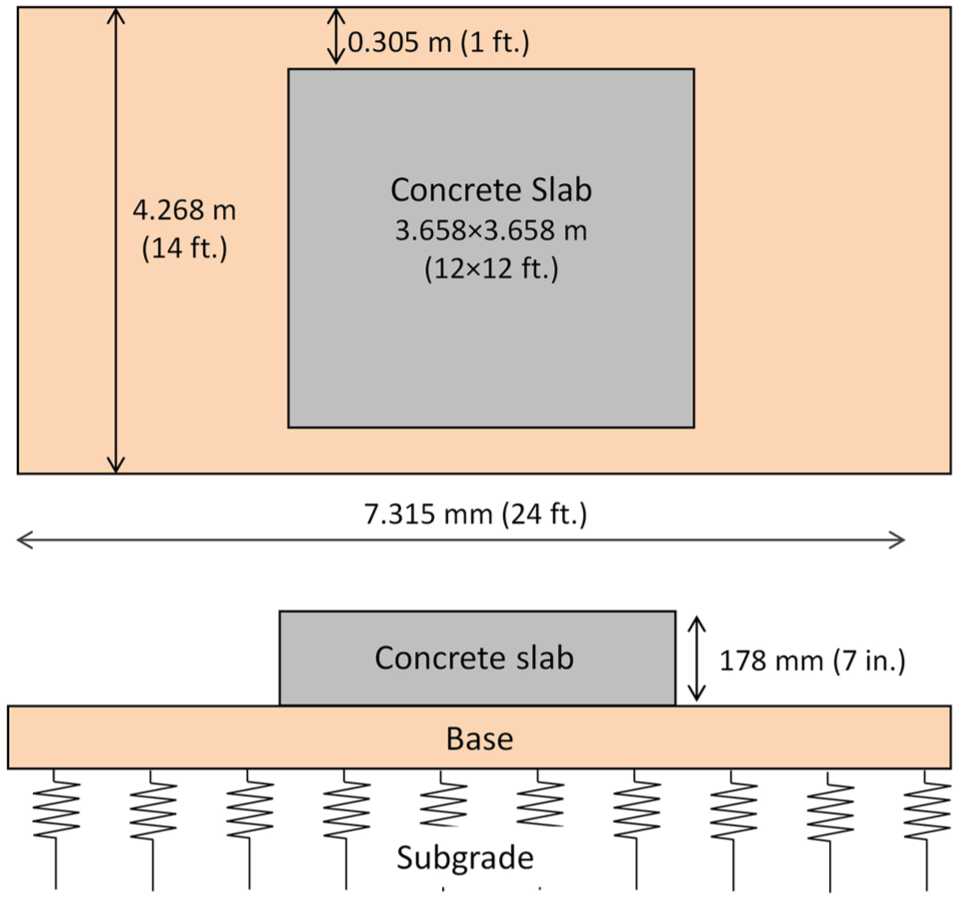
Finite element method model layout (top) and cross-section (bottom).
Different levels of slab curvature (ε DIFF) were modeled, from 0 (flat slabs) to −500 µε. The curvature was modeled by introducing a temperature difference (ΔTEQ) between the top and bottom of the slabs: ΔTEQ = ε DIFF/CTE.
Slabs and LCB were assumed to be debonded. The slab-LCB interaction is modeled as a rigid contact with no bonding; consequently, the two materials separate from each other when the slabs curl/warp (Figure 19left). Depending on the slab curvature and the FWD loading level, the slab corner may be in contact with the base when the FWD loading applied is large enough to bend the slab back down into contact with the base (Figure 19right).
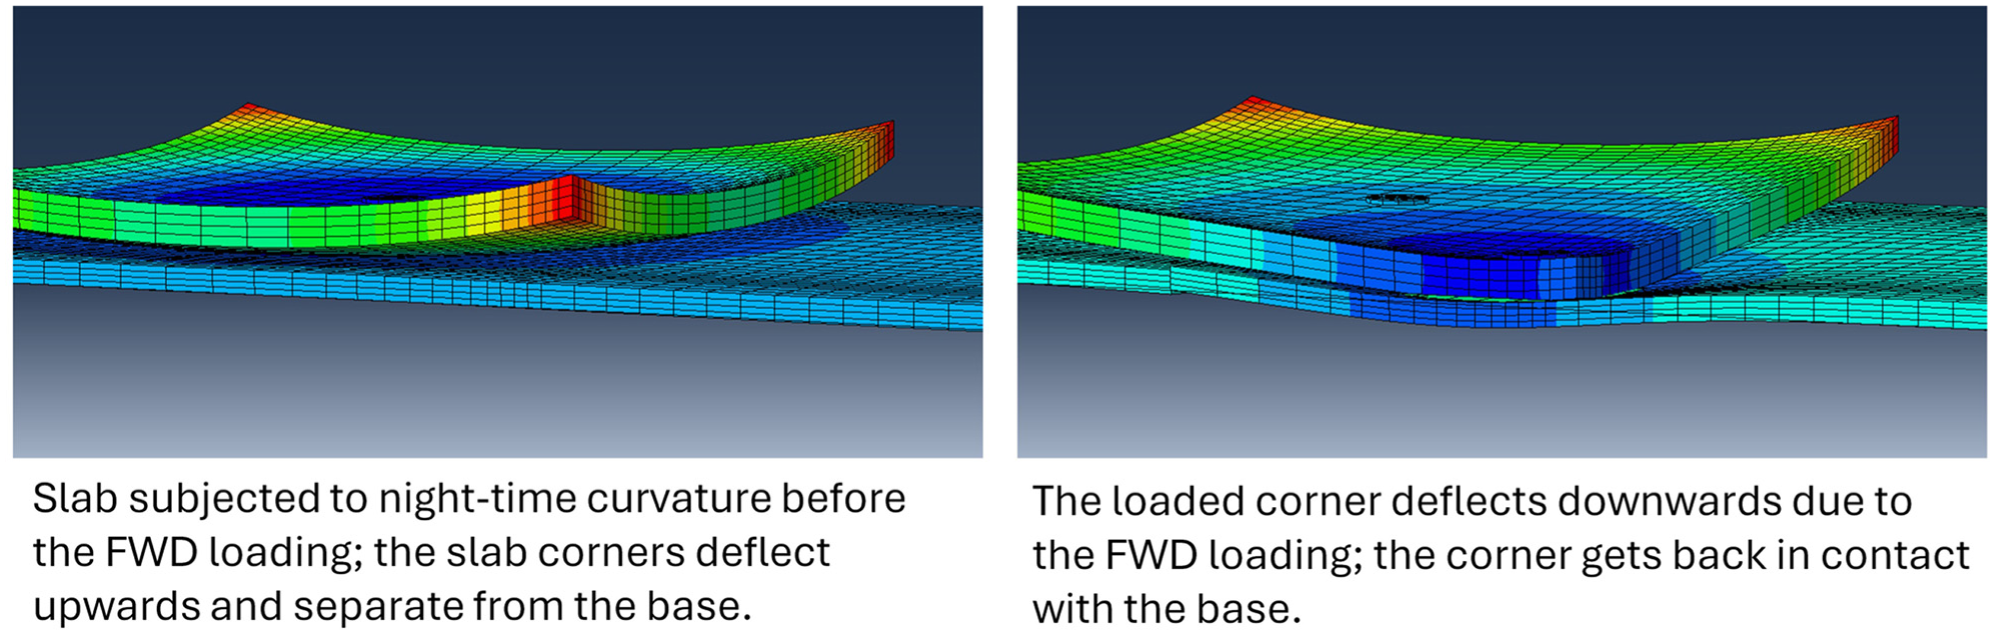
Finite element method modeling of falling weight deflectometer (FWD) loading on lean concrete base-curing compound (LCB-CC) section (corner loading; εDIFF = −150 µε; FWD load = 70 kN [15.7 kip]): (Left) Before FWD loading and (Right) Under FWD loading.
Slabs and AC were assumed to be bonded except at a delamination band along the slab perimeter. Three debonding scenarios were modeled: 0, 300, and 600 mm (0, 12, and 24 in.) delamination band width (DB). The width 0 corresponds to concrete slabs fully bonded to the AC base. The slab-AC interaction at the delamination band is modeled as a rigid contact with no bonding; consequently, the two materials separate from each other when the slabs curl/warp. Depending on the DB, the slab curvature, and the FWD loading level, the slab corner may get in contact with the base when the FWD loading is applied (Figure 20top). The slab and the base remain in contact at all times when full bonding is assumed (Figure 20bottom).
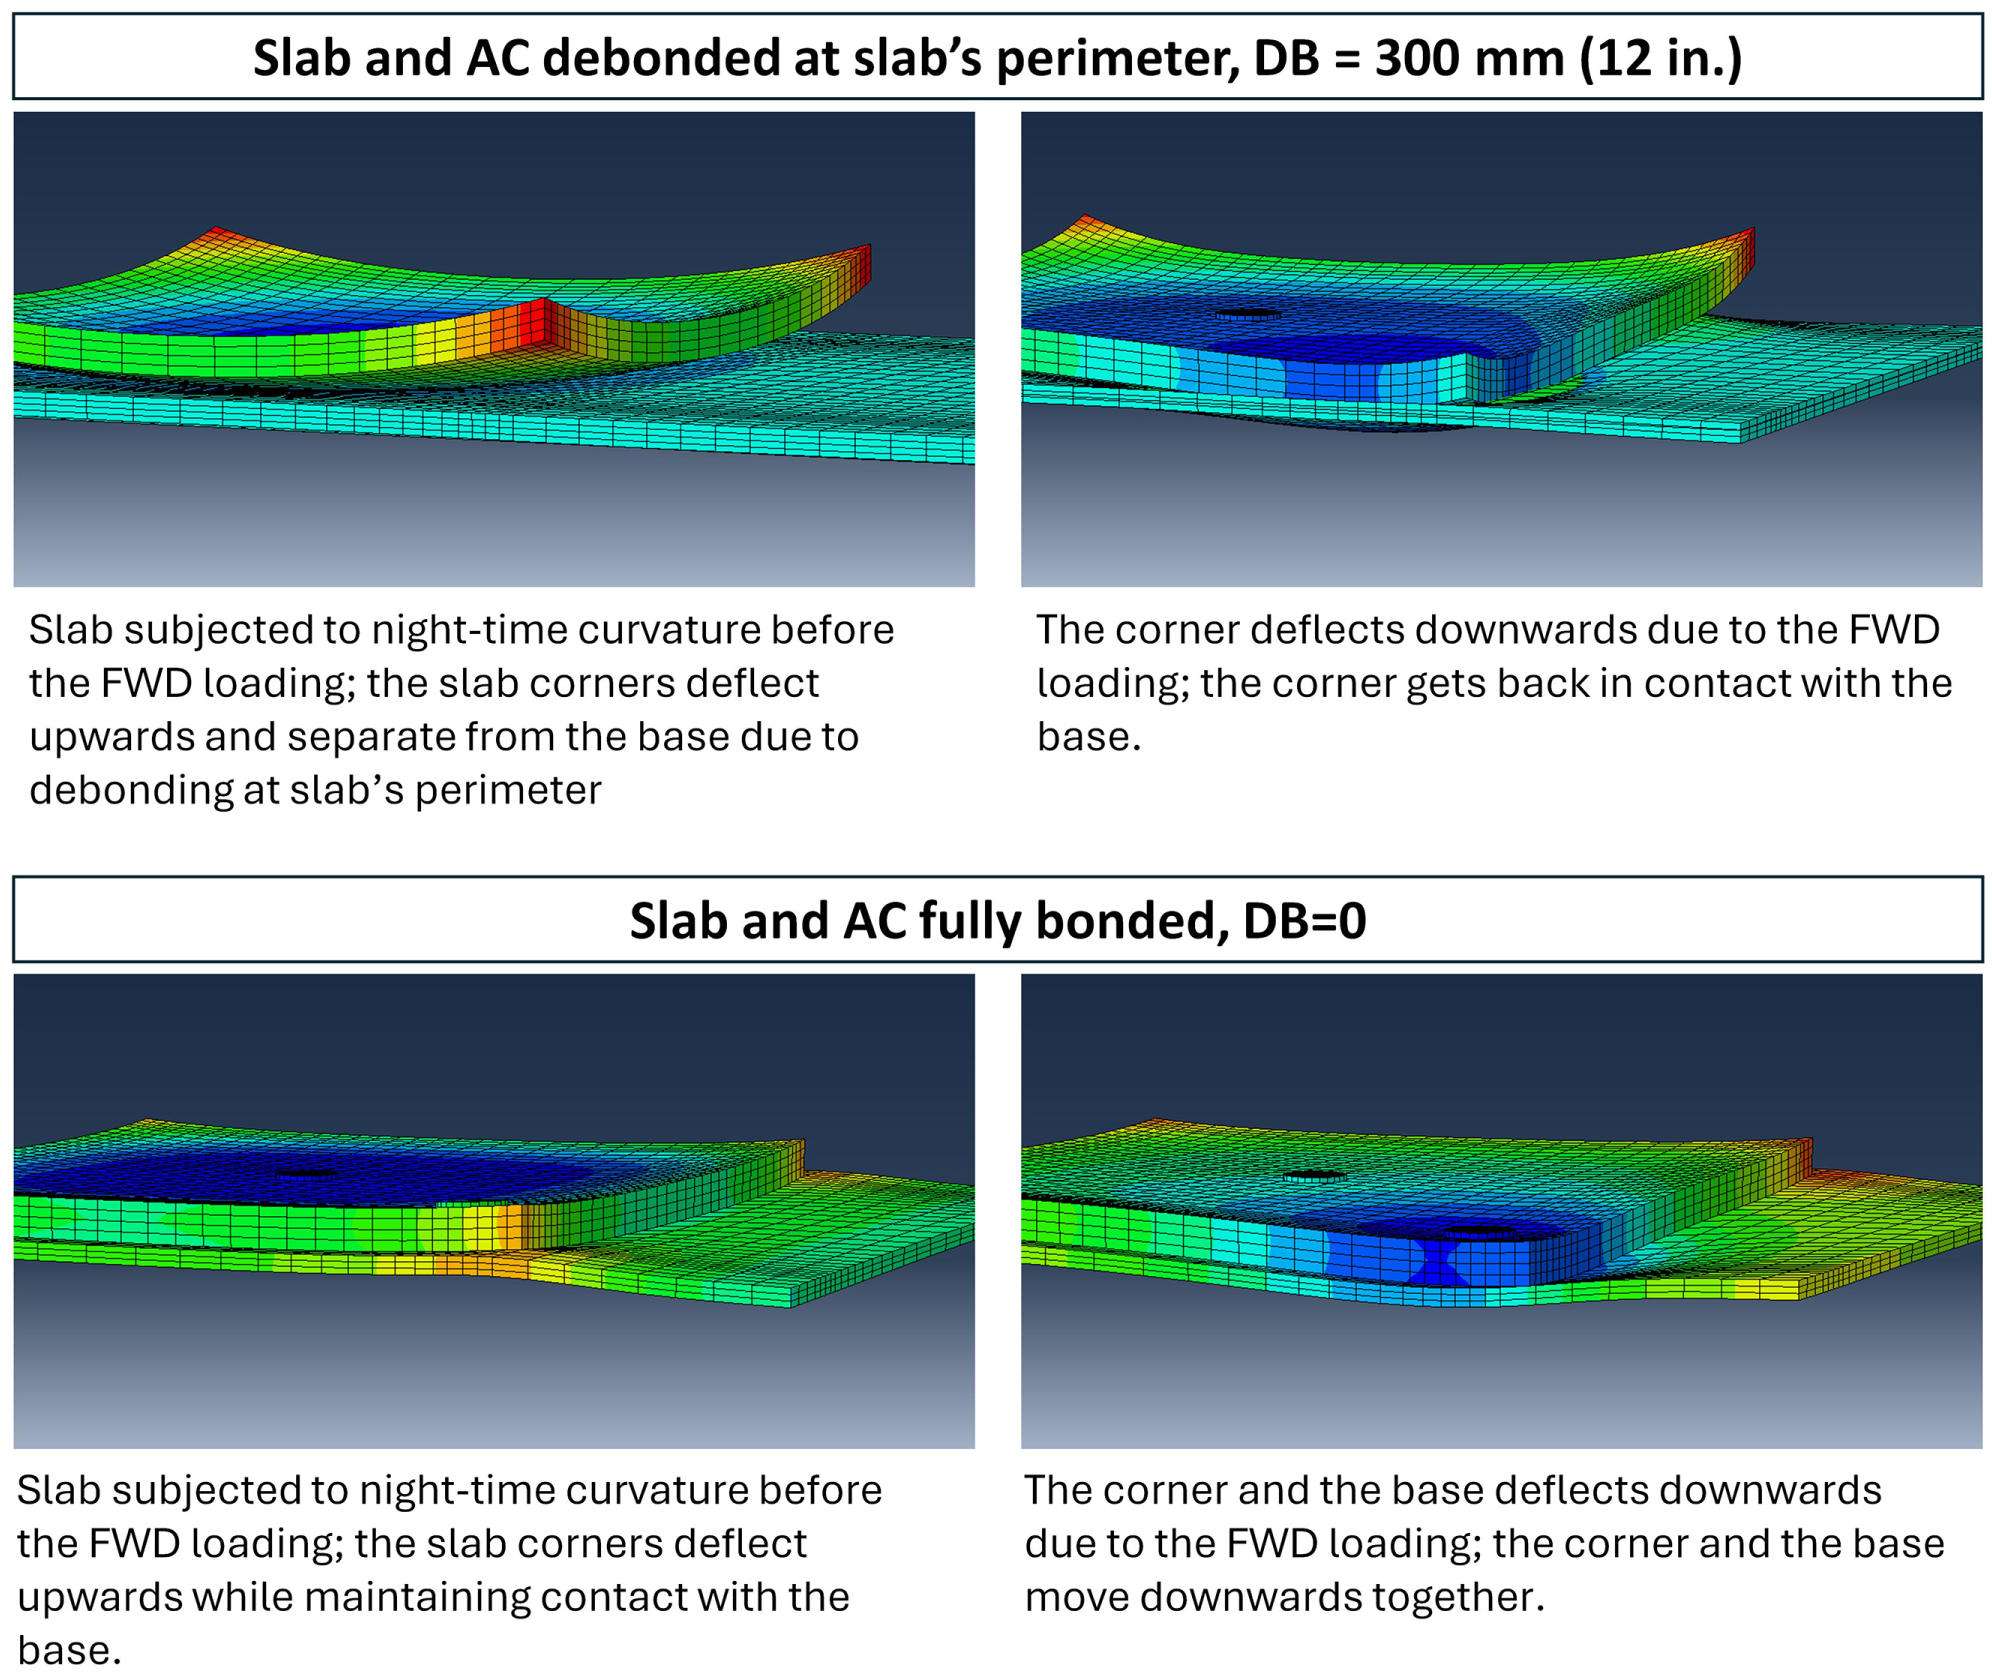
Finite element method modeling of falling weight deflectometer (FWD) loading on asphalt concrete (AC) section (corner loading; εDIFF = −150 µε; FWD load = 70 kN [15.7 kip]): (Top) Slab and AC are debonded and (Bottom) Slab and AC are bonded.
Model Results
Section LCB-Curing Compound (LCB-CC)
The comparison between FEM model prediction and measured deflection is shown in Figure 21 (series “FEM model”). For low slab curvature (ε DIFF ≈ 0) the model provides a reasonable prediction of the measured deflection. For high curvature (ε DIFF << 0), the model overpredicts the deflection measured at the corner. In other words, the model overestimates the impact that slab curling/warping has on the corner deflection. This outcome is not surprising, as past research shows that the effective curvature of the slabs, with effective curvature defined as the apparent curvature based on slab structural response under FWD loading, may be much smaller than the actual curvature (geometric, as measured with VWSG) ( 26 – 28 ). The difference can be attributed to dynamic effects (the slab response under FWD loading is a dynamic phenomenon while the FEM model is static), concrete creep (the effective stiffness of the concrete under the curling/warping action is much lower than the value determined in the laboratory and used in the FEM model), and base permanent deformation (the LCB may have some capacity to creep/deform and adapt to the slab deformation, a capacity that is not accounted for in the FEM model).
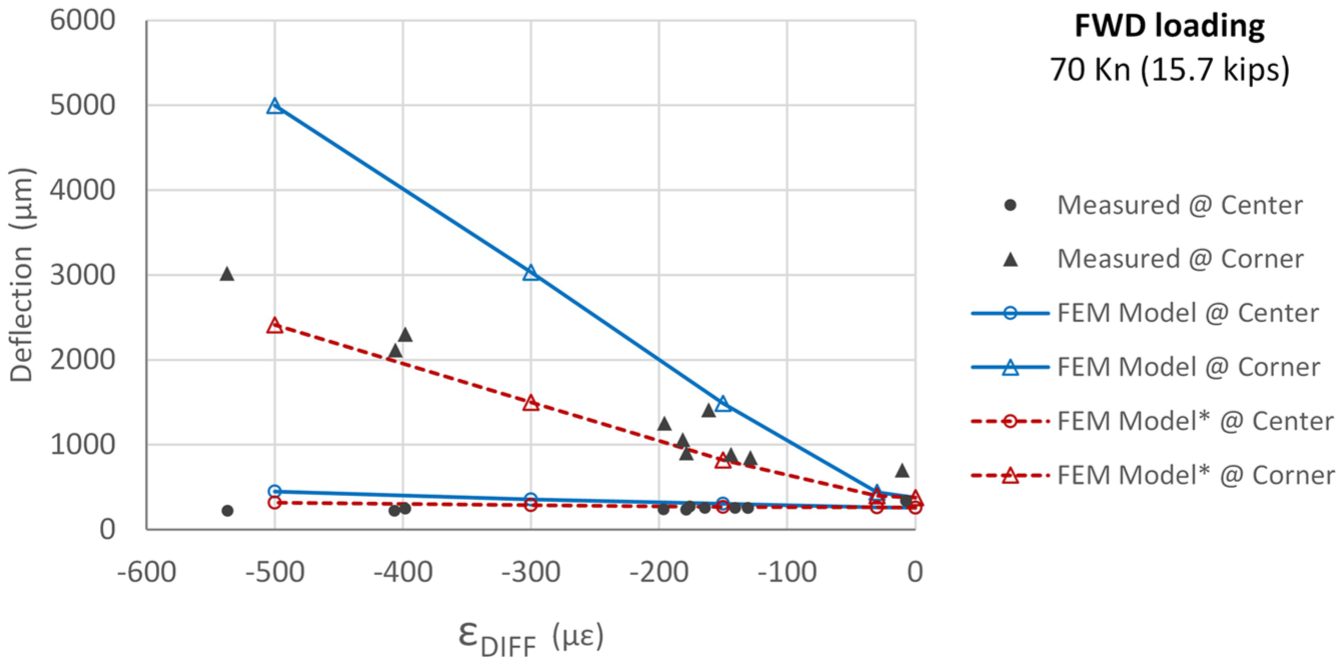
Finite element method (FEM) modeling results versus measured deflection, falling weight deflectometer (FWD) loading, at lean concrete base-curing compound (LCB-CC) section.
The curvature was modeled in Abaqus by applying a temperature difference (ΔTEQ = ε DIFF/CTE) between the top and bottom of the slab. The temperature difference is applied to the complete slab, the same at the center as in edges. This approach, standard in mechanistic-empirical modeling of concrete pavements, is referred to as “Constant ΔT” in this paper ( 9 ). A second approach for applying the curvature action in Abaqus was tried. In the second approach, the temperature difference for modeling varies linearly between the center of the slab, where it is assumed to be zero, and the corner, where it is assumed to be ΔTEQ (ε DIFF/CTE). The second approach is referred to as “Variable Linearly ΔT” in this paper and it can be regarded as a simplified way to consider dynamic effects, concrete creep, and base permanent deformation. The deflection predicted following the second approach, shown as series “FEM model*” in Figure 21, provides a very good prediction of the measured deflection at the center and corners across the whole curvature range. While the FEM model* is static, its predictions match the deflection measured under FWD loading, which is dynamic.
Section AC
Figure 22 shows the comparison between measured deflection and deflection predicted with the FEM model for different levels of slab-AC debonding, with DB varying from 0 to 600 mm (0 to 24 in.). The curvature was modeled in Abaqus following the Constant ΔT approach described above.
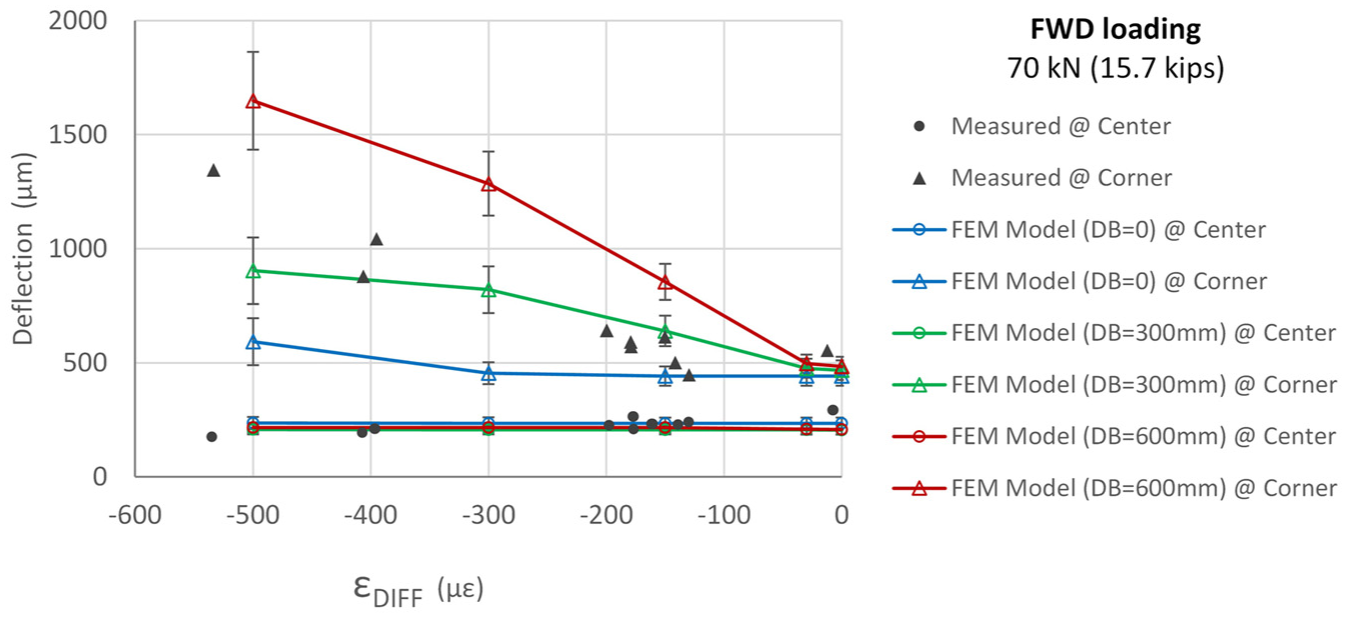
Finite element method (FEM) modeling results versus measured deflection, falling weight deflectometer (FWD) loading, asphalt concrete section.
As shown in Figure 22, the measured corner deflection increases as the slab curvature increases. This pattern of variation indicates some type of non-linearity, most likely because of debonding between the slab and the AC at the slab perimeter. Based on the FEM modeling, the debonding would affect the interface in a 300 to 600 mm (12 to 24 in.) band around the slab perimeter. Similar values were estimated following the Variable Linearly ΔT approach. Forensic evaluation will be conducted to verify the extent of the debonding.
Discussion of Results
The results of the monitoring of the test track and the FEM modeling are discussed below. The discussion is organized around the two questions that this research study was expected to answer.
Why does JPCP Perform Considerably Better with an AC Base than with an LCB?
The experiment data collected in this and other studies indicate that the JPCP slabs are seldom flat; they curl and warp because of temperature changes and drying shrinkage (Figures 13 and 14).
For the section with LCB and curing compound interlayer, the experiment data and FEM modeling indicate the following:
As the slab curls/warps, it loses support from the base, because the lean concrete is a rigid material with little capacity to creep/adapt.
Because of the lack of support from the base, the slab functions as a cantilever slab rather than as a slab supported by a multilayer structure.
The experiment data collected from the section with AC base indicate that the AC provides much better support to the slab than the LCB-CC. When the slab curvature was very high, in the summer evaluations, the corner deflection in the section with LCB-CC was up to three times larger than the corner deflection in the section with AC base. This outcome agrees with the worse cracking performance of JPCP with LCB compared with JPCP with AC base.
These outcomes support the hypothesis about JPCP-base interaction that was formulated at the beginning of this paper and depicted in Figure 2.
Can the Performance of JPCP with LCB be Improved by Using an Engineered Interlayer?
The slab corner deflection under the FWD loading considerably increased as the slab curvature increased, and the rate of increase strongly depended on the type of base and interlayer (Figure 17). The rate of increase was much higher in the slab with LCB-CC than in the slab with AC base. This outcome is attributed to the low capacity of the lean concrete to creep and adapt to the movements of the slab.
The geotextile did not improve, but diminished, the performance of the curing compound interlayer as the corner deflection slightly increased. This outcome confirms the initial expectation that the geotextile would not be able to provide the cushion effect required to prevent the rigid contact between the slabs and the LCB.
However, the microsurfacing interlayer considerably improved the performance of the curing compound interlayer. In fact, the corner deflection in the section with LCB-MIC was similar to the corner deflection in the section with AC base. This outcome indicates that a relatively thin interlayer, 5 mm (0.2 in.) thick, can provide the cushion effect required to prevent the rigid contact between the slab and the LCB.
This research is based on experiment data collected over approximately 1.5 years of service, which is a relatively short period compared with the typical lifespan of a concrete pavement. Evaluating the long-term performance of the microsurfacing interlayer in the field will require additional research.
Conclusions and Recommendations
Conclusions
The experiment data collected from the test track sections and the modeling confirm that the use of LCB-CC results in a rigid contact between slabs and base that is not desirable. Because of the rigid contact, the slabs lose the support from the base as they curl/warp as a result of temperature changes and drying shrinkage. Because of the loss of support, the traffic loading applied close to or at the joints produces considerable tensile stresses at the top of the slabs; these stresses may result in top-down cracking. This conclusion is particularly relevant to dry and warm climates such as most regions of California.
The AC base provided much better support to the slab than the LCB-CC, as the corner deflection under FWD loading was much smaller in the section with the former than with the latter. Both AC base and LCB-CC represent the standard practice for JPCP construction in California.
These outcomes support the experiment evidence that shows that JPCP performs considerably worse, in term of cracking, with LCB than with AC base.
The geotextile did not improve the performance of the curing compound interlayer, with regard to corner deflection under FWD loading. However, the microsurfacing interlayer did. Despite its small thickness, 5 mm (0.2 in.), the microsurfacing interlayer provided the cushion effect required to prevent the rigid contact between the slab and the LCB.
The cracking performance of JPCP with LCB and an appropriate engineered interlayer should match or improve the performance of JPCP with AC base.
Recommendations
It is recommended to continue using LCB for JPCP construction in California, provided that an engineered interlayer rather than a curing compound bond breaker is used.
It is recommended that the use of a slab-LCB-MIC be evaluated in a pilot project before including the microsurfacing as an alternative in Caltrans construction practice.
Further research is needed to develop a methodology for testing slab-base interlayers, including microsurfacing, in the laboratory.
Footnotes
Acknowledgements
This paper describes research activities that were requested and sponsored by the California Department of Transportation (Caltrans). Caltrans sponsorship is gratefully acknowledged. The technical review by Caltrans, led by Deepak Maskey from the Office of Concrete Pavement, and oversight by Somayeh Mafi of the Division of Research, Innovation and System Information, is appreciated. The University of California Pavement Research Center acknowledges also the following individuals and organizations who contributed to the project: Teichert Aggregates (Pete Conlin), Vanguard Construction (Greg Bridges), VSS International (Rick Cross), CEMEX (Mark Hill), and UC Davis Transportation of Parking Services (Wayne Morris) for the support to the construction of the test sections; the Southwest Concrete Pavement Association (Charles Stuart) and Ergon Asphalt & Emulsions (Mo Rahman and Todd Vargason) for the advice in designing the experiment; the UCPRC laboratory and field staff; and UCPRC publications manager Camille Fink.
Author Contributions
The authors confirm contribution to the paper as follows: study conception and design: J. Harvey, A. Mateos, F. Paniagua; data collection: F. Paniagua, A. Mateos; analysis and interpretation of results: A. Mateos, M. Millan, F. Paniagua, S. Nassiri; draft manuscript preparation: A. Mateos, F. Paniagua, M. Millan. All authors reviewed the results and approved the final version of the manuscript.
Declaration of Conflicting Interests
The authors declared no potential conflicts of interest with respect to the research, authorship, and/or publication of this article.
Funding
The authors disclosed receipt of the following financial support for the research, authorship, and/or publication of this article: This paper describes research activities that were requested and sponsored by the California Department of Transportation (Caltrans).
ORCID iDs
The contents of this paper reflect the views of the authors and do not necessarily reflect the official views or policies of the State of California, or the Federal Highway Administration. This paper does not represent any standard or specification.