
Abstract
The concept of air voids (AV) continues to be used as the primary control parameter in the mix design of hot mix asphalt (HMA). AV are estimated from the bulk specific gravity and the maximum specific gravity. Their accurate estimation is very important, since samples for various tests are compacted to target AV, which are calculated on their basis. This study explored the impact of gradation and asphalt content on the AV, effective air voids (EAV), and apparent and maximum specific gravity of a fine- and a coarse-graded HMA. Samples were tested for bulk specific gravities, apparent and maximum specific gravities, rutting tolerance index, and cracking tolerance index. The results indicate that significant differences exist between AV measured by the different procedures and EAV, and that the differences are greater for a coarse-graded mix than for a fine-graded mix. Major sample-to-sample variations exist for the apparent specific gravity values, which could be significantly different from the generic maximum specific gravity values that are used for each mix. This has a significant impact on the estimation of AV and variability of test results. A strong correlation between the ratio of EAV and AV is presented. Based on the results of this study, and because EAV are strongly correlated to permeability and aging, it is recommended that the concept of EAV be considered in the regular mix design of coarse-graded HMA.
The mix design of hot mix asphalt (HMA) is a crucial step in the construction of good-performing and long-lasting pavements. Based on extensive research, several improvements to mix design have been suggested over the decades, and the relevant parameters have changed from only volumetric properties such as voids in total mix, air voids (AV), voids in mineral aggregate (VMA), and voids filled with asphalt to cracking and rutting performance indicators, as proposed in the balanced mix design (BMD) concept ( 1 – 3 ). Within the BMD framework itself, there are several variations, such as approaches 1–4, with increasing reliance on performance indicators and decreasing emphasis on volumetric properties ( 4 ).
The validation and implementation of BMD are in different phases across the U.S. In the meantime, several studies have confirmed the validity of different test methods that are part of the BMD framework and indicate the superiority of certain test methods over others ( 5 ). The overarching factors in the adoption of BMD, as for any other mix design system, are that the designed mix should be good-performing and economical, and should allow laydown and compaction with conventional equipment without any problem. Research is still ongoing on deciding whether BMD could be adopted and implemented as it is or if it needs modifications, how to incorporate specific factors such as the aging of mixes, and which test methods are more relevant.
In most cases, studies related to BMD have explored the effect of increasing the asphalt content to reduce the potential of cracking without compromising the rutting performance. Such an increase in asphalt content can lead to an increased density at the design level of compaction effort and may eventually facilitate compaction to achieve a higher in-place construction density as well. This is important, since a 1% increase in in-place density has been found to result in an increase of asphalt pavement life by 10% ( 6 ). An approach that is different from BMD, but with the same intent of improving the performance of mixes through enhanced field compaction, is Superpave5, where the mix is designed at a lower gyration level to a void level of 5% after increasing the design VMA by 1% ( 7 ).
Demonstration projects have reported higher in-place densities with Superpave5 mixes than with the conventional Superpave (Superpave4) mixes ( 8 ). This is expected to result in a lower potential of aging and, therefore, cracking in the Superpave5 mixes. Note that, although data from studies indicate an increase of 0.2%–0.4% in asphalt content for the Superpave 5 mixes, the increase in the VMA for the Superpave5 mixes is supposed to keep the effective binder content the same as that of the Superpave4 mixes. Obviously, the design asphalt content is dictated, among other things, by the gradation of the mixes.
In this respect, one relevant topic is the debate between conventional AV and effective air voids (EAV), or effective porosity, as found in the vacuum seal-open method ( 9 , 10 ). In this method a sample is vacuum sealed inside a bag and a density is calculated by using the vacuum sealed density of asphalt mix method (ASTM D6752, AASHTO T331) ( 22 ). The same sample while under water is opened and a second density is determined (ASTM D7063). Since the sample is under complete vacuum before opening the bag, this second density yields an apparent or maximum density of the compacted sample.
Several research reports have confirmed that the use of vacuum sealing method is a better approach over AASHTO T166 for the determination of voids in coarse-graded mixes, and that effective porosity, or EAV, is a better predictor of permeability than AV ( 11 – 14 , 21 ). Furthermore, effective porosity is an excellent predictor of interconnected AV, which have been conclusively proven to be a significant factor in the oxidative aging of HMA throughout the depth of the pavements, bottom-up fatigue cracking, and top-down cracking ( 15 – 19 ).
Against this backdrop, a relevant question is as follows: If fine- and coarse-graded mixes are compacted in the field to 5% AV with a lower and higher binder content, how are their EAV affected?
Methods of Estimation of Air Voids (AV) and Effective Porosity of Effective Air Voids (EAV)
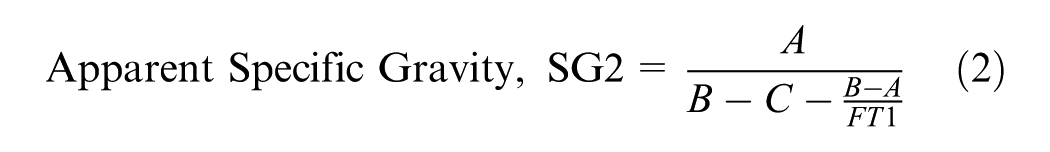
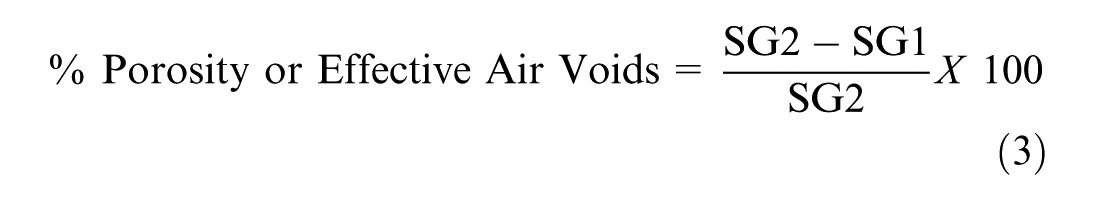
The effective porosity, or EAV, are determined by using a three-step process, through which the bulk and the apparent specific gravity of each sample are determined, and then used for its calculation, as shown in Equations 1–3 (D7063/D7063M-11).

where
A = dry sample weight before sealing (g),
B = bag weight (g),
E = sealed sample weight in water (g),
C = sample weight after cutting the bag (g),
FT = apparent specific gravity of the sealed plastic bag, and
FT1 = apparent specific gravity of the cut plastic bag.
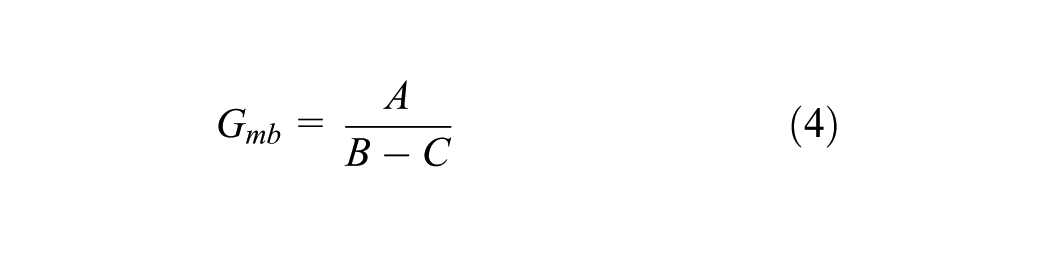
Whereas in the conventional procedure, one needs to run AASHTO T209 to obtain the theoretical maximum specific gravity or density (Gmm) and use it along with bulk specific gravity (Gmb) values obtained from the AASHTO T166 test (Equation 4) to calculate the voids (Equation 5), it is not needed if one uses the ASTM D7063 test ( 20 , 21 ).
where
A = mass of dry specimen in air (g),
B = mass of saturated surface dry (SSD) specimen in air (g), and
C = mass of the specimen in water (g).

where
Gmb = bulk specific gravity, and
Gmm = theoretical maximum specific gravity.
A third procedure, AASHTO T331, is used for samples of mixes that are expected to absorb more than 2% water ( 22 ). In this test, Gmb is determined by testing the samples under sealed conditions, as described in Equation 6.

where
Gmb = bulk specific gravity,
A = mass of the dry specimen in air (g),
B = mass of the bag in air (g),
C = final mass of the specimen after removal from the sealed bag (g),
E = mass of the sealed specimen under water (g), and
F = bag correction factor (apparent specific gravity) provided by the bag manufacturer.
Note that there is yet another procedure (AASHTO T275), which consists of testing paraffin-coated samples, which is not discussed here ( 23 ).
In methods that involve both T166 and T331, a standard Gmm (as specified in AASHTO T209) is employed to estimate the voids in each sample. This Gmm is derived from loose mixes that are not the same as those used for the particular compacted sample being analyzed. This generic Gmm is, in all probability, different from sample to sample because of expected materials and testing variability. Gmm is dependent on asphalt content and gradation, both of which are expected to vary from sample to sample. As a result, the voids that are calculated from the samples are inaccurate and do not represent the true AV of the compacted mix.
This factor is extremely important because, despite mixtures being designed to control AV in the laboratory and compacted to control AV in the field, there still exists considerable variation in the performance of mixtures ( 24 ). This is because AV content alone is not a completely effective predictor of performance across mixtures. Studies have shown that at the same AV content there is a high variability in permeability between different mixes which have different gradations and nominal maximum aggregate size (NMAS), because of the higher occurrence of interconnected voids in coarse/higher NMAS mixes. The connectivity of AV is affected significantly by the aggregate gradation; the coarser the mix, greater the potential for interconnected AV ( 25 ).
While the BMD approach is a logical step toward better testing, it has not resolved the issue of AV sensitivity, since the BMD tests are to be performed at specific AV content, which is again determined from conventional procedures. This is a serious drawback in the HMA mix design system since, to date, no routine testing procedure has been adopted for characterizing the EAV content of asphalt mixtures and, without this characterization, it is not possible to understand the true nature of the voids and their connectivity and therefore ensure good performance. This is because the samples that are used in BMD tests are selected on the basis of recommended AV. Considering three samples of the same mix, if the Gmm of the samples are different, then the AV are actually different also. Furthermore, for those tests that require aged samples (loose mix or compacted samples), the impact of aging will not be the same for the mixes with coarse and fine gradations and, therefore, the results of the BMD tests will not be comparable. Also, the variability in the absorption of asphalt into aggregates can cause variability in the Gmm values.
Objective
The objective of this study was to investigate the impact of change in gradation and asphalt content within a short range on the EAV in HMA. The mixes were selected and compacted to ensure similar AV and performance-related properties. The hypothesis is that mixes with similar laboratory properties can show a significant difference in porosity or EAV and, therefore, given the importance of porosity as discussed above, it should be considered as a design parameter in addition to AV.
Materials and Tests
Figure 1 shows the overall study plan. The gradations of the fine- and coarse-graded mixes are shown in Figure 2. The fine-graded mixes were compacted with 6% (design asphalt content at 5% AV with Ndesign, 125) and 6.3% asphalt contents, whereas the coarse-graded mixes were compacted at 5.7% (design asphalt content at 5% AV with Ndesign, 125) and 6% asphalt contents. The Ndesign of 125 was selected to produce samples with 5% voids for the selected gradations and asphalt contents. The 0.3% increase in asphalt content from the design content was selected because a 0.3% difference in asphalt content is known to cause an approximately 1% change in AV.
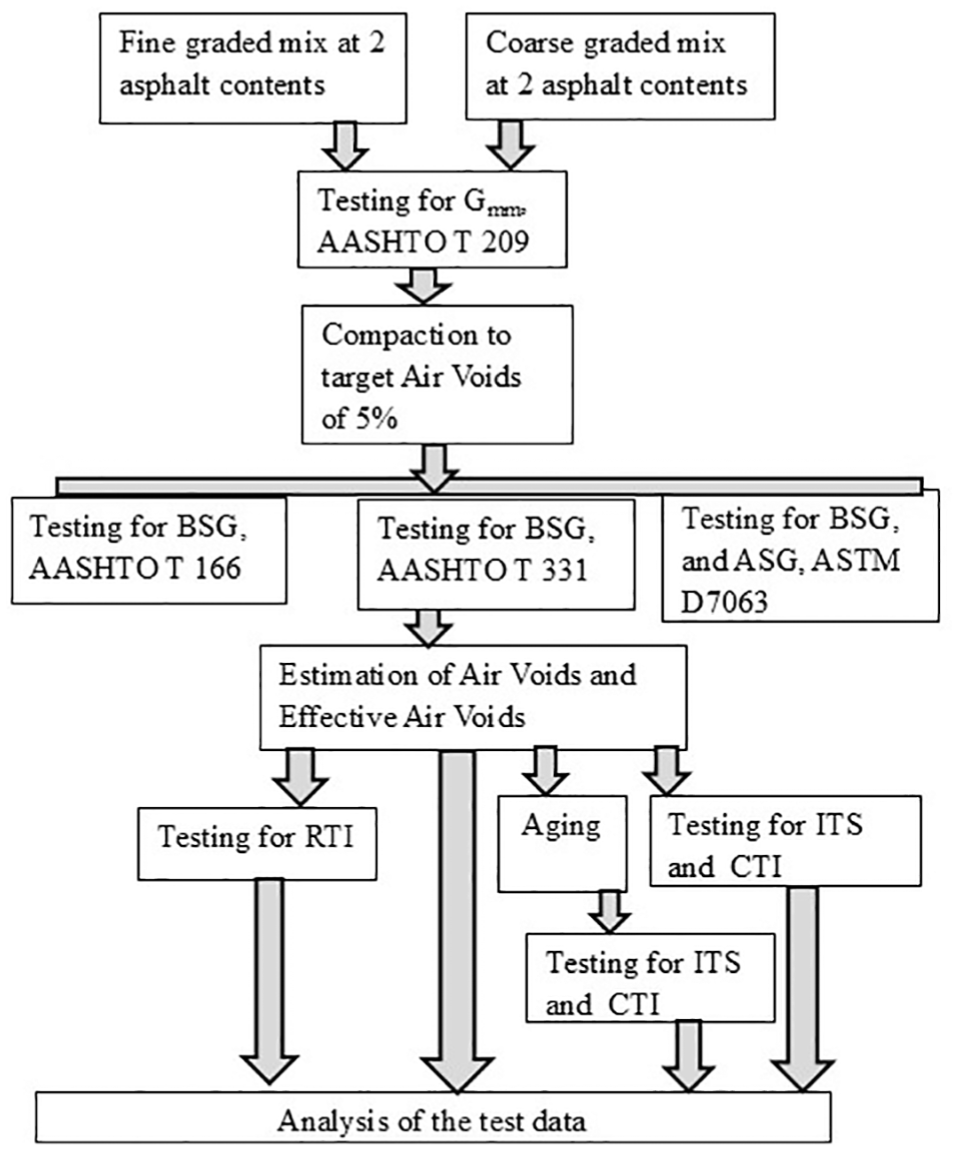
Flowchart of the study.
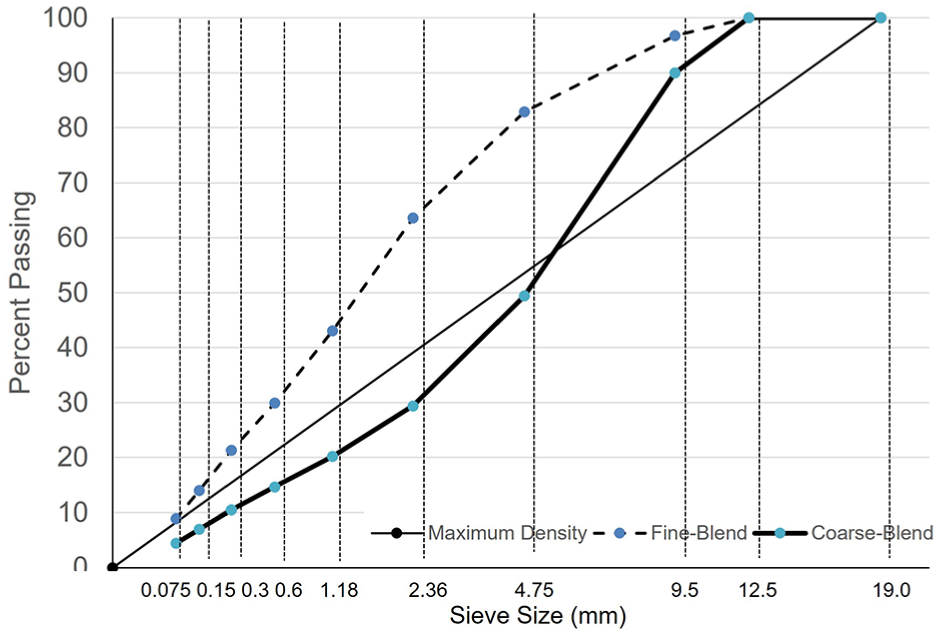
Gradations of the fine and coarse mixes (blends).
The compacted samples underwent testing for Gmb according to AASHTO T166 and AASHTO T331, while the loose mixes were evaluated for theoretical maximum specific gravity using AASHTO T209. Effective porosity values, also known as EAV, were determined using ASTM D7063. Samples were further tested for the rutting tolerance index (RTIndex) and cracking tolerance index (CTIndex) using test procedures ASTM D8360-22 and ASTM D8225-19, respectively. The aging of the samples was conducted using the AASHTO R30 procedure, where compacted samples are kept in an oven at 85°C for 5 days ( 26 ). The CTIndex test was conducted at 25°C (unaged and aged), while the RTIndex test was conducted at 50°C (unaged).
In this paper the following notations were used to define the different parameters:
▪ AV T166: AV calculated from the results of Gmb from AASHTO T166 and Gmm from AASHTO T209
▪ AV T331: AV calculated from the results of Gmb from AASHTO T331 and Gmm from AASHTO T209
▪ EAV: (same as porosity) calculated from the results of SG1 and SG2 from ASTM D7063-11
Results and Analysis
The results from the volumetric tests are presented first followed by the results of RTIndex and CTIndex tests. Variations, and relationships of voids and EAV and their implications are discussed.
The medians and ranges of the AV T166, AV T331, and EAV are shown in Figure 3. For the coarse-graded mixes, there is clearly a difference between the three parameters: the AV T166 values are the lowest, and the EAV values are the highest, with the AV T331 values in between. This difference is not that prominent for the fine mixes. This observation indicates that a major part of the water-accessible AV (effective voids) is not detected by T166 and T331, especially in the coarse-graded mixes. The second inference is that the T166 and T331 tests can detect the voids to different extents, and this difference is greater in the case of coarse mixes than fine mixes. Finally, there is a relatively greater variation in the AV T331, more so in the fine mixes than in the coarse mixes.
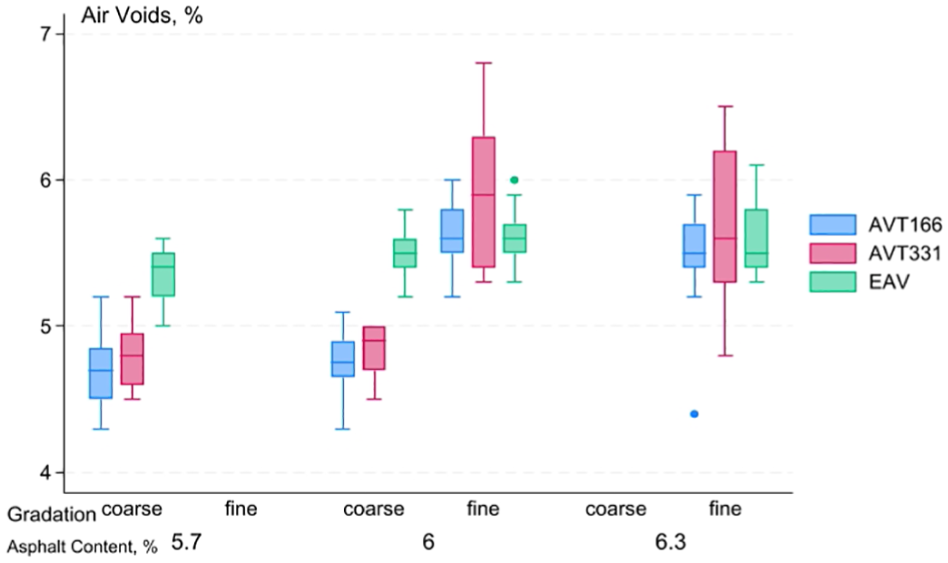
Median and range of voids for the different mixes.
Figure 4 shows the EAV versus AV T166 and AV T331 values on plots with lines of equality. For the AV T166 data, although the points do not fall on the line of equality, the voids for the fine mixes, regardless of the asphalt content, are evenly distributed around the line of equality. For the coarse mixes, those with a lower asphalt content are closer to the line of equality than those with a higher asphalt content. For the AV T331 data, a greater number of fine mixes show higher voids than EAV, and the majority of the coarse mixes have higher EAV than voids. There are few observations from both fine and coarse mixes which lie on the line of equality. The observations of the voids exceeding EAV aligned with expectations, as the volume of water-permeable voids should, theoretically, be less than the total AV volume in a compacted sample. Therefore, the indication is that both T166 and T331 are underestimating the total amount of AV, and the EAV is closer to the total AV than either one of the T166 and T331 voids.
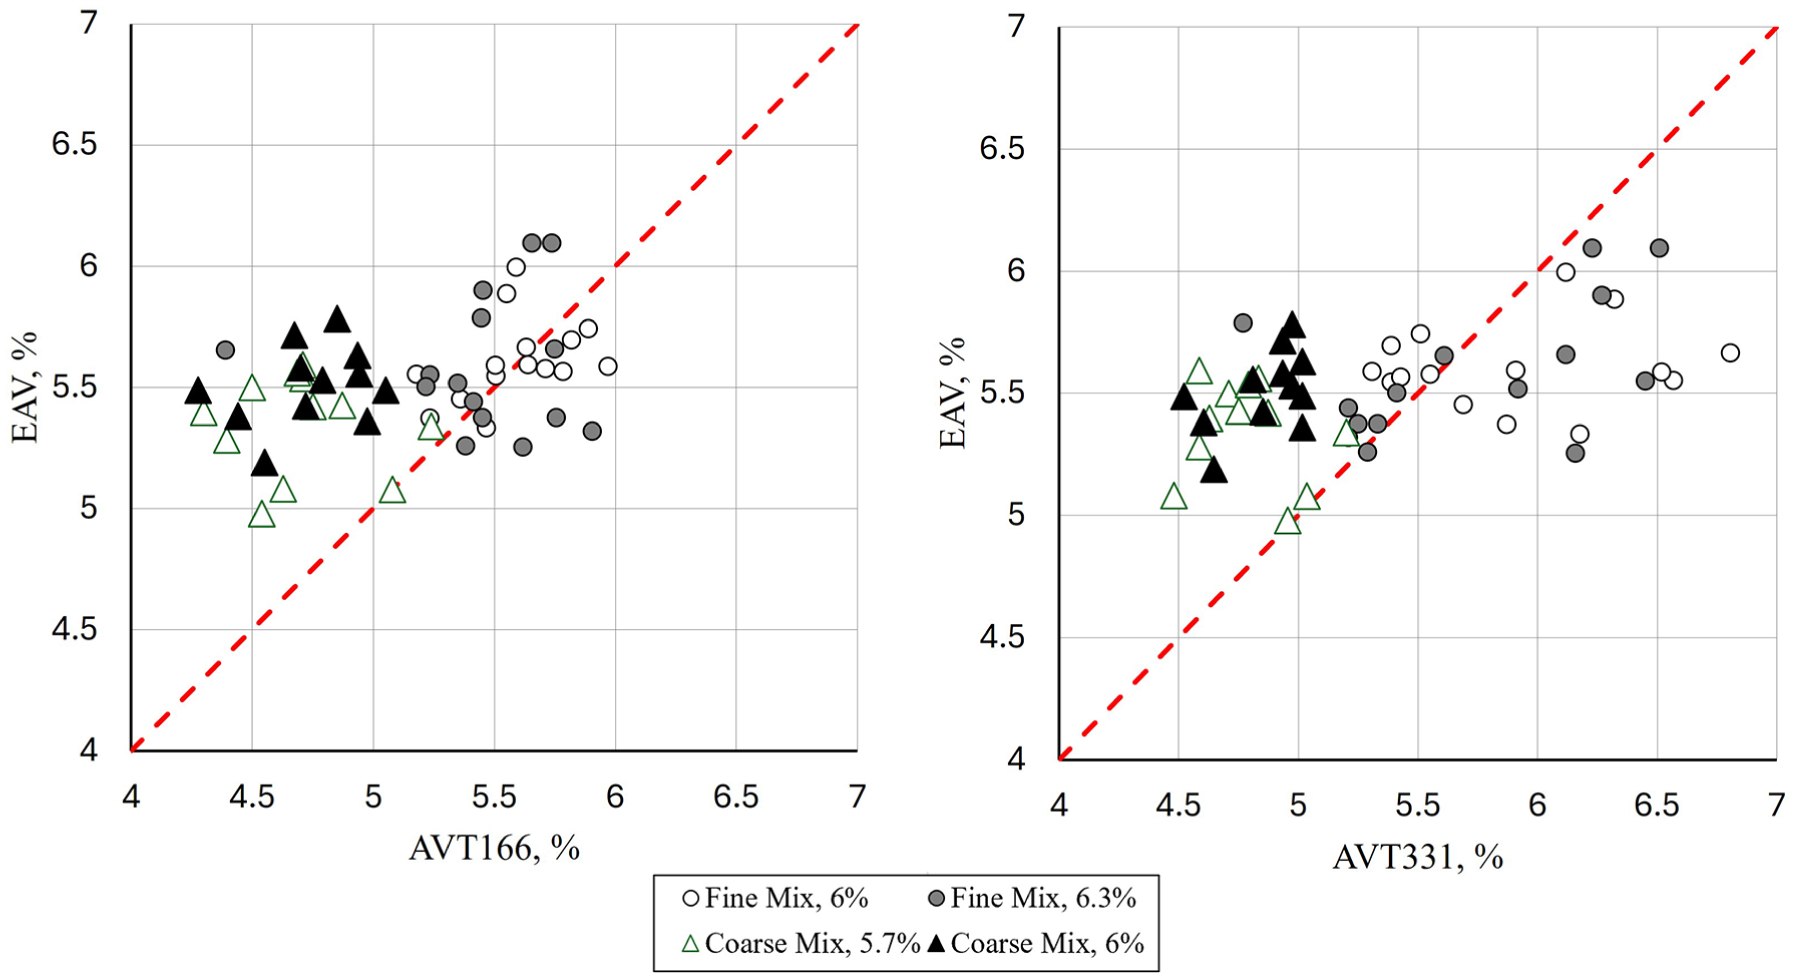
Plots of effective air voids (EAV) versus AASHTO air voids test (AVT) 166 (left) and AVT331 (right).
The medians and ranges of (EAV/AV T166) and (EAV/AV T331) are shown in Figure 5. The ratio of EAV/voids is always greater for AV T166 than AV T331, more so for the coarse mixes. This confirms that T331 gives a relatively more complete indication of the total AV than the T166 test, specifically for the coarse mixes. This also indicates that the measurement of voids in coarse mixes with AASHTO T166 underestimates the amount of AV in HMA. Figure 6 shows the results of the analysis of variance (ANOVA) of these ratios with fine and coarse mixes (category) as the independent variables. The upper part of the results shows the difference of EAV/AV T166, and the lower part shows the difference of EAV/AV T331 between the fine and the coarse gradations. The ANOVA results show that there is a significant difference between the EAV/AV T166 and EAV/AV T331 for fine and coarse mixes. The inference is that the effectiveness of T166 and T331 for detecting AV is significantly affected by the gradation of the mix. This is because the voids measured by T331 are closer to those measured by D7063 than those measured by T166.
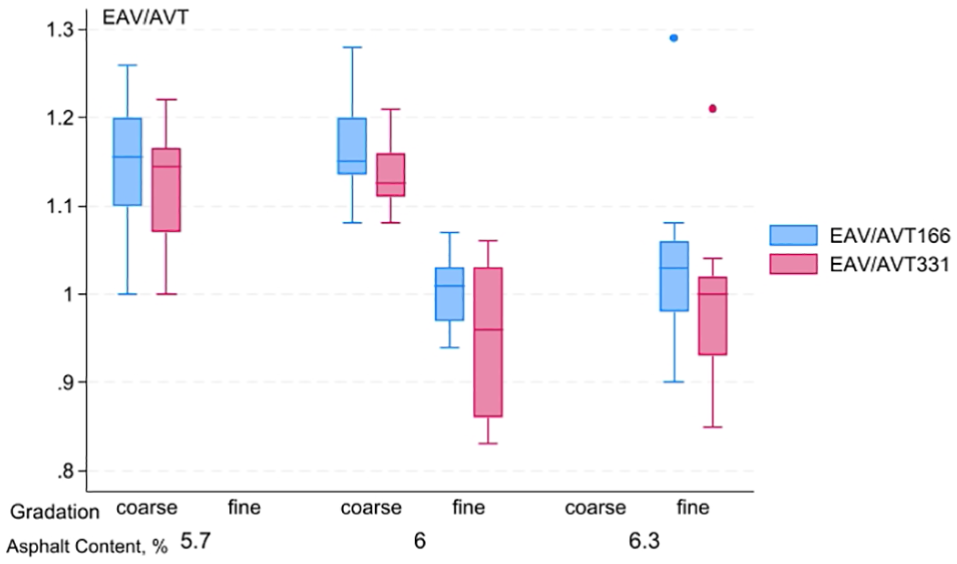
Ranges of effective air voids (EAV)/air voids (AV) for the different mixes.
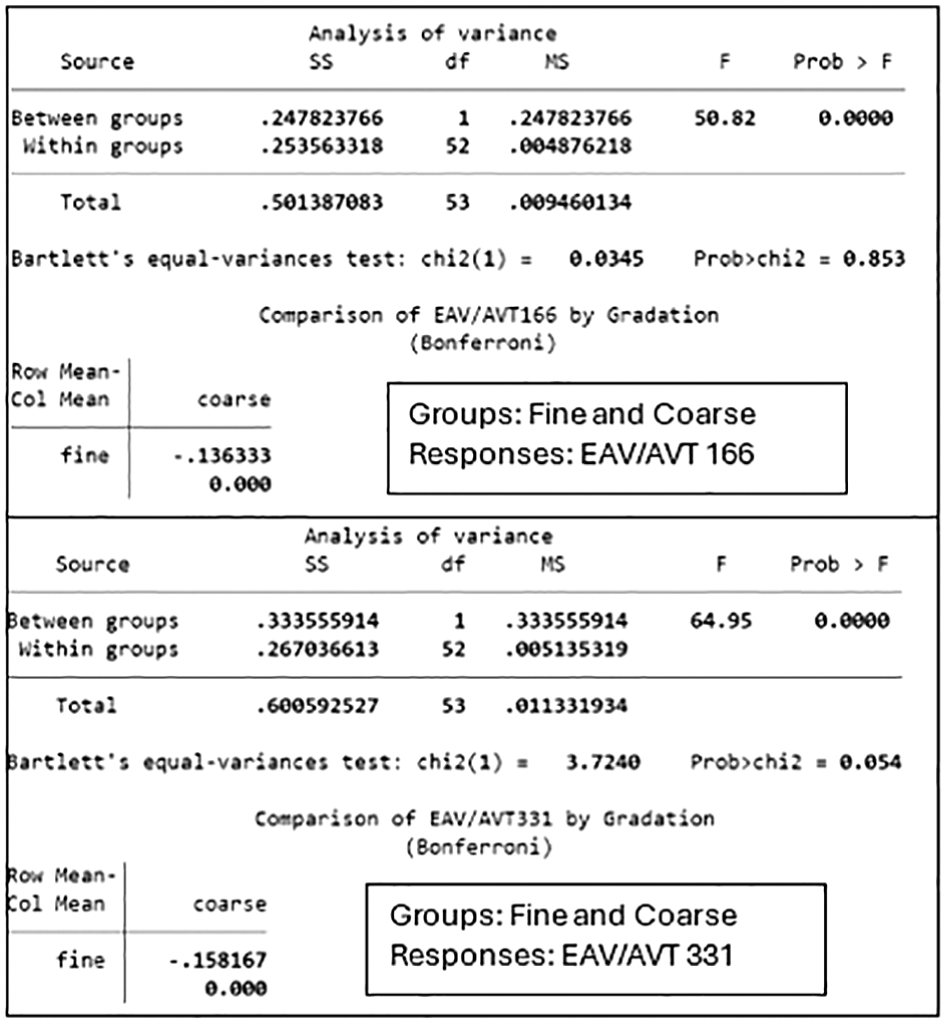
Results of analysis of variance (ANOVA) of effective air voids (EAV) versus AASHTO air voids test (AVT) 166 (top) and AVT331 (bottom).
Ideally, AV should be inclusive of the EAV (as measured by the D7063 method). Since it has been shown that EAV is higher than the AV, in many cases, it will be of interest to see whether the EAV/AV ratio is affected by the AV itself and the type of testing, regardless of the gradation of the mix. It is worth mentioning here that EAV is a measure of the accessible AV, whereas both AASHTO T166 and AASHTO T331 are supposed to measure the total AV, both water accessible and not water accessible. Figure 7 shows plots and regression of EAV/AV against both AV T166 and AV T331. If the data from fine and coarse mixes are pooled, good correlations could be obtained between the ratio of EAV/AV and the AV, for both T166 and T331 test results. AV T331 values show a slightly better correlation than AV T166 values. Both best-fit lines cross the EAV/AV = 1 line around 5.6% voids. The findings suggest that, when AV are below 5.6%, the T166 and T331 tests tend to underestimate the total AV volume.
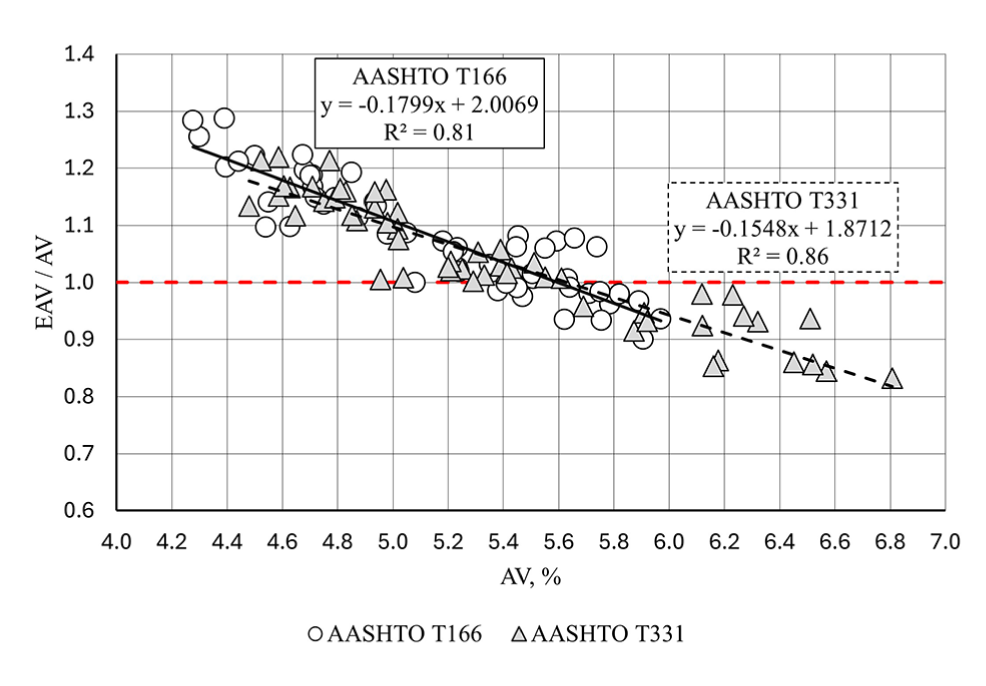
Regression of effective air voids (EAV)/air voids (AV) over AV.
For the AV T166 data, most of the results from this study fall above the ratio of 1, while for the AV T331 data, a considerable portion of the results are below this ratio. This is because about 13% of the AV T166 voids exceed 5.7% while 43% of the AV T331 voids exceed 5.7%, although the target compaction void (AV T166) was 5%. The implication is that compaction to the target AV T166 void levels during mix design would most likely result in samples that have significantly higher amounts of voids than the target.
The plots of VMA calculated from Gmb from AASHTO T166 and AASHTO T331, and ρ1 from ASTM D7063 are plotted with the line of equality in Figure 8. The difference between AV T166 and AV T331 is because of differences in the corresponding Gmb values, since the same Gmm values have been used in both cases. The use of T331 results in a slight increase in the VMA, specifically for the coarse-graded mixes, compared with the T166 results. The use of ρ1 from ASTM D7063, on the other hand, causes a significant increase in the VMA values for the coarse-graded mixes.
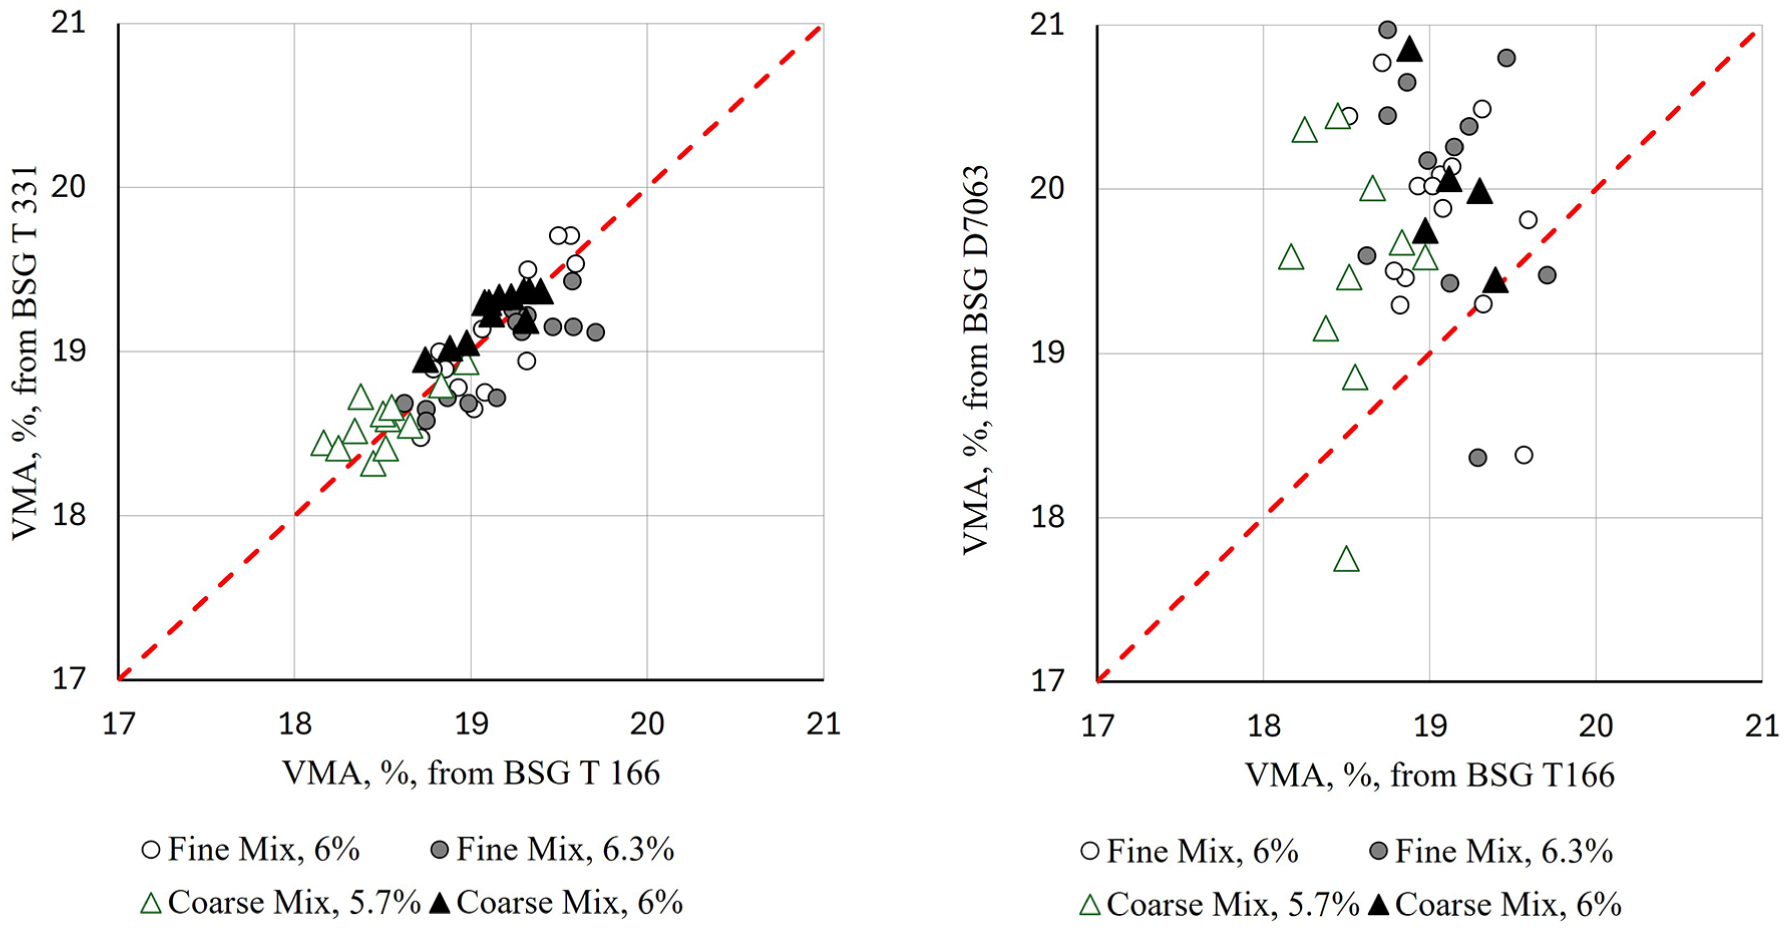
Comparison of voids in mineral aggregate (VMA) values calculated from bulk specific gravity (BSG) of AASHTO T166/T331 (left) and AASHTO T166/ASTM D7063 (right).
Figure 9 shows the average and variations (sample to sample) of SG2 (which serves as the “maximum specific gravity” in ASTM D7063) along with the generic Gmm values for the different mixes. The SG2 (ASTM D7063) is determined for every compacted sample and used to calculate the EAV, whereas Gmm is obtained from loose-mix samples, and then applied for all samples to determine the AV.
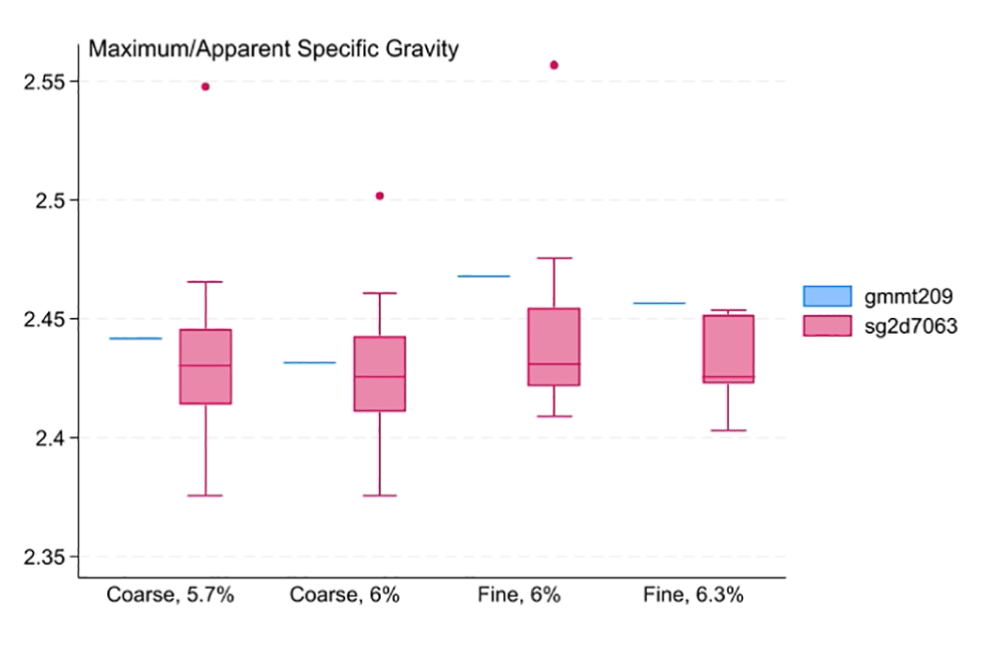
Comparison of maximum specific gravity values from AASHTO T209 (loose samples, gmmt209) and ASTM D7063 (sg2d7063).
The primary inferences that could be made from their comparison in Figure 8 are that there is a wide range in SG2 values, the average values of which may (coarse, 6%) or may not match with the corresponding Gmm values (the rest of the mixes) and that there is a wider range of SG2 values for the coarse mixes than for those from the fine mixes. These inferences lead to a questioning of the validity of the current practice of using a generic Gmm and BSG to calculate AV of multiple compacted samples. Note that Gmm is affected by the asphalt content and the gradation, and these factors will differ from sample to sample. The results presented here stem from a laboratory study; however, this issue could be even more pronounced with field samples, such as quality control (QC) samples collected during construction. In such cases, greater variability between samples and, consequently, higher variability in Gmm are anticipated. Of course, this problem is avoided if states require the testing of Gmm of every sample that is tested for Gmb for QC purposes.
Figure 10 shows the results of RTIndex tests. No statistical difference was found between either two different asphalt contents or two different gradations. The variation in the RTIndex is much higher for the coarse mixes than the fine mixes. A higher variation is also shown by the EAV values, although not to the same extent as those by the AV T166 values (see Table 1). Since rutting potential is known to be significantly affected by AV, the inference is that higher variabilities of performance test results of coarse-graded mixes are expected because of higher variabilities in true AV content, which is not detected accurately by the T166 test. Samples of the same mix with similar AV should exhibit similar RTIndex. The standard deviation of the RTIndex of the fine-graded mixes ranged between 18.7 and 24.3, whereas, for the coarse-graded mixes, the range is 31.5 to 38.1. It can be seen that, for a similar range of voids as measured by T166, the range in RTIndex is much larger for the coarse-graded mixes than for the fine-graded mixes. This anomaly is because the measured AV do not represent the true AV in the coarse-graded mixes; the true AV range is much greater, as exhibited by the EAV values.
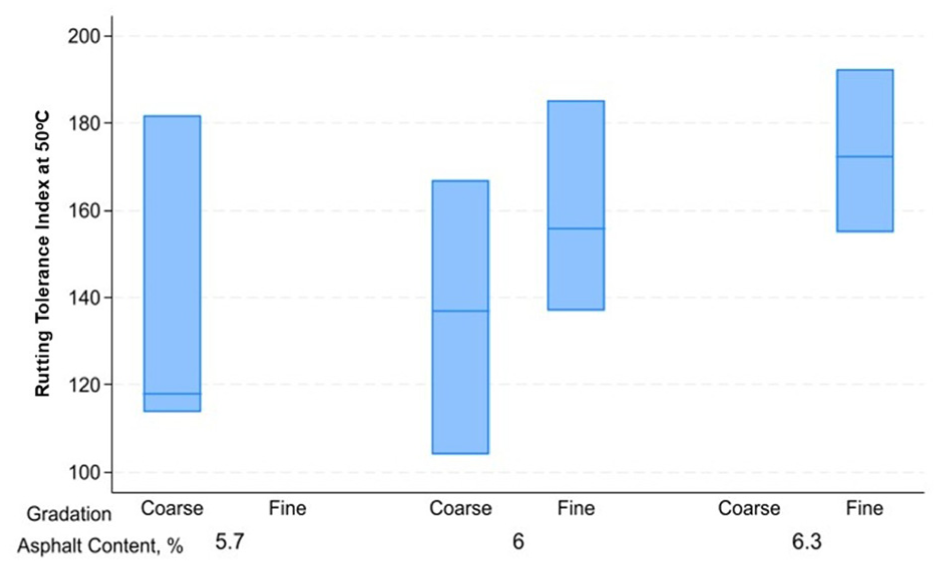
Comparison of rutting tolerance index (at 50°C) values.
Voids, Rutting Tolerance Index (RTIndex), and Cracking Tolerance Index (CTIndex)
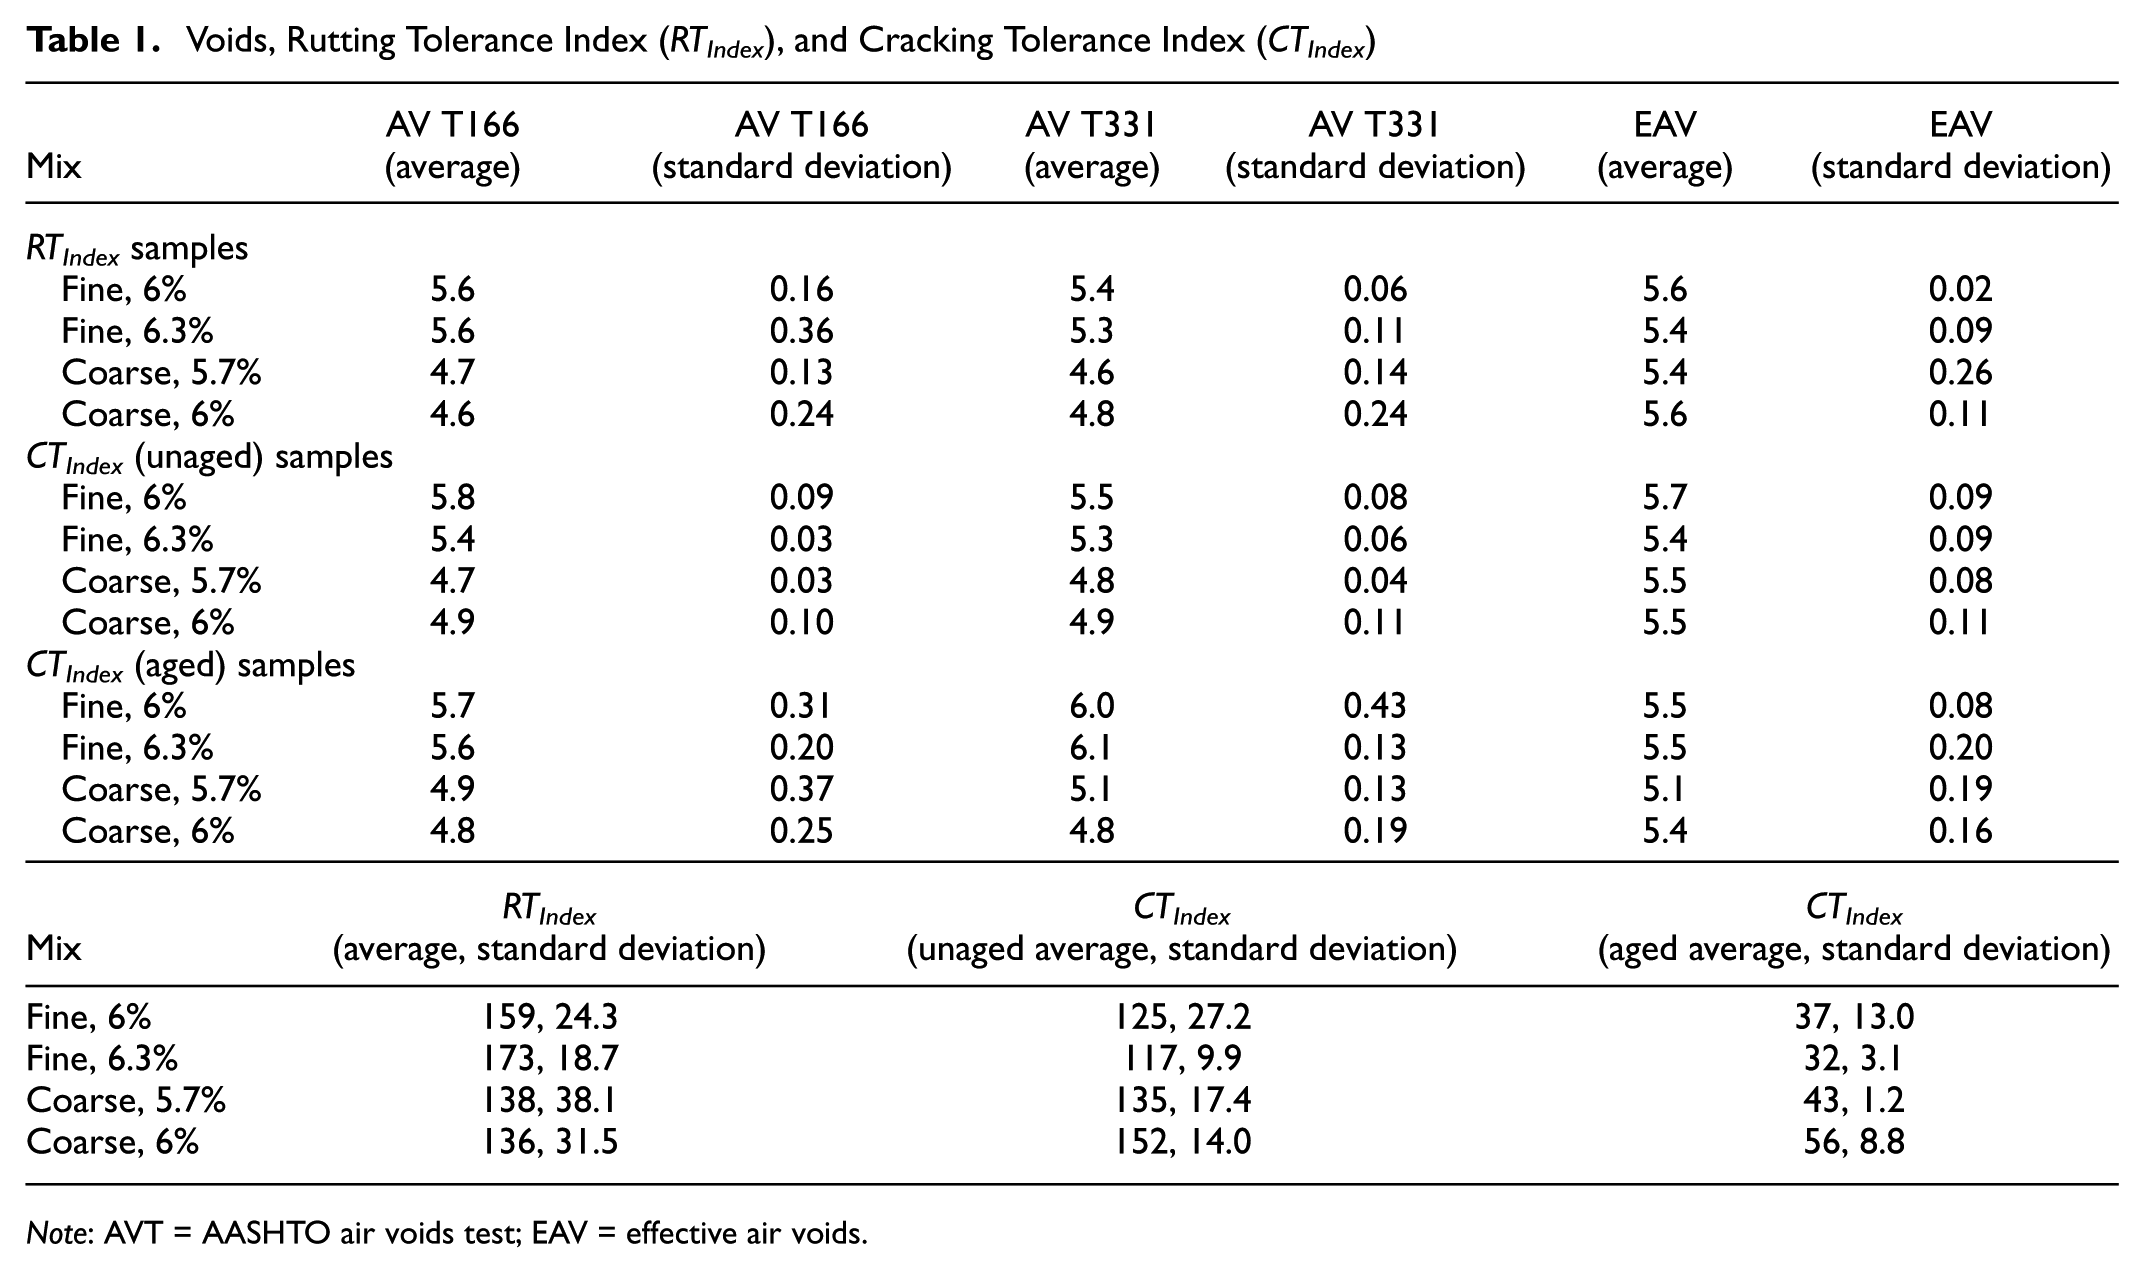
Note: AVT = AASHTO air voids test; EAV = effective air voids.
Figure 11 shows the CTIndex and indirect tensile strength (ITS) values for unaged and aged samples. The values for the aged samples are lower than those of the unaged samples for both fine and coarse mixes (see ANOVA results in Figure 12). The ANOVA results show that there is a statistical difference between the CTIndex of the unaged and the aged samples for each mix and asphalt content, no difference between the aged samples of the same mix with different asphalt contents, and no difference between the aged samples of the fine- and coarse-graded mixes at the same asphalt content (6%).
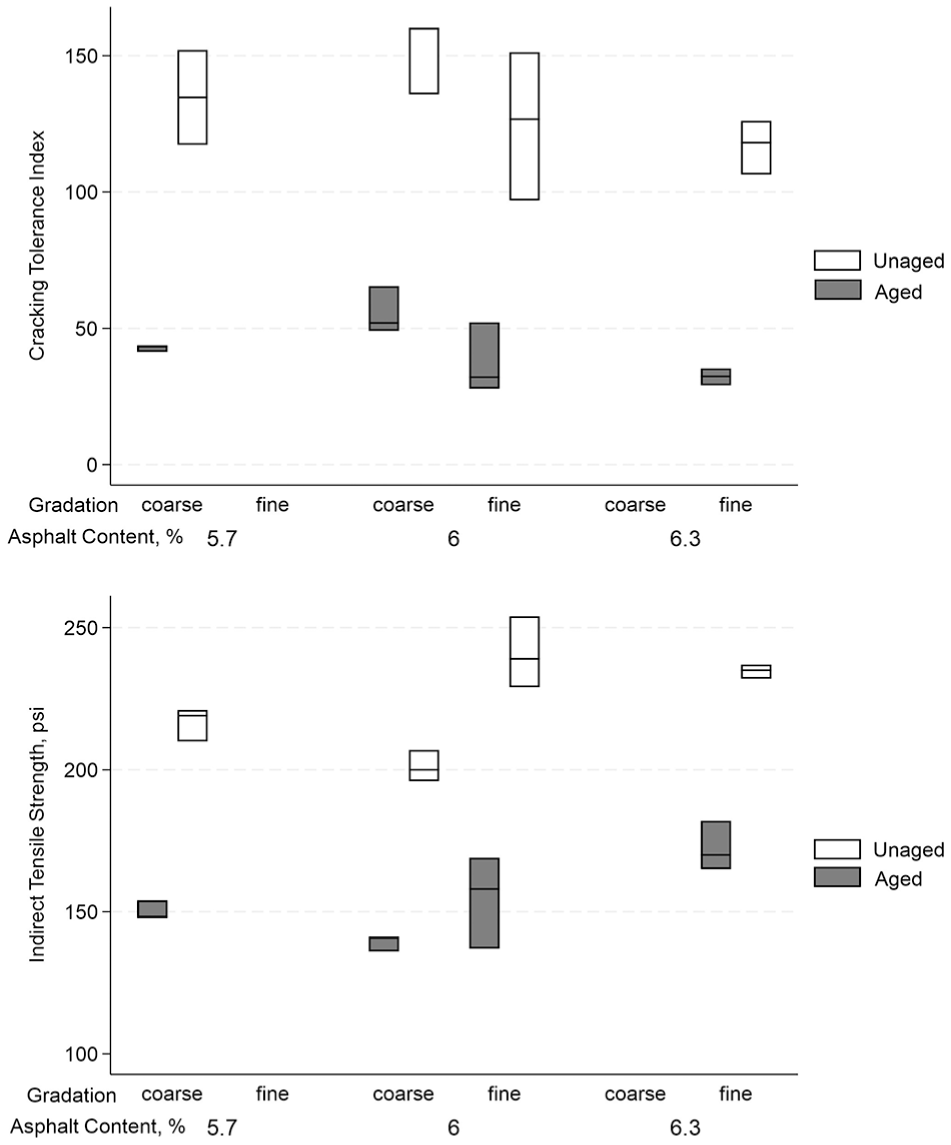
Comparison of cracking tolerance index (top) and indirect tensile strength (bottom).
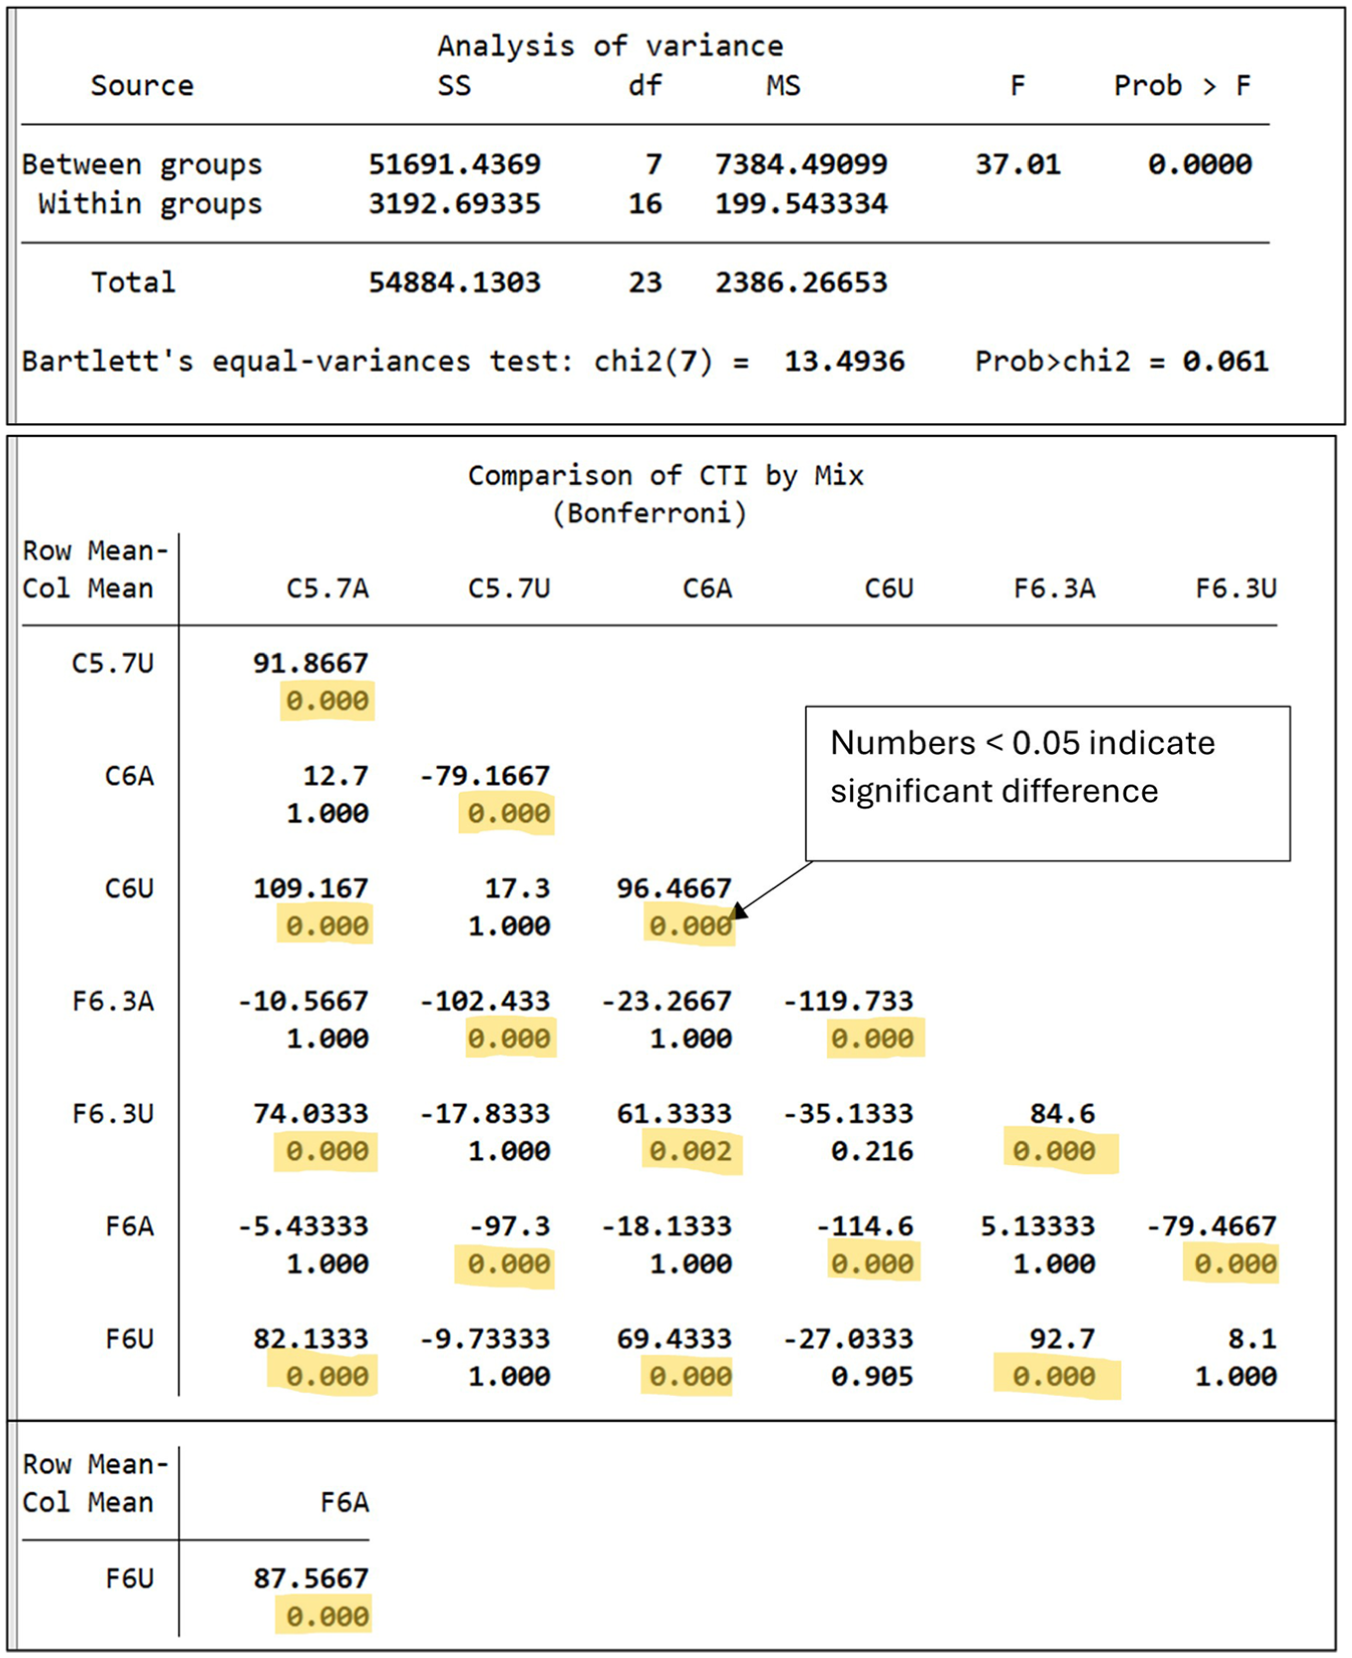
Analysis of variance (ANOVA) for cracking tolerance index (CTI) values (top) and comparisons (bottom).
Comparisons of changes in CTIndex and ITS between unaged and aged conditions, along with the sample voids, are presented in Figure 13. Note that the voids are averages of the voids of the unaged and aged samples (which did not differ significantly) for each mix. For the fine mix, the changes in CTIndex and ITS are smaller in the mix with higher asphalt content, which is anticipated. In these mixes, the EAV of the mixes with higher asphalt content are less than that of the mixes with lower asphalt content. In the case of the coarse mixes, the change in CTIndex is not less, but slightly greater, for the higher asphalt content. This outcome is contrary to expectations; one possible explanation might be that the relatively high EAV in the mix with greater asphalt content (for the coarse mix) has allowed more ingress of air, leading to accelerated aging. The inference is that the advantage of using a higher asphalt content to improve durability can be offset by a higher EAV content, especially in coarse mixes.
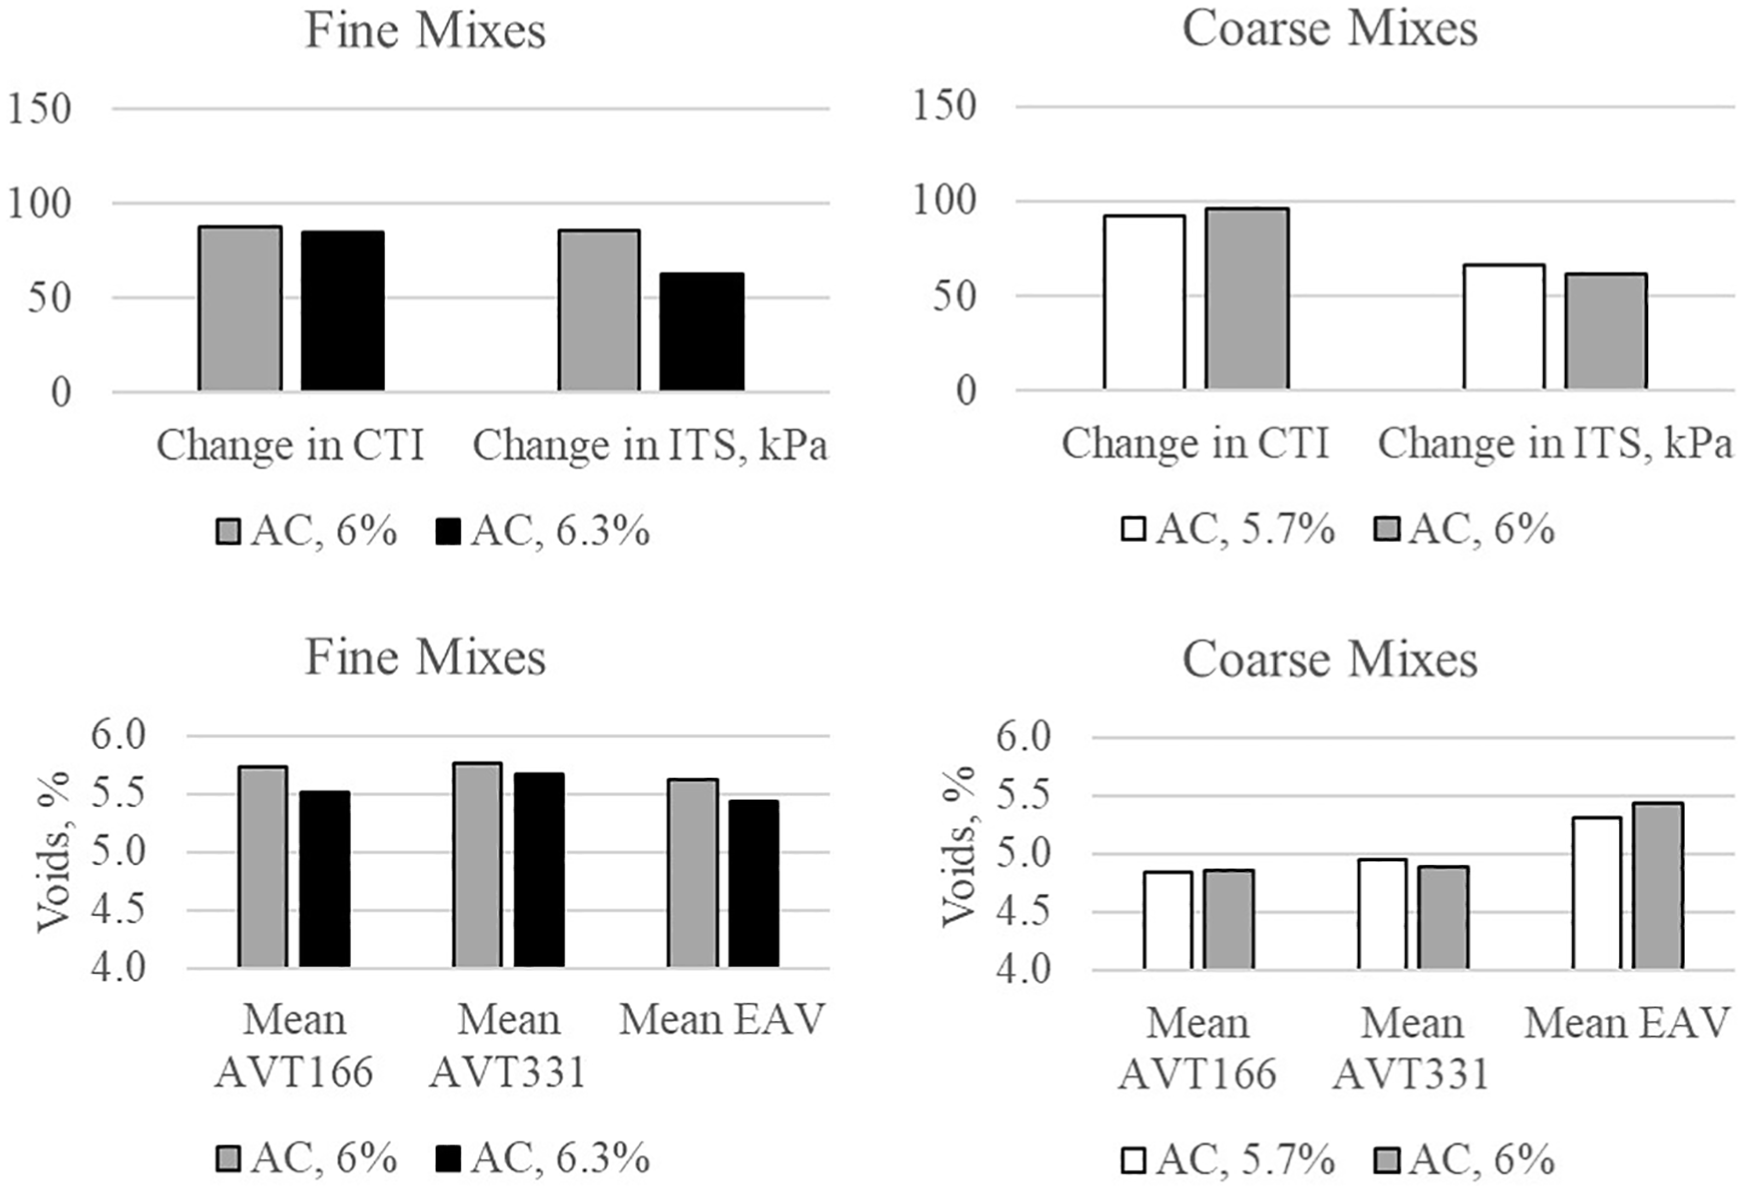
Summary of changes in cracking tolerance index (CTIndex) and indirect tensile strength (ITS), with average voids of the samples: (Top left) Change in CTIndex between unaged and aged samples; (Top right) Change in ITS between unaged and aged samples; (Bottom left) Average air voids of unaged and aged samples; and (Bottom right) Comparison of CTIndex and ITS changes relative to average voids.
Use of Effective Air Voids (EAV) and its Implications
The use of EAV is suggested for the mix design and QC of coarse-graded mixes. The reason is that while, ideally, AV should be greater than EAV, in the case of coarse-graded mixes, the AASHTO T166 AV are actually found to be less than EAV (up to a certain void level), which means that the immersion of the samples in the AASHTO T166 method is simply not adequate to drive the water into the interconnections between the voids, especially small/narrow voids (which could be more prevalent in coarse-graded mixes) and, therefore, results in underestimation of the voids. The EAV, in such mixes, are better representative of the “true air void” because the vacuum/pressure is able to draw the water into the interconnected voids. In the real world, pressure-driving of water into the voids is likely to occur in saturated pavements that are subjected to traffic loading.
Using EAV for coarse-graded mixes will have implications for testing and volumetric properties criteria. Since most state and industry laboratories have vacuum sealing equipment, using EAV for coarse-graded mixes is not expected to result in a major increase in the testing burden.
Concerning the volumetric properties, the mix designer can select a good combination of gradation and asphalt content to ensure that the EAV are at the desired content. For example, consider the case of a coarse-graded mix, in which the T166 AV at 5.5% asphalt content is found to be 4.0%, and the D7063 EAV are found to be 5.1% (from the T166 equation in Figure 6). If the target AV are 4%, then the gradation and/or the asphalt content (increase, more likely) need to be changed to decrease the EAV to 4.0%. The implications could be different for field QC, and steps are needed to ensure adequate density in the field through changes in mix design and/or field compaction and/or specification changes, which could be determined from an experiment involving mix design and field construction with the use of two parallel studies—one using the AASHTO T166 and the other using the EAV criteria.
Note that the use of the vacuum sealing method for coarse-graded mixes has been long recommended by the Federal Highway Administration (in a 2010 publication), because of the inaccuracy of the SSD weight in T166 (with coarse mixes), in which the water readily came out of the larger voids, resulting in lower-than-actual SSD weight and higher bulk density/lower AV ( 11 ). What this study suggests, additionally, is the use of ρ2 (density after opening the seal under water), to get the apparent or maximum density of every sample and avoid the T209 procedure. The two parameters, ρ1 and ρ2, from the same test on a compacted HMA sample, will yield all the information that is needed for that specific sample. Therefore, this suggestion is worth considering, from the viewpoints of both accuracy and practicality.
Conclusions and Recommendations
The following conclusions and recommendations are made on the basis of this study.
Significant differences exist between AV measured by AASHTO T166 and ASSHTO T331 compared with the EAV measured by ASTM D7063.
The differences between T166 and T331 AV and EAV are more significant for a coarse-graded mix than a fine-graded mix.
A good correlation exists between AASHTO T166 and AASHTO T331 voids and the ratio of EAV (ASTM D7063) to AV.
Sample-to-sample variations between apparent specific gravity values exist, and median values could be significantly different for apparent specific gravity measured by ASTM D7063 for each sample compared with maximum theoretical specific gravity values measured on loose mixes by AASHTO T209. This leads to inaccurate estimation of voids in compacted samples.
Voids measured by estimating Gmb with AASHTO T331 are closer to effective voids for coarse-graded mixes than those measured by AASHTO T166.
VMA values are affected by differences in bulk specific gravities measured by different methods.
For coarse-graded mixes, the amount of water-accessible voids is found to be greater than the AV measured by the AASHTO T166 method, especially for voids below 5.6%.
The results of performance tests can show significant variability because of the differences in voids within samples, which are influenced by the variability in material-related apparent/maximum specific gravity. In addition to an increase in asphalt content, control of EAV is needed to reduce aging-related durability problems.
Because AV affect performance significantly, accurately measured AV must include air- and water-accessible voids. The AASHTO T166 AV are lower than the water-accessible AV, as measured by ASTM D7063, for coarse-graded mixes. The ASTM D7063 method is recommended for the design of coarse-graded HMA.
Field studies should be carried out to determine the implications of using EAV for mix design and QC.
Inter-laboratory variability and field-laboratory correlations should be investigated.
Footnotes
Acknowledgements
The authors acknowledge the help of the Center for Transportation Infrastructure Systems (CTIS), University of Texas at El Paso, in conducting this study.
Author Contributions
The authors confirm contribution to the paper as follows: study conception and design: R. Mallick, D. Francis; data collection: D. Francis; analysis and interpretation of results: D. Francis, R. Mallick, A. Regimand; draft manuscript preparation: D. Francis, R. Mallick, A. Regimand. All authors reviewed the results and approved the final edit of the manuscript.
Declaration of Conflicting Interests
The author(s) declared no potential conflicts of interest with respect to the research, authorship, and/or publication of this article.
Funding
The author(s) received no financial support for the research, authorship, and/or publication of this article.