
Abstract
The Safe Waves approach to arterial traffic signal timing aims to eliminate, as much as possible, opportunities to speed while still providing good two-way progression for arterial traffic, through measures that include a short cycle length, short coordination zones, a low progression speed, and pedestrian recall (a traffic signal timing function that causes a pedestrian phase to automatically activate every cycle) except where pedestrian demand is very low. Simulation-based studies have shown Safe Waves signal timing can substantially reduce speeding opportunities with little or no increase in arterial delay. Speeding opportunities are defined as the number of events in which a vehicle enters an intersection on a “stale” green—a signal already green as the driver approaches—with no vehicle ahead of it for at least 5 s. However, only field studies can confirm whether timing traffic signals this way will actually lead to less speeding. A before-after field test compared existing signal timing plans with Safe Waves signal timing plans for a stretch of Route 114 in Danvers, MA, U.S., a suburban, 4-lane arterial with six signalized intersections and a 40 mph speed limit. With Safe Waves, the number of vehicles exceeding the speed limit fell by 74% as speeding opportunities fell by 51%. At the same time, average arterial delay increased by only 1.8 s per intersection, and average pedestrian delay crossing the arterial fell by 18 s, or 33%. Signal timing techniques that proved valuable in reducing speeding opportunities included using 30 min peak hour factors and, for phases that serve an infrequently used concurrent pedestrian crossing, programming the phase for less time than needed to serve the pedestrian crossing, a technique sometimes called “oversized ped.”
Increasingly, cities and states in the U.S. are accepting greater responsibility for managing speed on their roads to ensure traffic safety, in keeping with Vision Zero principles ( 1 ). Speed control on arterial roads is particularly important because one-third of traffic fatalities are speed-related, and 65% of those fatalities occur on arterials ( 2 ). However, managing speed on arterials is challenging because traffic-calming treatments based on horizontal and vertical deflection—very effective on local streets and streets with one lane per direction—are usually not practical on multilane roads and automated speed enforcement is legally prohibited in many jurisdictions ( 3 – 6 ).
This study tests how effectively traffic signals can be used to manage speed on a multilane arterial, while still providing good service (i.e., good progression) for traffic. On one-way streets, timing traffic signals for a target progression speed is an obvious means of managing speed—vehicles traveling faster than the progression speed will be stopped by a red light. However, on two-way streets, the need to provide good progression for traffic in the opposite direction results in green intervals starting earlier or ending later than they would for pure one-way progression, and so drivers often arrive at an intersection on a “stale” green—a signal already green as the driver approaches—with no vehicle ahead of them, leaving them with nothing to stop them or slow them down. The ideal intersection spacing for perfect two-way coordination has a travel time of half a cycle, which results in a half-cycle offset between consecutive intersections. However, when intersections are closely spaced, bi-directional bandwidth is maximized by having clusters of intersections with simultaneous green lights, with the middle of one cluster’s green offset by half a cycle from that of the next cluster. As a result, drivers often see multiple adjacent green signals; knowing that those signals will not stay green forever gives drivers an incentive to race to catch as many green lights as possible.
Speeding Opportunities and the Safe Waves Approach
Furth et al. proposed a new approach to speed management on arterials by timing traffic signals in a way that focuses on minimizing speeding opportunities ( 7 ). A speeding opportunity is defined as the event of a vehicle arrival on a stale green with no vehicle ahead of it for at least 5 s. While not every driver with a speeding opportunity will speed, it seems reasonable to expect that, for those who want to speed, removing opportunities to speed will reduce instances of speeding.
With this workable definition, speeding opportunities can be readily identified and counted in the field as well as in simulation. Furth et al. pointed out that conventional arterial signal coordination often has features that create a lot of speeding opportunities, including long signal cycles, arterial green intervals that continue long after the queue has cleared, and large clusters of adjacent intersections having near-simultaneous green ( 7 ). They postulated that, by changing signal timing to avoid these features while still offering progression at a reasonable speed, speeding opportunities could be reduced with little or no increase in vehicle delay. Timing signals in a way that minimizes speeding opportunities while still providing good progression is called the Safe Waves approach and is described in Furth et al. ( 8 ). It emphasizes using small coordination zones with fully actuated control where coordination is not needed and, where coordination is necessary, using short cycle lengths, low progression speeds, and pedestrian phases on recall (a traffic signal timing function that causes a pedestrian phase to automatically activate every cycle) except where pedestrian demand is very low. It aims for no more than two adjacent intersections with simultaneous offset (i.e., starting and ending arterial green at about the same time in each cycle).
In the seminal study on speeding opportunities, simulation tests on two urban arterials in Boston found that, indeed, speeding opportunities could be substantially reduced with little or no increase in vehicle delay, with speeding opportunities down by 30% to 66% and average delay per vehicle changing by −3.0 to 5.6 s ( 7 ). A simulation study of a third Boston arterial found that speeding opportunities fell by 34% in the AM peak period and 51% in the midday period, with average vehicle delay increases of 0 in the AM peak period and less than 5 s in the midday period ( 9 ). In these studies, Safe Waves signal timing also led to large decreases in pedestrian delay ( 8 , 9 ).
In a field test that did not involve changing the signal timing plan, Halawani and Furth found a positive relationship between speeding opportunities and speeding ( 10 ). Vehicles that had a speeding opportunity were significantly more likely to speed than other vehicles.
However, only a field test that involves a change in signal timing plan can demonstrate whether Safe Waves signal timing can reduce speeding. To that end, the Massachusetts Department of Transportation (MassDOT) sponsored a study that involved a field test of one corridor. A planned field test in a second corridor proved infeasible because of signal equipment limitations.
Objectives and Hypothesis
The field test involved designing a Safe Waves signal timing plan that would minimize speeding opportunities while still providing good progression, and then using before-after measurements to measure impacts on speeding, speeding opportunities, and delay. The hypothesis was that using the Safe Waves signal timing approach would reduce speeding with little or no increase in average vehicle delay.
Site Description
The study site is a 3,500 ft stretch of Route 114 in Danvers, MA, with six signalized intersections (Figure 1). Intersections 2 to 6 were coordinated in the same zone, and intersection 1 was running coordinated with a different cycle length. Only intersections 4 and 6 have crosswalks for crossing Route 114, both with less than five pedestrian actuations per hour (most pedestrians crossing the arterial use a grade-separated rail-trail that crosses the arterial between intersections 4 and 5). Route 114 is undivided with two thru-lanes per direction, plus a left-turn lane at every intersection approach with a left-turn movement. The speed limit is 40 mph, and the corridor carries more than 36,000 vehicles per day.
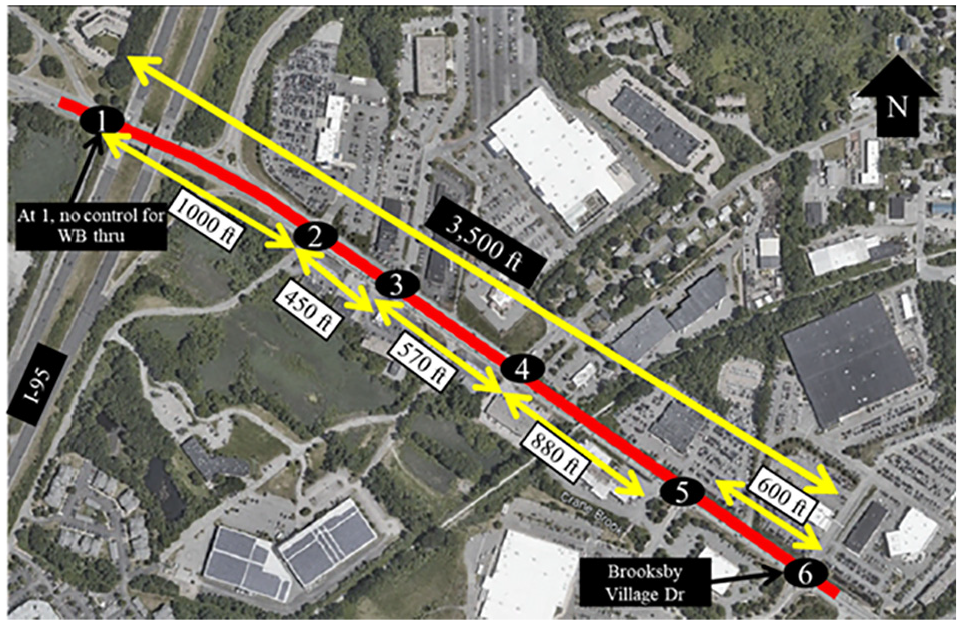
Study site along Route 114.
Signal Timing Design
Safe Waves Approach to Signal Timing
Before describing the signal timing design for the field test, it is helpful to review the elements of the Safe Waves signal timing, described in Furth et al. ( 8 ). It should have short signal cycles and low progression speed, which will result in small clusters of intersections with simultaneous offsets ( 11 ). Ideally, there should be no more than two consecutive intersections with simultaneous offset.
Because the needed cycle length can vary from intersection to intersection, a corridor can be broken into short coordination zones, with the cycle length in each zone tailored to its need; that helps facilitate signal cycles being as low as possible. However, the segments at coordination breaks should be long enough to hold a queue containing one cycle’s worth of cars (typically 500–900 ft, depending on traffic volume and cycle length). Where coordination is not needed, signals should operate fully actuated, with pedestrian phases on recall where pedestrian demand is strong; this allows cycle lengths to adapt automatically to demand, and avoids long periods of unsaturated green time.
In support of short cycles, pedestrian crossings should be concurrent with the parallel vehicle phase where that is safe (low turning speed and low volume permitted turn conflicts) ( 12 – 14 ). Where pedestrian demand is very low (less than one call per three or four cycles) and pedestrian service requires a longer phase than the concurrent vehicle phase, pedestrian phases should be on demand (i.e., pushbutton actuated), and the concurrent vehicle phase should be undersized, that is, not long enough to accommodate pedestrian service without encroaching on the time programmed for the next phase, triggering a recovery algorithm by which the controller gets back in sync within one or two cycles. This practice, sometimes called “oversized ped,” is described in the Signal Timing Manual section 7.3.3 ( 12 ). Otherwise, pedestrian phases should be on recall so as to avoid giving excess green time to the coordinated phase, similar to the recommendations given by Cesme et al. ( 15 ).
The existing signal timing plans (for AM peak, midday, and PM peak periods) deviated from the Safe Waves approach in several ways. They had long cycles and a high progression speed, resulting in five consecutive intersections with simultaneous offsets, which created both an incentive and opportunity to speed. There was an exclusive pedestrian phase at one intersection, which demands a long cycle that all other intersections have to follow because of coordination. Pedestrian crossings were on demand, contributing to long arterial greens since the ped phases are rarely called, which, in turn, engender speeding opportunities.
The following sections describe how the signal timing plan was changed to align with the Safe Waves approach.
30 Min Peak Hour Factor (PHF)
Signal timing design aims to provide sufficient capacity for a design period which is typically specified as the busiest 15 min period. Because traffic volumes are always expressed as volume during the peak hour, volumes are adjusted upward by dividing them by the ratio of the peak hour volume to the flow rate in the design period, called the peak hour factor (PHF). PHF is always 1.0 or less; a low PHF means designing for a larger flow, which inevitably requires a longer cycle.
Designing for a peak period as short as 15 min can result in a lot of excessive capacity during much of the timing period, engendering speeding opportunities resulting from long signal cycles and unused green time. Traffic counts for Route 114 showed a high degree of peaking, with 15 min PHFs as low as 0.84, which means amplifying peak hour volume by 19% (because 1/0.84 = 1.19). Considering the dual objectives of providing good service but also limiting speeding opportunities, the design period was specified to be the busiest 30 min period within the peak hour (30 min period starting at minute 0, 15, or 30 within the peak hour) (Equation 1). 30 min PHFs ranged from 0.91 to 0.97. Using 30 min PHFs may result in the critical intersection being slightly under capacity a few minutes; however, the queues that form during this short interval of overcapacity will usually be dissipated by the end of the 30 min period:
A second reason to avoid 15 min PHFs is that, with periods this short, boundary effects can strongly distort the PHF. To illustrate, suppose the cycle length is 2 min (120 s), a value commonly used in arterial coordination; then there will be 7.5 cycles per 15 min period. Suppose further that, within each cycle, the arterial green lasts 1 min. It may then be that one 15 min period has eight full green phases of arterial traffic, while the next 15 min period has only seven. If flow rates in the two periods are identical, the first will manifest a count of arterial traffic that is 14% greater than the second period. The greater count in the first period will be interpreted as a higher flow rate, when in fact it is only an artifact because of boundary effects. With longer periods, the distortion resulting from boundary effects is smaller.
Concurrent Crossings with Undersized Phases
Crossings were changed to concurrent at the intersection with an exclusive pedestrian phase after confirming that turning volumes from the side street were low and that the intersection geometry would not allow high-speed turns.
Then, at both intersections with pedestrian crossings, cycle design used undersized phases for the concurrent vehicle phase (a treatment also called “oversized ped”) because pedestrian crossings are infrequent ( 12 ). The needed split for the concurrent phase was based on vehicle need plus one-third of the extra time needed when a pedestrian is served. For example, if serving vehicles alone would require a split of 20 s while serving pedestrians would require a split of 35 s, the need split was taken to be 25 s.
Coordination Zone(s)
Because intersections 2–6 are closely spaced and, with the changes already described, require a similar cycle length, they were coordinated in a single zone.
Intersection 1 has a much shorter needed cycle length and, because it is sufficiently distant from intersection 2, it could have been put into its own coordination zone, running free. Instead, however, the chosen design was to add it to the coordination zone with the other intersections, applying double cycling (i.e., it will cycle twice while each other intersection cycles once). Note that westbound thru traffic is not controlled at all at intersection 1.
Existing versus Safe Waves Signal Timing
New signal timing plans were developed for the AM peak, midday, and PM peak periods. In addition to the parameters already described, the design used a target degree of saturation of 0.94, which provides a small amount of slack capacity during the busiest part of the peak hour. To confirm that this level of slack would be sufficient, we calculated the ratio of the average critical arterial movement volume (through plus right-turn movements in the critical direction) to the highest volume observed over 6 days of counts for 3 peak hours per day at the corridor’s three busiest intersections. Out of 45 observed cases (excluding outliers), the ratio was equal to or exceeded 0.94 for all except one instance, the ratio of which was 0.93 (indicating that, for this instance only, 6% slack would have been insufficient, and only slightly so).
Figure 2 shows each intersection’s existing cycle length, needed cycle length, and proposed cycle length for the AM peak period. The large cycle length used now is due mainly to having an exclusive pedestrian phase and being designed for a 15 min peak. The figure shows how the needed cycle length is much smaller; it also shows how much the undersized phase technique contributed to a lower needed cycle length at intersections 4 and 6.
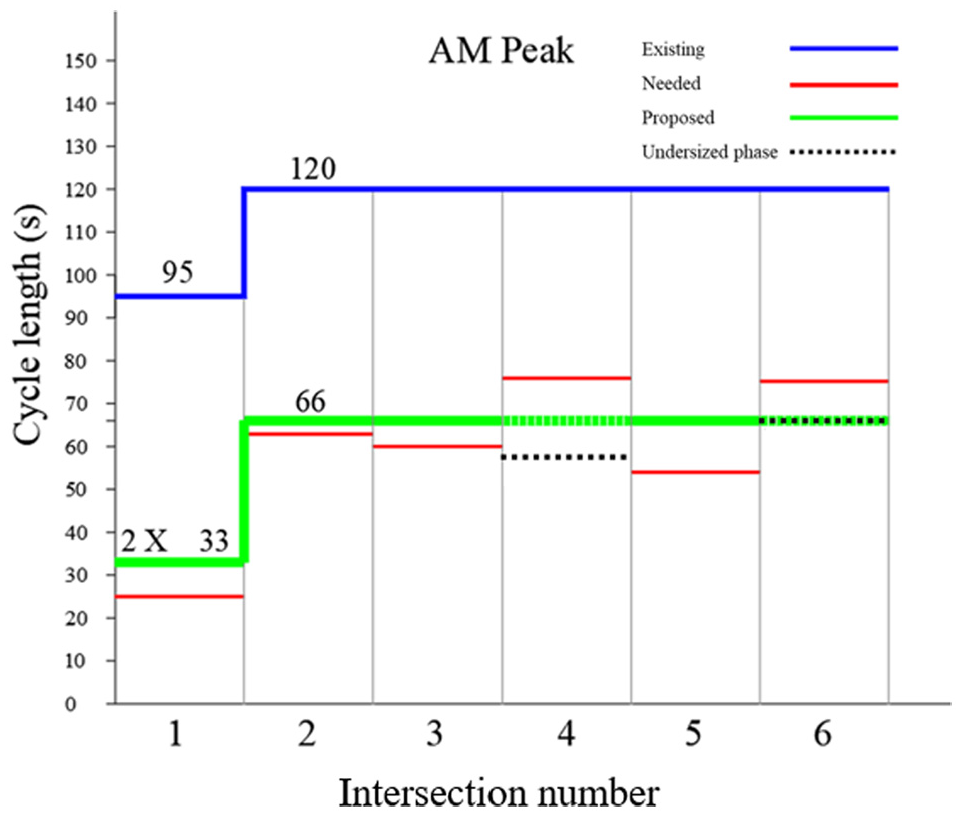
Cycle length in the AM peak period.
The same process was applied to the midday and PM peak periods, with results as shown in Table 1. One can see that, with Safe Waves, there is a pronounced decrease in cycle length for the AM peak and midday periods, while for the PM peak period, the decrease is moderate. The table also calls out the substantial contribution of the undersized phase technique.
Cycle Lengths (s) on Route 114
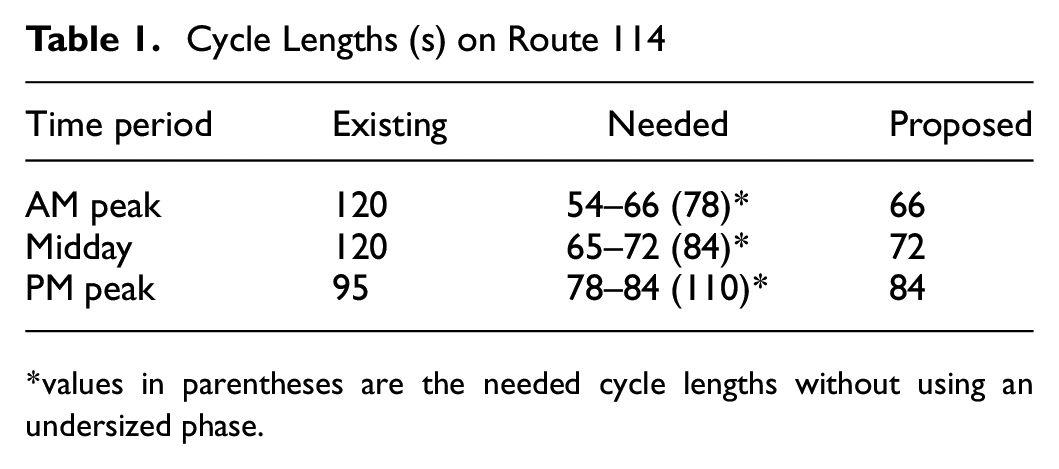
values in parentheses are the needed cycle lengths without using an undersized phase.
Data Collection
There were two sources of before-after data: field data collected by our team and probe vehicle travel times obtained from INRIX based on mobile app data. Changes to traffic signal timing began in early May, 2023, and were completed on June 27, 2023 (it took a few iterations to get the new timing plan installed correctly).
Probe Vehicle Data (Travel Time)
For the INRIX travel time data, the “before” period was March 6–24, 2023, and the “after” period was July 3–14, 2023. The “after” period could not be extended because repaving operations began on July 17. Only non-holiday weekdays were used. The AM peak period was taken as 7–9 a.m., the midday period was taken as 10 a.m.–12 noon, and the PM peak period was taken as 3:45–5:45 p.m.
Kim and Coifman compared data from INRIX with loop detector data and found that INRIX has a latency of approximately 6 min ( 16 ). Although it reports speed data at 1 min intervals, the values represent averages over 3 to 5 min periods. Despite these findings, INRIX data was considered acceptable for this study because the goal was to estimate travel times over intervals long enough that the data’s latency and resolution were not critical limitations. INRIX also provides speed data by segment, in which vehicles are typically probed multiple times per segment, and an average speed is then calculated for each vehicle for each segment. Unfortunately, this averaging method includes speeds while vehicles are in queues. As a result, the fraction of vehicles going fast through an intersection could not be measured, so speed data was collected by direct field measurement instead.
Field-Collected Data (Speed, Headway, Signal State)
Side-mounted radar was used to detect vehicles and measure speed, while cameras were used to determine signal state. Data were collected at intersections 2, 3, 4, and 6 for 1 day at each intersection, with one radar device and one camera used for each direction.
Each radar device can count vehicles in two channels, one for each lane. Radar devices were mounted on existing poles, using only poles that are close to the roadway edge, and oriented at a 45-degree angle to capture vehicle fronts. Where existing poles made it possible, the radar devices were mounted at the near side of the intersection yet downstream of the stop line, where they could capture vehicles as they crossed the stop line. For the four (out of eight) intersection approaches lacking a near-side pole beyond the stop line, the radar device was mounted on a far-side pole, capturing vehicles as they entered the departure lanes. Where a far-side mount was used, vehicles turning in from the side street were detected along with through arterial traffic, and therefore had to be filtered out.
Cameras were aimed at the arterial traffic signals to observe signal state so that vehicles detected by the radar device more than 2 s into the arterial red period could be filtered out, because they would be coming from side streets. Figure 3 shows how the field devices were mounted at intersection 6, with a near-side radar mount for eastbound traffic and a far-side mount for westbound.
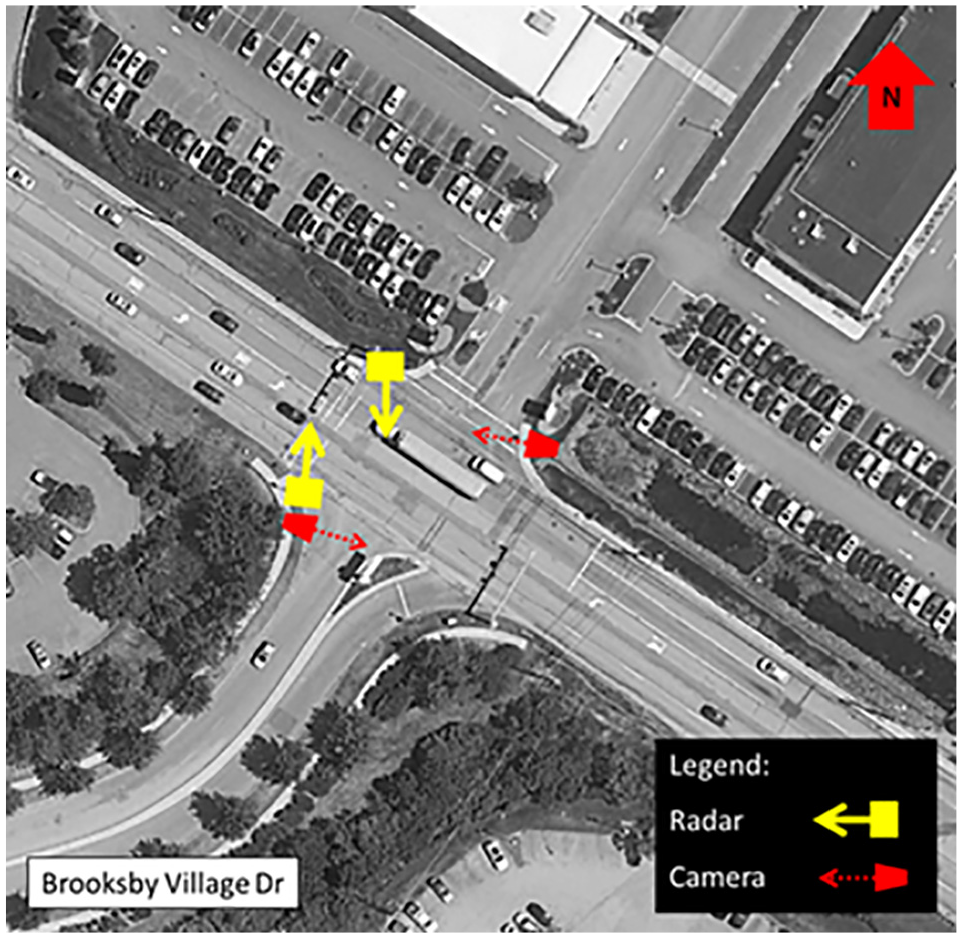
Device position and viewing direction at intersection 6.
Radar and video data were collected on weekdays (Monday–Thursday, avoiding holidays). “Before” data collection was conducted in late April 2023, and “after” data collection was conducted in early November, 2023, after repaving operations were complete.
Extracting Signal State
Video quality was too poor for the available signal head detection algorithm we tested. Instead, because the signal locations were fixed in the camera view (apart from perturbations caused by signal heads swaying in the wind), the signal state was determined by looking at changes to the light intensity at the location of each lens (green, yellow, red). For each approach, there are two signal heads for thru traffic, both of which were analyzed, because sometimes one was blocked by a truck or moved by the wind. For each lens, a 3 x 3 set of pixels centered on the lens was determined. From watching the video, it was clear that light intensity for at least one of those pixels was markedly higher when the lens was illuminated than not. Light intensity at each of the designated pixels was read every second; using the maximum intensity for each set of 3 x 3 pixels, the signal state was readily determined.
Processing the Radar Data
The radar counters delivered a Microsoft Excel file containing a record for each vehicle indicating the date, time, channel (i.e., lane), speed, and headway (time since the previous vehicle in that channel) for all the recorded vehicles. For counters mounted on a far-side pole, vehicles detected more than 2 s into a red period were filtered out. When fusing the camera and radar data to filter out observations during the red period, a challenge was synchronizing the data streams, because of drift in the clocks. The camera has a built-in modem and is always connected to the internet, so its time is accurate; however, the radar devices match their internal clock to the internet only when connected to a computer, and they were not connected to a computer during the field data collection period. By manually watching the video and comparing it with notable moments in the radar data (e.g., a long gap followed by a platoon of closely spaced vehicles), corrections that ranged from 0 to 18 s were made to overcome drift.
Python scripts were written to aggregate the data. Vehicle counts varied substantially by lane, far more than observed in the camera or the field, even though vehicle totals were consistent with prior year counts and with spot checks made using camera data. This indicates that the radar devices often misclassified vehicles by lane. While this kind of error does not affect speed data, it makes the headway data unreliable, making it impossible to measure speeding opportunities using field data.
Results
Changes in Speed Distribution
Figure 4 shows the before versus after speed distribution at each intersection and overall, by direction, for the AM peak period (7–9 a.m.). At each intersection and in both directions, one can see a marked decline in the proportion of vehicles in the higher speed bins. The highest speeds observed (greater than 45 mph) were in the westbound direction at intersections 6 and 2; in the “after” case, those high speeds have virtually disappeared. One can see the same pattern in the midday (Figure 5) and PM peak periods (Figure 6).
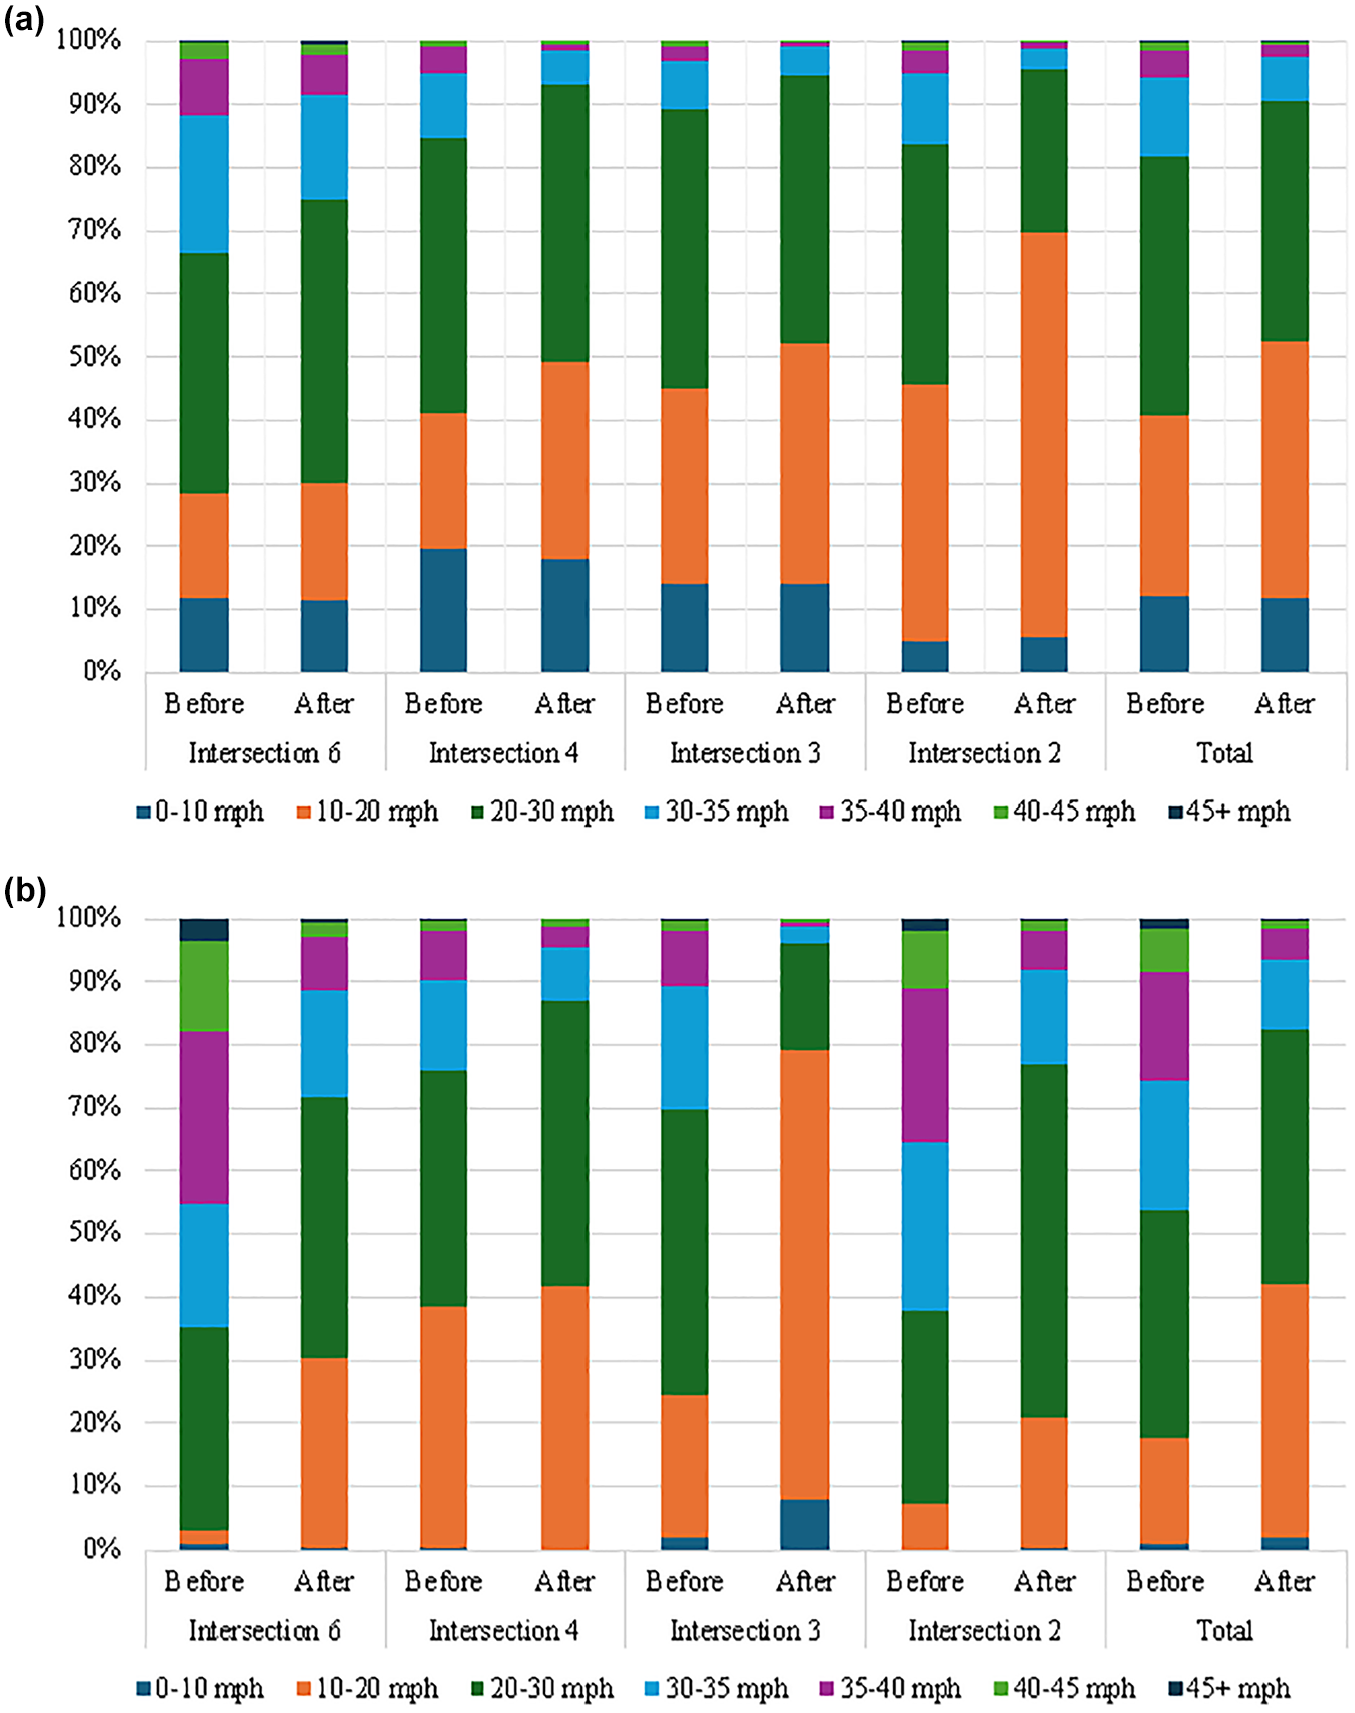
AM peak speed distribution: (a) eastbound direction and (b) westbound direction.
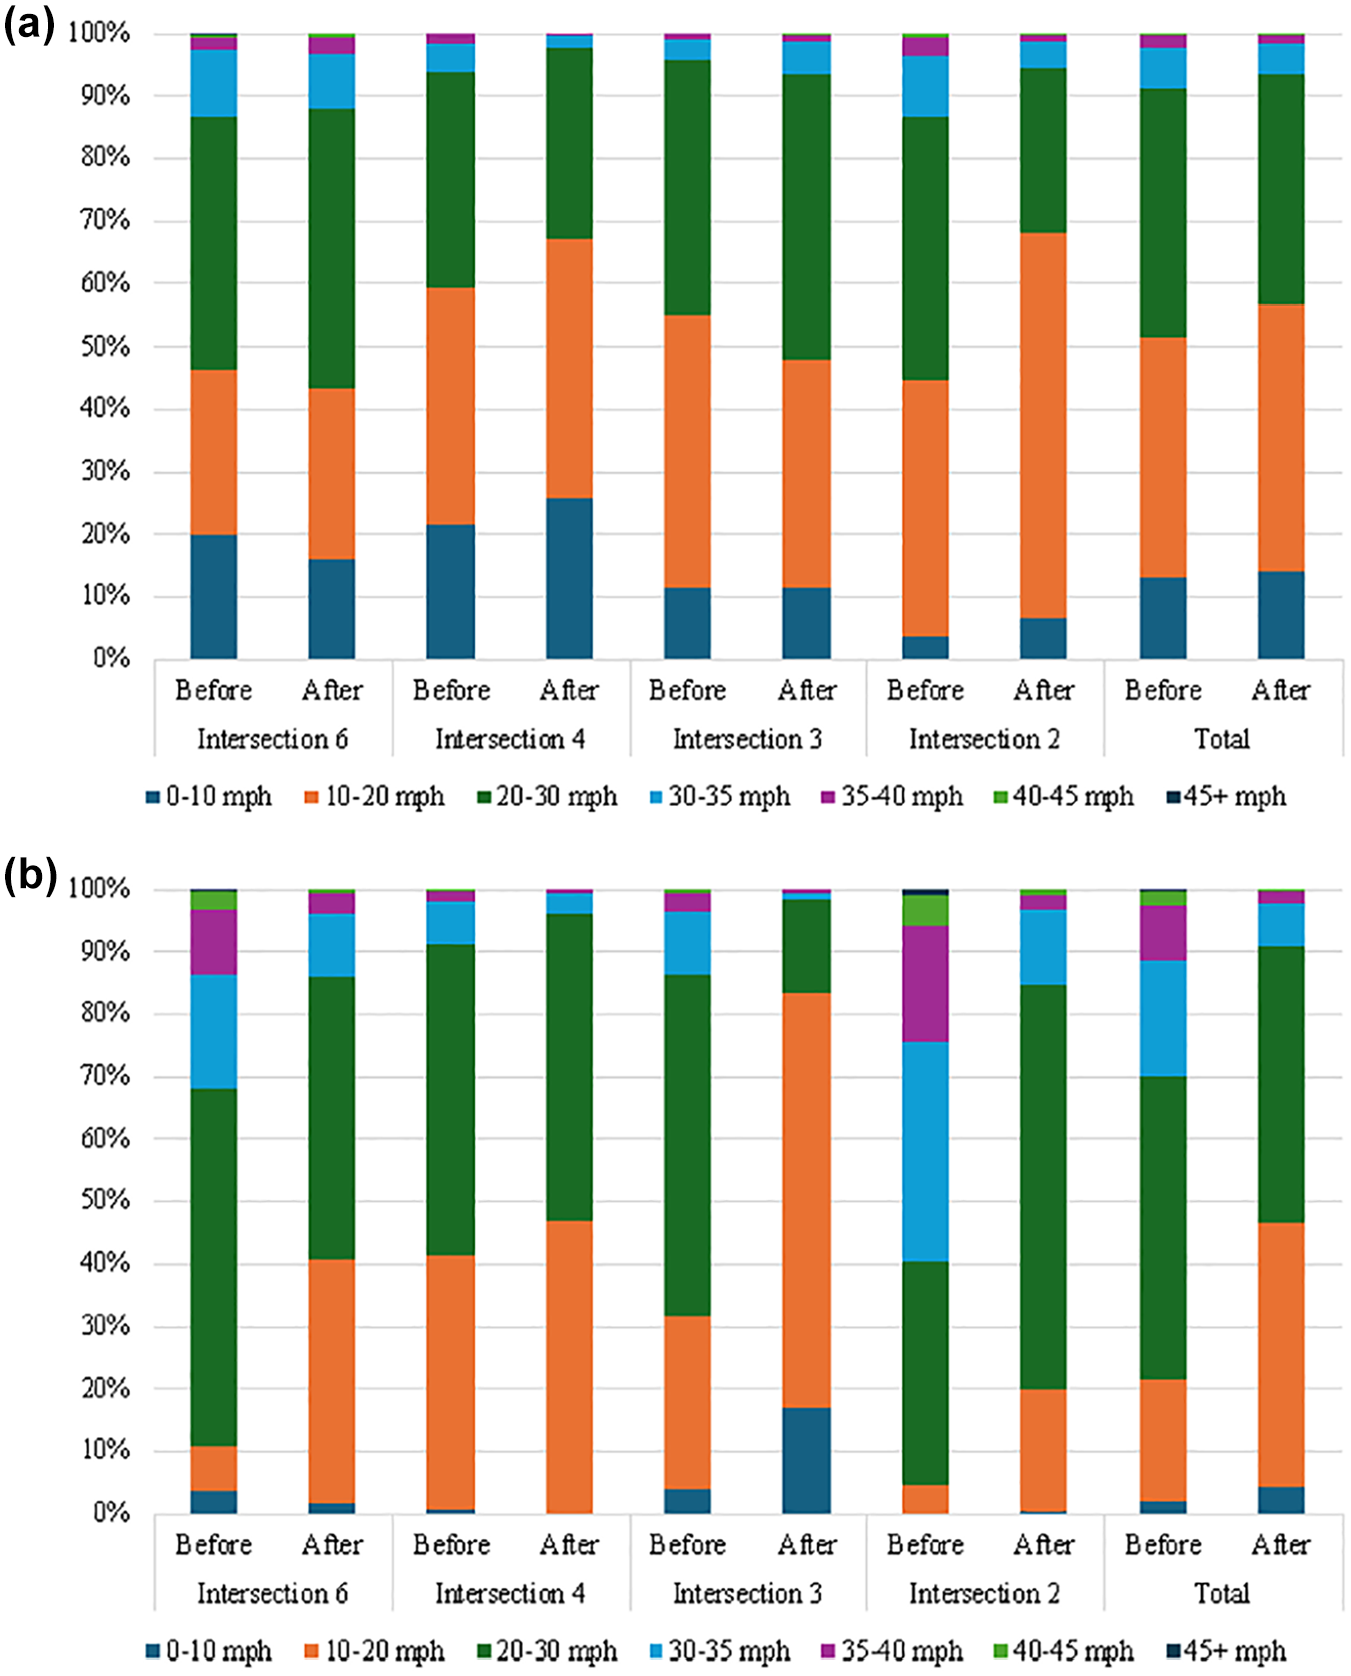
Midday speed distribution: (a) eastbound direction and (b) westbound direction.
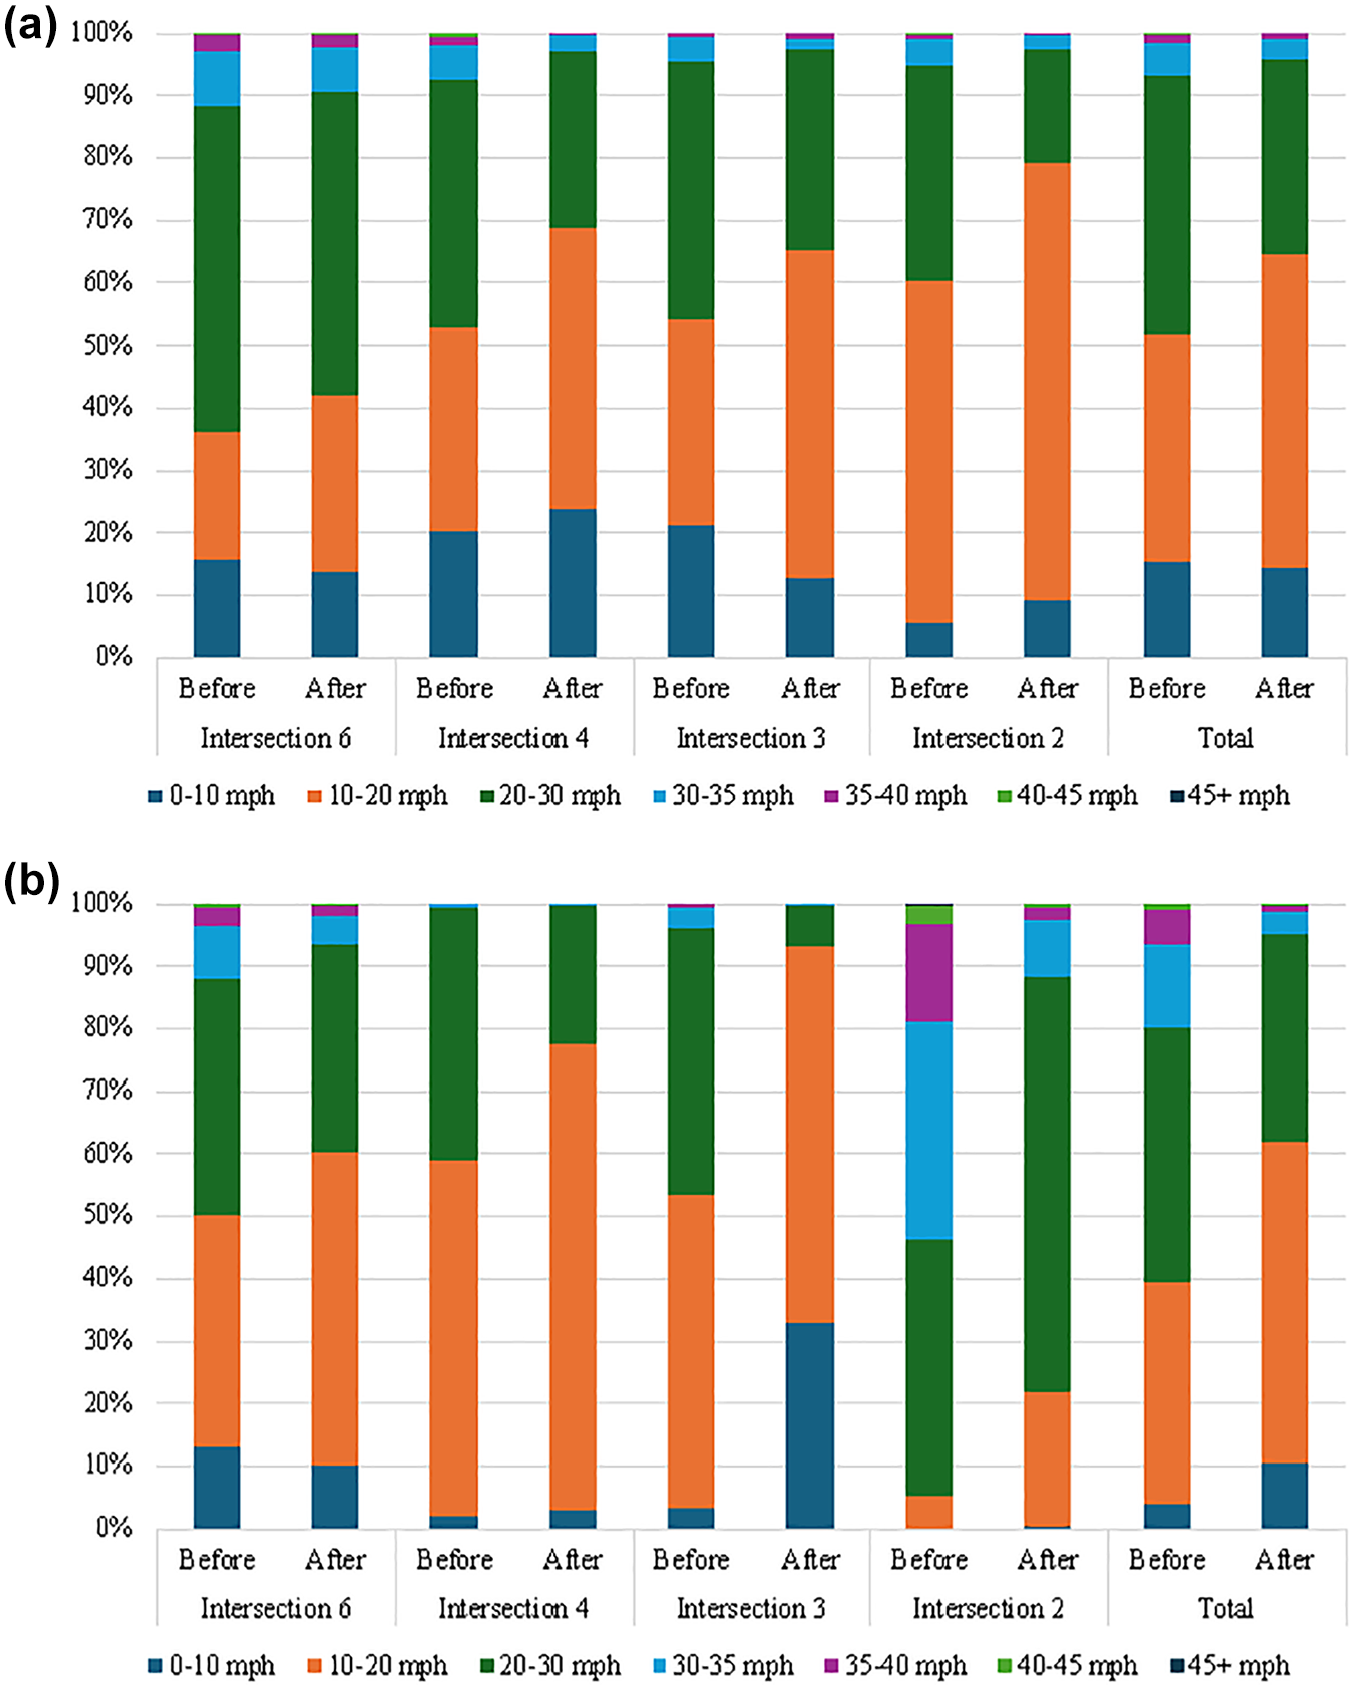
PM peak speed distribution: (a) eastbound direction and (b) westbound direction.
In addition to a systematic reduction in speed, these graphs also show that, despite a posted speed limit of 40 mph, the 85th percentile speed is below 35 mph for all except a few intersection-direction-period combinations.
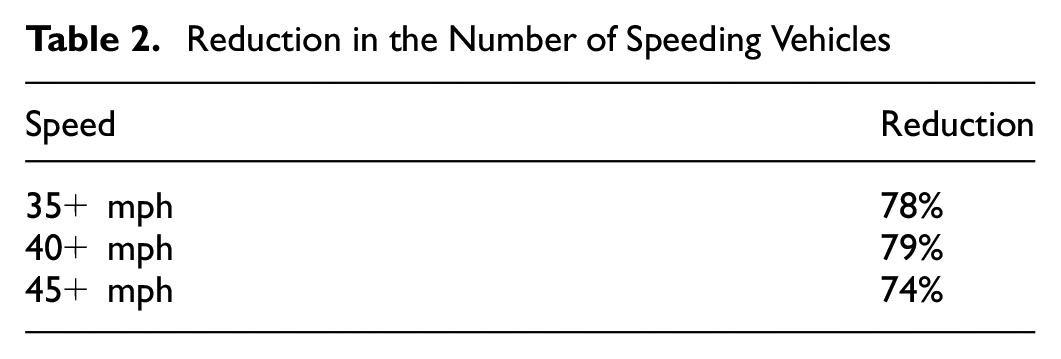
To better show how speeding behavior changed, Figure 7 shows the proportion of vehicles traveling faster than 35, 40, and 45 mph by period, aggregating over intersections and directions; Table 2 further summarizes these results. The proportion of vehicles traveling faster than 40 mph, which is the speed limit, fell by more than 75%; roughly the same reduction is seen for vehicles traveling faster than 35 mph or faster than 45 mph. It shows the difference (subtraction) between the fraction of vehicles in the specified speed range before versus after.
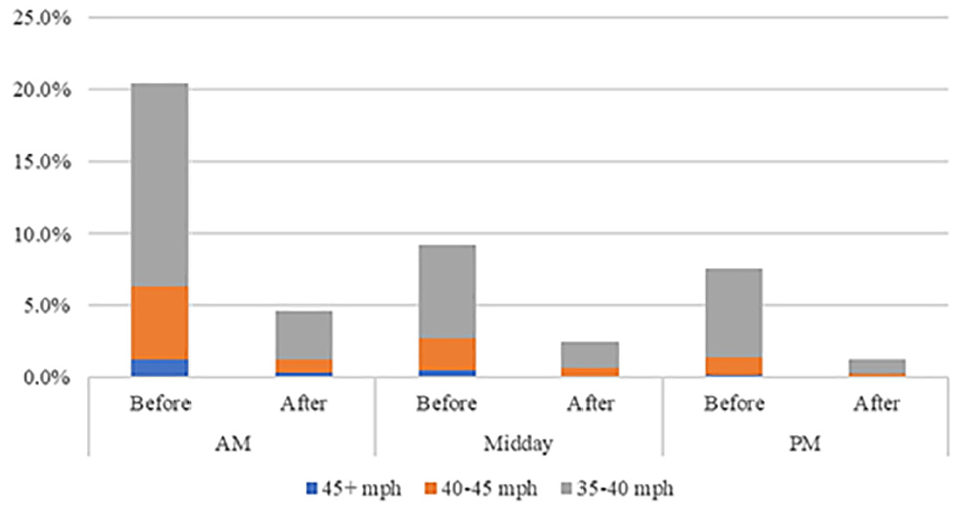
Proportion of vehicles with high speed by period.
Reduction in the Number of Speeding Vehicles
Travel Time and Average Speed
Figure 8 compares before-after travel time using INRIX data, measured between intersections 1 and 6, a stretch in which vehicles pass through five intersections. Average travel time increased by 12–15 s during the AM peak and midday periods, while in the PM peak period, when travel time and congestion were the greatest, there was virtually no change in travel time. Averaged over the day, the increase in arterial travel time was 1.8 s per intersection.
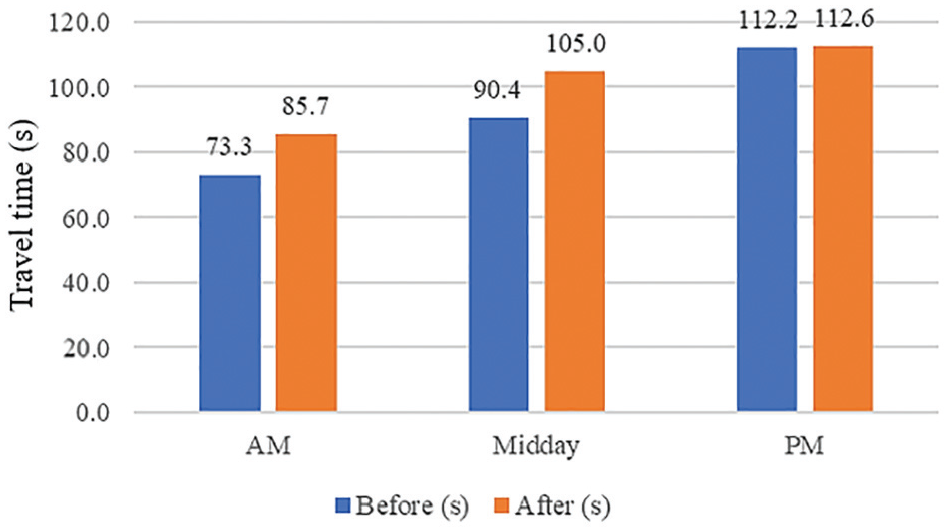
Arterial travel time—before-after comparison.
The variations in delay at different times of the day suggest that the impact of Safe Waves signal timing is more significant during periods of lower traffic volume when there is more speeding. Throughout most intersections in the study area, demand on and off the side streets is very low. The existing cycle lengths were long, and side street phases were not on recall. As a result, side street and left-turn phases from the arterial were often skipped or were short, allowing long green lights for the arterial, which kept delays minimal for the majority of traffic.
With Safe Waves signal timing, side street phases are on recall, which means they are served every cycle. Consequently, the arterial no longer benefits from prolonged green times, leading to a slight increase in delay—less than 3 s per intersection during the AM peak and midday periods, when there is lower demand in comparison with the PM peak period.
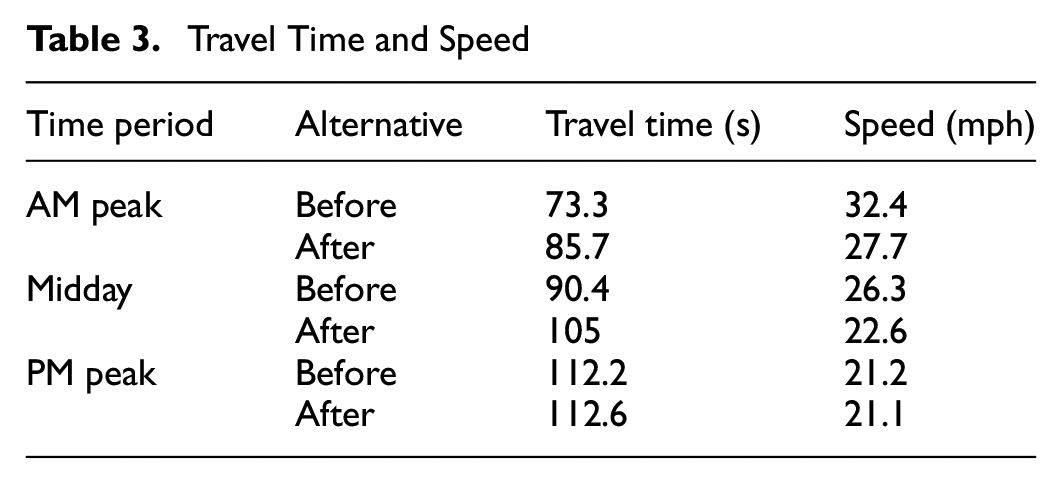
Table 3 summarizes changes in travel time and in average speed (another summary measure provided by INRIX), which decreased by 4 mph in the AM peak and midday periods, while there was virtually no change in speed in the PM peak period.
Travel Time and Speed
Changes in Speeding Opportunities
As discussed earlier, measuring speeding opportunities from field data was impossible because the radar devices did not accurately assign vehicles to a lane. Speeding opportunities were therefore estimated using the Safe Waves Analysis Tool (SWAT), which was developed as part of this research and is described elsewhere ( 8 ).
Figure 9 shows progression diagrams for existing and proposed signal timing plans for the westbound direction of the AM peak period. With the existing signal timing plan, one can see a lot of unsaturated green periods, with many vehicles passing through that have a speeding opportunity; in the proposed plan, one can see how much shorter the green intervals are, with correspondingly fewer vehicles passing through when traffic is not dense. At intersections 2, 3, and 4, nearly all vehicles passing through are in platoons in which they cannot speed.
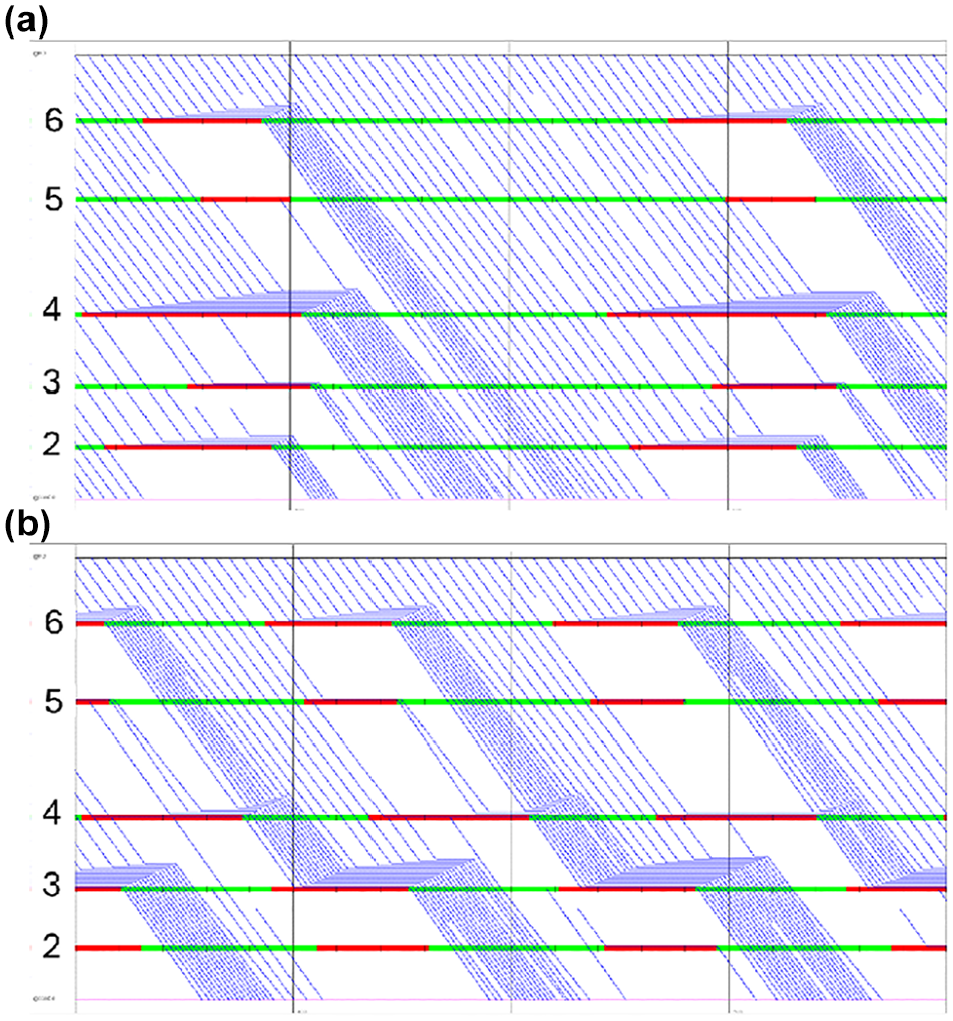
Progression diagrams for existing and proposed signal timing plans: (a) existing signal timing plan and (b) proposed signal timing plan.
Figure 10 compares the number of speeding opportunities per hour by time of day, aggregated over all six intersections, for three timing plans: 1) the existing timing plan, which includes an exclusive pedestrian phase at intersection 6; 2) a coordination plan optimized using Synchro with a concurrent pedestrian crossing at intersection 6, offsets chosen for a progression speed equal to the speed limit (40 mph), and concurrent phases sized to fit a pedestrian crossing; and 3) the proposed Safe Waves plan which has undersized phases for the concurrent pedestrian crossings and offsets chosen for a progression speed in the range of 20–35 mph. The second alternative was included to isolate the gains from switching to concurrent crossings, which are standard in most U.S. jurisdictions, from gains that come from other aspects of Safe Waves signal timing.
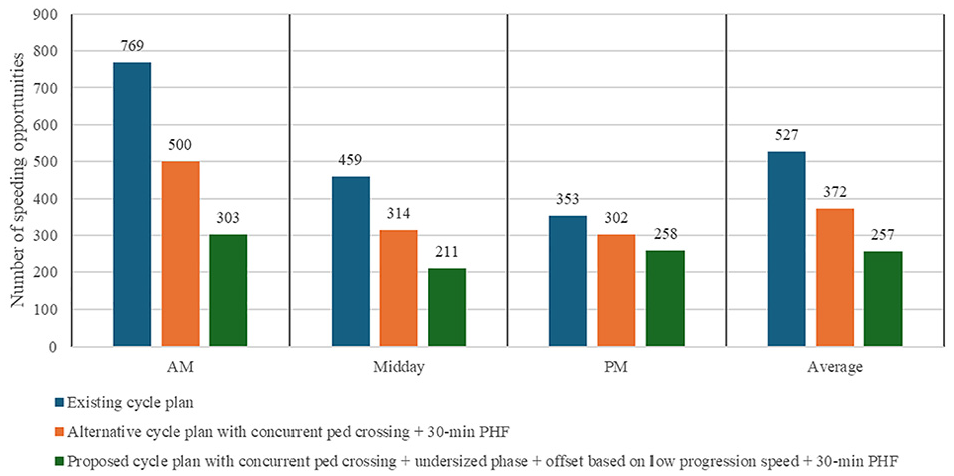
Speeding opportunities for different signal timing plans.
Compared with the existing plan, switching to concurrent crossings reduces speeding opportunities in the AM peak and midday periods by almost a third, because it allows a shorter cycle length. However, the Safe Waves plan, with still shorter cycles and lower progression speed, lowers speeding opportunities further by another 30% or 40%. Over the whole day, the Safe Waves plan reduces speeding opportunities by 51% on average (simple average over the three periods), with the greatest reductions in the AM peak and midday periods, which are the periods with the greatest reduction in cycle length.
Changes in Pedestrian Delay
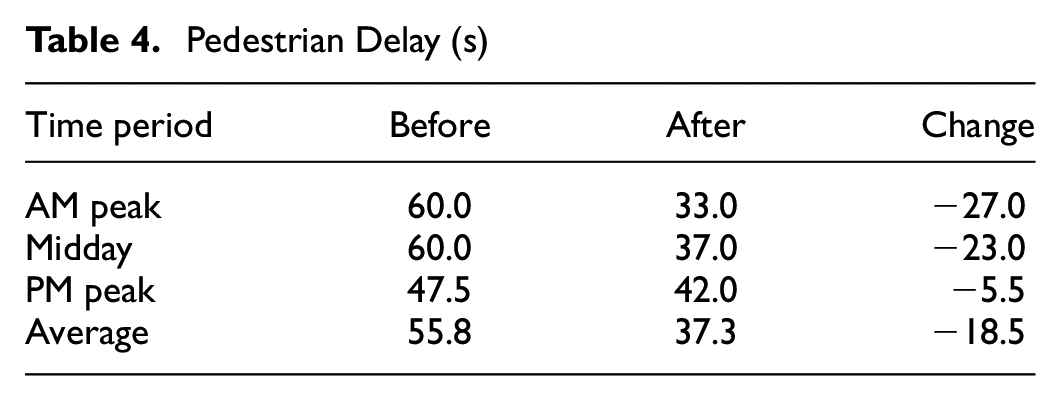
Intersections 6 and 4 have arterial crossings, which are on demand in both the current and proposed timing plans. Table 4 shows the average pedestrian delay for crossing the arterial at intersections 4 and 6 (the only intersections with arterial crossings) for the two timing plans. There are large reductions in pedestrian delay in the AM peak and midday periods, because of the large reduction in cycle length. Averaging over all periods, average pedestrian delay fell by 18.5 s, or 33%.
Pedestrian Delay (s)
Discussion
In the study corridor, retiming traffic signals following the Safe Waves approach reduced the fraction of vehicles speeding by about 75% while also reducing speeding opportunities by 51%. While causality is always difficult to prove, it seems reasonable to attribute the reduction in speeding to the reduction in speeding opportunities afforded by the new timing plan. When developing a new signal timing plan, it is impossible to measure directly how it will affect speeding, but it is possible to measure how it will affect speeding opportunities. This study provides evidence in support of the hypothesis that a good way to reduce speeding is to time signals in a way that reduces speeding opportunities.
A safety-convenience tradeoff was expected; however, this study found that arterial delay rose by less than 2 s per intersection, because the Safe Waves approach aims for “reasonably good” progression. For many officials, a delay increase of 2 s per intersection is a price they would gladly pay for a 75% reduction in speeding. Also, Safe Waves signal timing substantially reduced pedestrian delay by virtue of having shorter signal cycles. While delay to side street traffic and turning arterial traffic was not evaluated, it likely fell as well, because of the shorter cycle length.
Previous case studies of reducing speeding opportunities, conducted on three urban arterials with high pedestrian activity, have found that Safe Waves signal timing could substantially reduce speeding opportunities with little increase in arterial delay and decreases in pedestrian delay ( 7 – 9 ). This case study finds similar results on a suburban arterial with little pedestrian activity and, for the first time, shows a behavioral response—speeding fell substantially.
From studies on urban arterials, it was found that having pedestrian phases on recall was valuable for reducing opportunities, because skipping pedestrian phases leads to long arterial green periods in which vehicles can speed. In this study, however, it was found that, where crossing demand is low, the best way to avoid speeding opportunities is to keep the pedestrian phase on demand and to undersize its phase, that is, to program it for less time than needed to serve a pedestrian crossing, but with a small amount of slack so that the intersection will still have sufficient capacity for occasional pedestrian service. That way, when there is no pedestrian call, the arterial phase will get only a small amount of extra green time, and where there is a pedestrian call that forces the phase to continue beyond its normal force-off point, there is enough slack for queues to recover and for the signal to return to the background coordination cycle with little overall impact. Combining findings from urban and suburban arterial case studies leads to interesting guidance concerning pedestrian recall: where pedestrian demand is strong enough that a call can be expected at least once every two to three cycles, then have the pedestrian phase on recall, and where pedestrian demand is less frequent, have the pedestrian crossing on demand, but at the same time use an undersized phase. The combination to avoid is a long pedestrian phase that is on demand yet is called infrequently, leading to the arterial getting excess green in most cycles.
Coupled with earlier studies, the substantial reduction in speeding that this study found suggests that Safe Waves signal timing is a promising approach for speed management on both urban and suburban arterials. However, because speeding impacts have been obtained from only one field test, more field tests are needed for further validation.
Conclusion
Signal timing that aims to minimize speeding opportunities can be an effective method of speed control. While the Safe Waves approach to signal timing contains only elements that have all been used already, their combination in a realistic setting proved to make a large difference in speeding opportunities compared with not only the existing timing plan, but also to an optimized plan. The finding that speeding behavior was reduced by about 75% lends support to the hypothesis that, by timing traffic signals to limit speeding opportunities, speeding itself will be limited as well. The finding that arterial travel time increased by less than 2 s per intersection lends support to the hypothesis that, with the Safe Waves approach, speeding opportunities and speeding can be substantially reduced with little or no increase in arterial delay.
Through this case study, the “undersized phase” signal timing technique was recognized as a valuable way to reduce speeding opportunities and has become part of the Safe Waves approach ( 8 ). While this technique, under the name “oversized ped,” is recognized in the Traffic Signal Timing Manual, no practical guidance as to how to design cycles using this technique are given in the manual or in the literature ( 12 ). There is, therefore, a need for further research to develop guidance on how to use the “undersized phase” technique.
Footnotes
Acknowledgements
The authors thank Yusuf Ozbek for coding the Safe Waves Analysis Tool (SWAT), Fatemeh Tabatabaei for helping with data processing, and James Danila of MassDOT for championing and supporting this project.
Author Contributions
The authors confirm contribution to the paper as follows: study conception and design: P. Furth, M. Tahmasebi; data collection: M. Tahmasebi; analysis and interpretation of results: P. Furth, M. Tahmasebi; draft manuscript preparation: P. Furth, M. Tahmasebi. All authors reviewed the results and approved the final version of the manuscript.
Declaration of Conflicting Interests
The author(s) declared no potential conflicts of interest with respect to the research, authorship, and/or publication of this article.
Funding
The author(s) disclosed receipt of the following financial support for the research, authorship, and/or publication of this article: This project was funded by MassDOT.