
Abstract
The COVID-19 pandemic profoundly reshaped work patterns, with a sizable portion of workers becoming engaged in hybrid work (i.e., combining teleworking and in-person work). This study investigates whether hybrid workers, in the post-pandemic era, participate in out-of-home activities differently on their telework days than on their in-person workdays. Using data from 1,438 hybrid workers in California, US, collected during fall 2023, we estimate a multivariate ordered-response probit model with threshold shifters. Differences in participation across six out-of-home activities (shopping, errands, drop-off/pick-up, eating out, visiting friends and family, and exercise) between telework and in-person workdays are jointly modeled. Workers show greater overall activity participation on telework days, with considerable heterogeneity among individuals. On telework days, women and older workers tend to have lower participation in out-of-home activities. Flexible work schedules are associated with higher participation in social activities. Greater time savings (from not having to physically commute) lead to higher overall participation. The results underscore the importance of policies that support flexible work arrangements, considering their potential to positively affect lifestyle and productivity. Additionally, teleworking at non-home locations is linked to higher activity participation overall, suggesting potential trip-chaining or unique activity allocation strategies that warrant further investigation. Our study contributes to the literature on post-pandemic teleworking and activity participation, and offers valuable insights into urban planning, transportation policy, and remote-work policies.
Keywords
Telework occurs when individuals work from a location different from where their supervisors or employers are based ( 1 ). Although telework has existed for decades, a significant shift from conventional in-person work to telework occurred during the COVID-19 pandemic. Between early 2020 and late 2021, teleworking—which involves using information and communication technology (ICT) solutions such as computers and internet connection—became commonplace. (While the term “remote work” is sometimes used distinctly from “telework,” in that remote work can happen even without ICT, the ubiquitous availability of the internet today has made the terms “remote work” and “telework” almost synonymous; in this paper, we will use the two terms interchangeably.) The share of US workers who teleworked at least part of the working week rose from 8% in 2019 to over 70% in 2020 ( 2 ). As pandemic-related restrictions on social interactions and mobility were lifted, the rate of full-time teleworkers dropped from its pandemic peak. Hybrid work arrangements, which combine telework and in-person work across different workdays, have gained prominence since. Recent estimates indicate that a substantial portion of the workforce, ranging from 30% to 53%, now engages in such a hybrid work arrangement ( 2 – 4 ).
The continued prevalence of hybrid work arrangements, even after the worst of the pandemic passed, has motivated many recent investigations into the long-term effects on daily activity-travel patterns ( 5 , 6 ). However, as Asmussen et al. point out, many studies examining telework effects consider a single aggregate category of non-work activities; they proceed to emphasize the need to distinguish between different types of non-work activity ( 7 ). In particular, focusing on non-work activities at a granular scale helps explore the implications of teleworking on work-life balance, participation in community building, well-being, and life satisfaction ( 8 , 9 ).
Further, and perhaps, at least in part because of the lack of granularity in non-work purposes and different data collection approaches, the findings on the impact of teleworking on activity-travel patterns have been mixed. For example, evidence from Wang et al., Huang et al., and Obeid et al. supports the notion that higher levels of teleworking are associated with more-frequent non-work trips ( 10 – 12 ). Conversely, Caros et al. found that frequent teleworking was linked to less-frequent non-work travel ( 13 ). Instead, they found that hybrid workers make non-work trips most frequently, followed by fully in-person workers. A similar finding was reported by Asmussen et al., who noted that those who teleworked one to three times a month or once a week were associated with more weekly non-work stops (both for maintenance and leisure) than those who never teleworked or teleworked less than once a month, as well as those who teleworked 4+ days in the week ( 7 ). Readers are referred to Asmussen et al. for a comprehensive review of studies on the telework-activity relationship with regard to the activity dimension considered (episode frequency, time-use, or person/vehicle miles of travel), the type of data used, the time unit of analysis (whether daily or weekly or monthly), and the decision unit of analysis (individual or household) ( 7 ).
In the current paper, we contribute to the above telework-activity pattern linkage literature by analyzing data collected between August and November 2023 from 1,438 hybrid workers in California, US. There are several salient aspects of our paper. First, unlike many post-COVID studies, we examine teleworking effects on six non-work out-of-home activities. The out-of-home activities include three maintenance activities (shopping, running errands, and transporting others) and three discretionary activities (social, visiting friends and family, and exercising). To identify factors influencing changes in participation in these non-work activities, we employ a multivariate ordered-response probit model with threshold shifters (MORP-TS) that captures the interrelated nature of out-of-home activity participations across different non-work purposes.
Second, unlike almost all earlier studies, we focus on intra-individual variations in non-work trips across telework days and in-person workdays, rather than on inter-individual variations in non-work trips over a certain time unit of analysis (such as a day or a week); that is, instead of comparing teleworkers and non-teleworkers in their non-work patterns, we study the behavior of the same worker on different workdays based on teleworking or not. Obeid et al. is the only other study we are aware of that takes a similar approach, though it focuses on a single aggregate non-work category ( 12 ).
Third, we analyze revealed preference (self-reported) data in a post-pandemic setting. During the pandemic, as examined by Obeid et al., travel was heavily influenced by health concerns, which limited activities such as recreation ( 12 ). Thus, pandemic-era studies conflated the effects of teleworking with those of travel restrictions ( 14 ). In contrast, the post-pandemic era offers greater latitude for workers to decide whether to telework or not (of course, within the constraints of their employment arrangements). In particular, the population of teleworkers is now larger and more diverse, with hybrid arrangements becoming the “new norm.” These changes warrant a fresh examination of the relationship between teleworking and activity patterns.
Finally, we use a multivariate ordered-response probit (MORP) model that is well-suited for studying multiple out-of-home activities ( 15 ). This joint model accounts for correlated unobserved attributes that influence multiple activities by specifying an appropriate error correlation structure. Few existing studies have jointly modeled participation in out-of-home activities. Our joint model also incorporates threshold shifters to address bivariate clustering—a tendency of certain activities to increase or decrease together. This captures rare or common combinations of activities, better reflecting the complex interdependencies among different non-work activity participations.
The rest of the paper is organized as follows. The next section discusses the data and variables and describes the sample and methodology. The section after that presents the estimates obtained from modeling. The penultimate section is devoted to results of the analysis of the average treatment effects (ATEs), and the policy implications of our findings for urban planning. We conclude the paper with a summary of findings and present suggestions for future research.
The Data and Methodology
The Survey
This study is based on data collected from the latest survey wave of the California Mobility Panel, which includes a series of surveys conducted between 2018 and 2023, to analyze the evolving trends in travel behavior and activity patterns of California residents. The survey elicited information on individual socio-economic and demographic traits, worker/student status, and work arrangements (including days of teleworking, location of teleworking, commute time, and work timing flexibility), and a subjective ordinal response of whether individuals made fewer, the same, or more trips on telework days relative to in-person workdays for each of six non-work activity purposes ( 16 ).
Four approaches were used to recruit participants for the 2023 survey wave: 1) inviting previous panel study participants, 2) collecting a quota-based sample from a third-party opinion panel, 3) using various listservs and social media posts to invite respondents with a convenience sampling approach, and 4) targeting random California addresses (with an oversample of disadvantaged households) with a stratified random sampling approach. At the conclusion of the survey, the research team performed thorough data quality checks, as discussed in detail in Circella et al. ( 16 ).
To study differences in non-work activities between telework and in-person workdays, we first identified workers who teleworked at least once a week as the target group for our analyses. We excluded those who teleworked every day (i.e., they had zero in-person workdays), since it is not possible to compare their activities on telework versus in-person workdays. After screening out those with missing responses for key variables (including race, income, and commute time), we converged to a usable sample of 1,438 workers who engaged in hybrid work, teleworking at least once a week but not exclusively.
Figure 1 shows the key survey question asking if the respondent pursued specific activities more or less on telework (i.e., remote-work-only) workdays relative to in-person workdays, using a five-point Likert scale from “very much less” to “very much more.”
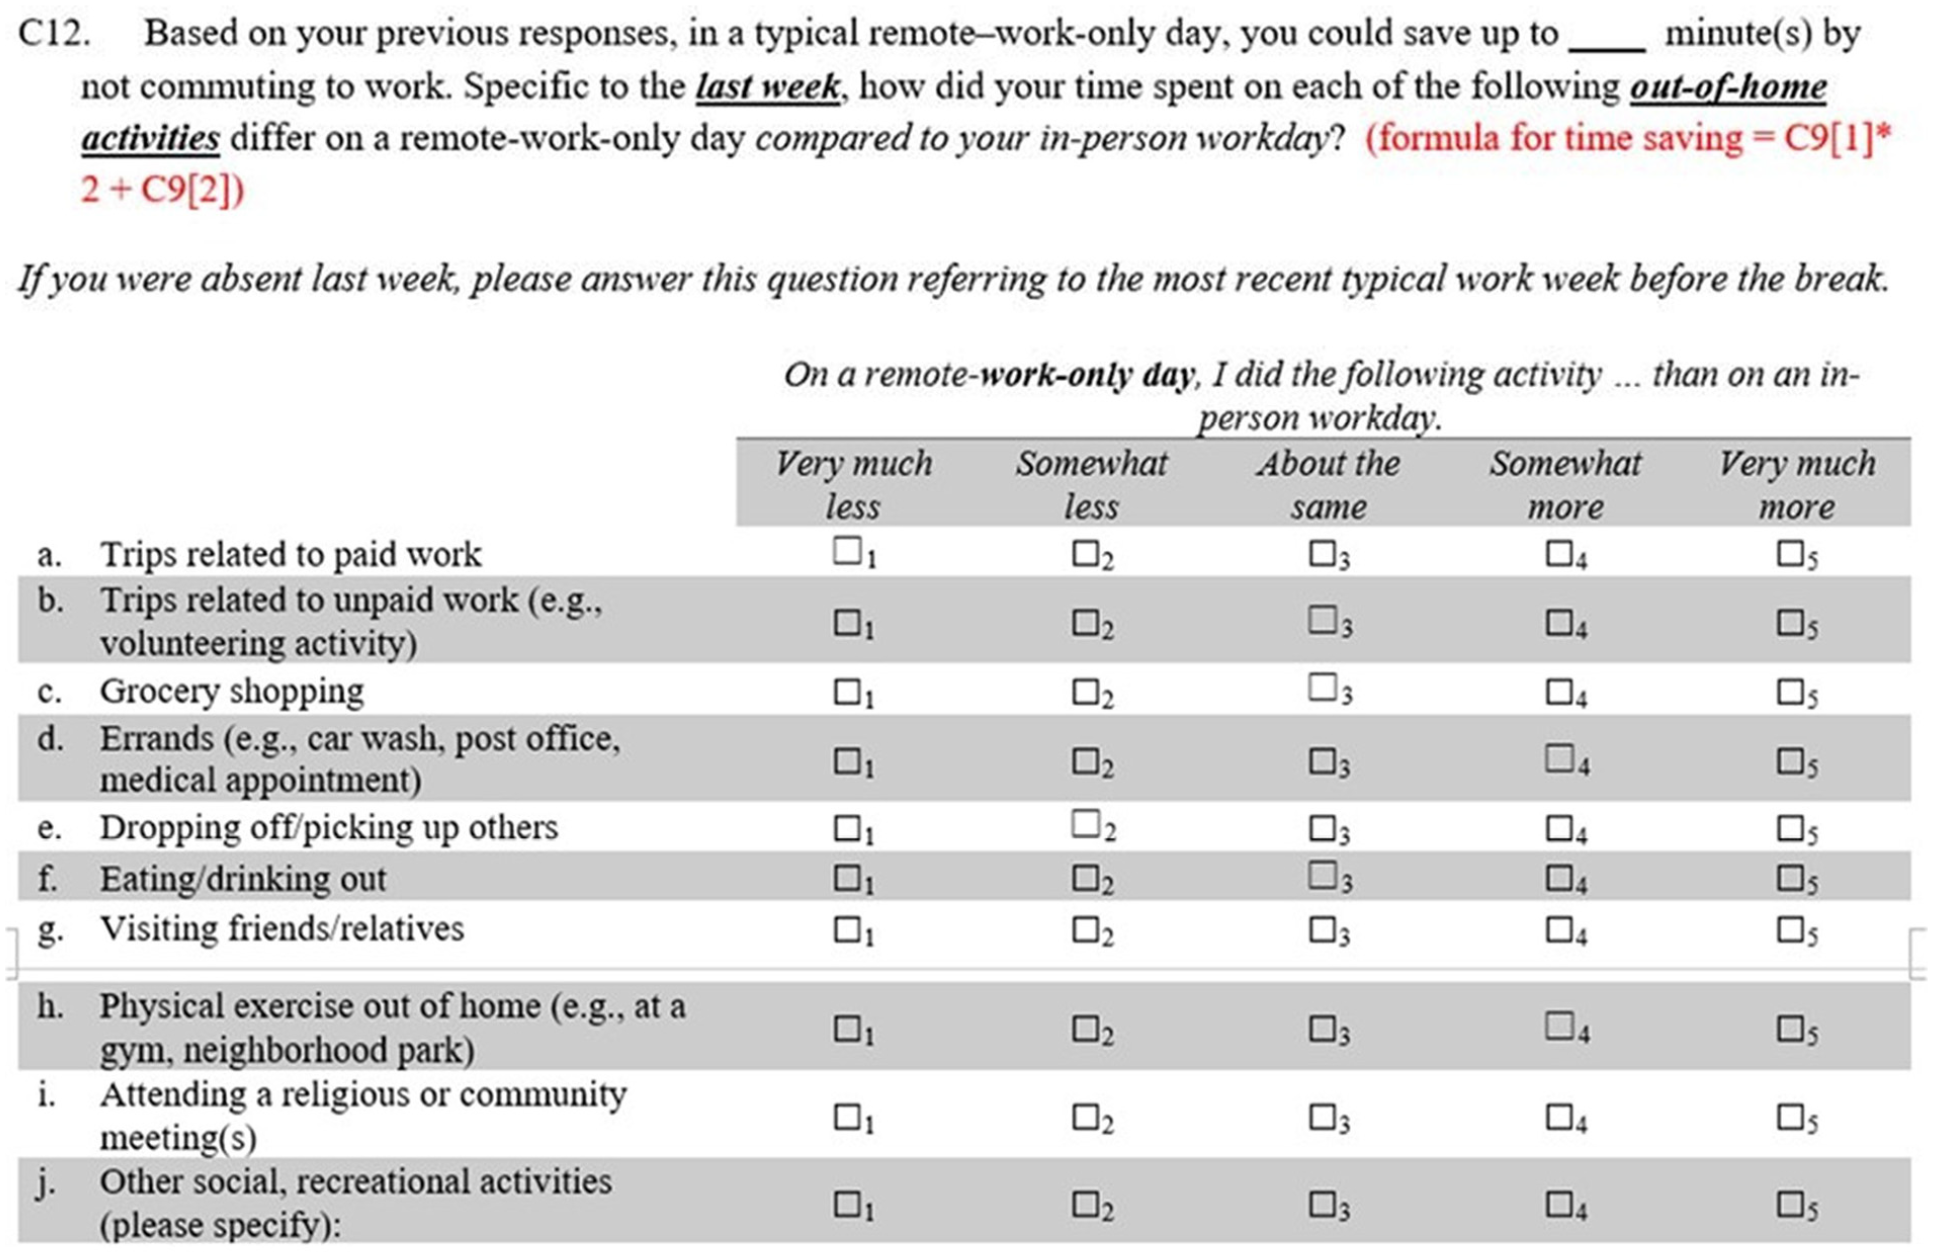
Survey question about alternative trip patterns on telework days (compared with in-person workdays).
Sample Characteristics
Table 1 presents the distributions of sociodemographic attributes of interest in the sample (N = 1,438) and compares them with the 2022 5-year American Community Survey (ACS) estimates for California. The sample has a slightly higher proportion of individuals aged 18–34 years, and a lower proportion of those aged 65+ years. The percentage of women respondents and respondents who identify as white is also higher in the sample, as is the percentage of individuals with a bachelor’s, graduate, or professional degree. Conversely, the share of individuals with lower educational attainment is lower. The proportion of individuals living in households earning $50,000–$199,999 annually is also higher, while the other income groups are underrepresented. These differences in age, race, education, and household income likely stem from the use of a web-based survey platform, the focus on teleworkers, and the impact of a person’s occupation on telework capability.
Sample Characteristics Compared with 2022 5-year American Community Survey Estimates for California (N = 1,438)
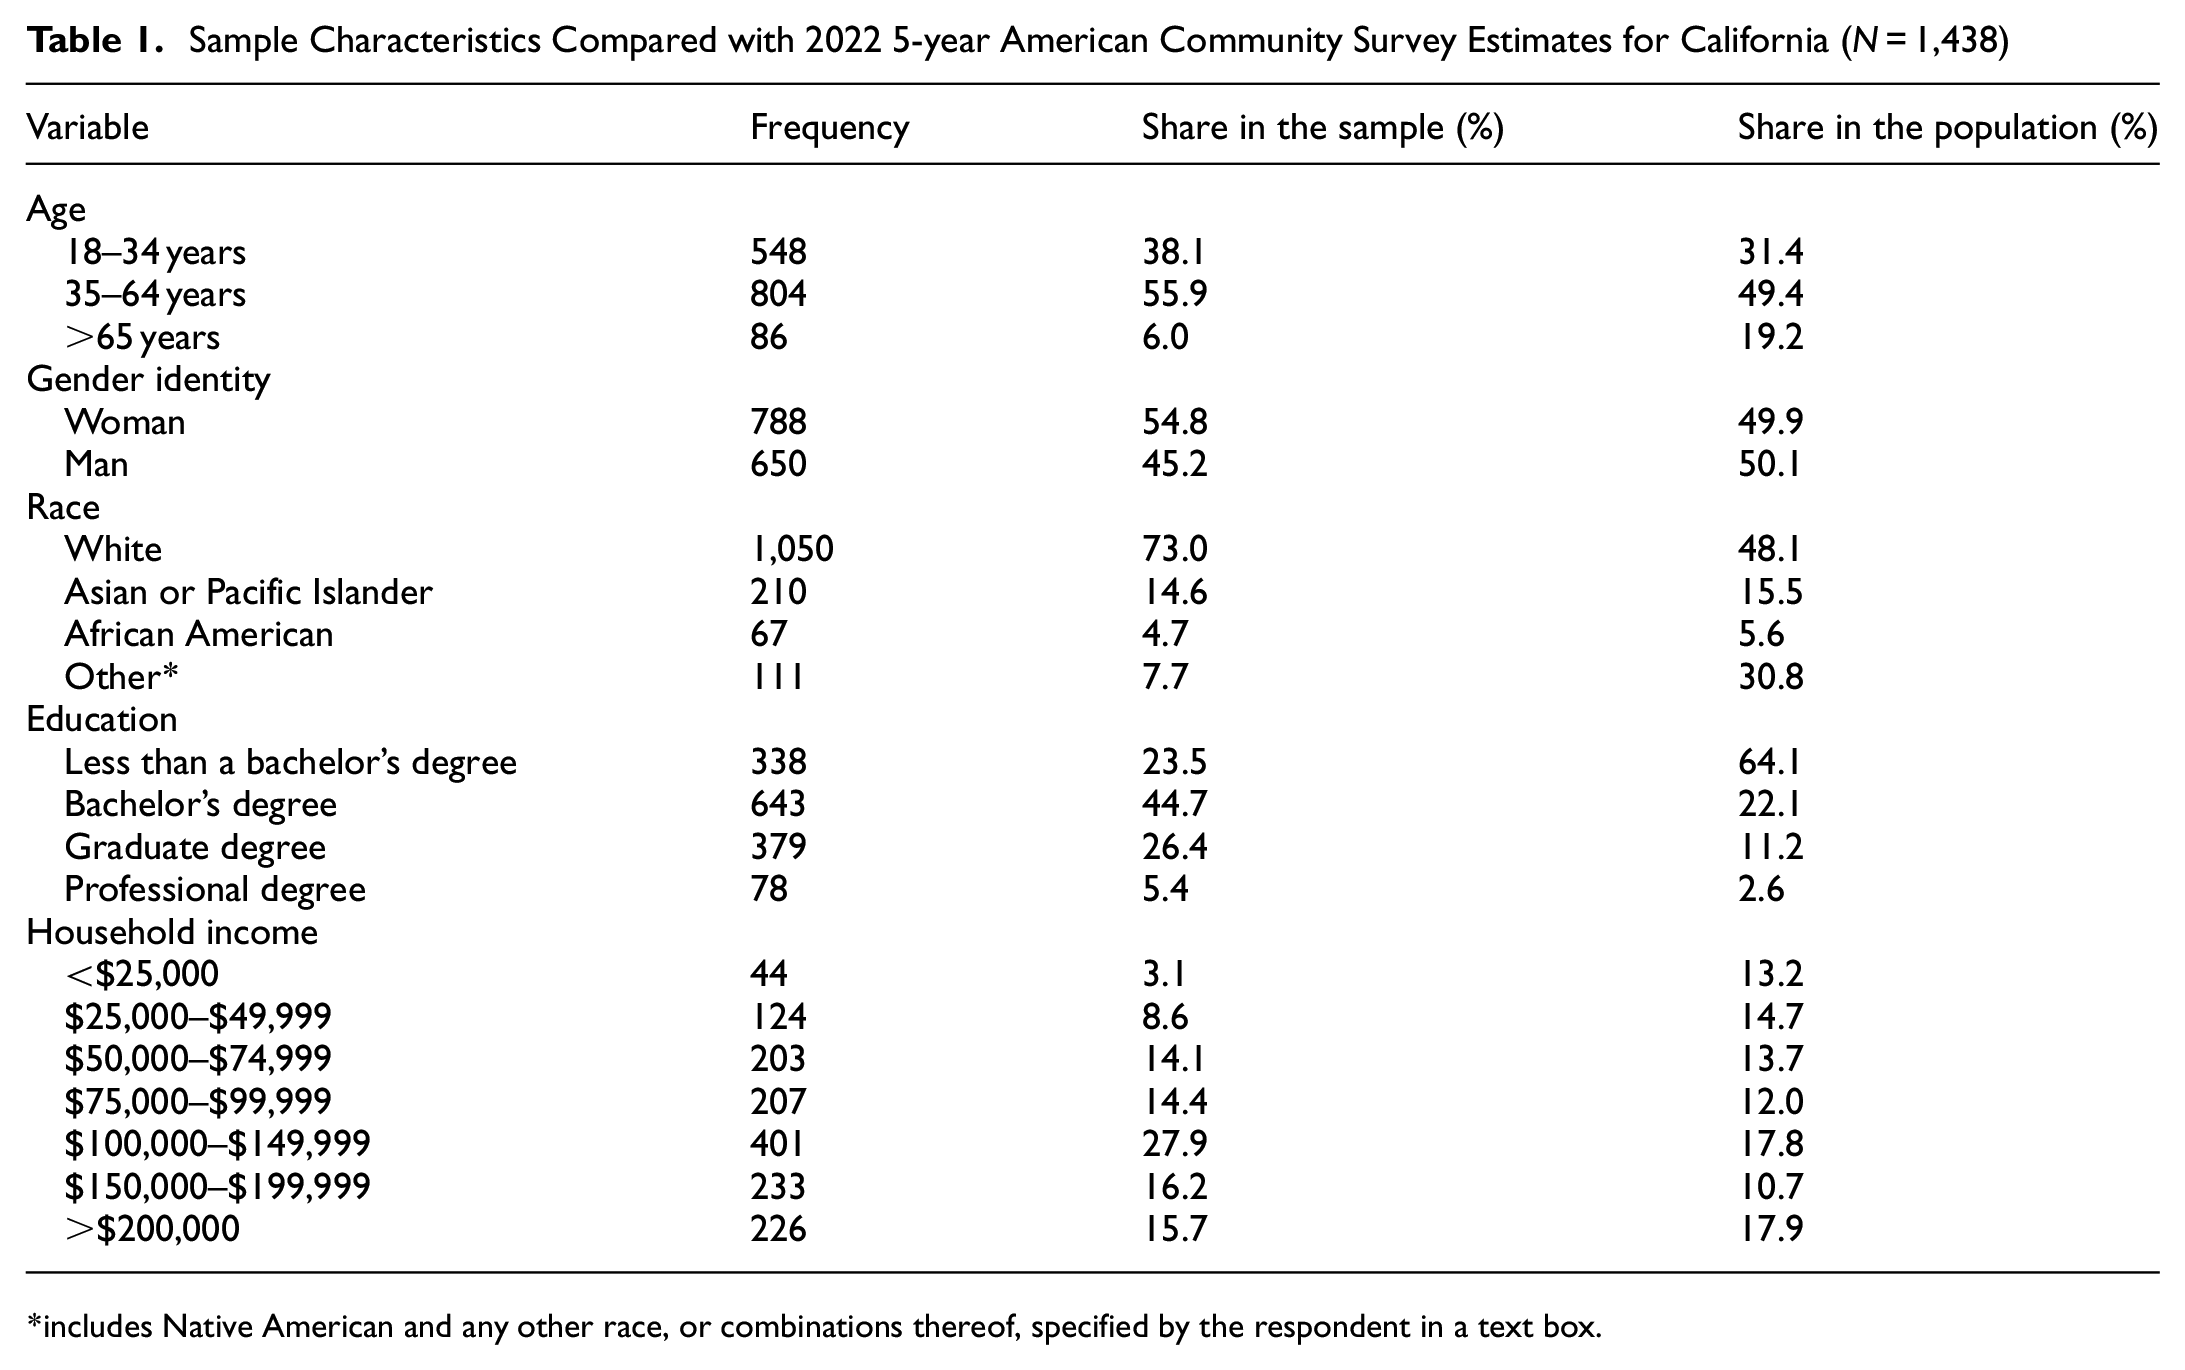
includes Native American and any other race, or combinations thereof, specified by the respondent in a text box.
Table 2 presents work arrangement attributes and other sample characteristics for which ACS comparisons are not available. The weekly frequency of working from home also varies considerably, with about half the sample working at least sometimes from temporary or alternative work locations. Most participants (86.1%) reported some or complete flexibility in their work schedules. The sample shows a range of travel time savings, with nearly half of the respondents saving >80 min. The majority of respondents (64.6%) reported working full-time for pay, with a notable proportion employed part-time for pay (12.8%). The label of “Other” worker types in Table 2 includes individuals working multiple jobs (with no clear distinction between full-time and part-time work arrangements) and those engaged in unpaid work. Households with minor(s) are most common in the sample. Lastly, urban and suburban areas are well-represented, with fewer respondents from small towns or rural areas.
Work Arrangement, Household Composition, and Geographic Characteristics of the Survey Respondents (N = 1,438)
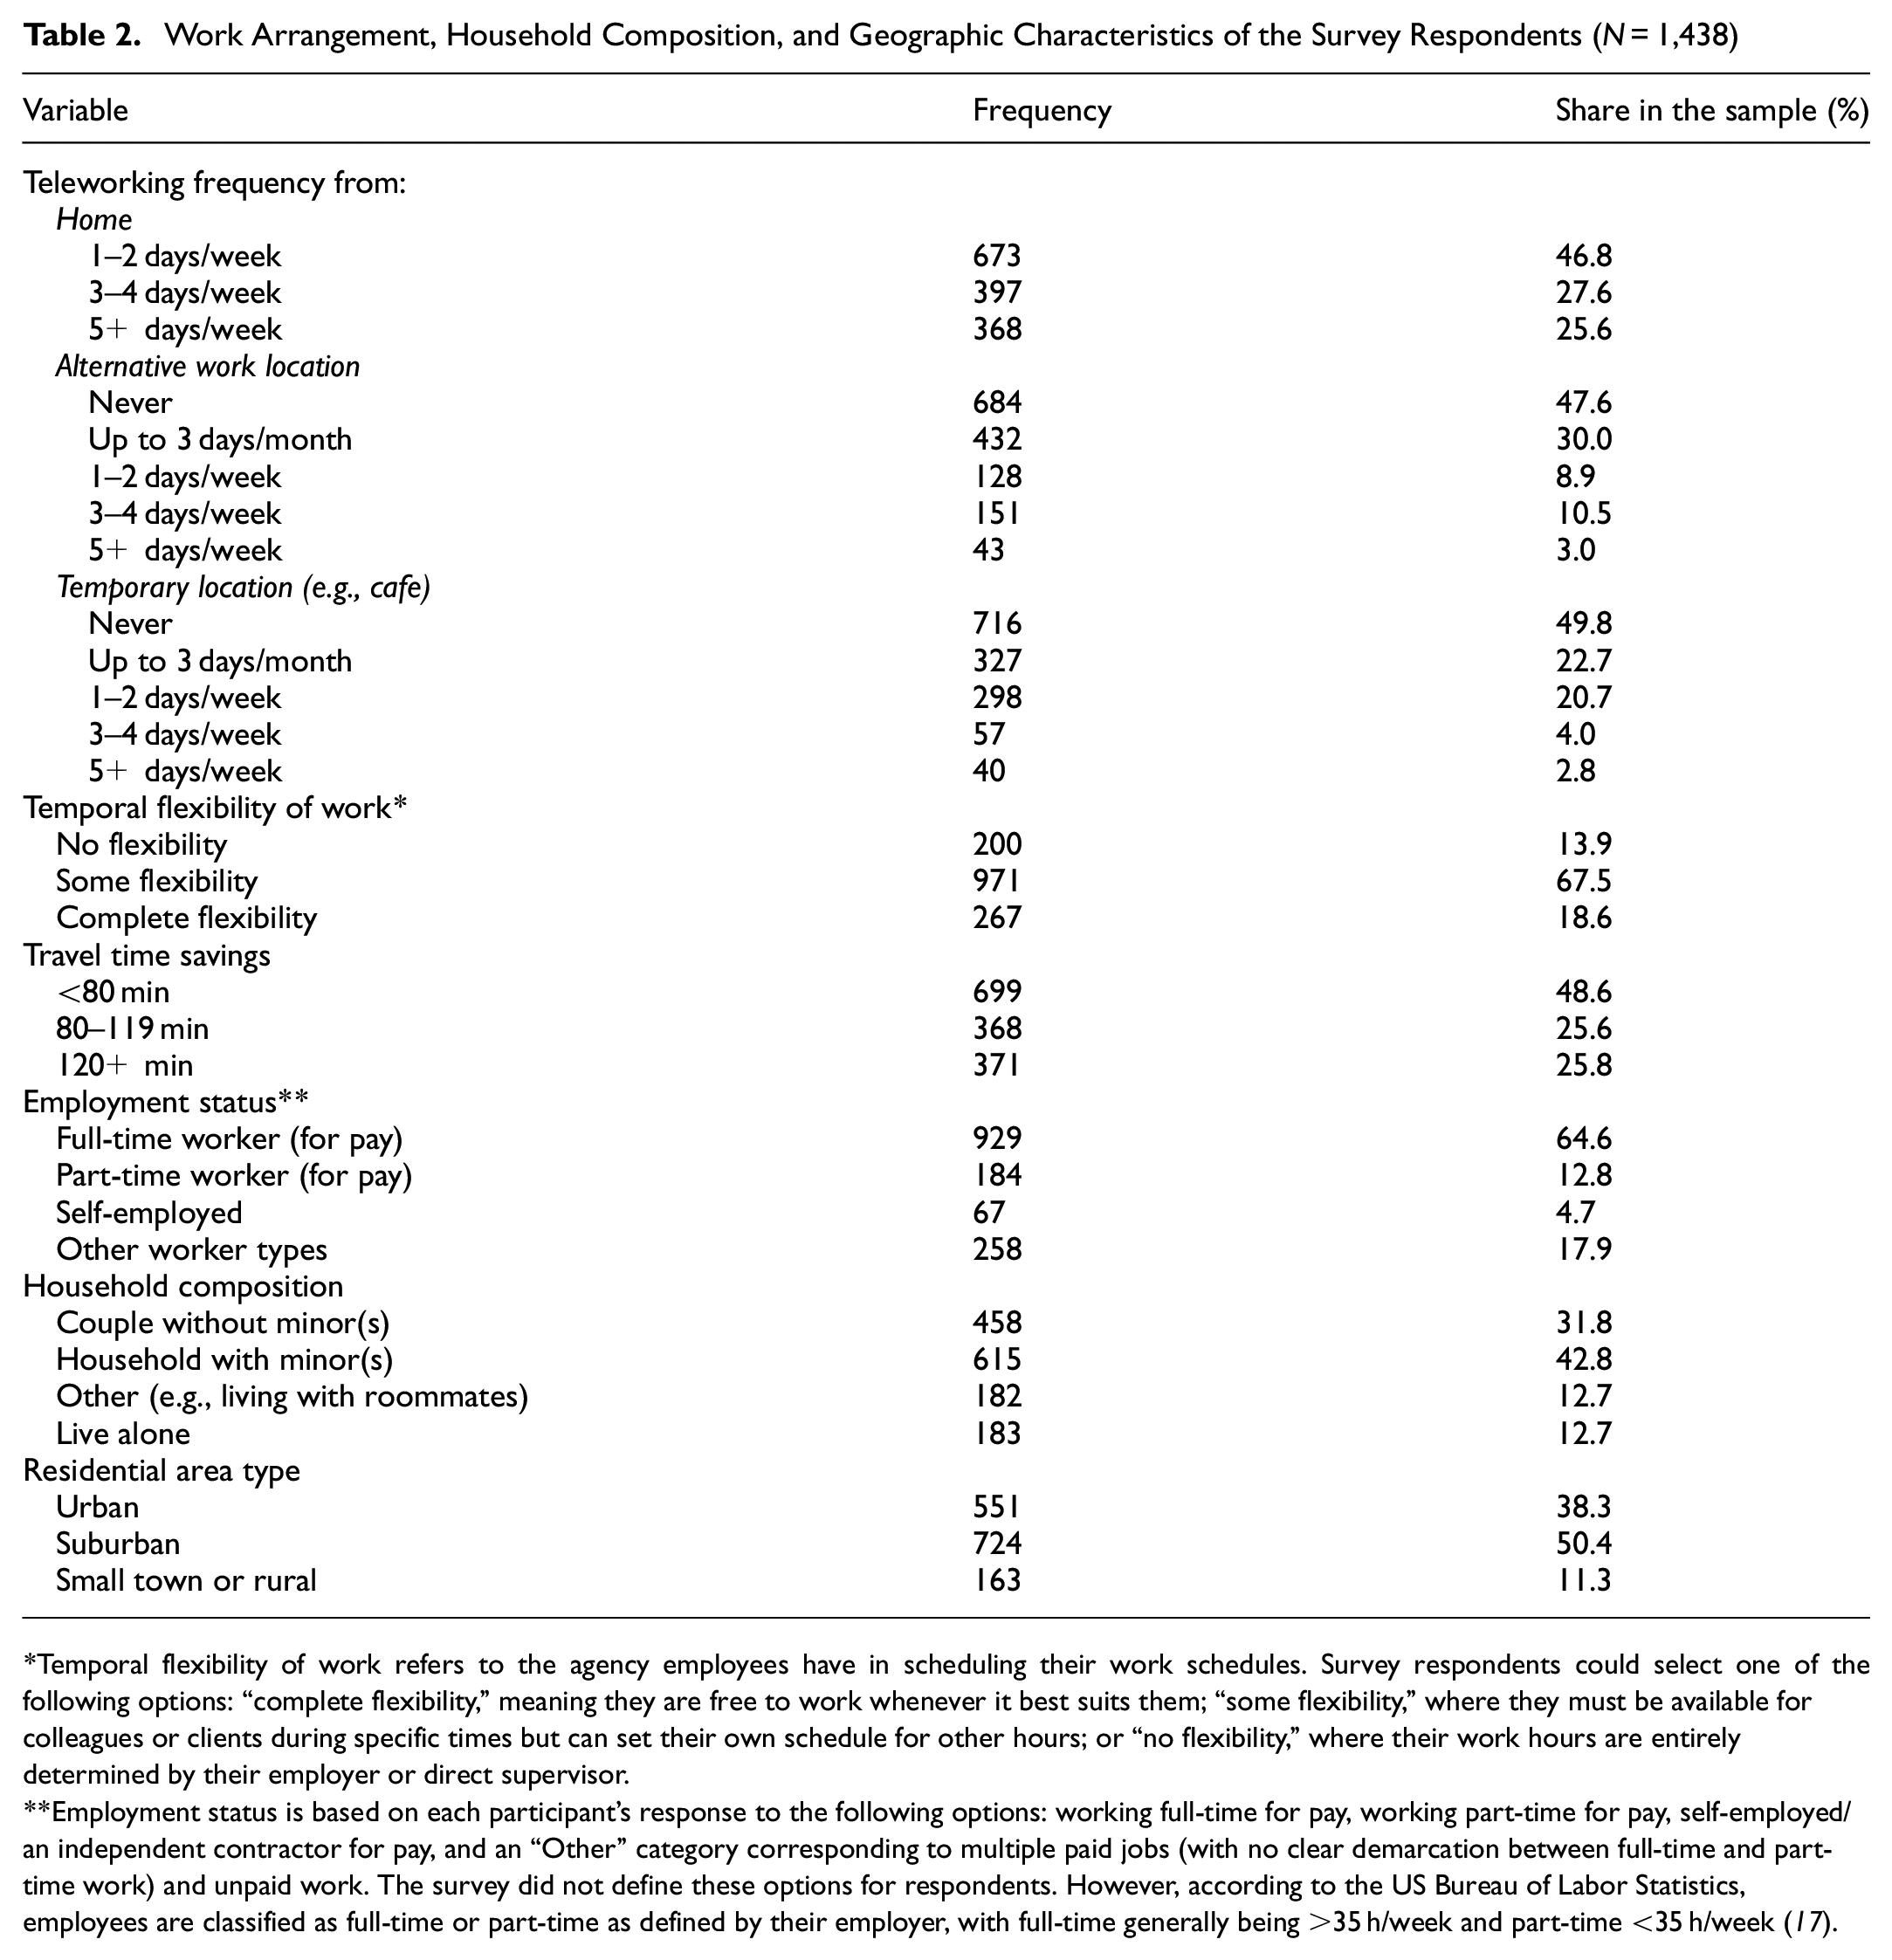
Temporal flexibility of work refers to the agency employees have in scheduling their work schedules. Survey respondents could select one of the following options: “complete flexibility,” meaning they are free to work whenever it best suits them; “some flexibility,” where they must be available for colleagues or clients during specific times but can set their own schedule for other hours; or “no flexibility,” where their work hours are entirely determined by their employer or direct supervisor.
Employment status is based on each participant’s response to the following options: working full-time for pay, working part-time for pay, self-employed/an independent contractor for pay, and an “Other” category corresponding to multiple paid jobs (with no clear demarcation between full-time and part-time work) and unpaid work. The survey did not define these options for respondents. However, according to the US Bureau of Labor Statistics, employees are classified as full-time or part-time as defined by their employer, with full-time generally being >35 h/week and part-time <35 h/week ( 17 ).
Endogenous Outcomes
We now turn to the focus of the study: the workers’ out-of-home activities on days they telework compared with days they work in-person. We excluded three activity purposes from our analysis—paid work, unpaid work, and religious/community meetings—as they showed little variation across telework and in-person workdays. We also dropped the “Other social, recreational activities” category because of a lack of responses. For ease in presentation, we will use the following compact labels: “Shopping” for grocery shopping; “Drop-off/pick-up” for dropping off/picking up others; “Social” for eating/drinking out; “Visit” for visiting friends/relatives; and “Exercise” for physical exercise out of home. Furthermore, we collapsed the original five-point scale into three levels because of relatively low percentages in the two extreme categories. We thus evaluate the shift in time allocation between telework and in-person workdays across six different out-of-home activities on a three-tier ordinal scale.
Figure 2 provides a descriptive visual of the endogenous outcomes. For all purposes, except running errands, the highest fraction of individuals report that their trip-making was about the same on telework and in-person workdays (see the percentages at the center of the horizontal bar diagrams above). Also, for all purposes, a higher fraction of respondents report participating in more activities on telework days than on in-person workdays (relative to participating in fewer activities on telework days than in-person workdays), with the asymmetry being particularly pronounced for shopping and errands.
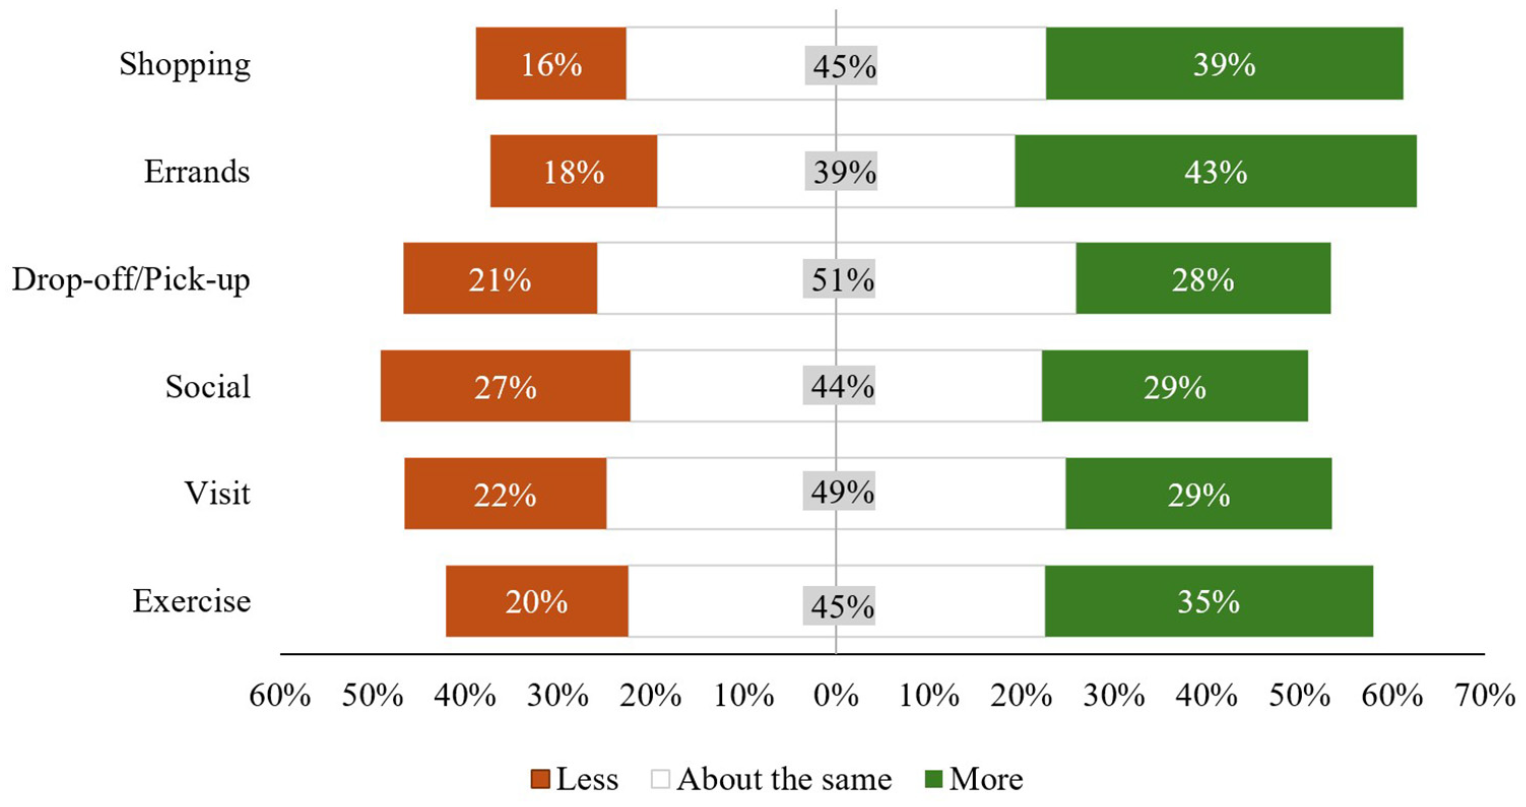
Out-of-home activity participation: on telework relative to in-person workdays (endogenous outcomes).
Methods
We use a MORP-TS model to analyze changes in participation in six out-of-home activities at three levels (less, same, more). This approach extends the traditional MORP model by incorporating threshold shifters based on the innovation proposed in Anderson et al., modifying thresholds to accommodate the observed multivariate clustering in the data across activity purposes ( 15 ). Specifically, based on bivariate cross-tabulations across six activities, we identified three clusters: “same-same” (where one activity purpose, if undertaken at the same level on telework and in-person workdays leads to the same level of participation in another activity purpose on telework days relative to in-person workdays), “less-less,” and “more-more.” For instance, individuals maintaining the “same” level of drop-off/pick-up activities on their telework days relative to their in-person workdays also tend to maintain the “same” levels for shopping, errands, and social purposes on their telework days relative to their in-person workdays (Cluster 1). Reduced shopping on telework days relative to in-person workdays clusters with reduced social visits on telework days relative to in-person workdays (Cluster 2), while more errands correlate with more shopping and social purposes (Cluster 3).
The “threshold shifters” function as flexible decision boundaries within the model, capturing complex patterns beyond correlations in latent variables. Figure 3 illustrates this with Person A and Person B. Person A does not choose the “same” level for drop-off/pick-up on telework and in-person workdays, while Person B does choose the “same” level for drop-off/pick-up.
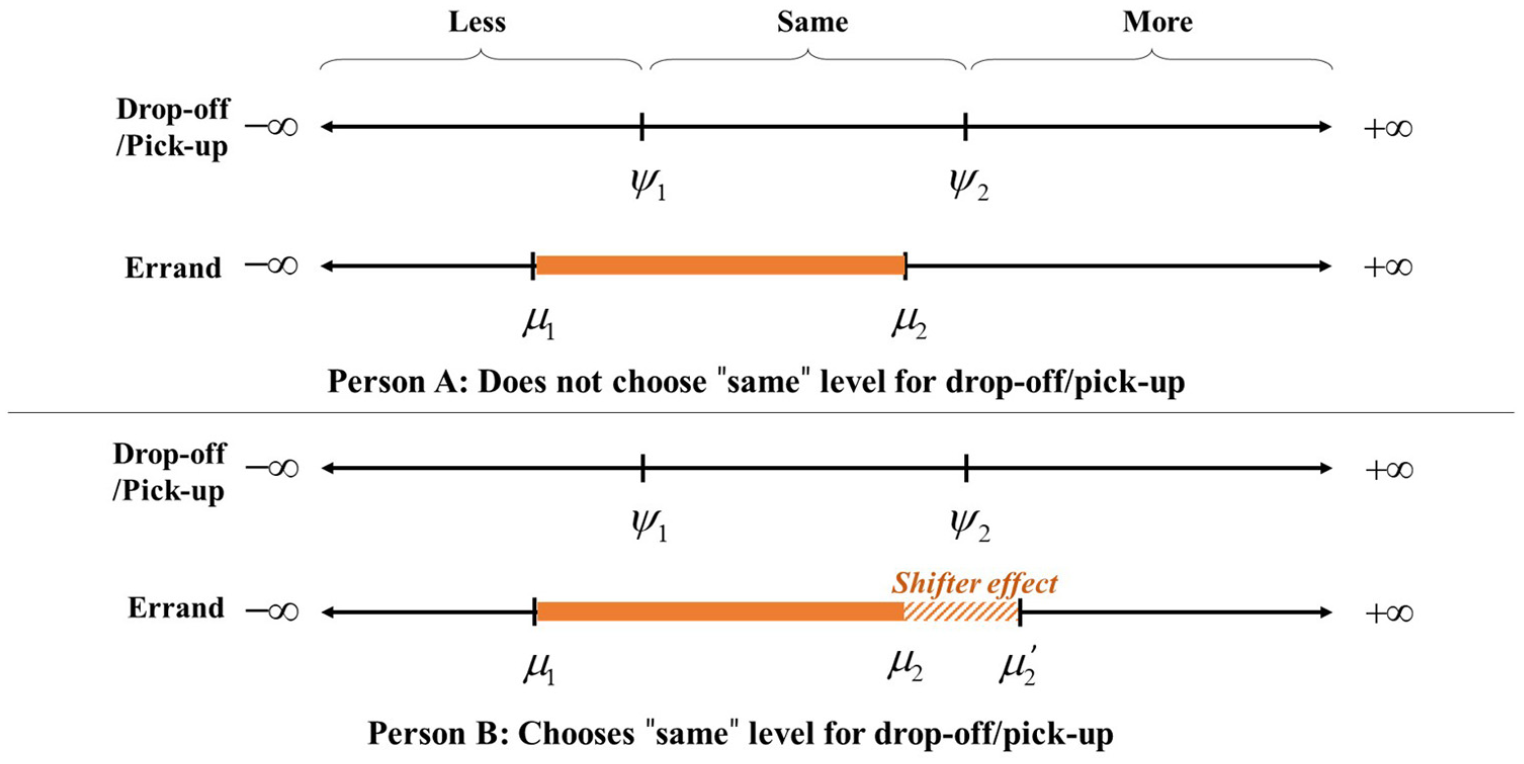
Illustration of the multivariate ordered-response probit model with threshold shifters approach.
For Person A, using the traditional MORP approach, the thresholds for errands are as shown, and errand category probabilities depend on where propensities fall relative to these thresholds. For Person B, using the new MORP-TS approach, the second threshold for errands (
Introducing activity-specific threshold shifters in our model does not create endogeneity bias, as potential interdependencies, such as those between drop-off and errands, are addressed by the multivariate framework’s unobserved correlation effects. This ensures that the MORP-TS approach accurately reflects observed patterns while maintaining statistical validity. While the detailed mathematical formulation is important, it is beyond this paper’s scope. For a comprehensive discussion of the MORP-TS approach, see Anderson et al. ( 15 ).
Results
The final model specification was defined by systematically testing various combinations of explanatory variables and removing those that were not statistically significant. Some variables that were not statistically significant at the 95% confidence level, but significant at the 85% confidence level or higher, were retained because of their intuitive relevance and empirical importance. Such variables are expected to provide valuable insights for future studies with larger sample sizes. However, note that the magnitude of these coefficients remained stable under several different specifications, providing further credibility to their effect size. In addition to the statistically significant variables reported in Table 3, we also tested variables such as race, education level, vehicle availability, and industry type, as well as factors related to teleworking, including the desire to telework and the positive perceptions of teleworking. These variables were not found to be statistically significant even at the 85% level after controlling for other exogenous variables and were, therefore, omitted from the final model specification.
Model Estimation Results for Multivariate Ordered-Response Probit Model with Threshold Shifters (N = 1,438)
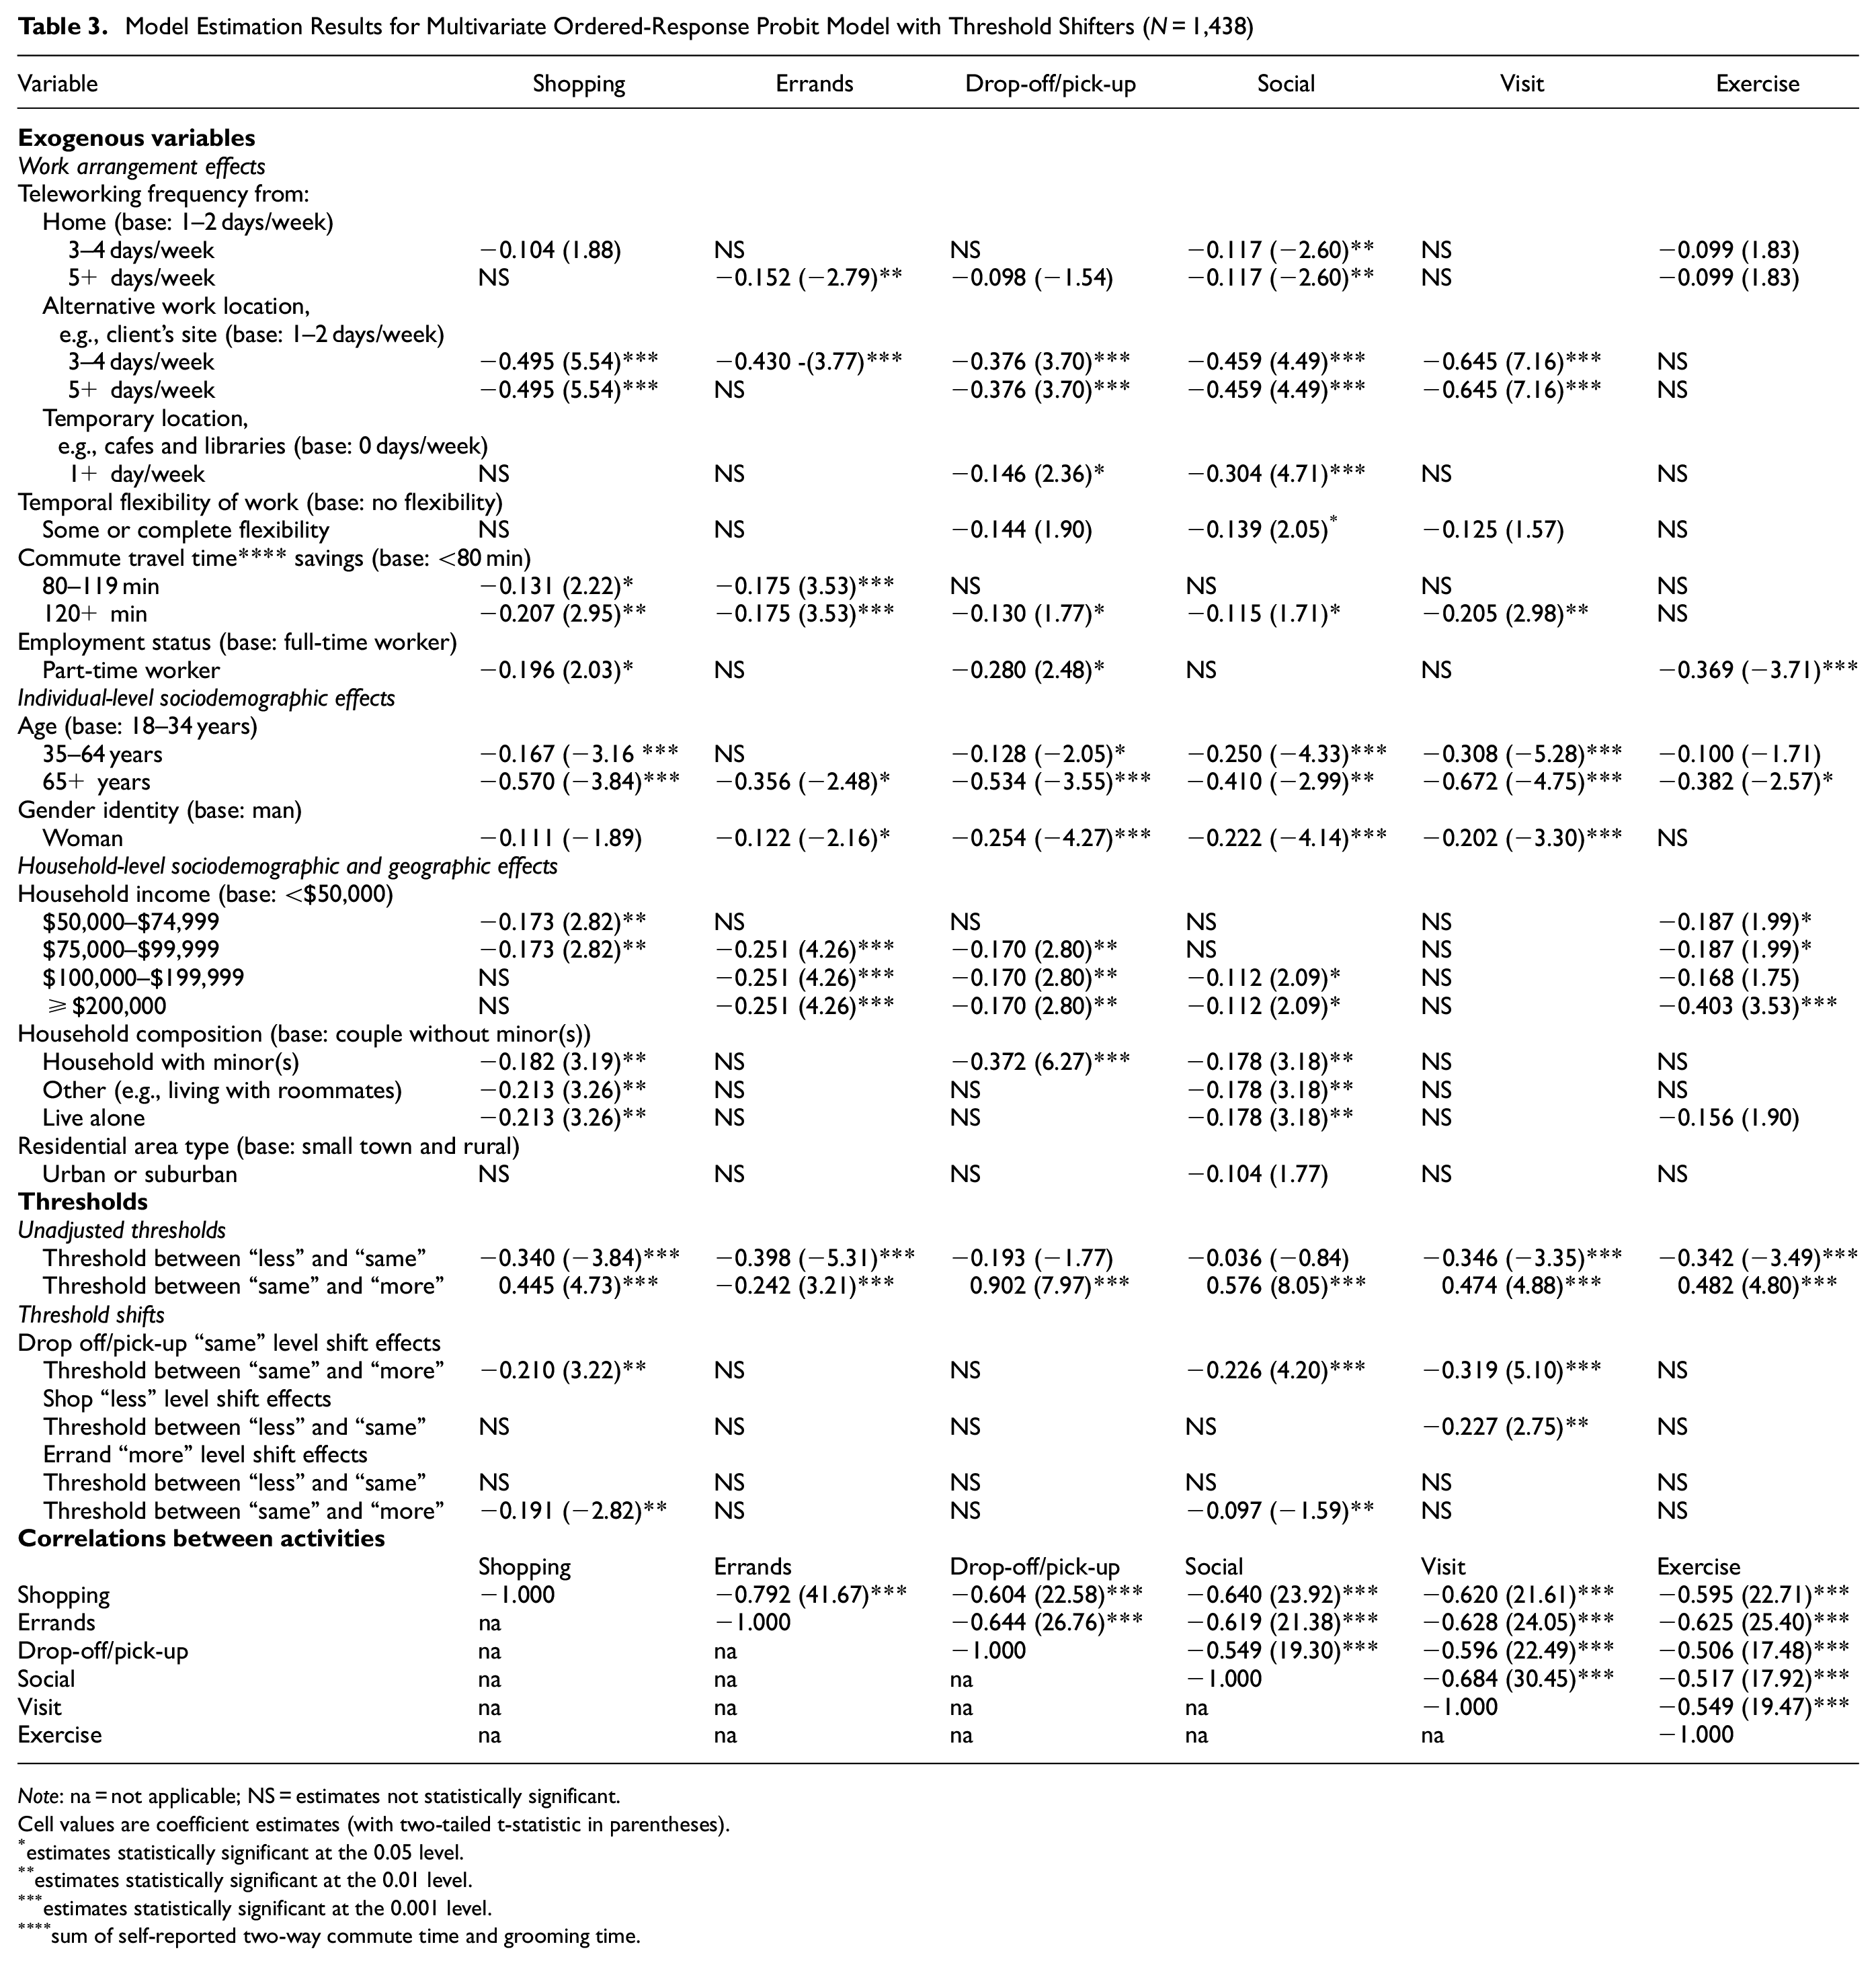
Note: na = not applicable; NS = estimates not statistically significant.
Cell values are coefficient estimates (with two-tailed t-statistic in parentheses).
estimates statistically significant at the 0.05 level.
estimates statistically significant at the 0.01 level.
estimates statistically significant at the 0.001 level.
sum of self-reported two-way commute time and grooming time.
Additionally, we tested both categorical and continuous functional forms for the numerical age variable, but the non-linear categorical specification yielded much better results. For teleworking frequency at various locations, we considered the original categorical frequency variable in the most disaggregated form of dummy variables and combined these dummy variables as appropriate based on statistical tests. Consequently, the base categories and levels reported for telecommuting frequency variables in Table 3 vary across locations and do not match the levels reported in Table 2.
Model Fit
To assess the improvement in data fit by jointly modeling time allocation to activities using the modified model with threshold shifters, we compare the results of the MORP-TS model (86 parameters) with those of a traditional MORP model (80 parameters) and an independent model of all six activities that does not account for jointness (65 parameters). The MORP-TS model considerably outperforms the traditional MORP model and independent models in all conventional goodness of fit measures. The MORP-TS model has a convergent log-likelihood value of −6321.35, while the corresponding values for the traditional MORP model and independent models are −6383.53 and −7496.52, respectively. The adjusted likelihood ratio index
Effects of Explanatory Variables
We now discuss the results from the estimation of the MORP-TS model presented in Table 3. In this model, the coefficients reflect the change in the propensity of activity participation levels between telework days and in-person workdays, rather than absolute participation levels on telework or in-person workdays. In this regard, as also discussed in The Data and Methodology section, our focus is on understanding the relative variation in activity patterns across telework and non-telework days, and how this relative variation itself may vary across population groups. Specifically, positive coefficients for an activity indicate higher propensity levels of participation on telework days compared with in-person workdays, while negative coefficients indicate the reverse.
Work Arrangement Effects
High levels of home-based teleworking (5+ days/week), compared with lower levels of teleworking (<5 days/week), lead to lower propensities of errands, drop-off/pick-ups, and social trips on telework days than on in-person workdays, while the reverse holds for exercise trips. The result for social and exercise activities remains even at the intermediate level of home-based teleworking (3–4 days per week) relative to a low level of home-based teleworking (1–2 days per week). This may be explained by the opportunities for trip-chaining for errands, drop-offs/pick-ups, and social activities when working from out-of-home. On the other hand, exercise activities appear to be the preferred activity as a “step out of home” during telework days.
Working at alternative “permanent” out-of-home locations other than the primary workplace on 3+ days a week (relative to working at alternative locations <3 days a week) is generally linked to a higher propensity of non-work activity (on telework days compared with in-person workdays) for all purposes, except errands and exercise. For errands, the higher intensity on telework days than on in-person workdays applies specifically to the intermediate level of working at an alternative location (3–4 days a week), while there is no difference in exercise trips between telework and non-telework days based on the intensity of working from an alternative location.
In contrast to the intensity-specific effects of alternative “permanent” work locations, teleworking from a temporary location (such as cafes) at any intensity level of 1+ days a week (compared with <1 day a week) leads to a higher propensity of drop-off/pick-up and social activity on telework days than on in-person days, which is reasonable because individuals are likely to choose temporary locations that facilitate drop-off/pick-up in particular.
Temporal flexibility in work schedules intensifies participation on telework days (relative to in-person workdays) in drop-off/pick-up, social, and visiting activities, suggesting that such temporal flexibility helps employees better balance work, household responsibilities, and personal leisure. Also, not surprisingly, longer commutes, which equate to greater time savings when teleworking, are linked to an overall increase in all out-of-home non-work activity purposes except for exercise. Finally, in the group of work arrangement effects, relative to those working full time, part-time workers tend to have a higher propensity to make shopping trips and drop-off/pick-up trips on their telework days, but a negative propensity for exercise trips ( 18 ).
Individual-Level Sociodemographic Effects
The oldest age group (65+ years) has the lowest propensity to participate more in non-work activities on their telework days, relative to their younger peers, possibly because of a reinforcement of the general tendency of older adults to be involved in in-home reading and related activities, especially given they have not gone out to work during their telework days ( 19 , 20 ). On the other hand, the youngest group (≤34 years) has the highest predisposition to partake in non-work activities on their telework days, again consistent with the generally higher intensity of out-of-home non-work participation among this younger age group ( 19 , 20 ).
Women are known to exhibit different travel patterns than men at all stages of life, and they tend to engage less in most out-of-home activities on their telework days ( 18 , 19 , 21 ). This may suggest that women, when teleworking, try to compartmentalize and focus on work, and leave participation in other non-work activities during trip-chains on their in-person workdays ( 21 ). Interacting the gender identity variable with the presence of children in the household did not reveal any significant relationships.
Household-Level Sociodemographic and Geographic Effects.
Individuals from higher-income households (relative to those from lower-income households) are generally more likely to engage in activities of all purposes, except visiting, on their telework days. While telework frees up time for all workers, the relative affluence of high-income individuals supports the pursuit of more activities. Household composition also plays a role in activity participation. On telework days, those who live in families with minors (relative to couples without minors) participate more in shopping, drop-off/pick-up, and social activities. This pattern may reflect a desire to undertake household maintenance activities to take advantage of the extra time available on telework days, while also engaging in activities that foster family interactions and allow for some “together time.”
Also, compared with couples without minors (base category), and similar to families with minors, households in other living arrangements, such as those living with roommates or living alone, participate more in shopping and socializing on their telework days. Only individuals living alone are likely to do more exercise on telework days, likely enabled by fewer household responsibilities.
Finally, as far as exogenous variable effects are concerned, individuals living in urban and suburban neighborhoods (compared with those in small town or rural neighborhoods) have a higher propensity for social activities on their telework days than their in-person workdays, which is perhaps simply a reflection of better access to restaurants, cafes, and bars in non-rural areas.
Thresholds, Threshold Shifters, and Correlations
The middle section of Table 3, titled “Thresholds,” presents the unadjusted threshold values and threshold shift effects. The unadjusted thresholds do not have substantive interpretations on their own. Several threshold shift effects are statistically significant. Although the magnitudes of these shift effects lack direct substantive interpretations, their directions are informative. The positive shift effect corresponding to those choosing the “same” ordinal category for drop-off/pick-up on the shopping threshold between the “same” and “more” ordinal categories has the impact of pushing this shopping threshold rightward, thus increasing the probability of the “same” ordinal response for shopping (as depicted in Figure 3). The implication is that those who do not have any change in drop-off/pick-up activity participations on their telework days (compared with their in-person workdays) tend to have a higher propensity to also participate in the “same” level of shopping on their telework days. Similar “same-same” clustering effects are evident between drop-off/pick-up, errands, and social purposes. Also, the positive shift corresponding to the “less” shopping ordinal category on the social “less-same” threshold implies that those who shop less on their telework days also socialize less on their telework days. The final threshold shift effect implies that the chance of selecting “more” for shopping and social activities increases when errands also show increased participation on telework days. These shifts help capture the interrelationships between participation levels across different activity types on telework versus in-person workdays, while also improving the data fit of the model.
As far as correlation effects are concerned, strong positive correlations are evident among the propensities of partaking in any pair of activity purposes. This suggests that individual-specific unobserved factors, such as extroversion, tend to manifest themselves in increased participation in all out-of-home activities, given extra time during the day as appropriated from commute time. Overall, these correlations provide insights into how intertwined the activity patterns of teleworkers are and highlight the importance of considering jointness in activity participation.
Policy Implications Using Average Treatment Effects (ATE)
As a post-estimation data analysis, the ATE metric measures the model-predicted change in the outcome of interest for an individual if their value for an exogenous variable changes from a base level (X) to a treatment level (Y). This metric allows analysts to compare the magnitude of the effects of different exogenous variables. To calculate ATEs, we categorize individuals in the sample according to specific levels of the exogenous variable in question and then, using the model estimates, predict the probabilities of increased (or decreased) participation in each activity purpose on telework days relative to in-person workdays. For instance, we first assign all individuals to the gender identity “man” (base level) and compute their probabilities of participating in each of the six out-of-home activities, averaging these probabilities across all individuals. We then repeat this process by assigning all individuals to the gender identity “woman” (treatment level). The difference in two average probabilities, expressed as the percentage change from the first average probability, indicates the percentage change in the probability of engaging in the activity of interest, resulting from the change in gender identity from man to woman.
The selection of base and treatment levels for our analysis varies by exogenous variable type. For binary variables, such as gender identity (man/woman) or employment status (full-time/part-time), we designated one category as the base level and the other as the treatment level. We applied a similar approach to multi-category variables that were consolidated into binary categories during estimation based on statistical significance patterns. These include temporal flexibility (no flexibility as base, and some or complete flexibility as treatment), teleworking frequency at temporary locations (0 days/week as base, 1+ days/week as treatment), and residential location (small town/rural as base, urban/suburban as treatment).
For variables with more than two categories or levels, such as teleworking frequency from home and an alternative work location, commute travel time savings, age groups, and household income brackets, we generally designate the lowest extreme category as the base level and the highest extreme category as the treatment level. Of course, the ATE effects can be computed between any two states of these exogenous variables, but that would lead to an explosion in the number of ATE effects. To reduce clutter and present overall trends of effects, we provide the ATE effects between the two extreme states for variables with more than two categories of levels. For example, in the case of commute travel time savings, we selected individuals saving <80 min per day as the base level (representing the minimum level in our estimation) and those saving 120+ min as the treatment level (representing the maximum level). With age groups, we set the category <35 years as the base level and >65 years as the treatment level. For income, however, while we use the lowest income category as the base level, we consider the income level of ≥$100,000 as the treatment state because the estimates in Table 3 are identical for five of the six activity purposes for income levels of ≥$100,000.
The selection of base and treatment levels for teleworking frequency was based on careful consideration of statistical significance patterns across different activities. We consistently used the reference category (lowest ordinal category) in modeling as the base level (1–2 days/week for teleworking frequency from home and ≤2 days/week for teleworking frequency from an alternative location). The treatment levels, however, were selected based on which teleworking frequency categories showed significant effects for each activity type in Table 3. Focusing on teleworking frequency from home we chose 3–4 days per week as the treatment level for shopping activities, since this was the only frequency category showing significant effects. For errands and drop-off/pick-up activities, we selected 5+ days per week as the treatment level, as this was the sole category demonstrating significant effects. A unique pattern emerged for social and exercise activities, where both 3–4 days and 5+ days per week categories showed significant, but equal effects. As a result, the ATEs for social and exercise activities were the same when comparing 1–2 days per week with either 3–4 days per week or 5+ days per week (see the two rows for “Home” in Table 4). The same logic applies to the ATE analysis of teleworking frequency from alternative work locations. In contrast, it does not apply to the temporary location variable because of its binary nature, as discussed before.
Average Treatment Effects
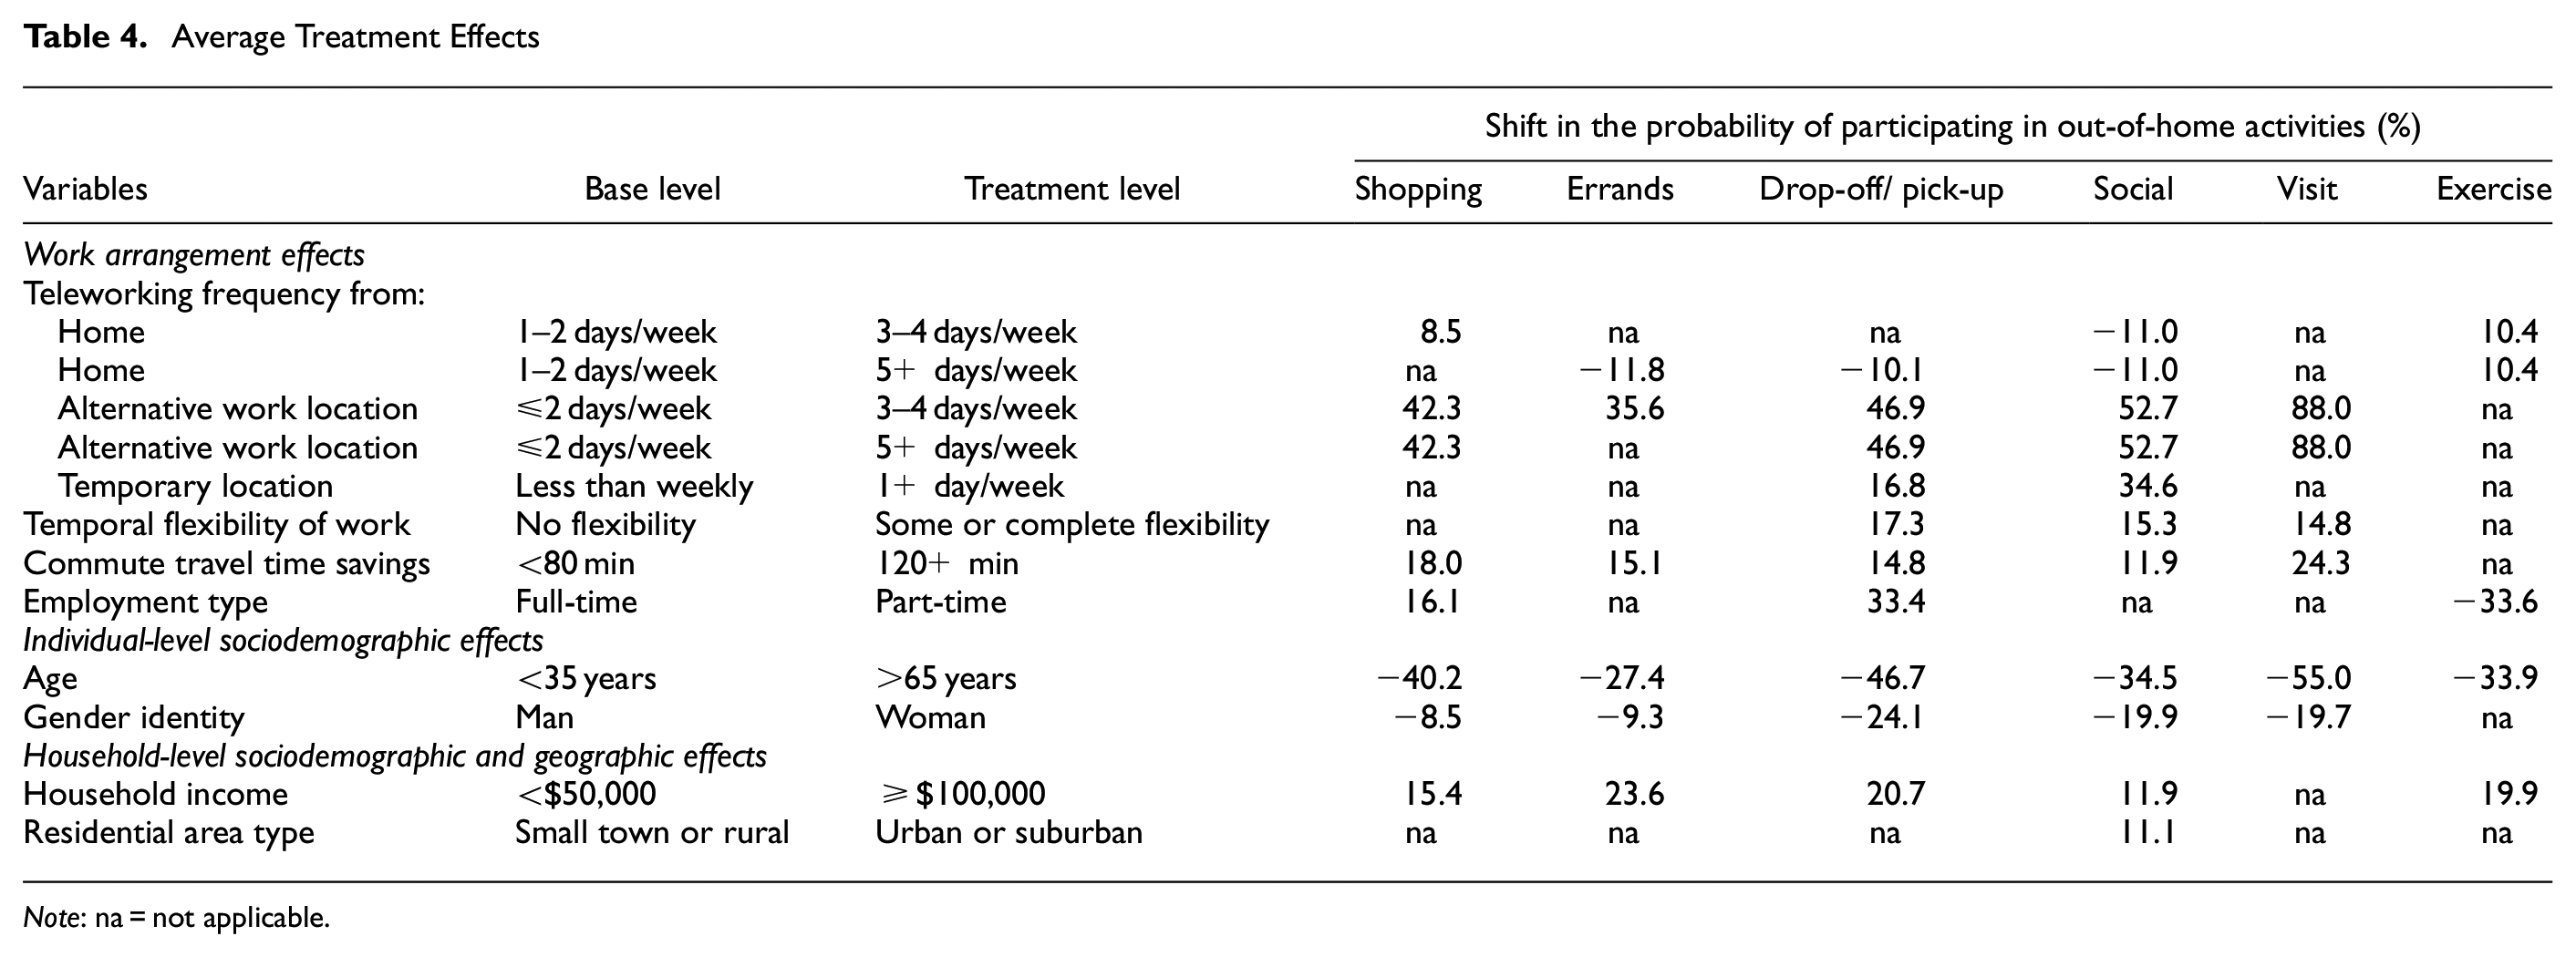
Note: na = not applicable.
Table 4 presents the results for selected, statistically significant estimates from Table 3. For instance, the numeric entry “Gender identity (social: −19.9%)” indicates that women are 19.9% less likely than men to engage in social activities on telework days than on in-person workdays. Other entries may be similarly interpreted. The ATEs in Table 4 shed light on how work arrangements and sociodemographic factors account for the changes in the engagement in maintenance and discretionary activities on telework days relative to in-person workdays. These findings inform planning and policy efforts directed toward estimating “induced” demand for non-work trips because of teleworking, as well as identifying travel equity concerns. For instance, those frequently working at alternative or temporary locations (e.g., client sites, cafes, and libraries) tend to engage in more activities on telework days. This behavior suggests trip-chaining or unique activity allocation strategies between telework and in-person workdays. Transportation planners need to monitor these temporal and spatial shifts in congestion and peak-hour traffic because of the induced demand.
Employers play an important role in adopting flexible work policies. As indicated in Table 4, flexible work schedules lead to increased participation in social activities on telework days, highlighting the potential for such policies to enhance work-life balance. Telework policies should also be tailored to different employment types (part-time/full-time). Offering part-time workers access to similar resources and support as full-time employees can help ensure that all remote workers benefit from enhanced work-life balance initiatives.
In the category of work arrangement ATEs, commute travel time savings resulting from teleworking lead to increased participation in a range of activities during telework days. Reduced commuting times can positively affect work-life balance, and policies that encourage telework (and thus reduce or eliminate commute times) can help workers reallocate time to personal and social activities, enhancing quality of life.
Within the group of sociodemographic variables, women and the elderly are found to engage less in non-work-related out-of-home activities on telework days. They make fewer trips for discretionary activities on those days. Further research is warranted to determine to what extent these lower levels of activity engagements on telework days are by choice (e.g., activity allocation strategies across days of the week) or because of constraints (i.e., unmet demand under constraints). Social norms on the role of different genders or lack of reliable transportation options in combination with poor access to activity locations may be at play.
Household income significantly influences activity participation, with those in households earning ≥$100,000 per year being likely to have higher engagement levels in both mandatory and discretionary activities on telework days than on non-telework days. Financial resources enable affluent individuals to participate in their preferred activities and improve work-life balance. Policymakers could support lower-income teleworkers by providing better access to fitness centers, wellness programs, and social opportunities. Additionally, individuals in urban or suburban neighborhoods tend to engage more in social activities on teleworking days than those in small towns and rural areas. This calls for renewed efforts to integrate land use and transportation planning to facilitate social activity participation of individuals on their telework days, which can then improve work-life balance and enhance quality of life. Supplementing telework policies with mixed land use (even in rural areas) and denser developments can not only reduce commuting stress, but also benefit individuals’ mental and physical health, potentially contributing to a healthier, happier, and more productive workforce. Of course, while mixed land use and denser developments may bring social benefits, they would also induce new trips. However, with accessibility-friendly planning, such as encouraging the use of active transportation and public transit, these additional trips can be made shorter and greener, even if they do not necessarily result in a net improvement in transportation efficiency from a traffic flow standpoint.
Conclusions
This study utilized a post-pandemic dataset of hybrid workers in California to explore how non-work activity participation on telework days differs from in-person workdays for individuals with a hybrid work location arrangement. The estimation of a MORP-TS model revealed that participation patterns across activity purposes are highly interrelated and vary significantly by work arrangements, as well as by socioeconomic and demographic attributes. Specifically, our results indicate activity participation differences based on location-specific teleworking frequencies, individual demographics, and household income/composition. These results highlight the need to improve urban transit infrastructure, promote mixed-use development, reduce commute times, support flexible work arrangements, and tailor initiatives to different employment types and sociodemographic groups. By addressing these factors, policymakers can create a more equitable and productive telework landscape and enhance work-life balance.
Our study has some limitations. First, our analysis uses ordinal data, which only allows us to provide qualitative insights into differences in activity participation levels (frequencies). Cardinal data could offer more tangible insights into impacts on trips by purpose (and by mode) and on miles traveled. Integrating such a “cardinal-level” analysis with trip data would enable an assessment of emissions, vehicle miles traveled, and trip rates. Second, including attributes such as job and residential density and points of interest in future models would also allow us to evaluate their impact on activity patterns. Third, future studies should investigate how the influence of socioeconomic and demographic attributes varies by teleworking type, frequency, and location through testing interaction effects and predicting changes for different clusters/types of worker.
Finally, teleworking is a multifaceted phenomenon that affects transportation decision-making at various timescales—short-term (day-to-day decisions such as whether to telework, its location, and timing), medium-term (weekly or monthly decisions, such as activity routines studied in this paper), and long-term (over several months or years, such as housing choices). Consequently, as post-pandemic patterns evolve, transportation planners should continue to monitor traffic trends and update travel demand models with the latest data and insights to better forecast future transportation scenarios.
Footnotes
Acknowledgements
The authors would like to thank colleagues at UC Davis and elsewhere, who contributed to the survey design, administration, data processing, and preliminary analysis. The authors are grateful to Lisa Macias for her help in formatting this document, and to three anonymous reviewers who provided useful comments and suggestions on an earlier version of this paper.
Author Contributions
The authors confirm contribution to the paper as follows: study conception and design: G. Circella, C. Bhat, A. Kothawala, A. Haddad, P. Loa, Y. Lee; data collection: G. Circella, P. Loa, Y. Lee; analysis and interpretation of results: A. Kothawala, A. Haddad, P. Loa, Y. Lee, G. Circella, C. Bhat; draft manuscript preparation: A. Kothawala, A. Haddad, P. Loa, Y. Lee, G. Circella, C. Bhat. All authors reviewed the results and approved the final version of the manuscript.
Declaration of Conflicting Interests
The author(s) declared the following potential conflicts of interest with respect to the research, authorship, and/or publication of this article: Chandra Bhat and Giovanni Circella are members of Transportation Research Record’s Editorial Board. All other authors declared no potential conflicts of interest with respect to the research, authorship, and/or publication of this article.
Funding
The author(s) disclosed receipt of the following financial support for the research, authorship, and/or publication of this article: Funding for California Mobility Panel’s 2023 survey was provided by the California Air Resources Board, the University of California (UC Davis) Institute of Transportation Studies Statewide Transportation Research Program (funded by the State of California through the Road Repair and Accountability Act of 2017, or SB 1), the California Department of Transportation, and the 3 Revolutions Future Mobility Program. Additional funding came from the US Department of Transportation through the National Center for Sustainable Transportation (NCST) (Grant No. 69A3552344814 and No. 69A3552348319) and the Center for Understanding Future Travel Behavior and Demand (TBD) (Grant No. 69A3552344815 and No. 69A3552348320).