
Abstract
Activity-based travel demand models (ABMs) have the capacity to represent emerging activity dimensions; however, they lack integration of physical and virtual activity spaces. This study introduces a novel ABM framework that captures the dynamic interactions between physical–virtual activity spaces and implements it within an integrated transport, land-use, and emission framework. The study develops information and communication technology (ICT) adoption models, such as internet access and device ownership, into the agent-based structure. Markov chain Monte Carlo (MCMC) and conditional probability algorithms are utilized to schedule activities in physical and virtual environment reflecting factors, such as work arrangements, employment status, mobility and ICT tool ownership. Comprehensive calibration and validation processes are performed to ensure that the model can generate population mimicking real-world conditions. A prototype version of the model is implemented for the Halifax Regional Municipality (HRM), Canada. A scenario simulation is conducted that examines the impacts of ICT tool and virtual work adoption on activity-travel patterns. Results show that increased ICT tool adoption significantly boosts the duration of virtual maintenance and discretionary activities while reducing time spent on mandatory activities. A 10% rise in virtual work reduces vehicle kilometers traveled (VKT) in HRM by 51,800 km/day and lowers carbon dioxide (CO2) emissions by 6.216 metric tons/day. The study confirms the complex, nonlinear impacts of ICT on travel, while showing the potential of virtual-work in reducing peak-hour travel and VKT. The developed tools in this study can aid policymakers in assessing the impacts of virtual activities on transport and land use systems and help achieve regional sustainability goals.
Progress in information and communication technologies (ICTs) has tremendously changed how we live, work, and travel ( 1 ). Individuals in the current digital age can work, study, shop, and socialize from anywhere anytime online, without the need for traveling to it. Activities are now fragmented in space (e.g., physical, virtual), location (e.g., in-home [IH], out-of-home [OH]), and time, thereby fundamentally altering daily activity-travel patterns ( 2 , 3 ). Activity behavior, such as participation, start time, time-allocation in each dimension have direct impacts on other dimensions and subsequent indirect impacts on social, economic, and environmental systems ( 4 ). Understanding these impacts is crucial for better management of transportation, land use, and energy demand across different geographical scales ( 4 , 5 ). Global populations are increasing, resources are diminishing, and alongside that social and environmental cost of travel is rising. There has been a growing interest in tools that can either reduce the costs of travel or reduce the need for travel entirely. ICTs have the potential to replace “mobility” with “accessibility” as access to activities can be provided using ICT tools, not solely travel modes ( 6 ). Research shows that ICTs offer tremendous prospects in curtailing and managing travel demand ( 7 ), therefore reducing energy consumption and pollution ( 8 ); however, its relationship with travel behavior, land-use, and traffic is intricate and multifaceted. To utilize ICTs for solving transportation problems, appropriate modeling frameworks need to be developed that can capture the interactions between telecommunications and activity-travel domains ( 5 , 6 ).
For estimating and simulating activity-travel behavior changes, activity-based travel demand models (ABMs) have been widely used by the researchers for the last four decades. They are large-scale modeling systems that simulate people’s mobility decisions to forecast travel demand and predict the transformation of transport and the land-use environment. The potential of ABMs in improving the exploration process of complex urban forms has resulted in the development of several extensive models throughout the years, such as Travel Activity Scheduler for Household Agents (TASHA) ( 9 ), A Learning-based Transportation Oriented Simulation System (ALBATROSS) ( 10 ), Comprehensive Econometric Microsimulator for Daily Activity-Travel Patterns (CEMDAP) ( 11 ), Agent-based Dynamic Activity Planning and Travel Scheduling (ADAPTS) ( 12 ), Coordinated Travel–Regional Activity Modeling Platform (CT-RAMP) ( 13 ), MetroScan ( 14 ), and Comprehensive Utility-based System of Activity-Travel scheduling Options Modelling (CUSTOM) ( 15 ), among others. ABMs have the capabilities of representing the emerging activity dimensions; however, researchers are still searching for the ‘correct’ framework that appropriately represents the multi-dimensional aspects of physical–virtual spaces ( 16 ). Virtual activities have direct impacts on in-person activities, but these effects are yet to be properly represented within ABMs. Fitting integration of in-person activities with virtual activities will enhance the modeling capabilities of ABMs and ensure appropriate representation of individuals’ mobility behavior in the digital age.
Furthermore, work arrangement decisions, deciding whether to work from home (WFH) online or commute to the office or both, play a pivotal role in determining activity chains and activity schedules of individuals ( 17 ). Flexible work arrangements are getting more popular among workers and will continue to influence their short-term (daily) and long-term (yearly) mobility choices. The travel patterns of cities are changing, particularly peak hour traffic. Teleworking is one of the major causes of this as people with different work arrangements travel at different times ( 18 ). Scheduling activities without accounting for these effects may lead to overestimating or underestimating activity-travel demand and generate incorrect estimates ( 5 ). In addition, internet access and ICT device ownership significantly affect activity-travel behavior, confirmed by research ( 19 ). For instance, smartphones with internet enable people to choose ridesharing or micromobility options, while a teleworker is likely to have access to the internet at home. Implementing these effects within ABM can improve model robustness, allow holistic analysis, and test ICT-related policy scenarios. For example, policymakers can examine how improving broadband access in rural areas to promote teleworking affects teleworking adoption, activity participation, and associated travel and energy patterns. As cities struggle to combat climate change, it is crucial to identify ways to utilize ICT-enabled activities to reduce the need for travel and thereby reduce auto use and subsequent traffic emissions ( 20 ). Implementing ICT tool adoption models and physical–virtual spaces within ABMs can build the platform for evaluating the efficacy of ICT to achieve community sustainability goals. ICT and transport systems are complex, and their interactions necessitate even greater complexity ( 6 ). By capturing the complex relationships between ICT and travel, resource allocation can be optimized, congestion can be better managed, and sustainable development at local, regional, and national levels can be promoted. Modeling capacities need to be advanced for capturing the trade-offs between physical–virtual spaces and their multi-domain interactions with individual and household characteristics, transport infrastructure, and built-environment features. There is a clear gap in modeling activity dimensions, such as space, tools, and location within ABMs, which if addressed can allow extensive investigation of the behavioral impacts of ICTs, comprehensive testing of policy scenarios, and assessing impacts on traffic network, energy use, and emissions (5, 6, 16). It will also enable tracking the evolution of activity-travel patterns under evolving working conditions and quantifying the transport benefits of virtual activities ( 21 ).
This study develops a new paradigm activity-based travel demand modeling framework that represents the multi-level interactions among individual and household travel choices in the long-term, medium-term, and short-term, incorporating physical–virtual activity spaces. It develops and systematically couples ICT-associated behavioral components, such as access to the internet and ICT device ownership within the agent-based structure. The adoption models determine the level of ICT adoption and what types of people use it. Implementing the modeling components allows for the examination of ICT adoption patterns while capturing influences on activity scheduling through effects and constraints. Furthermore, the study advances the activity scheduling process of conventional ABMs by implementing physical–virtual activity space interactions within the framework utilizing the Markov chain Monte Carlo (MCMC) method and conditional probability algorithms. It conceptualizes activity scheduling to be dictated by people’s work arrangement, employment status, mobility, and ICT tool ownership. A prototype microsimulation framework has been implemented for Halifax Regional Municipality (HRM), Canada that couples micro-behavioral models with dynamic traffic microstimulator and forecasts activity-travel demand, traffic patterns, and emissions. An activity-travel survey, called the 2022–23 Halifax Travel Activity (HaliTRAC) survey, was conducted to collect data for deriving and testing the models. A comprehensive calibration and validation of the simulator has been performed using the Canadian Census 2021 validating the models’ capacity to accurately predict travel behavior. The potential of the developed microsimulation tool is demonstrated through multiple scenario simulations focusing on ICT use and activity-travel impacts.
Literature Review
Impacts of ICT Use on Activity-Travel Patterns
There is a growing number of studies exploring the associations between ICT use and activity-travel behavior, particularly focusing on ICT and physical travel. Researchers unanimously reported that ICT use, and travel behavior are strongly inter-related and ICT tool ownership is governed by people’s socio-demographic characteristics. Ben-Elia ( 22 ) found that younger people tend to use smartphones more frequently and make more trips. Furthermore, increase in income has a positive association with virtual activity participation ( 23 , 24 ), while increase in age has a negative association ( 24 ).
Relating to activity-level impacts, Hubers et al. ( 25 ) found that ICT ownership and use is associated with more activity fragmentation. Wang and Law ( 26 ) adopted structural equation model (SEM) to analyze the impacts of ICT usage on activity time-allocation and travel behavior. They defined ICT use as the experience of using ICT devices for e-mail, internet services, and video conferencing for either business or personal purposes. Results showed that the use of ICT generates additional time use for OH recreation activities and increases trip-making propensity. Similar findings are reported by Lila and Anjaneyulu ( 24 ) that ICT generates more leisure activities.
In terms of travel-related impacts, Viswanathan and Goulias ( 27 ) examined effects of ICT use on travel time expenditures in a day. They applied multivariate multilevel analysis on the Puget Sound region data. It was found that internet use at home and in the workplace is associated with a reduction in travel times. In contrast, mobile technology use is associated with significantly longer travel times. On average, those who use cellular phones and laptops tend to travel 14 to 15 min more than do nonusers. This is because access to mobile technologies provides additional flexibility in daily activity schedules, which leads to more travel, or because increased travel leads to the possession and use of mobile technologies. Ben-Elia ( 22 ) found people with different levels of internet usage have differences in travel behavior. Mobile internet use correlates with longer commutes, while internet usage is associated with more distinct location visits. More recently, Ozbilen et al. ( 20 ) investigated the impacts of ICT use on auto, transit, and active transportation travel using Tobit regression models. The results showed that the effects of ICT use vary across the three travel modes. Respondents with higher durations of telework tend to spend less time on auto and transit, while respondents with higher durations of online shopping spend more time walking and bicycling.
Existing research so far has enhanced the understanding of the relationships between ICT use and travel. The effects of ICT use must be captured within activity schedules of individuals for more behaviorally realistic representation of modern-day travel habits. However, there is a gap in modeling ICT access within ABMs. ABMs treat travel as demand derived from the need for activity participation where travel is viewed in the broader context of activity scheduling in space and time ( 28 ). Within this theoretical framework, access to the ICT devices and internet allows people to participate in virtual activities and adjust their activity and travel decisions. Thus, ICT tool (device, internet) access models need to be integrated within ABMs that will control for the ability to participate in virtual activities.
Activity-Based Travel Demand Models and Physical–Virtual Activities
ABMs have revolutionized the understanding and prediction of travel behavior by focusing on the activities that drive travel rather than the trips themselves. For the past four decades, these models have been extensively developed and utilized for regional travel demand analysis. Developed by Arentze and Timmermans ( 10 ), ALBATROSS is a rule-based ABM that simulates activity-travel behavior using decision rules derived from empirical data. The model’s activity-scheduling process is guided by a hierarchical structure of decision rules that dictate the sequence, timing, and duration of activities. ALBATROSS emphasizes the role of constraints (e.g., time, spatial) and preferences in shaping activity schedules. The model iteratively refines these rules through a learning process, enhancing its predictive accuracy. ALBATROSS has been commended for its ability to simulate complex travel behaviors and adapt to changing circumstances. Bhat et al. ( 11 ) developed CEMDAP to simulate daily activity-travel patterns using econometric models. The activity-scheduling process in CEMDAP involves generating a set of potential activities and then selecting and scheduling them based on utility maximization principles. The model considers various factors, including socio-demographic characteristics, spatial attributes, and temporal constraints, to determine the optimal schedule for each individual. CEMDAP’s flexibility in accommodating different types of activities and constraints makes it a versatile tool for travel demand analysis. Florida Activity Mobility Simulator (FAMOS), developed by Pendyala et al. ( 29 ), is an ABM designed for the state of Florida. The model’s activity-scheduling process involves generating activity patterns using a combination of rule-based and utility-based approaches. FAMOS incorporates a detailed representation of time-use patterns, allowing for the simulation of complex activity sequences and travel chains through a prism-constrained activity simulator. The model also accounts for joint activities and travel among household members. ADAPTS, developed by Auld and Mohammadian ( 12 ), is another agent-based model that simulates daily activity-travel patterns by incorporating dynamic activity planning and travel scheduling. The model’s activity-scheduling process involves agents making decisions based on preferences, constraints, and environmental factors. ADAPTS stands out for its ability to simulate real-time responses to changes in the traffic network. However, the model’s reliance on predefined rules for decision-making may limit its flexibility in capturing the full range of human behavior. Roorda et al. ( 9 ) developed TASHA to simulate activity-travel patterns for the Greater Toronto Area (GTA). The model’s core is its activity-scheduling module, which generates daily schedules by balancing household and individual constraints. TASHA introduces a utility-based approach where each activity is assigned a utility value based on its importance and satisfaction level. The scheduling process uses a sequential decision-making framework, adjusting activities dynamically based on previous decisions. TASHA’s strength lies in its ability to account for intrahousehold interactions and shared activities, providing a more comprehensive view of household travel behavior. Developed by Auld et al. ( 30 ), Planning and Optimization Language for Agent-based Regional Integrated Simulations (POLARIS) is an integrated activity-based travel demand and network simulation platform developed to model the complex interactions between travel behavior and network performance. Its activity-scheduling process incorporates a dynamic, agent-based framework where individuals generate daily activity schedules based on personal preferences, constraints, and real-time network conditions. POLARIS emphasizes the flexibility and adaptability of activity plans, adjusting them in response to evolving traffic conditions and unexpected events.
One example of open-source activity-based travel behavior modeling software is ActivitySim, an activity simulator for millions of individual agents each characterized by a set of demographic attributes that is based on US census. Within its modeling framework, the input data are synthetic households and individual, land-use, and traffic network, and the output are daily travel decisions of each individual. Daily travel decisions include activity destinations, time of day, purpose, and travel mode. ActivitySim has been developed to analyze the interrelationships between travel demand and transport infrastructure, and have been applied for emergency scenarios, such as hurricane evacuations ( 31 ). CT-RAMP, developed by Vovsha et al. ( 13 ), is another well-known ABM integrated within the Atlanta Regional Commission’s travel model. It utilizes a synthetic population to simulate daily activity patterns and travel decisions. The activity-scheduling process in CT-RAMP involves several interdependent components, including activity generation, time-of-day choice, and tour formation. Activities are scheduled based on a hierarchical structure where mandatory activities (e.g., work, school) are prioritized, and discretionary activities (e.g., shopping, leisure) are scheduled around them. The model employs Monte Carlo simulation to randomly assign activity start times and durations, ensuring variability and realism in the simulated schedules.
In recent years, the integration of virtual activities into ABMs has gained attention owing to the increasing prevalence of telecommuting, online shopping, and virtual social interactions. Few studies have incorporated virtual activities, particularly teleworking, within their models. Hensher et al. ( 14 ) used MetroScan, an integrated transport and land-use model, customized to include teleworking probabilities in Australia (2020–2023). They estimated a mixed logit commuter mode choice model with options including WFH, no work, and seven commuting modes across days and times. The model predicted WFH probabilities, which were then analyzed using a constrained linear regression to identify key influencing factors. Wang et al. ( 15 ) developed an econometric framework of jointly modeling daily activity scheduling, that is, activity type, duration, and location choices, known as the CUSTOM system and travel mode choice based-on random utility maximization behavior. The joint model captures workers’ daily activity-travel demand under telework, no-telework, and hybrid arrangements, using 2021 data from the GTA. Although their model shows promise with reference to capturing telecommuting-induced activity-travel demands, it is an individual-based model. Intra or inter household interactions are not captured within their framework. Furthermore, their model gives mandatory and discretionary activities the same scheduling priority, which is not consistent with the real-world decision-making process. Although these models represent significant progress, gaps remain in fully capturing the range of physical and virtual activity space interactions. No existing ABM completely integrates the co-existence of physical and virtual environments within activity-scheduler and implementation efforts within integrated systems framework is rare. Addressing this gap will enhance the accuracy and potential of ABM in an increasingly digital world. To address the research gaps, this study advances ABMs by implementing physical–virtual activity spaces in daily activity-scheduling following an integrated approach, capturing the effects of ICT tool ownership, work arrangements, and lifestyle choices.
Methodology
Modeling Framework
This study extends an integrated transport, land-use and emission (iTLE) systems framework by implementing micro-behavioral models of ICT adoption and physical–virtual activity spaces. iTLE is a life-history oriented agent-based microsimulation platform that can perform longitudinal simulation of travel behavior, conduct complex policy scenario analysis, and analyze impacts on activity-travel patterns and traffic network. Behavioral process mechanisms are illustrated using agent-based simulation, incorporating the multi-domain (e.g., intra and inter household) interactions between agents’ (individuals and households) decisions. It has four primary modules, which are long-term decision simulator (LDS), medium-term decision simulator (MDS), short-term decision simulator (SDS), and the traffic flow simulator (TFS), as shown in Figure 1.
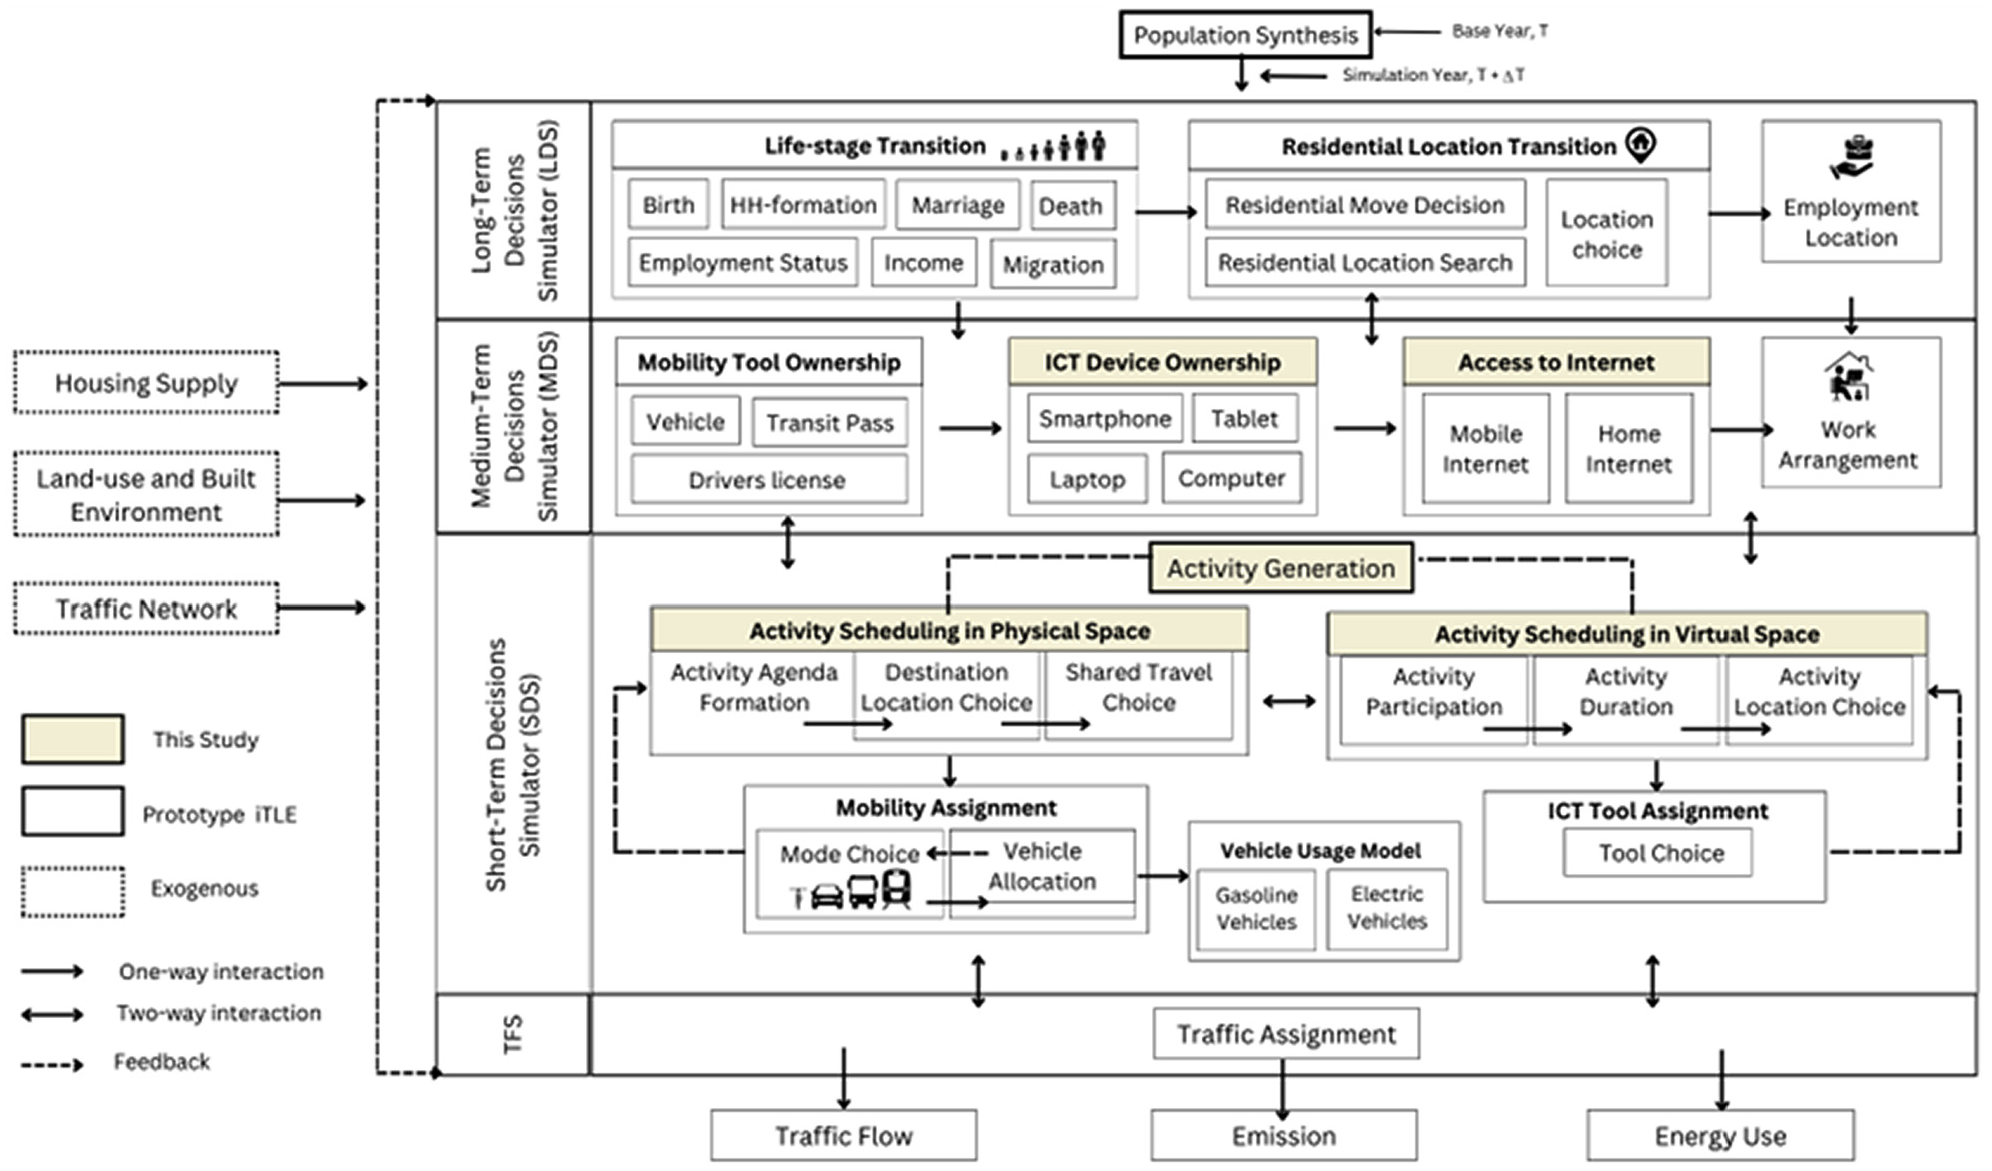
Methodological framework of the integrated transport, land-use, and emission (iTLE) model.
The iTLE execution starts with the population synthesis component that generates micro-level data for the entire HRM region, serving as input for the microsimulation platform. Next, in each yearly time-step, populations’ characteristics and their choices/decisions are simulated utilizing heuristics and micro-behavioral models based on utility maximization principles. iTLE is an integrated model where behavioral submodules are coupled using one-way interactions, two-way interactions, and feedback mechanisms, mimicking the interconnected nature of the real-world decision-making processes. Various long-term (yearly) decisions related to households and individuals are simulated within the LDS module. The LDS annually updates the simulated population to replicate life-stage transitions among agents, such as birth, ageing, changes in income, employment, marital status, household formation, migration, and death. The process employs heuristic and stochastic methods, using probabilities derived from provincial and national data. For detailed information on the calibration and validation of these life-stage transitions, refer to Fatmi and Habib ( 32 ). The residential location transition process involves three household-level stages: mobility decision, location search, and location choice. First, households decide to move or stay using a binary logit model. Movers then search available parcels, and finally, select a residence using a multinomial logit model. The model incorporates modal accessibility via logsum values from the mandatory mode choice model, enhancing the accuracy of predicted household spatial distribution ( 33 ). The employment location model is exogenous and simulates the office location of employed individuals. The MDS module simulates the decisions that are made semi-annually or quarterly. Household-level mobility tool ownership module consists of a three-stage process: vehicle ownership state, vehicle transaction, and vehicle type choice, estimated using discrete choice models ( 34 ). Additionally, individual transit pass and driving license ownership are estimated using binary logit models. The ICT device ownership and access to internet models are developed in this study and described in the section “ICT tool ownership—binary logit models”. The work arrangement component determines the work arrangements for employed individuals, either in full-time or part-time positions. This includes options for full WFH, no WFH, or a hybrid arrangement. The choices are modeled using the mixed logit (MXL) modeling approach ( 21 ). A detailed estimation procedure and functionalities of the LDS submodules are described in Habib and McCarthy ( 33 ).
Next, SDS simulates activity-travel decisions for a typical weekday for each agent. Activity generation, agenda formation, and scheduling processes incorporating physical–virtual spaces are conceptualized and implemented in this study, and their development processes are described in the section “Activity scheduling in physical and virtual spaces”. Activity destination location choices are estimated through conditional logit models, travel companionship and mode choice through variable choice set MXL, vehicle usage model using MXL and ICT tool assignment are carried out through heuristics ( 35 ). The vehicle allocation model captures intra-household interactions for vehicle use, while the shared travel choice model captures intra and inter-household interactions for activity companionship. A complete 24-h activity-travel diary for each individual agent is generated by the iTLE SDS module. A detailed estimation procedure and functionalities of the SDS submodules are described in Khan and Habib ( 36 ). The short-term decisions affect long-term and medium-term decisions (vice versa) through feedback established between behavioral components. The SDS outputs are used as inputs in the TFS module to analyze traffic network impacts. Files such as the origin-destination (OD) matrix, trip start time, origin TAZ, destination TAZ, and travel mode are fed into the TFS module for traffic microsimulation. SDS and TFS are coupled by preparing OD matrices for required modes (e.g., auto, transit) and start hours using an extended two-way table algorithm within iTLE, based on individuals’ travel choices in the SDS. This allows efficient spatial and temporal traffic network analysis. iTLE is compatible with various traffic simulation platforms, including PTV VISUM. Additionally, a feedback loop between TFS and LDS captures the impact of traffic conditions on activity planning, enhancing travel demand predictions ( 37 ). Housing supply, land-use, built-environment, and traffic network are exogenous variables in the system. iTLE was validated for the years 2016, 2018, and 2021 against Census and travel surveys ( 21 , 33 , 38 ). Developed in C#.NET using Visual Studio 2019, iTLE employs the model–view–viewmodel (MVVM) framework to separate the user interface from program logic. Its modular design allows modifications without altering the entire structure. A one-year iTLE run takes about 15 min on a Core i9-13900 processor with 64 GB of RAM, on a 64-bit Windows 11 system.
ICT tool Ownership—Binary Logit Models
Six separate binary logit models (BLMs) are developed to estimate the probabilities of an individual (aged 15 or older) owning a specific technology or having access to a particular type of internet. BLMs are widely accepted for analyzing binary outcomes and are commonly used in choice modeling research ( 39 ). In this context, the binary choices are ownership of a smartphone, laptop, tablet, desktop, access to mobile internet, and home internet. The independent variables include individual characteristics (age, gender, employment status), household characteristics (size, income), and built-environment variables (urban or non-urban residence). Within the framework, the probability (Pi) of an individuals’ ownership of an ICT tool (i) is defined as follows:

The predictors, Xs, are the associated factors to ICT tool ownership, and their respective coefficients are represented by the βs. Several goodness of fit measures are reported, including the log-likelihood, McFadden pseudo R-squared, and Akaike information criterion (AIC) to validate the model. The log-likelihood, LL, compares the outcomes (y = 1 if owns ICT tool and y = 0 otherwise) with the predicted probabilities according to the following equation:

Here, the coefficients, βs, are obtained by maximizing the log-likelihood function.
Activity Scheduling in Physical and Virtual Spaces
The implementation of physical–virtual activity spaces within iTLE involves the following steps (illustrated graphically in Figure 2):
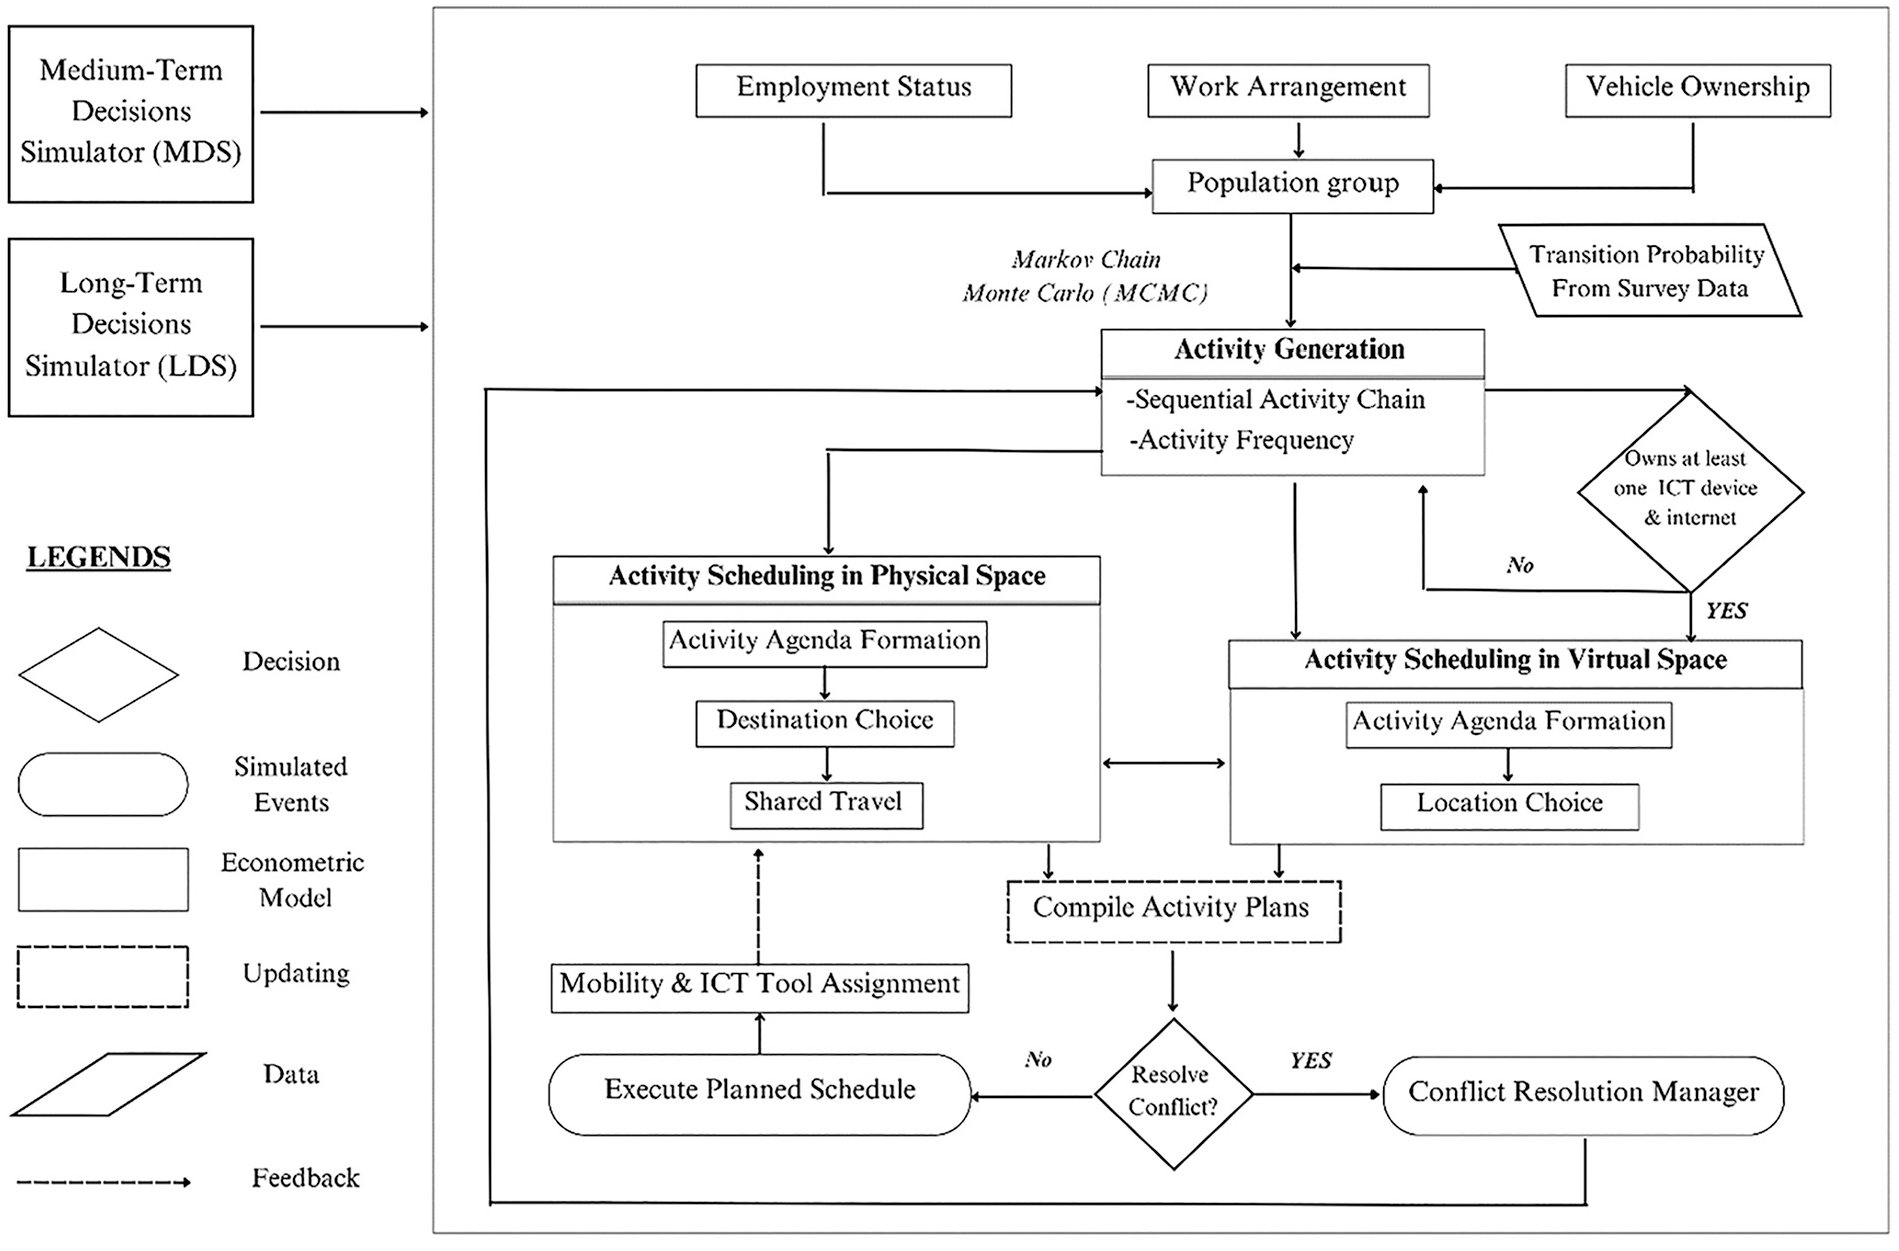
Activity scheduling process in integrated transport, land-use, and emission (iTLE) accommodating physical and virtual spaces.
First, individuals are categorized into 14 population groups based on their employment status, work arrangement, and vehicle ownership status. The groups are as follows: 1) full-time employed+ no vehicle, 2) full-time employed + fully working-from-home + one vehicle, 3) full-time employed + fully working-from-home+ more than one vehicle, 4) full-time employed+ hybrid working + one vehicle, 5) full-time employed+ hybrid working+ more than one vehicle, 6) full-time employed+ fully working-at-workplace+ one vehicle, 7) full-time employed+ fully working-at-workplace+ more than one vehicle, 8) retired+ no vehicle, 9) retired+ one vehicle, 10) retired+ two vehicle, 11) retired+ more than two vehicle, 12) part-time employed, 13) student, 14) unemployed.
Activities are categorized into 12 groups considering both physical and online environment: 1) OH work, 2) IH work (virtual work), 3) OH school, 4) IH school (virtual learning), 5) OH shopping (routine shopping and shopping for major purchases), 6) IH maintenance/discretionary (e.g., online shopping, online social interactions), 7) escort (drop-off and pick-up passengers), 8) personal business (including work and household-related errands, healthcare, civic/religious activities), 9) dine out (eating at restaurants), 10) recreation (including visiting friends/relatives and entertainment activities), 11) IH sleeping/meals (mid-day), 12) IH sleeping/meals (night).
The activity-scheduling process in iTLE incorporates a MCMC approach to model individuals’ daily activity sequences. This process accounts for substitution, complementarity, modification, or neutrality between physical and virtual activities, ensuring that transitions between activity types reflect real-world behavioral patterns ( 40 ).
In this framework, an individual’s next activity is probabilistically dependent on their current activity ( 41 , 33 ), effectively capturing the dynamic transitions between physical and virtual environments. For example, if a person has already attended multiple virtual meetings in a day, their next meeting for the day will more likely be virtual rather than in-person. Conversely, if they have recently engaged in an OH shopping trip, they may be more inclined to undertake another outdoor activity, such as dining at a restaurant or visiting a park. To operationalize this process, iTLE SDS employs MCMC-based transition matrices specific to different population segments, categorized based on factors such as employment status, work arrangement, and vehicle ownership. These transition matrices define the likelihood of moving from one activity to another, allowing for realistic sequencing of daily activities.
MCMC allows random sampling of activities from the transition probability distribution that maintains the probabilistic dependence between two consecutive activities by creating a Markov chain. The MCMC technique generates each individual’s activity chain (combination of all activity types) in a day ( 28 ). Here, Y is the activity that an individual perform at time t and s is the set of all possible activities. According to Markov chain formulation, the conditional probability to perform an activity Yt+1 based on the current activity Y can be written as:
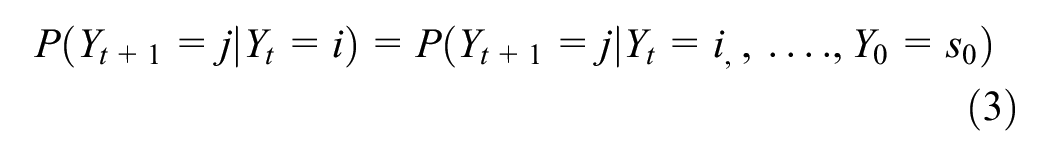
where the Markov property holds, meaning that the next activity is only dependent on the current activity and not on the full sequence of past activities. The transition probability matrix P, which governs these activity transitions, is structured as:
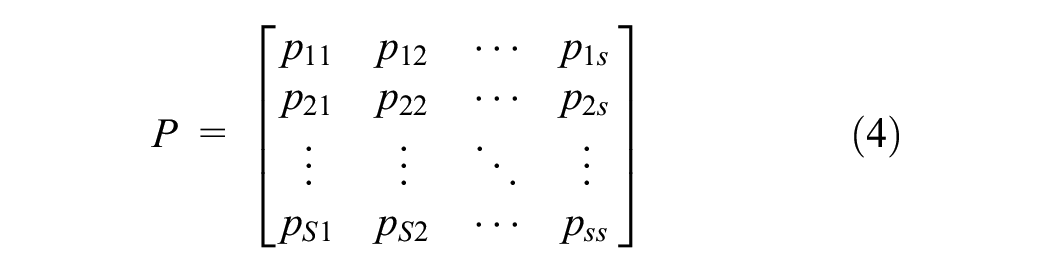
where pij = P(Yt+1 = j | Yt = i), represents the probability of transitioning from activity i to activity j. The sum of transition probabilities for each row must satisfy the following condition ensuring that the probability of transitioning to any of the possible next activities sums to one.

The MCMC transition matrices are specific to different population groups. If an individual belongs to population group g, then their activity sequence follows a segment-specific transition matrix Pg:

The transition probabilities are calibrated separately for each group using empirical data from the HaliTRAC survey. The transition probabilities are estimated by measuring the occurrences of transitions between each pair of activity types.
iTLE starts individuals’ daily activities at 3 a.m., selecting the first activity using the Monte Carlo method. Subsequent activities are generated sequentially from conditional transition probabilities, including both physical and virtual activities. The process continues until an “end-of-day return home activity” is generated, marking the end of the day’s activities. Sequential activity types and frequency forms a complete activity program. After generating activity programs, activity agendas are formulated where activity durations are simulated based on the total number of activities. Each activity’s duration is drawn from the joint frequency-duration distribution of the corresponding activities. In-person activities have OH locations, while virtual activities are set at home. Travel companionship is determined by a shared travel component. The activity scheduling process features an activity conflict resolution manager (A-CRM) to address conflicts like overlapping or extended activities, adjusting plans accordingly. Each household member prunes their schedule to end by midnight, removing the lowest priority activities if schedule exceeds 24-hours. Priorities are set as follows: work, school, escort, personal business, and others, with longer activities within a category given higher priority. Activity scheduling in physical-space interacts with the virtual-space to form a complete 24-h schedule of each individual’s activities.
Following activity scheduling, the activity tool assignment process is executed. For physical activities, the mode choice determines tour-level travel mode, and if auto travel is chosen, a vehicle is assigned from the household’s available fleet. Tours are formed by combining the activity chains and a new tour is formed after an intermediate IH activity. For virtual activities, an ICT device is randomly assigned from the available pool determined by the MDS ICT device ownership model. Participation in virtual activities requires owning at least one ICT device and one type of internet connection, either mobile or home. If no ICT tool ownership is found, the activity program is re-estimated with only in-person activities.
Calibration and Validation
After incorporating the behavioral models, an extensive calibration process is conducted to ensure that iTLE accurately represents real-world travel behavior. This process involved iteratively adjusting model parameters, refining heuristic rules, and incorporating empirical constraints to align simulated outputs with observed data. Calibration is performed in multiple stages, using a combination of conditional probability adjustments, joint probability algorithms, and validation against Census 2021 and travel survey data ( 9 , 29 , 38 ). The goal is to systematically refine the model until it closely replicated observed travel patterns and activity scheduling behavior.
Model performance is evaluated at each validation step using various goodness-of-fit measures, including the absolute percentage error (APE) and R-squared (R2) values. These metrics assess the accuracy of the simulated outputs by comparing them with observed data. APE quantifies the percentage deviation between simulated and observed values, with lower values indicating a better fit, while R2 measures the proportion of variance in the observed data that is explained by the model. Each simulation run is iteratively refined to minimize APE values, ensuring that discrepancies between simulated and actual travel behavior are systematically reduced. APE values are calculated using the following equation:

where Oi is the observed percentage and Si is the simulated percentage of a subcategory of a variable. APE measures the accuracy of the simulated data in comparison to the observed data, with a range from 0% to 100%, where 0% indicates a perfect fit.
Data Sources and Study Area
This study has three main data sources. For developing the ICT adoption models, it uses the 2022 Canadian Internet Use Survey (CIUS) data. For activity agenda formation and scheduling, and later for calibrating iTLE framework, it carries out the 2022–23 Halifax Travel Activity HaliTRAC Survey. Finally, to validate iTLE, it uses the Canadian Census 2021 data. Figure 3 shows the workflow of the study and data sources used at each step.
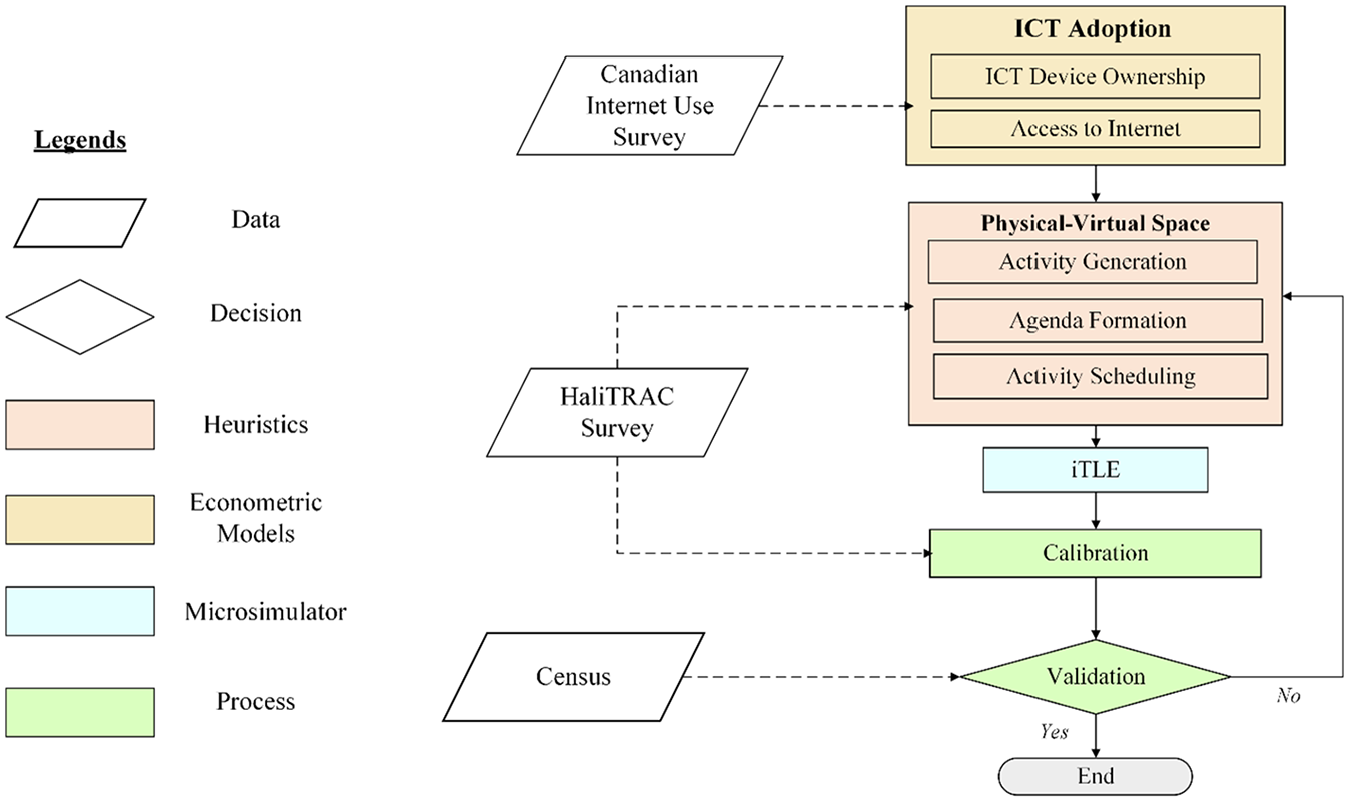
Workflow of the study and data sources.
Halifax Travel Activity (HaliTRAC) Survey 2022–23
This study employed the HaliTRAC survey, a randomly sampled household survey to gather comprehensive data on socio-demographic, household, activity-travel, and work arrangement information within the HRM, Nova Scotia, Canada. The survey collected detailed household and individual characteristics, including the number of residents, home ownership status, annual household income, household structure, and vehicle details. Information on individual household members encompassed age, gender, education, employment status, occupation, and driver’s license ownership. Respondents were also asked to detail their current work arrangements and maintain a 24-h travel-activity log (travel diary) for a typical weekday. This diary captured various aspects of their activities and trips, such as locations, times, distances, purposes, travel modes, and accompanying persons. It included OH in-person activities, and IH in-person and virtual activities. To ensure adherence to the highest ethical research standards, participants provided informed consent and were protected from undue risks. The survey utilized multiple data collection methods to enhance representativeness and participation rates. These methods included online surveys, mail-back questionnaires, telephone interviews, and social media. All approaches used the same questionnaire. The questionnaire was integrated with Google Maps and the Google Places API to enable accurate location selection and geocoding. Administered in four phases from September 2022 to March 2023, the survey reached out to a random sample of around 50,500 households across HRM. Phase 1 involved mailing 4,000 postcards inviting households to participate online. Phase 2 employed random digit dialing, texting approximately 16,923 households with invitations to join the survey online or via telephone. Phase 3 targeted 14,500 households through landline sampling, offering survey completion online, by mail, or by phone. Phase 4 utilized social media to engage HRM residents. In total, 3,731 households and 5,795 household members completed the survey, reporting 14,327 activities. Further details of the survey methodology can be found in Habib ( 43 ).
Canadian Internet Use Survey 2022 and Census 2021
For developing the ICT tool adoption models, CIUS 2022 is utilized. The survey gathered data from Canadian residents aged 15 and older. Along with the individual and household characteristics, the survey collected data related to internet access and use, ownership and use of smart devices, such as smartphone, laptop, and tablet. The study used the Nova Scotia segment of the data for developing the micro-behavioral models of ICT adoption. The sample is based on a stratified design employing probability sampling. Data are collected through an electronic questionnaire or computer-assisted telephone interviewing (CATI). For more details about the survey, please refer to Statistics Canada ( 45 ). To validate the iTLE microsimulation framework, Census 2021 data are used ( 42 ). Particularly, data related to commuting behavior, such as main mode of commuting, commuting duration, and commute start time are utilized.
Study Area
The HRM, Canada is the study area of this paper. HRM is one of the top five fastest-growing municipalities across Canada with a population of 492,199 in 2023 (4% growth from 2022) and employment rate of 67% in 2022 (46, 47). Halifax’s employment growth rate in 2023 (4.4%) was one of the highest across all Canadian cities ( 47 ). The total surface area of the municipality is 5,475.57 km2 and consist of urban, suburban, and rural regions ( 48 ).
The percentage of Canadians working from home online rose from 7% in May 2016 to 21% in July 2023 ( 49 ). The percentage of Canadians participating in other virtual activities, such as online meetups, online training, and online banking has risen by 18%, 8%, and 5%, respectively, between 2018 and 2022 ( 50 ). Similar to other areas in Canada, HRM also experienced rapid growth in virtual activity participation, especially virtual work, after the COVID-19 pandemic. The social distancing protocols implemented during the pandemic led businesses and organizations to consider flexible work arrangement options. About 14% of the HRM companies had more than 50% of employees working remotely, while 5.2% companies had 21%–50% employees working remotely, in 2022 ( 47 ). Although the rate of WFH has declined gradually in the post-pandemic, a considerable percentage of people are still working from home in HRM. In 2018, approximately 5% of the work activities were done from home virtually ( 51 ), which increased to 20% in 2023 ( 44 ).
Results and Analysis
Descriptive Statistics
Comparison between Census and HaliTRAC Survey
After processing the data and removing the missing and in-complete responses, 13,053 activities and 3,151 individuals’ data were taken for analysis. The summary statistics of demographic variables of the HaliTRAC sample are compared with the 2021 Census ( 43 ) and shown in Table 1. In most cases, the distribution of attributes aligns closely with that of the Census. Therefore, the sample is considered representative for the population of HRM and has not been weighted for further analysis.
Comparison of Study Sample Demographics with the 2021 Census (by Percentage)
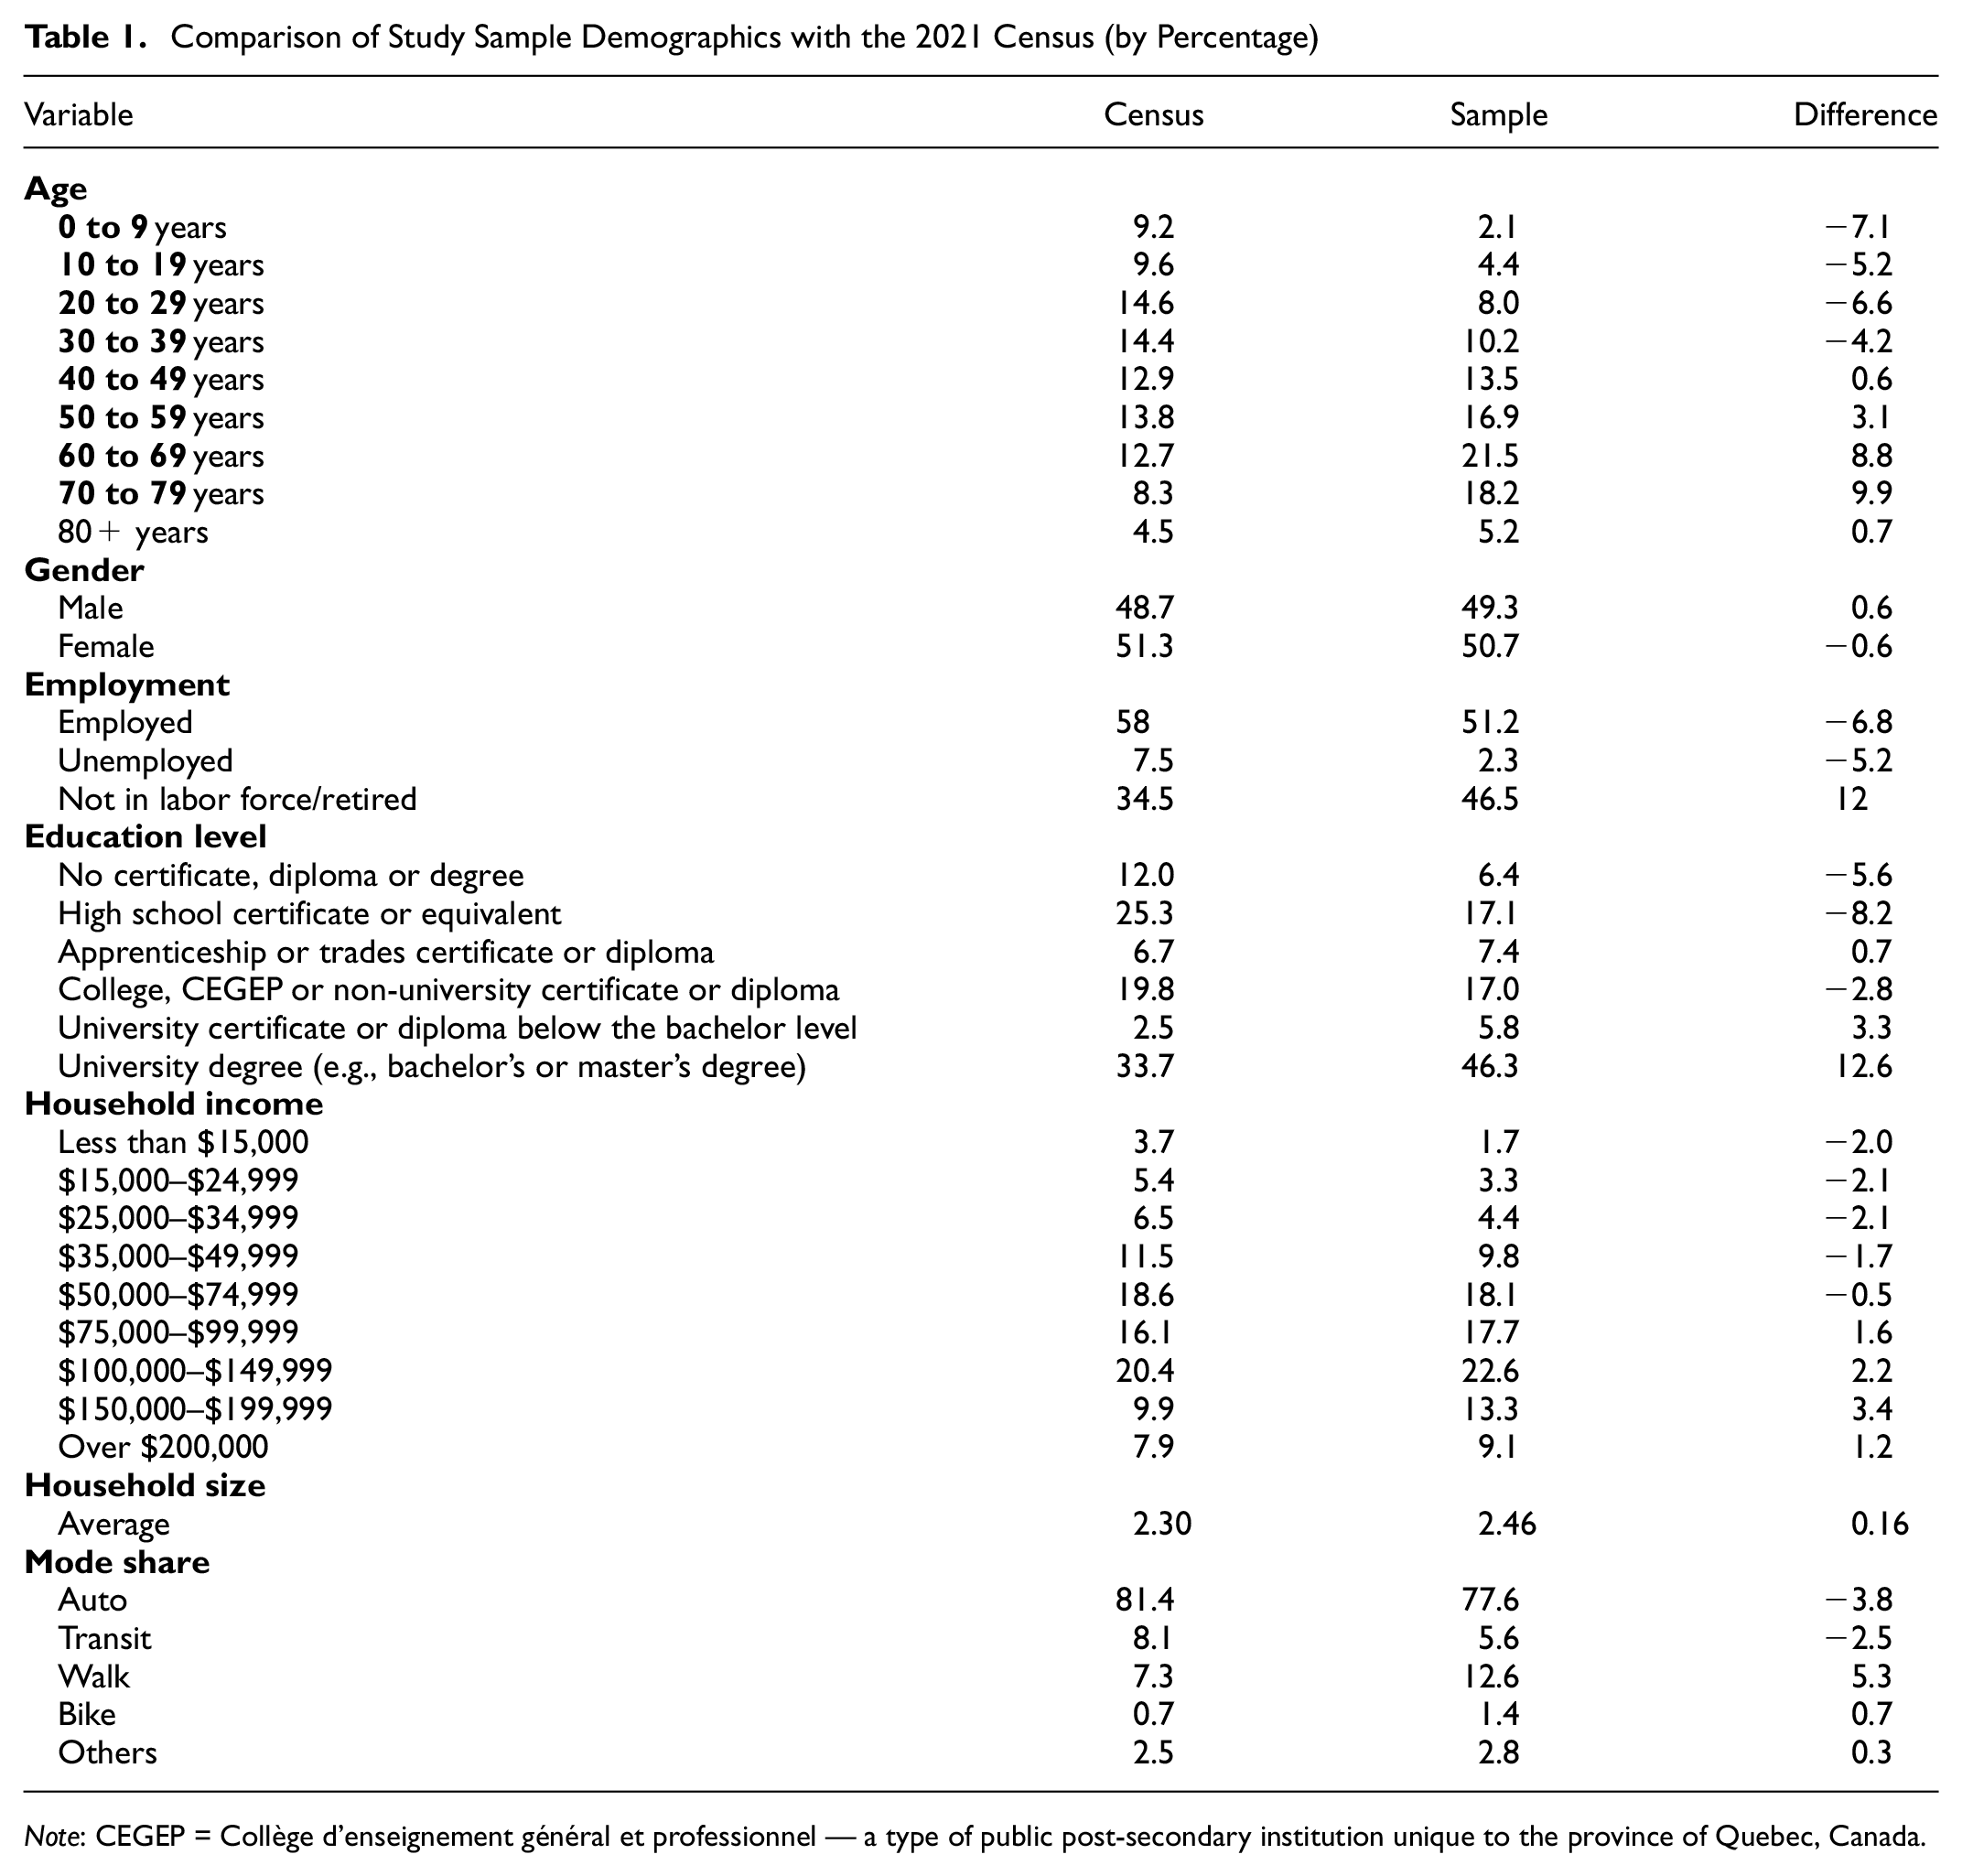
Note: CEGEP = Collège d'enseignement général et professionnel — a type of public post-secondary institution unique to the province of Quebec, Canada.
Figure 4 depicts the distribution of in-person and virtual activities in HRM. It indicates that virtual activities are primarily concentrated in urban and suburban areas. There are distinct clusters of virtual and in-person activities in the suburbs. Approximately 20% of work activities, 12% of study activities, and 7% of maintenance/discretionary activities are conducted virtually from home using ICT devices.
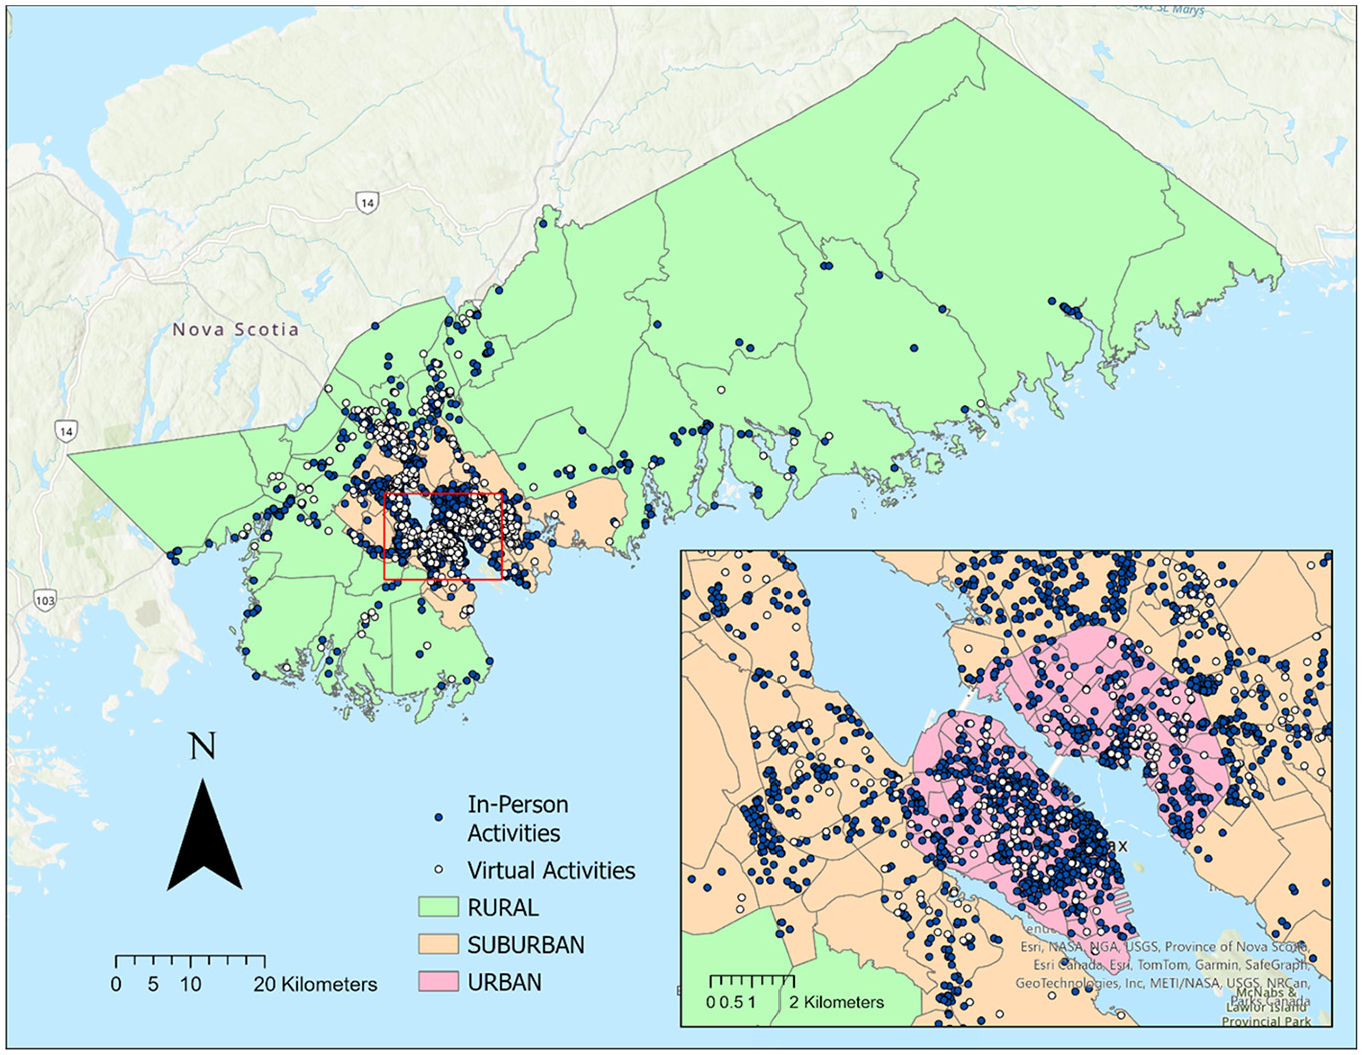
In-person and virtual activity locations in Halifax Regional Municipality (HRM) by land-use type.
Canadian Internet Use Survey—ICT Tool Ownership
Descriptive statistics of the ICT tool ownership in the CIUS survey are demonstrated using Figure 5. According to the survey sample of Nova Scotia (N = 1308), smartphone is the most owned ICT device (73% ownership) followed by laptop (56%), tablet (43%), and desktop (32%). Around 91% of the individuals have access to the internet at home, while 75% have mobile internet.
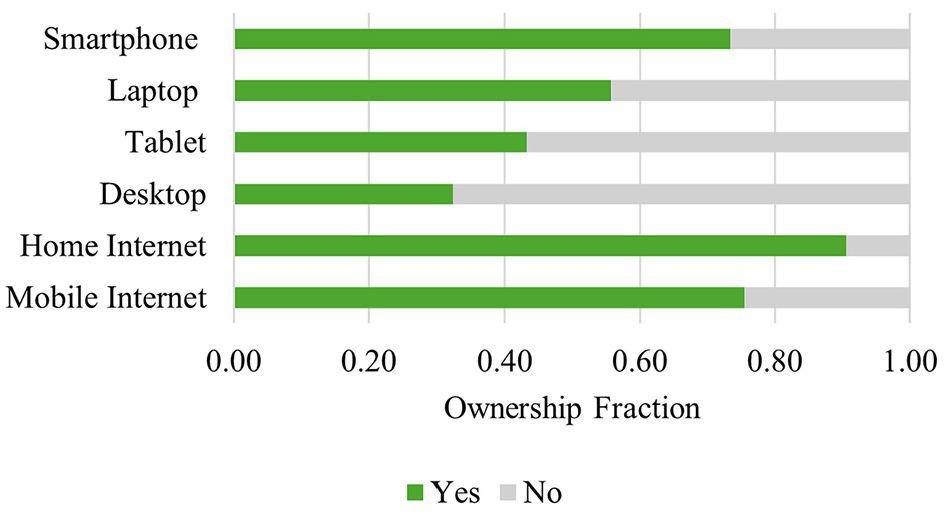
Descriptive statistics of information and communication technology (ICT)-tool ownership.
ICT Tool Ownership Models
Specifications of the final ICT tool ownership models were determined by iteratively removing statistically insignificant variables and bringing new variables into the model. The process is guided by literature, intuition, and modeling judgment. The data are also tested for multicollinearity using variance inflation factor (VIF) and correlation matrix analysis. The results show no signs of severe multicollinearity based on VIF and correlation tests. The fit statistics, including McFadden’s pseudo R-squared, are within the range commonly considered acceptable in discrete choice models, particularly for technology ownership and adoption studies. The results are shown in Table 2. They highlight the significant role of individual, household, and built-environment factors in ICT device and internet access, reflecting how lifestyle, work requirements, and financial capacity drive ICT adoption.
Parameters Estimates—Coefficient (t-stat) of the Information and Communication Technology (ICT) Tool Ownership Models
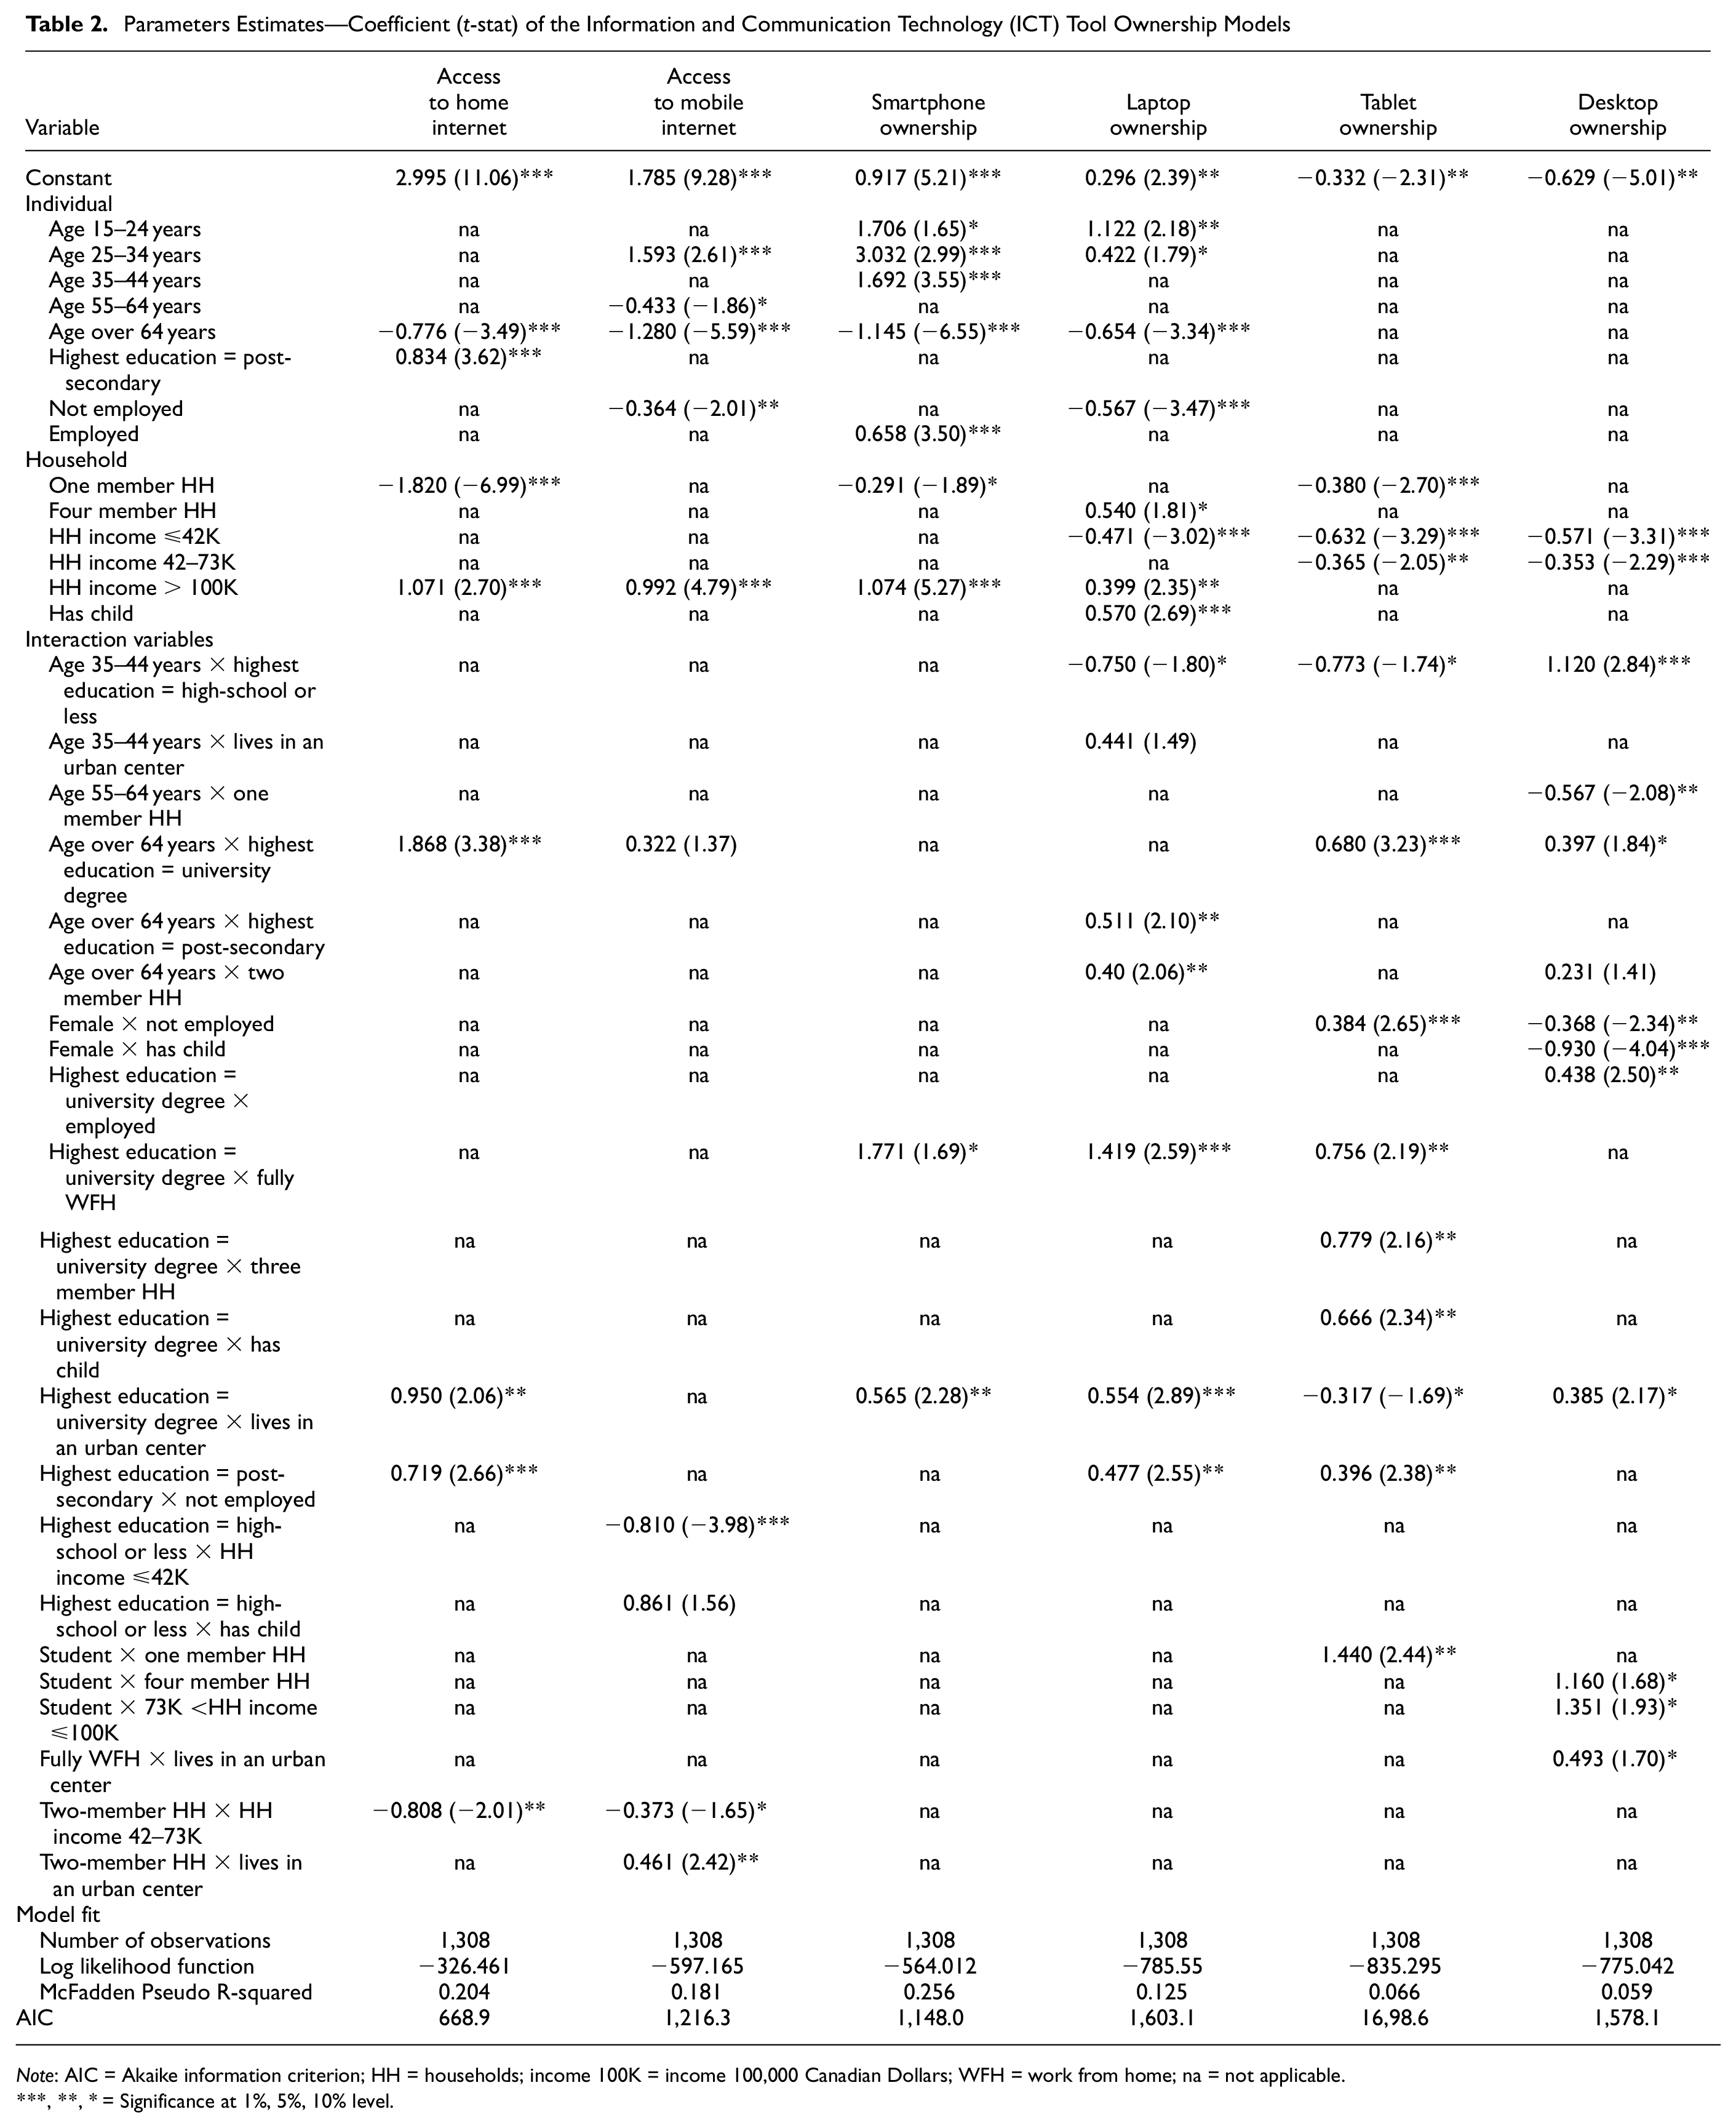
Note: AIC = Akaike information criterion; HH = households; income 100K = income 100,000 Canadian Dollars; WFH = work from home; na = not applicable.
***, **, * = Significance at 1%, 5%, 10% level.
Mobile internet access is positively influenced by individuals aged 25–34, higher household income, living in a two-member household, and residing in an urban center. Conversely, it is negatively associated with individuals over 55 years of age and those not in the labor force. Home internet access is positively associated with having a university degree, residing in an urban center, and higher household income. In contrast, it is negatively associated with individuals over 64 years of age and those living in single-member households.
Concerning smartphone ownership, individuals aged 15–44 are more likely to own smartphones, while those over 64 are less likely to. Being employed and a household income exceeding 100,000 Canadian Dollars (CAD)/year also increase the likelihood of smartphone ownership. People having university degrees and living in an urban center have positive associations with owning smartphone. Age between 15 and 34, living in four-member households, having household income over 100,000 CAD/year, having a child in the household are positively associated with owning laptops, while age over 64 and being not in the labor force is negatively associated. One interesting finding is that people with university degrees, full WFH arrangement, and living in an urban center have higher likelihood of owning a laptop. The need for laptops for educational purposes, remote work, and access to digital services in urban settings explains their prevalence among these groups. Tablet ownership is higher among females who are not in the labor force, and university degree holders with age over 64, likely attributable to tablets’ convenience for leisure activities such as reading and browsing, which appeal to these demographics. University degree with full WFH arrangement, living in three-member household, and having a child are also positively associated with tablet ownership. Those with lower household incomes (less than 73,000 CAD/year) and who live alone might find tablets less essential, as demonstrated by the results. Desktop ownership is positively associated with having a university degree, being employed, working fully from home, and living in an urban center. This is expected, as desktops are often preferred for work-related tasks that require higher computing power. Conversely, female not employed, female having a child in the household and household income below 73,000 CAD/year negatively affect desktop ownership.
ITLE Calibration and Validation Results
After implementing the ICT tool ownership models and physical–virtual activity spaces, the calibration and validation of iTLE are performed. This section presents key results from that process. Figure 6a provides a summary of observed data from the HaliTRAC survey, illustrating the distribution of morning home departure times across different population groups. In this study, the term ‘morning home departure’ specifically refers to an individual’s first departure from home in a typical weekday, regardless of the actual time it occurs. For some individuals, this departure may take place later in the day or may not occur at all—both scenarios are accounted for within this definition. Within iTLE, each individual’s morning home departure time is calibrated based on their assigned population group, as described in the section “Activity scheduling in physical and virtual spaces.” The figure presents average home departure times for selected groups, showing distinct behavioral patterns. For instance, full-time workers without WFH arrangements leave home the earliest, whereas retired and unemployed individuals tend to leave home the latest. Following the calibration process, the iTLE simulation results are compared with the survey data, as shown in Figure 6b. The figure illustrates the comparison between simulated (iTLE) and observed (HaliTRAC) results for first home leave time, measured in minutes from 3 a.m. The 14 points in the graph represent the 14 population groups’ average home departure times, ensuring that the data reflect broader travel patterns rather than individual behavior. The x-axis and y-axis values indicate time elapsed after 3 a.m. in minutes. For example, a value of 300 min corresponds to 5 h after 3 a.m., which is 8 a.m. Results show that iTLE accurately captures the trends observed in the survey data, achieving an R2 of 95.63% and a median absolute percentage error of 0.82%.
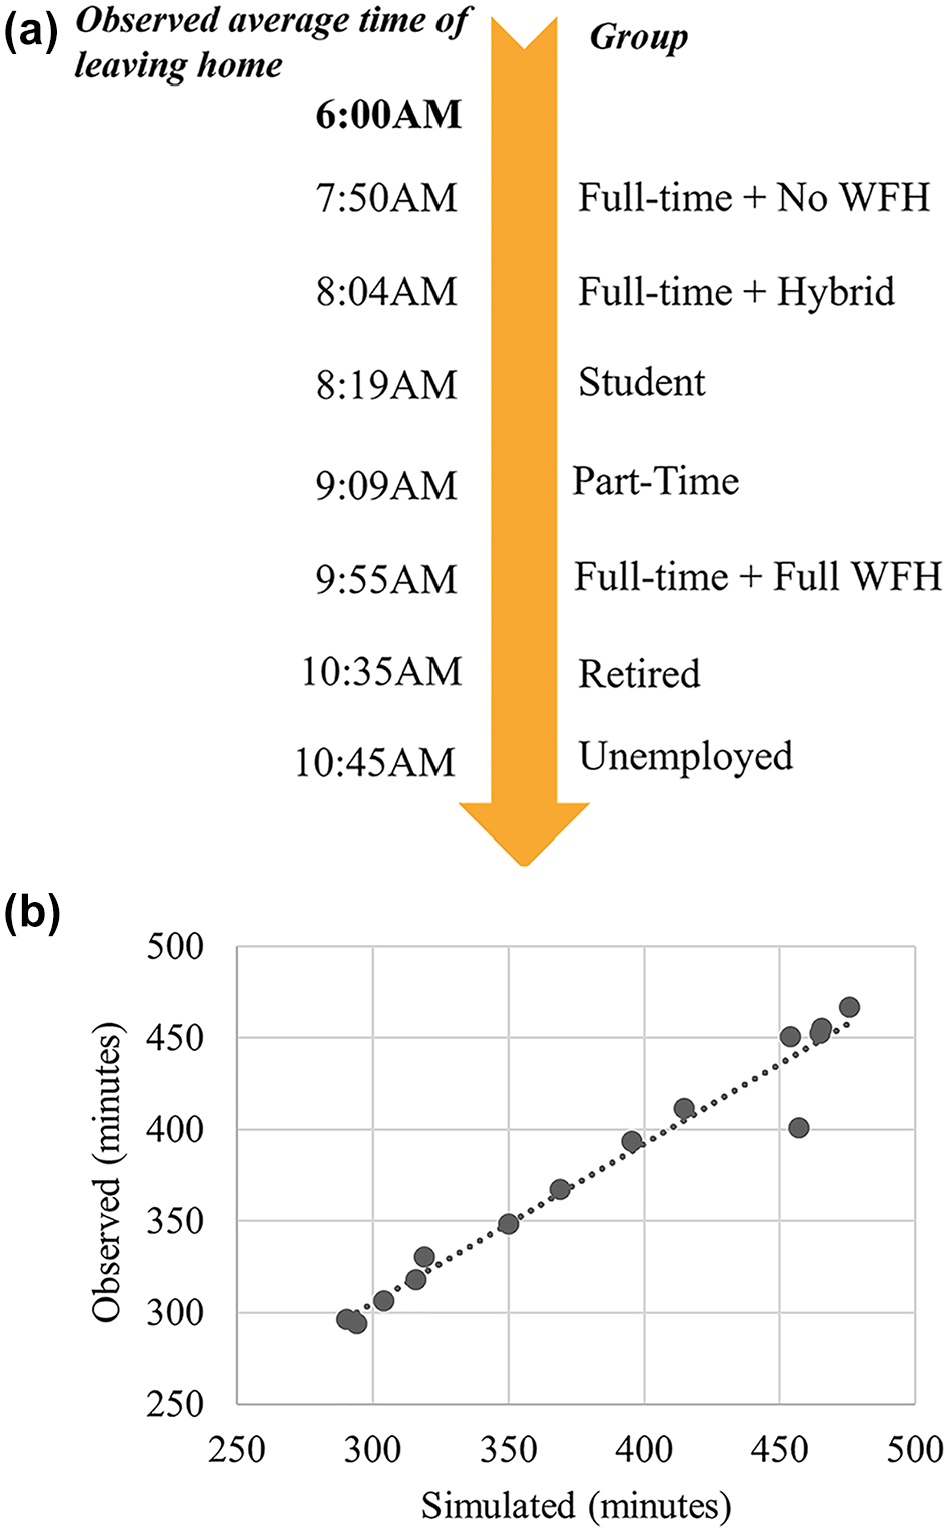
(a) Observed morning home departure time (average time for each group). (b) Comparison between simulated (integrated transport, land-use and emission [iTLE] model) and observed (Halifax Travel Activity [HaliTRAC] survey) for morning home departure (minutes calculated from 3 a.m.).
As regards validation results, Figure 7 shows the comparison between the 2021 simulation results from iTLE with the 2021 Census. Overall, the results are satisfactory and indicate that iTLE can closely match real-world population and behavior. Although there are slight variations between iTLE and Census for some subcategories, it maintains the distribution within the variable categories. The distribution of mode choice in iTLE is similar to the Census (0%–5% variation), with exact match for walk trips, a slight under-representation of auto trips (−5%) and over-representation of bike (+3%) and transit trips (+2%). Concerning commute duration, the difference between iTLE and the Census is within 2%–6% variation. iTLE marginally underrepresents the shorter trips (less than 44 min) and over-represents the longer trips (over 44 min). The first home leave time calibration is reflected in the commute start time validation results. All of the subcategories within the “commute start time” variable closely align with the Census (1%–3%), except the to 5 p.m. trips which has a slightly higher difference (5%) owing to its longer range.
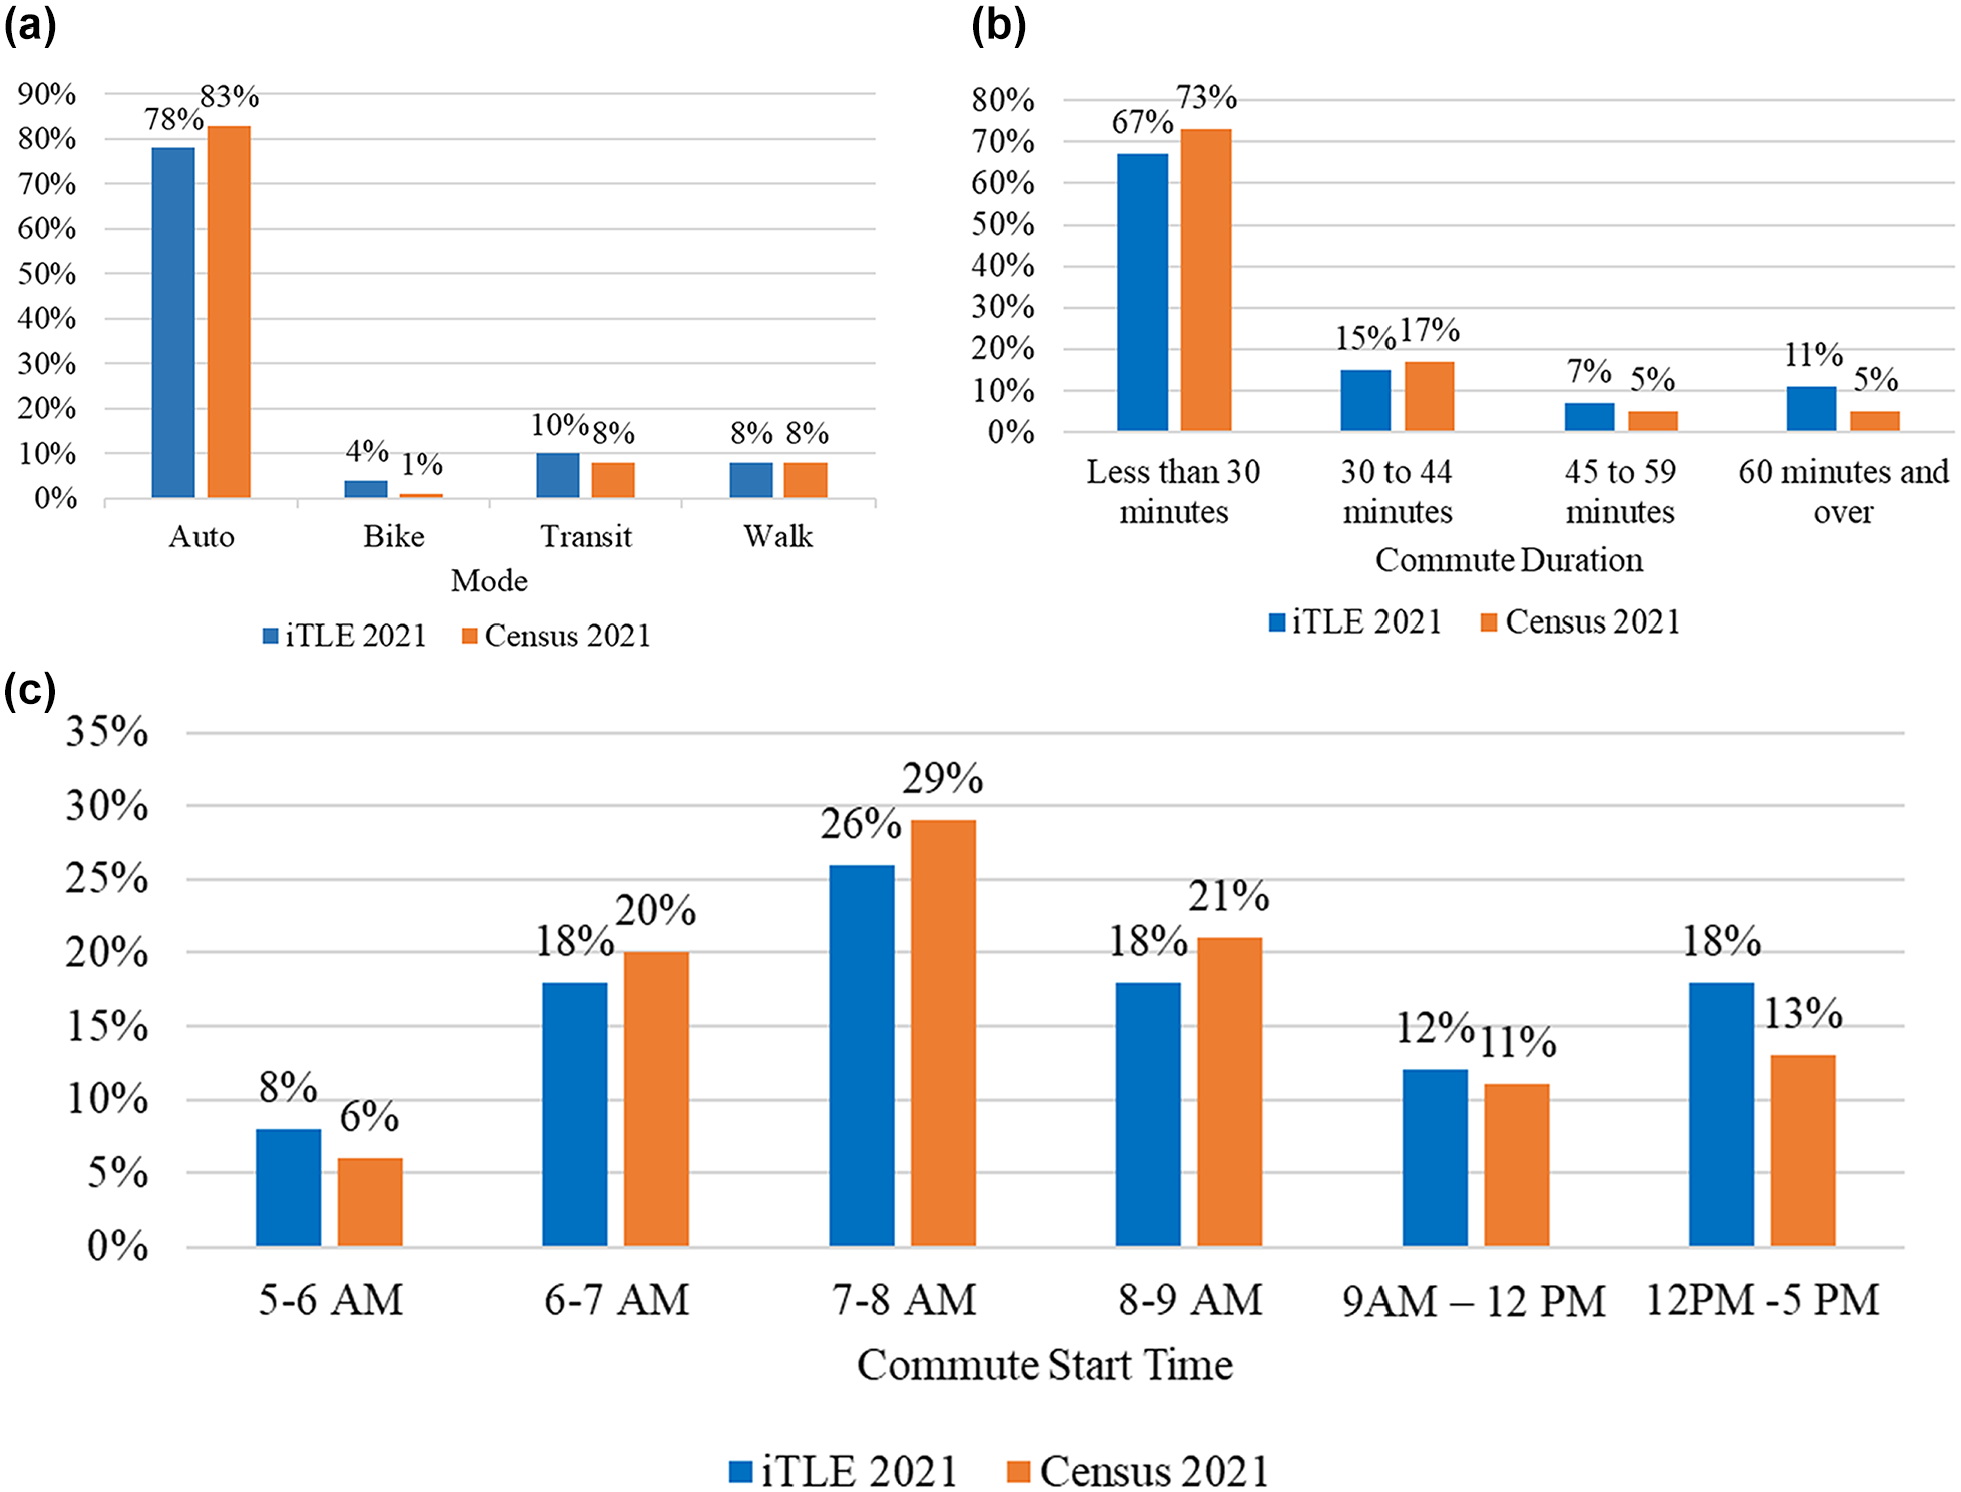
Comparison between Census 2021 and integrated transport, land-use and emission (iTLE) 2021 simulation results: (a) mode choice, (b) commute duration, and (c) commute start time.
Scenario Analysis
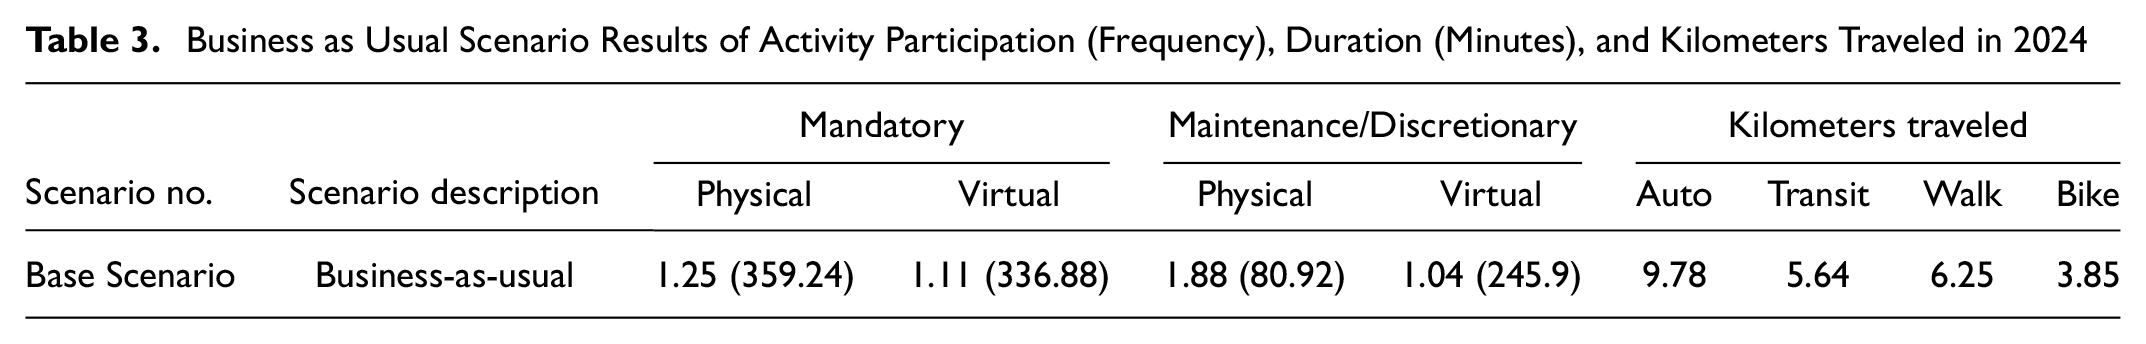
A scenario analysis is conducted to demonstrate the potential of the developed iTLE model to carry out comprehensive policy testing and assess impacts on activity-travel behavior. The results are shown in Tables 3 and 4. The scenarios explore how changes in ICT tool adoption and virtual work affect participation and duration in mandatory (work, study) and maintenance/discretionary (e.g., shopping, social interactions) activities in both physical and virtual spaces. It also examines the change in travel using major transport modes, such as auto, transit, walk, and bike. In Table 3, the business-as-usual (BAU) scenario outlines the average frequency of activities, average duration in minutes and average kilometers traveled in each mode in 2024. For the scenarios, Table 4 shows the percentage change in frequencies, the percentage change in duration and kilometers traveled per person comparing with the BAU scenario.
Business as Usual Scenario Results of Activity Participation (Frequency), Duration (Minutes), and Kilometers Traveled in 2024
Scenario Analysis—Percentage Change in Activity Participation, Duration, and Kilometers Traveled Compared with the Business-as-Usual
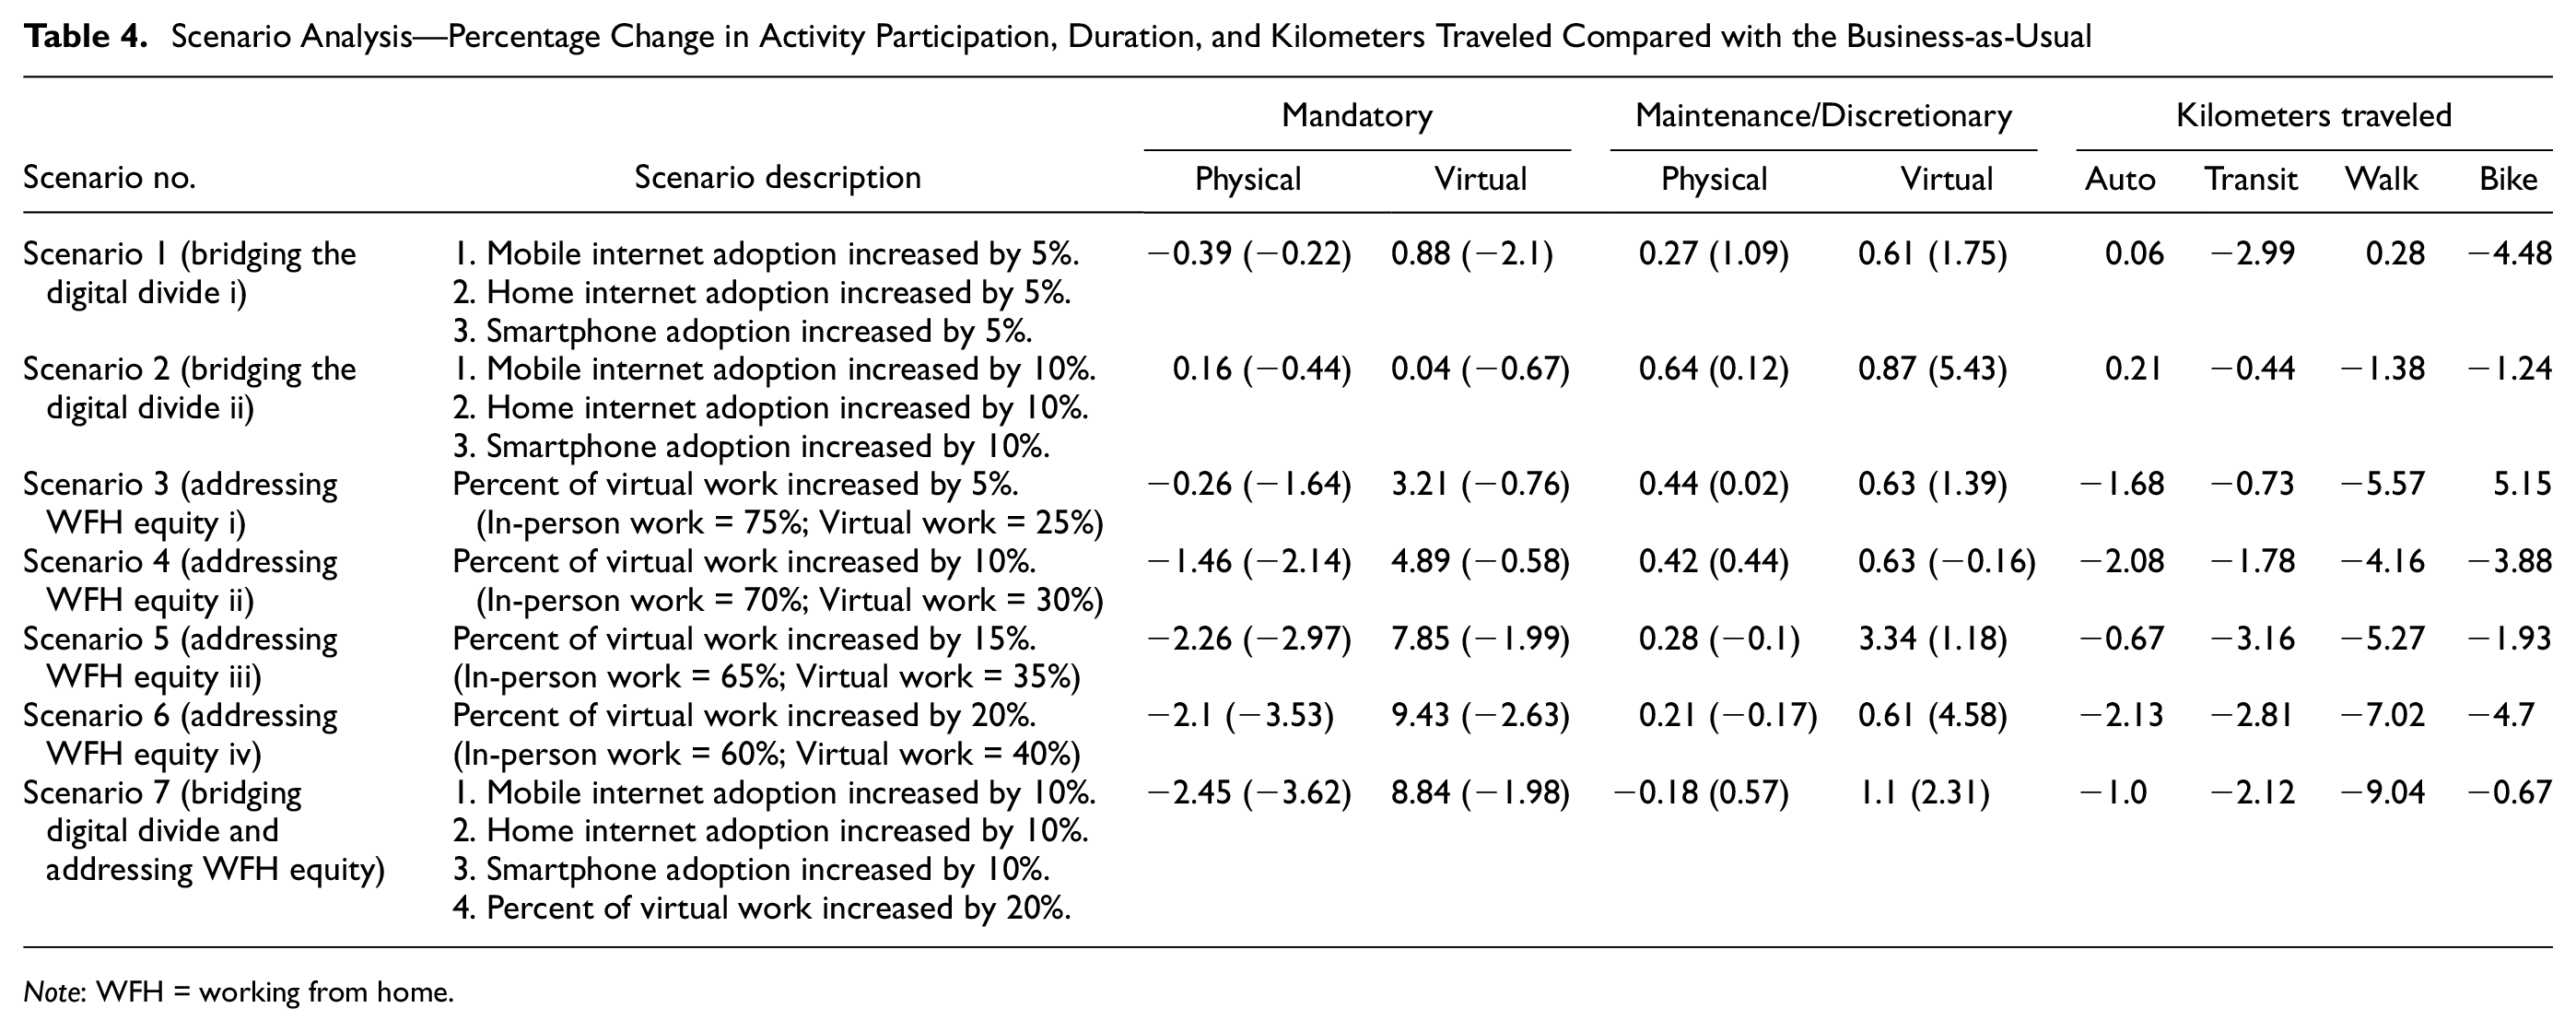
Note: WFH = working from home.
The simulation results show that increased ICT tool adoption significantly boosts the duration of virtual maintenance/discretionary activities while reducing time spent on mandatory activities. Interestingly, it increases auto travel. A moderate 5% increase in ICT tool adoption leads to a 0.06% rise in auto travel, while a higher 10% increase results in a 0.21% rise. Predictably, increasing virtual work decreases in-person mandatory activities while substantially increasing maintenance/discretionary activity participation, both virtual and in-person. It decreases travel by all modes of transportation, including auto. A 10% increase in virtual work reduces auto travel at a similar rate to a 20% increase. However, a 10% increase has less impact on other modes, especially public transit, with ridership only decreasing by 1.78%. Maintaining public transit ridership is desirable, as municipalities are struggling to recover it post-pandemic ( 52 ). To calculate the impact on regional auto travel and emissions, scenario 4 is further analyzed given its efficiency in reducing auto travel and lesser impact on transit. According to the scenario, 10% increase in virtual work can decrease VKT per auto user by 2.08% (as shown in Table 4). Considering absolute values, BAU scenario average VKT of 9.78 km decreases to 9.58 km in scenario 4, representing an absolute reduction of 0.2 km. In HRM, around 259,000 individuals use auto every day to travel to perform activities. Therefore, we can achieve a reduction of approximately (259,000*0.2) 51,800 km/day of auto travel, which would result in approximately 6,216 kg (6.216 metric tons) of CO2 emissions reduction (considering 0.12 kg of CO2 emission per kilometer). When scaled to an annual perspective, it represents a substantial decrease in emissions, comparable to taking hundreds of cars off the road or installing renewable energy sources. This reduction would contribute meaningfully to the municipality’s sustainability targets and improve overall air quality and public health.
The scenario analysis also examines the potential for ICT to reduce morning peak-hour travel. Figure 8a shows hourly percentages of OH trips made between 7 and 10 a.m. for each scenario. The timeframe is chosen because most of the trips during the day are made within that period in HRM. Results show that different levels of ICT adoption affect trip start time differently and they exhibit hourly variations. For example, scenario 5 has the least number of trips between 7 and 9 a.m. but the highest in the 9–10 a.m. period. To assess the variability of the base year in Figure 8a, multiple simulation runs are conducted, and fluctuations in OH trips are analyzed. Levene’s test (p-value = 0.254) indicated no significant variance differences across runs, suggesting minimal base year variability. Analysis of variance (ANOVA) results (p-value = 0.7116) further confirmed no significant differences in mean activity start times, implying that observed variations are not owing to model randomness. However, when comparing the base and ICT scenario runs, Levene’s test (p-value = 0.0908) suggested some evidence of variance differences, while ANOVA (p-value < 0.001) indicated significant differences in mean start times. These findings suggest that variations in trip timing are influenced by ICT adoption levels rather than inherent fluctuations in the base year model.
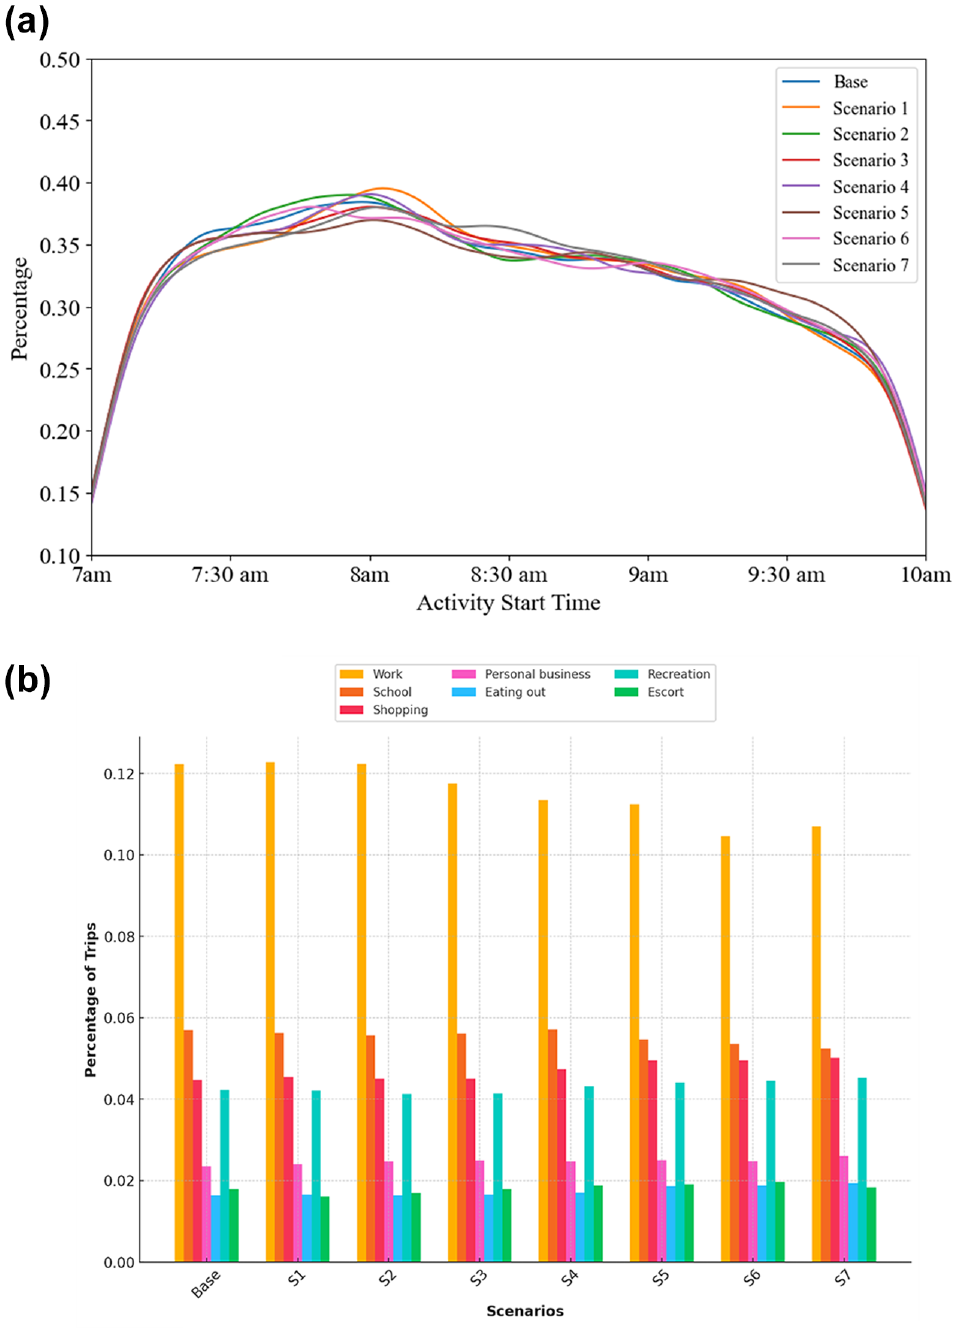
Analysis of trips made during the morning peak in each scenario: (a) Percentage of trips made between 7-10 AM by hour and (b) Percentage of trips made between 7-10 AM by activity type.
Analysis also shows that percentage of total trips made between 7 and 10 a.m. in each scenario are 32.41, 32.35, 32.24, 31.96, 32.17, 32.36, 31.56, and 31.87. All the ICT scenarios reduced morning peak-hour travel, while scenario 6 (20% virtual work increase) reduced the most. Figure 8b shows their distribution by activity type. Increase in ICT tool adoption does not have a substantial effect on morning trips; however, increase in virtual work does. With the increase in virtual work, OH work trips have decreased, while trips for shopping, eating out, and recreation have increased. This trend aligns with the findings of Caldarolla and Sorrell ( 53 ) that trips reduced by not commuting are instead used for non-work-related activities by teleworkers. However, the total number of trips remains lower than in the base scenario, indicating that virtual work has the potential to reduce morning peak-hour travel. The scenario analysis overall reveals a nonlinear impact of ICT adoption on activity-travel patterns, further supporting Salomon and Mokhtarian’s ( 6 ) hypothesis that ICT and travel interact in multiple complex ways.
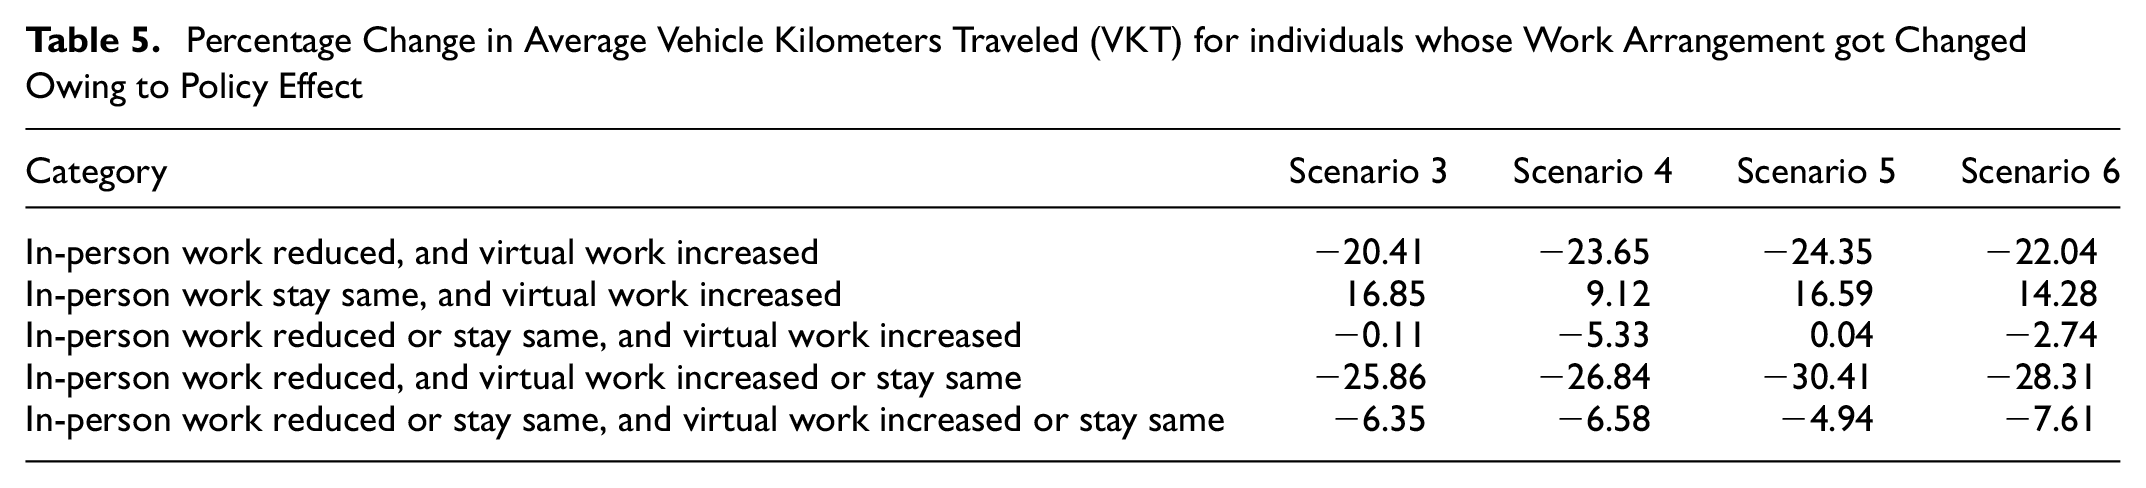
This study also analyzes OH travel impacts specifically for the individuals who were affected by the policy changes in the scenario analysis. Table 5 outlines the percentage change in average VKT when compared with the base scenario for the individuals whose work arrangement got affected. The scenarios 3–6 outlined in Table 4 are considered for the analysis. According to the results, higher VKT reduction (over 20%) is achieved when “in-person work is reduced, virtual work is increased” or when “in-person work is reduced, virtual work is increased or stay same’”. Results provideseveral insights: 1) increasing virtual work reduces VKT only when it comes with reduction in in-person work; 2) only increasing virtual work increases VKT, as people participate in more OH non-work activities; 3) incremental increase in virtual work (from 25 to 40% with 5% increment) do not necessarily have a linear decrease of VKT.
Percentage Change in Average Vehicle Kilometers Traveled (VKT) for individuals whose Work Arrangement got Changed Owing to Policy Effect
Policy Implications
Considering the recent increase in ICT adoption and virtual activity participation, the results of the paper have critical implications for transportation planning. First, ICT tool ownership percentage varies across population, although most people own a smartphone, still a portion of the society (25%) do not possess them. Laptop, tablet, and desktop ownership is even lower than smartphone ownership, and around 25% of the population do not have access to mobile internet. People with access to ICT tools have access to the virtual environment and are able to benefit from services provided online, while people without the access may miss out on those utilities. Thus, it is extremely important to keep this “equity” component in mind when developing ICT-related policies. Results show that age, employment status, household income, household size, residential location are associated with ICT tool ownership. For understanding ICT adoption rates in different areas, policymakers can consider these variables.
Second, results show that full-time workers with no WFH arrangement are the first to leave home in the morning, followed by hybrid workers, while retired individuals leave home the latest. Work arrangement flexibility is found to have a relationship with people’s OH travel behavior and understanding that association can help in utilizing teleworking policies to reduce peak hour travel demand. Scenario analysis indicated that teleworking has potential to reduce vehicular traffic and emissions. With an increase in virtual work, OH work trips decrease; however, trips for shopping, eating out and recreation increase. This suggests that with an ability to telework, people may use their saved time by not commuting to travel to non-work activities. Therefore, there is no certainty that shifting to teleworking will decrease overall travel significantly. If the teleworking trend continues or goes upward, the shopping malls, restaurants, and parks may attract more people during the off-peak hours. Public transit systems will need to adapt to these changing demands to ensure that reliable services are available throughout the day.
Third, owing to the recent increase in teleworking, public transport ridership has declined in cities and municipalities are struggling to regain the pre-pandemic rate ( 52 ). In addition, a common target for municipalities is reducing auto dependency (54, 55). Scenario analysis in this study shows that different percentages of virtual work affect auto travel differently and the relationships are not linear. There are trade-offs that need to be considered when developing such policies. For example, the highest decrease in auto travel (-2.13%) was achieved by scenario 6 (40% virtual work), but it also decreases transit travel at a high rate (-2.81%). If the main focus is on reducing auto travel, then 40% virtual work policy should be selected. However, if the goal is to reduce auto travel and have the least impact on transit, then scenario 3 (25% virtual work) should be selected, which achieves -1.68% decrease in auto travel and −0.73% decrease in transit travel. If the objective is to achieve a more balanced outcome, then scenario 4 (30% virtual work), where there is a moderate decrease in both auto and transit travel. While devising a teleworking-centric travel demand management strategy, the policymakers need to carefully select the rate of virtual work that is achievable, feasible and satisfies the planned target for modal impacts.
Conclusion
This study advances ABMs by implementing physical and virtual spaces within its activity-scheduler, capturing the effects of evolving work arrangements and ICT use. It introduces a new ABM framework that captures the interactions among individual and household travel choices across long-term, medium-term, and short-term horizons. The model integrates ICT adoption models, such as internet access and device ownership, within the life-history oriented agent-based framework. The ICT tool ownership models are estimated using discrete choice models to capture the effects of individual, household, and built-environment variables. By incorporating ICT tool adoption models, the study examines ICT adoption patterns across demographics and captures their effects on activity scheduling. MCMC and conditional probability algorithms are used to schedule activities in both physical and virtual environments, considering factors such as work arrangements, employment status, mobility, and ICT tool ownership. The developed ABM is executed within an iTLE modeling system. A prototype version of the model is implemented for the HRM, Canada. To develop and test the model, an activity-travel survey titled the 2022–23 HaliTRAC survey is conducted that captures the recent surge in virtual activity participation. A comprehensive calibration and validation of the model is performed utilizing the 2021 Census.
Outcomes show that iTLE can generate population and behavior closely matching the real world. A scenario analysis demonstrates capabilities of iTLE to test policies and assess impacts on activity-travel patterns. Overall, the results suggest that virtual work can help reduce auto travel, vehicular emissions, and morning peak-hour trips. Increased ICT tool adoption extends virtual maintenance and discretionary activities while reducing time spent on mandatory tasks. Notably, it also raises auto travel, with a 5% adoption increase leading to a 0.06% rise and a 10% increase resulting in a 0.21% rise. Increasing virtual work decreases in-person mandatory activities while increasing maintenance/discretionary activity participation, both virtual and in-person. At the individual-level, a higher VKT reduction (over 20%) is achieved when in-person work decreases while virtual work increases or remains the same. Key insights include: 1) virtual work reduces VKT only when it replaces in-person work; 2) increasing virtual work alone can raise VKT, as people engage in more non-work travel; 3) VKT reduction does not follow a linear pattern with incremental increases in virtual work. At the regional level, the reduction in VKT from decreased commuting as a result of virtual work adoption outweighs the increase in VKT from additional non-work travel, suggesting that virtual work has the potential to reduce overall auto travel. A 10% increase (scenario 4) in virtual work reduces auto travel at a rate comparable to a 20% increase but with a smaller impact on public transit, where ridership drops by only 1.78%. In this scenario, a 10% rise in virtual work decreases VKT per auto user by 2.08%, lowering the BAU average from 9.78 km to 9.58 km —a reduction of 0.2 km per user. With approximately 259,000 daily auto users in HRM, this results in a total reduction of 51,800 km/day, cutting CO2 emissions by around 6.216 metric tons daily.
One of the limitations of this study is that it considers only IH virtual activities. OH virtual activities could not be considered because of data limitations. Future research can address this aspect by including OH virtual activities and also examining multitasking behavior. Another limitation is that the study oversamples respondents older than 60 and underrepresents respondents younger than 30 years old. Future research may consider applying weightage techniques to better match the Census population. It is to acknowledge that while the activity generation model’s MCMC transition matrices remain fixed, individuals dynamically shift between them as their employment status, work arrangement, and vehicle ownership evolve. This ensures that sociodemographic changes influence activity-travel behavior throughout the life-cycle of the agents. However, the transition probabilities within each matrix remain unchanged over time, which may not fully capture heterogeneous behavioral patterns within groups. Future enhancements could incorporate time-sensitive parameters or periodic recalibration using updated survey data to better reflect evolving travel patterns. ICT adoption models and physical–virtual activity scheduling implemented in this study provides a unique opportunity to examine household-level ICT impacts, which can also be an agenda for future ABM research. This study offers valuable insights for transport and land-use planning, residential energy-use, and transportation demand management. The findings are key to informing policies and infrastructure development in response to shifting work and lifestyle patterns. The developed tools can be utilized by governments, policymakers, and transportation professionals to examine the spatiotemporal impacts of virtual activities on transport and land-use systems. The tools can also be used to assess ICT-related policy scenarios by predicting activity-travel behavior and evaluating their effects on traffic networks and vehicle emissions. This analysis will help evaluate the effectiveness of ICT in addressing transportation challenges.
Footnotes
Acknowledgements
The authors would like to thank Climate Action Awareness Fund (CAAF) and Natural Sciences and Engineering Research Council of Canada (NSERC) Discovery Grant for their funding support. The authors are grateful to Venkata Vijaya for his help with the coding, Fatin Anzum Khan for her input in preparing the graphs, Taylor Oliver and Xinming Li for their time to proofread the manuscript. The authors utilized ChatGPT-4o for language editing and grammar checking to refine the manuscript’s clarity at some places. The final content was then carefully reviewed and verified by the authors multiple times before finalizing.
Author Contributions
The authors confirm contribution to the paper as follows: study conception and design: M. A. H. Anik, M. A. Habib; data collection: M. A. H. Anik, M. A. Habib; analysis and interpretation of results: M. A. H. Anik, M. A. Habib; draft manuscript preparation: M. A. H. Anik, M. A. Habib; All authors reviewed the results and approved the final version of the manuscript.
Declaration of Conflicting Interests
The authors declared no potential conflicts of interest with respect to the research, authorship, and/or publication of this article.
Funding
The author(s) disclosed receipt of the following financial support for the research, authorship, and/or publication of this article: The research was supported by the Climate Action Awareness Fund (CAAF), Environment and Climate Change Canada (Grant No: EDF-CA-2021i011).