
Abstract
The introduction of autonomous vehicles will revolutionize transport in urban and rural areas. Nevertheless, before we allow autonomous vehicles to roam our streets, we should strive to predict the impact that they could have and prevent as many negative externalities as possible. Moreover, it is expected that the ability to let go of the wheel and multitask could substantially decrease the in-vehicle value of time, triggering travel behavioral changes, which could in turn have a negative impact on the environmental sustainability of the transport system. Thus, we tried to estimate the environmental rebound effect linked to behavioral changes caused by shared autonomous vehicle deployment. This study presents results of a simulation of the transport system of Santander (Spain), performed by linking the activity-based demand estimation developed in SimMobility to microsimulation in Aimsun and its battery consumption and pollutant emissions models. The results yielded by the study present the magnitude to which identified travel behavioral changes could affect the environmental performance of the transport system, as well as the overall outcome of all identified behavioral changes. The outcomes show that the rebound effect could increase the CO2 emissions by almost 40% compared with a scenario with no behavioral changes. We believe this topic to be particularly interesting for policy makers, urban planners and regional authorities.
Keywords
The introduction of autonomous vehicles (AVs) has been a widely discussed topic among transport researchers for numerous years already, and recently the topic has started to appear in popular media discussion. The number of parties investing in AV technology has been increasing, as well as the investment value, to up to $200 billion of global investments, with a predicted further rapid increase as the competition intensifies ( 1 , 2 ). Looking at the resources already invested by the major players in the market, as well as the growing number of patents issued for technology enabling autonomous driving, it could be claimed that AV deployment on the roads is rather imminent. The deployment of AVs is predicted to drastically change our mobility patterns and affect everyday life in cities. For instance, researchers predict that AVs could be aggregated into fleets of shared vehicles (SAVs), which is the service analyzed in this study. Moreover, the introduction of this new service could lead to a chain of behavioral changes enabled by new possibilities. Therefore, it is crucial for policy makers and regional authorities to predict how individuals could behave once this mobility option becomes available.
The first step toward that prediction is the understanding of plausible behavioral changes resulting from SAVs and how the ability to let go of the wheel in AVs could be truly revolutionary ( 3 ). Vehicle autonomy means lower travel costs not only for private vehicles but also for SAVs, overall increase in road capacity, introduction of new parking strategies, ability to multitask in the vehicle and potential harvest of users currently not able to drive a conventional vehicle ( 4 ). Moreover, innovations that lower travel costs encourage users to participate in additional activities or to accept destinations further away either in the short or long term—possibly leading to relocation ( 5 – 7 ). Finally, SAVs offer fully available vehicle replacement services and could alter vehicle ownership rates ( 8 ). Therefore, the predicted behavioral changes triggered by SAVs are the following: (i) acceptance of longer trips, (ii) change in daily activity timing, (iii) more nonmandatory trips, (iv) more trips by mobility impaired people, (v) modal change, (vi) relocation, (vii) shifts in parking habits and (viii) shifts in vehicle ownership. Further explanation of this categorization of behavioral shifts is explained in Garus et al. ( 9 ) and presented on Figure 1.
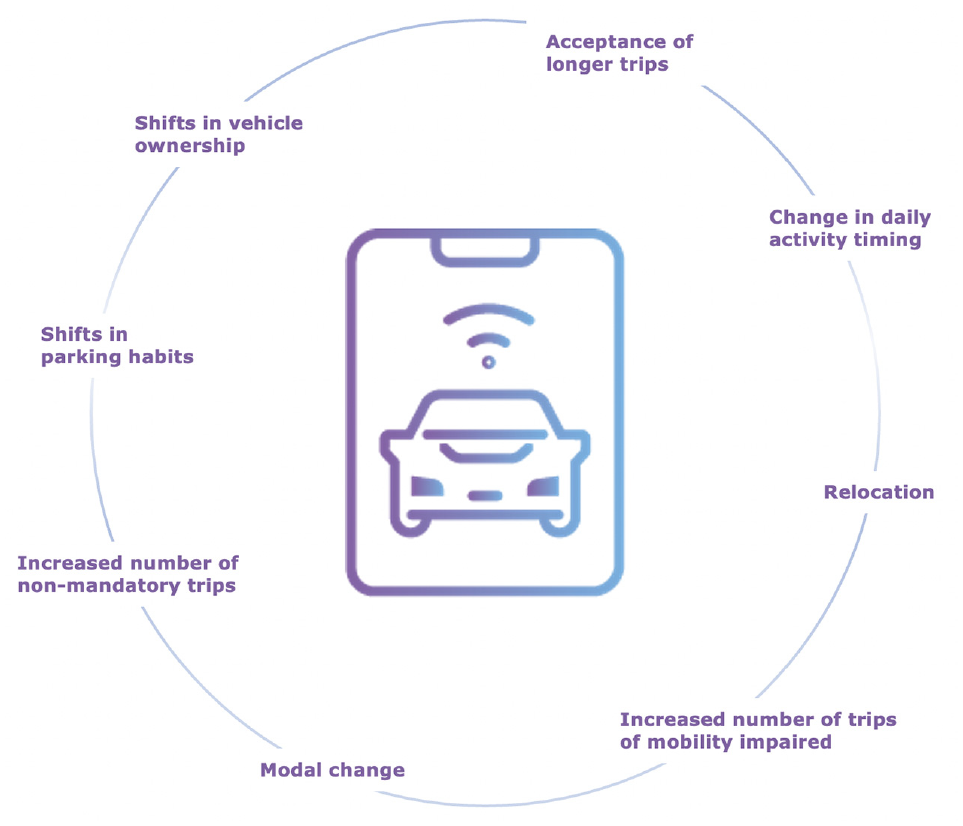
Categorization of behavioral changes triggered by shared autonomous vehicles (SAVs).
Nevertheless, transport innovation is not necessarily linked to lowering of negative externalities, either environmental or societal. Therefore, the second step is the comprehension of how the said behavioral changes could affect the area in which AVs are deployed. However, studies on behavioral changes linked to SAV deployment have usually focused strictly on investigating the efficiency of transport systems. The studies have reported results on changes including congestion ( 5 , 10 ), average speeds ( 11 , 12 ), vehicle hours traveled ( 13 ) and accessibility ( 14 ). Further studies have reported results on the total number of trips, using it as a potential proxy for transportation system congestion. However, the findings of those studies were not conclusive, pointing to conflicting results, and were highly based on the assumption of decrease in the value of travel time (VOT) with use of SAVs ( 7 , 8 , 13 ). Nevertheless, the extent to which substantial behavioral changes related to AV introduction will have an effect on CO2 emissions (known as rebound effect) has not yet been assessed, to our knowledge. In the light of findings provided by Coulombel et al. ( 15 ), that indicate the rates of the rebound effect of dynamic ridesharing, such a study needs to be conducted, as our hopes of achieving more sustainable transportation with SAVs could be premature. Moreover, looking at the current environmental focus of numerous urban areas, there is an arising need for assessment of the impact of deployment of SAVs on transport environmental externalities such as energy consumption, CO2 emissions and air quality.
This paper aims to investigate in which ways and to what extent the anticipated behavioral shifts may amplify or mitigate the environmental benefits of SAVs. With regard to the expected environmental rebound effect caused by SAVs, a careful assessment of CO2 and air pollutant emissions is considered. Moreover, the study provides further understanding of how each studied behavioral change, caused by deployment of SAVs, contributes to the environmental rebound effect. Furthermore, the study analyzes how the environmental rebound effect would vary subject to assumed changes in in-vehicle VOT. Researchers already predict that VOT could decrease with introduction of SAVs, however, the magnitude of the decrease is unknown. Nevertheless, the majority of the reviewed studies focus on a single assumption, whereas we have decided to use three different values. This paper is put forward in the hope of serving policy makers and regional authorities, who will need to ensure the sustainable uptake of SAV technology.
The paper is structured in the following manner: the next section presents the literature review on behavioral shifts and their implementation in demand models. The third section exemplifies the methodology used to assess the environmental rebound effect of each behavioral shift. The fourth section depicts the results and policy recommendations of the study. Finally, conclusions and plausible further research steps are described in the fifth section.
Literature Review
The environmental impact of SAVs has been a topic of interest of numerous researchers, who signal the potential impact of this innovation on air, land, water and light pollution ( 16 , 17 ). The methodologies used to estimate the environmental impact of SAVs were: system dynamics and energy optimization models based on results of previous studies ( 18 ), as well as traffic simulations at all levels—macro, meso and micro ( 16 ), or even life-cycle assessment ( 19 ). As per the demand estimation methods of the traffic simulation studies, the majority of studies used the agent-based approach ( 20 , 21 ), simulating hypothetical grid networks, slices of a real transport network or the entire network of a city ( 16 , 21 ). The reported environmental results of those studies included energy consumption and CO2 emissions ( 16 , 22 ). The previous studies that focused on the environmental impact of SAVs tended to gravitate toward their demand for electricity and charging infrastructure ( 22 ). Since the focus of the studies was often on the energy system performance or decarbonization potential, the demand for SAVs has not been explored in detail, with the majority of the studies assuming either the market share of the trips handled with SAVs or its coverage of entire or doubled travel demand ( 16 , 22 , 23 ).
While previous traffic simulation studies included behavioral shifts, none of them focused on estimation of the environmental impact. Behavioral changes related to deployment of SAVs are more often implemented in activity-based models (ABMs), which allow better representation of decisions of individuals based on their socioeconomic profile. However, there are studies that tried to implement the behavioral shifts to trip-based demand models. Those studies simply assumed a lower generalized cost of travel, or VOT, on various steps of the four-step model ( 11 ). In the ABMs, the behavioral changes linked to AVs are most often implemented in scenario-based analysis that follows assumptions on future travel costs and decrease in VOT linked to the possibility to multitask in the vehicle ( 5 , 7 , 10 , 14 ). These assumptions change the utility function in discrete choice models, which compose the ABM. To this day, not many researchers have decided to implement changes on the activity scheduling step of the model, which reflects an increased number of nonmandatory trips. Implementation of more nonmandatory trips was made through an assumed decrease in VOT (in a range from 25 to 50%) ( 6 , 24 ).
At the destination choice level of the model—usually a multinomial logit (MNL) or nested logit (NL) model—acceptance of longer trips was considered. Several researchers have decided to implement this behavioral change in their ABMs. For SAVs the implemented changes consisted of assumed VOT reduction (25%–50%) with VOT considered as in a regular car (6, 24–26). If the utility of the choice was modeled on a taxi service, only a change of cost was assumed (30%–40% decrease resulting from elimination of driver) ( 5 , 7 , 8 , 10 , 14 ).
The modal choice step of the ABM, which incorporated modal changes, was most often modified by the researchers. Nevertheless, the reviewed models often did not consider socioeconomic attributes and individual preferences as factors that could influence modal shifts. The modal choice is frequently determined by a discrete choice model, determining the choice based on the overall utility of each option. The utility of the SAV option was modeled as a taxi or as “private car as passenger,” by reducing the costs of travel (40%–70%) ( 5 , 7 , 8 , 10 , 14 ). The cost of SAV operation was often assumed as a fraction of the cost of taxi service or private car, or subject to scenario analysis.
Nevertheless, the researchers often based their studies on utility functions that consisted only of assumed VOT and costs, omitting important individual traits, lifestyle choices and personal preferences which could have a heavy impact on future decisions about SAVs usage. Ideally, each step of the model (each discrete choice model) could consider socioeconomic attributes as well as user preferences to better mimic individual, plausible human behavior, contributing to a more adequate representation of the entire demand estimation. The variety of perceived VOT in different modes was also often omitted in previous literature. We are aware of only one study that implemented the alteration of VOT depending on whether the user was waiting for a SAV service or riding in the vehicle. Hörl et al. assumed that VOT while waiting for an AV is twice as valuable as when riding inside ( 26 ). Moreover, the studies to date did not perform a scenario analysis of results according to variety of VOT assumptions, while the degree to which the VOT will vary across the population is unknown ( 3 ). Additionally, a share of previous studies implemented an assumption of an increase in road capacity, which affects the utility functions by changing the travel time. Nevertheless, those assumptions could vary across different road types and various levels of AV market penetration. Moreover, those assumptions could be optimistic as the driving efficiency of AVs could be subject to regional policies, for instance, in the case of dedicated lanes for platooning ( 27 ).
Methodology
For a proper estimation of the environmental rebound effect of SAVs, one requires an integration of the following tools:
Long-term models: ○ Population synthesis, which allows the creation of agents that represent the simulated population. In this study the population synthesis was made using deep generative modeling (
28
). ○ Vehicle ownership and workplace location models obtained using discrete choice modeling.
Activity-based demand estimation, which accounts for the decision making of agents at the individual levels (in the transport literature, often called activity-based model). An activity-based model was made using a demand part of the simulation platform SimMobility ( 29 ).
SAV operator, which accounts for fleet management, such as request for vehicle assignment and rebalancing of vehicles. SAV fleet management was performed using the Aimsun Ride plug-in, which allows vehicles to be connected to requests coupled with OR-Tools—an optimizer for fleet management ( 30 ).
Traffic simulator, which translates the demand into a traffic simulation and allows us to obtain the desired environmental impacts. A supply model of the considered network and traffic microsimulation was performed using Aimsun software ( 31 ).
Each of the tools and models briefly described here are presented in more detail in the following sections and in Figure 2.
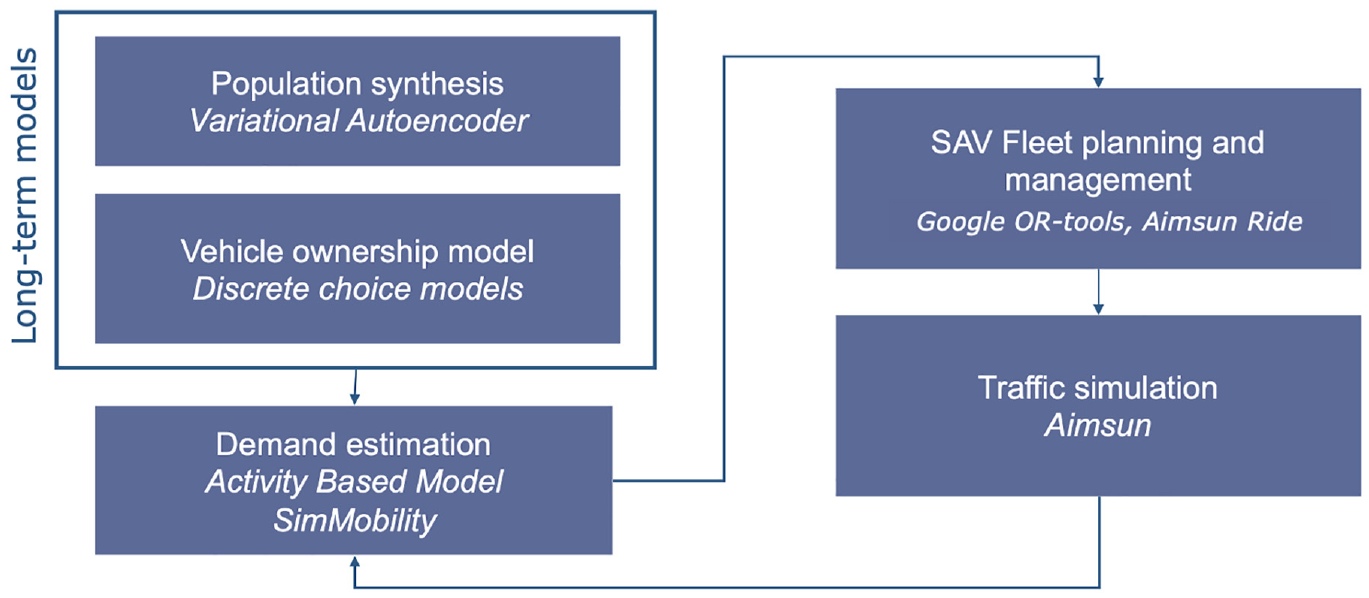
Simulation environment.
Demand
Long-Term Models
Population synthesis was obtained using a deep generative modeling approach from machine learning based on a variational autoencoder (VAE) proposed by Borysov et al., which allows us to represent the population with a wider variety of modeled attributes ( 28 ). The synthesized population attributes were: gender, age, employment status, education level, occupation, income, public transport subscription, driving license, zonal assignment and household assignment.
Parameters for the vehicle ownership model were estimated with MNL and mobility survey data. The choice set of the model was {0,1,2,3}, meaning no car in household, one car, two cars, or three or more cars. The estimated parameters for choice characteristics included: household size, age and gender of the head of household, and household income. The probability of each of the choices was obtained with the MNL, while the final choice for the household was derived from a Monte Carlo random draw. Thereafter, the Monte Carlo random draw determined whether a given vehicle was an electric vehicle (EV) or combustion engine vehicle. That assignment was made using a forecast of the car fleet composition in Spain in 2040 ( 32 , 33 ), for which existence of SAVs is often predicted ( 27 , 34 , 35 ).
Activity-Based Demand Estimation
The activity-based demand estimation was employed in SimMobility—an open-source activity-based simulation platform ( 29 ). In the simulation scenarios carried out as part of this study, we used a fraction of SimMobility—a Pre-day simulator. The Pre-day module is an ABM used to obtain daily activity schedules of the entire synthetic population. Random utility theory has been the most used approach to predict and understand the discrete choice in transportation. The Pre-day ABM consists predominantly of discrete choice models, mostly MNL models, along with some NL models, structured into a hierarchical framework. This framework is divided into three levels: the day pattern level, the tour level, and the intermediate stop level. The theory implies that an individual (n) assesses each of the available options based on the perceived utility of each alternative, and makes the choice that maximizes the utility ( 36 ). The utility (U) is composed of a deterministic part—a vector of the explanatory variables as well the attributes of the alternative as the socioeconomic characteristics (Xn) of the individual—and of a stochastic component—an error term (ε) that accounts for all variables unknown or omitted by the modeler. As an additive linearity is assumed, the utility of alternative i can be expressed as follows ( 36 ):

where β is the vector of parameters to be estimated.
The day pattern level consists of MNL models that predict the occurrence of tours and the availability of intermediate stops for considered purposes (work, education, shopping, leisure, and others). The day pattern level generates a list of tours and availability of intermediate stops for each individual in the synthetic population. The tour level of the Pre-day model consists of further discrete choice models that predict the destination, travel mode and time of day (arrival time and departure time) for each previously predicted tour. Finally, the models at the intermediate stop level predict the destination, travel mode and timing of the stops for the secondary activities. A simulation of the ABM yields activity schedules for everyone in the population, including the timing (arrival time and departure time) of each activity at a resolution of 30 min, the destination at zonal level and the travel mode for each tour (5). To fully represent the demand of a given population, the parameters describing the behavior of this population at every level of the model are needed. The way in which those parameters were obtained is presented in the Case Study section below.
The detailed scheme of the Pre-day SimMobility model is presented in Figure 3.
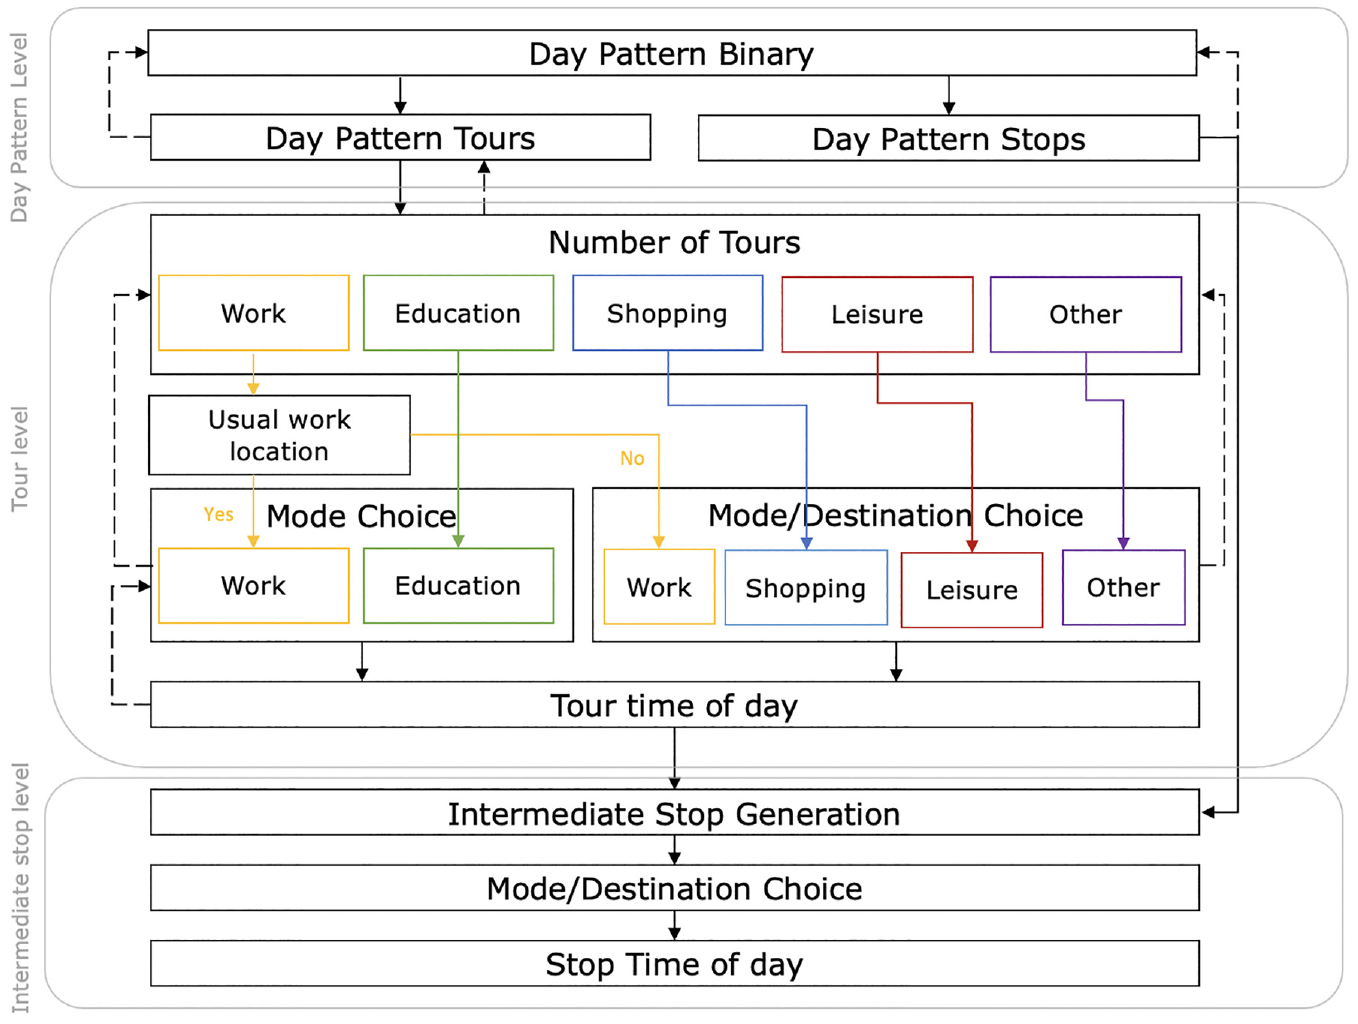
Components of the Pre-day activity-based model in SimMobility.
Incorporating SAVs into our model required tailored adjustments across the various discrete choice models that form part of our activity-based demand estimation scheme. For each specific activity purpose, distinct adaptations were made to the respective mode and mode/destination choice models. In mode choice models focused on work and education-related trips, we integrated SAVs as a novel mode choice, adjusting parameters to reflect their unique characteristics. For other activities, similar adaptations were made within the mode/destination choice models. These included recalibrating the beta parameter for in-vehicle travel time to represent the enhanced multitasking capabilities in SAVs. Additionally, we removed the access and egress time components for SAVs and introduced a bus-equivalent wait time. The cost of SAV usage was assumed at $ 0.3 per mile, in accordance with the literature ( 37 ). This methodological approach established our base scenario for SAV integration. To further examine the influence of SAVs on perceived VOT and accessibility, and their subsequent effects on behavioral patterns, we conducted detailed scenario analyses within these models, presented in more detail below.
Mode extra: Scenario used to simulate the modal shifts and acceptance of longer trips for nonmandatory trips. Changes in the model considered the VOT in mode/destination choice models for shopping, leisure and other types of trips.
Mode main: Scenario used to simulate the modal shifts of the main, mandatory activity (work or education). Changes in the model considered the VOT in work and education mode choice models.
Nonmandatory: Scenario used to simulate the increased number of nonmandatory trips, by changing the β parameter of the logsums in models that determine the number of shopping, other and leisure trips to 50%, 70% and 90% of the base one.
All: Scenario used to simulate the cumulative effect of all the behavioral changes, by implementing all changes mentioned above in the demand estimation models.
The considered VOT is still not determined, as SAVs are not yet fully available. Therefore, to investigate the plausible impact, the VOT reduction is subject to scenario analysis: 50%, 70%, 90% of in-vehicle VOT for a car. The reader might argue that the in-vehicle travel time of a shared ride would not be significantly lower than that of a car. Nevertheless, the VOT will significantly depend on the design of the SAV, which could be divided into personal areas, securing comfort, privacy and satisfaction for its clients ( 38 ). Moreover, the interior of the vehicle could be adjusted for the purpose of the trip or a user type, which would significantly lower the VOT, validating the assumption.
The calibration of the demand estimation involved adjusting the alternative specific constants (ASCs) in the utility functions of both the mode and mode/destination choice models, as well as in the time choice models. This adjustment was necessary to accurately represent the alternatives that were either over- or under-represented in the context of Santander. Around 25 ASCs were readjusted in an iterative manner to best reflect the specific transport situation and user preferences in Santander.
Supply
Traffic Simulator
The Pre-day simulation, as described above, generated activity schedules for each individual in the population. The information was then processed using a Python script to represent the trip-chains of individuals in origin–destination (OD) matrices accepted as a demand input by the used traffic simulator from an external company, Aimsun Next. The traffic in Aimsun is simulated using microscopic traffic simulation with static path assignment combined with dynamic path reassignment for 30% of all vehicles (with update interval set to 5 min, compliance rate of 80% and en route option activated). The supply model, apart from simulating car and SAV trips, also includes the public transportation simulation using the up-to-date bus schedule. The SAVs were modeled adjusting the car following, lane changing and gap acceptance behavioral models in accordance with the literature ( 39 – 41 ). Moreover, the SAV fleet was equipped with the Cooperative Adaptive Cruise Control module implemented in Aimsun.
Usage of microscopic traffic simulation in Aimsun, although computationally intensive, allowed us to obtain the inputs required to estimate the environmental rebound effect, by using the battery consumption model and pollutant emission model of Panis et al. ( 42 ), integrated with the microscopic simulation. Nevertheless, because the microscopic traffic simulation was computationally and time intensive, we decided to limit the simulation time to one day, assuming that the SAV fleet would return to its beginning state.
SAVs Operator
The first task of the SAVs operator is fleet planning, which was achieved with the Decision Support Tool developed under the European Project MOMENTUM, by the Centre for Research & Technology Hellas/Hellenic Institute of Transport (CERTH/HIT) ( 43 ). The Decision Support Tool allowed us to estimate a fleet size and the beginning setting of the fleet, using the appropriately transformed activity schedule from SimMobility and a polygon area of the network. In each of the simulated scenarios, the fleet size was determined to be large enough to cover all ride requests.
The second task of the SAVs operator is fleet management, which allows to match the ride requests to vehicles. This assignment was performed using capacitated vehicle routing problem with time windows (CVRPTW) optimized by Google OR-Tools ( 30 ). The output that the fleet operator provides was optimized to handle all requests while minimizing the total distance of the fleet. The fleet operator handles the requests for SAVs from individual passengers. The request includes the intended pick-up and drop-off locations, pick-up and drop-off time windows and number of passengers requesting the ride. The SAVs were assumed to resemble regular cars, with capacity for five passengers. Further assumptions on the requests concerned the maximum waiting time (set to 5 min) and boarding time (set to 1 min).
The fleet management was integrated with the traffic simulation via the Aimsun Ride plug-in through a Transmission Control Protocol/Internet Protocol interface. The key features of the interface involved passing the information between the traffic simulator and the fleet operator. The requests were treated dynamically, that is, one-by-one, in the order they appeared from the SAVs operator. The Aimsun Ride platform then simulated the execution of the requests given to the operator, updated the status of all vehicles in the fleet and performed a simulation against the historical traffic conditions (simulated for the car demand).
Demand–Supply Interactions
Demand–supply interactions are modeled thorough a Python controlling algorithm which triggers the SimMobility Pre-day model and Aimsun traffic simulation as subprocesses. Moreover, it provides the necessary data processing to adjust the inputs to the required format for each tool used. The interaction of demand and supply allowed the study results to achieve convergence, based on the widely used relative gap convergence measure with a maximum simulations number capped at 100 ( 37 ).
Emissivity Results
The outputs of the traffic simulation were CO2, NOX and PM2.5 emissions from the combustion engine vehicles (according to the Panis model) and the total electricity consumption of EVs (battery consumption model). The total emissions of the system were then calculated assuming the electricity grid emissivity for the year 2040. The emissivity data was taken from the Spanish national strategy for decarbonization and predictions of the European Environment Agency ( 44 – 46 ).
Case Study
The analysis has used as a case study the city of Santander in Spain (population 172,957) ( 47 ) as it offered an optimal compromise between complexity of transport dynamics and overall size of the transport network to be simulated via microsimulation. In addition, very detailed information about travel choices was available for this case study, allowing a reliable estimation of the users’ preferences. The data used included a transport diary survey of the Santander population from 2013 (sample size 1,384) and the total population counts for each transport zone. The transport diary survey included all trips made by each individual within one household, as well as socioeconomic information about the household and the household members.
The parameters of the utility functions of SimMobility models (the chain of discrete choice models) were obtained using the travel diaries data and estimated using the Biogeme software ( 48 ). Each utility function consisted of individual attributes as well as parameters tailored to the given model. This allowed us to properly estimate the discrete choice models and recreate the behavior of Santander’s population. The attributes used in the utility functions were: age, gender, main activity type, occupation, household income, household size, household vehicle ownership, VOT, cost, alternative specific coefficients and logsums. Logsums are information from models that are executed later along the chain of models. They are required in tour mode and mode/destination models and day pattern models and could represent the accessibility value in the utility choice models. More than 200 parameters were obtained to carefully represent the behavior of Santander’s population.
The comparison of simulated and trip diaries observed results concerning number of tours, aggregate trip mode shares and trips by time of day are presented in Figure 4. The results indicate that the base case model well represents the behavior of Santander’s population. The figure also illustrates their transport preferences.
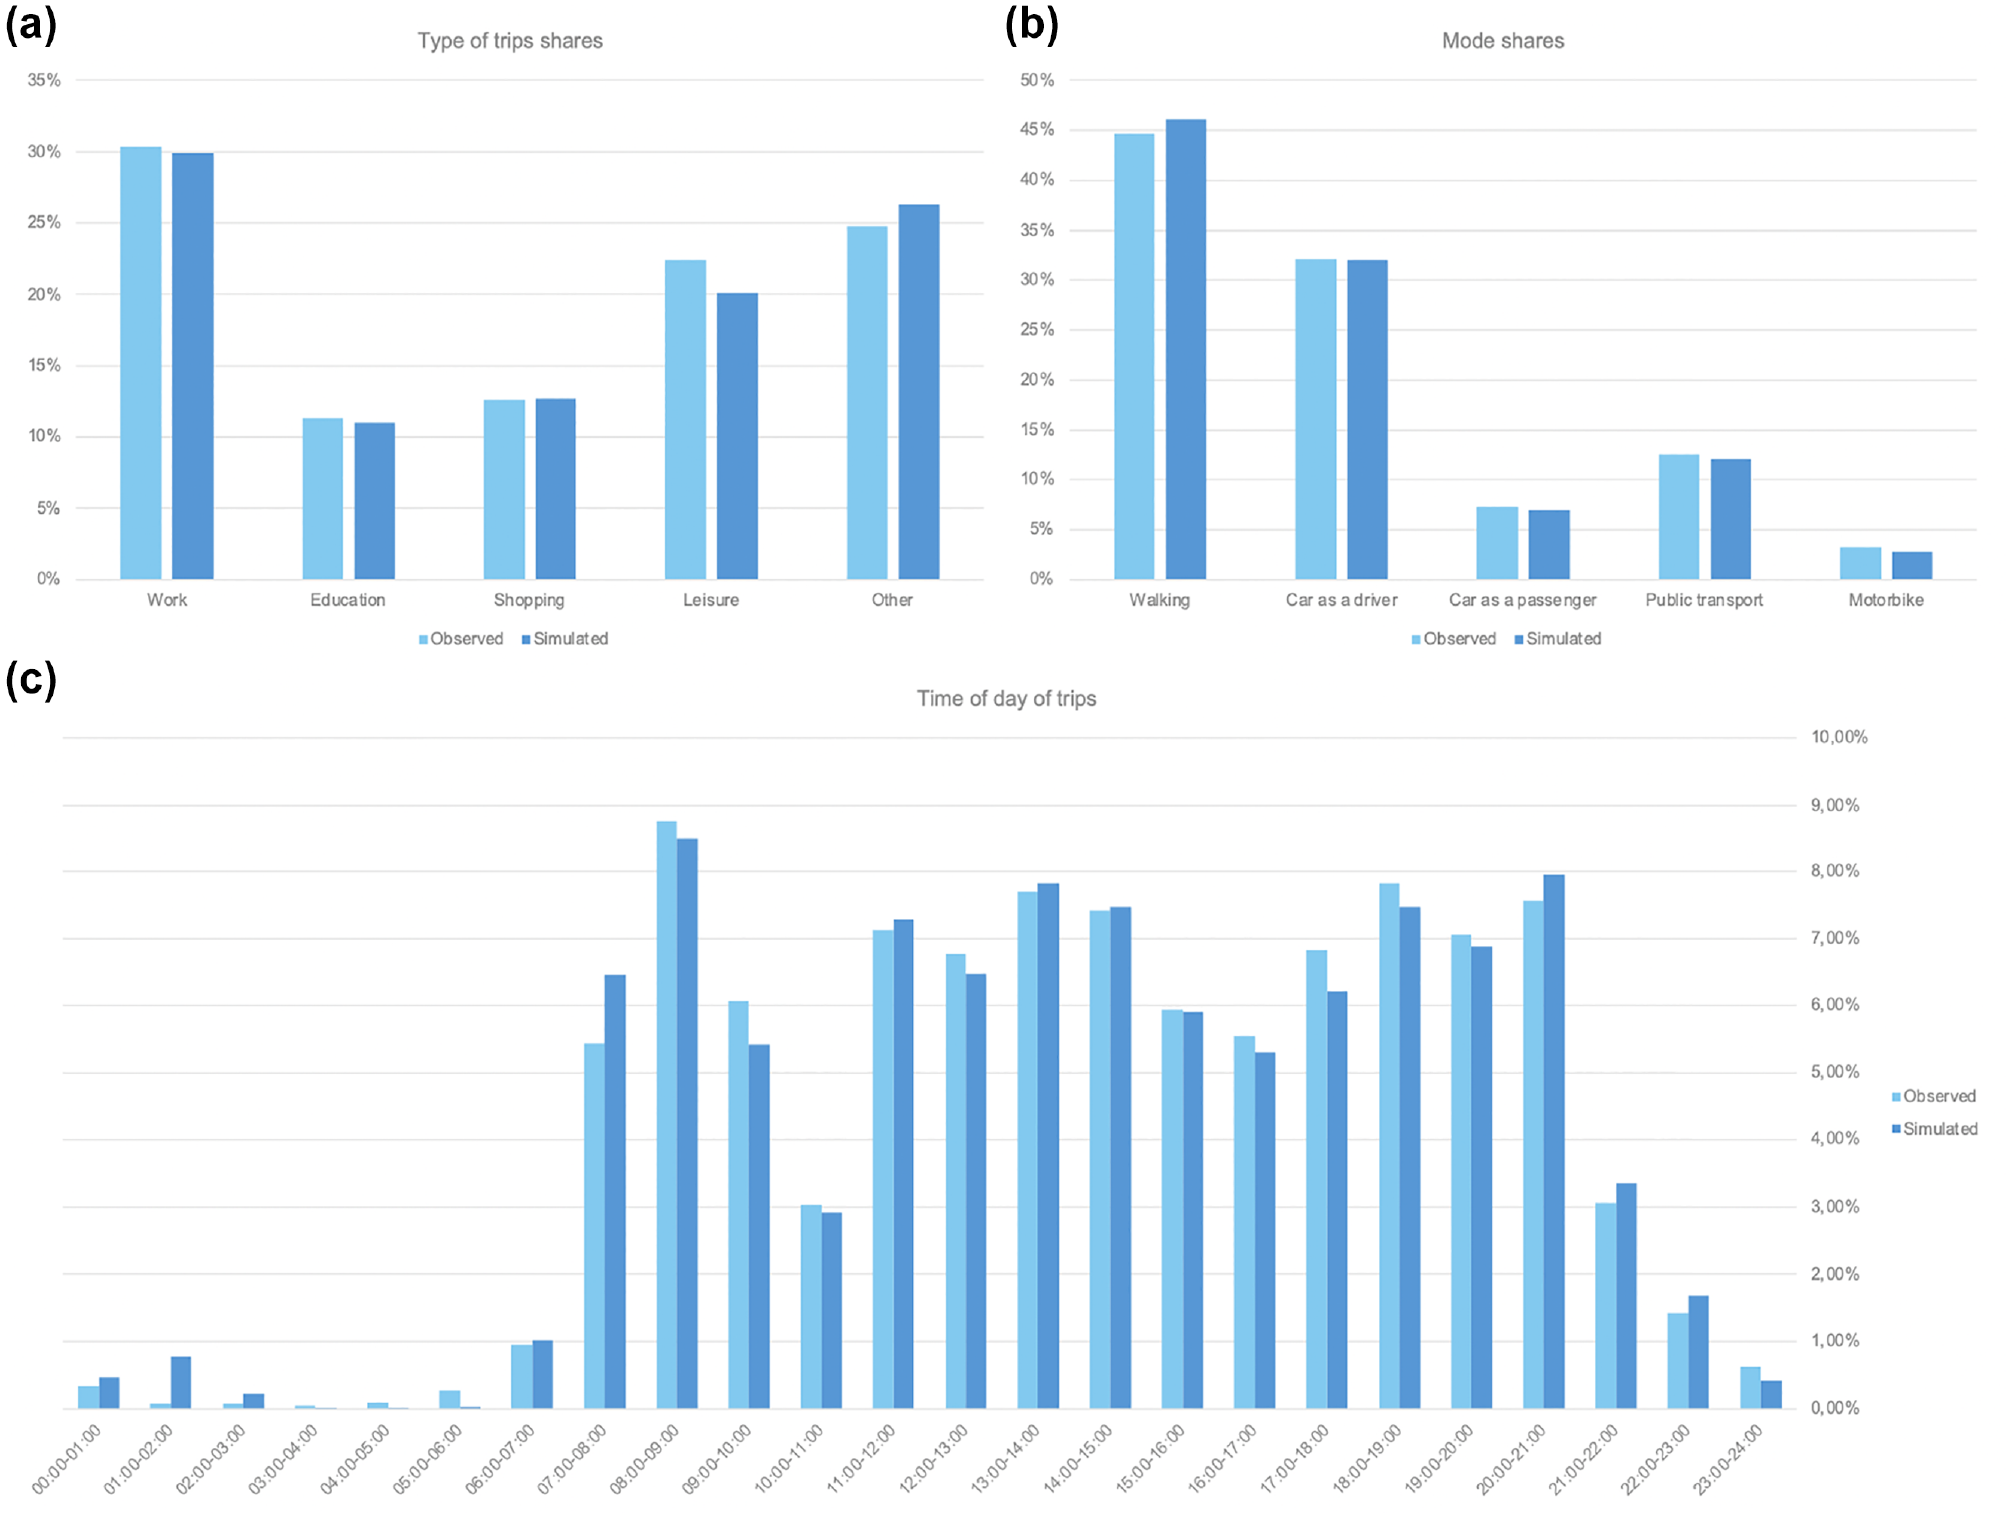
Comparison of observed and simulated base case demand results, in percent: (a) type of trips; (b) mode of trips, (c) time of day of trips.
The Aimsun microsimulation model was set up to include the Santander network copy. The supply model of Santander was developed and calibrated by the SUM+Lab of the University of Cantabria using real data obtained from numerous sensors and cameras located in the city. The model is often used for the development of transport policy by regional authorities. An overview of the simulation network is given in Figure 5.
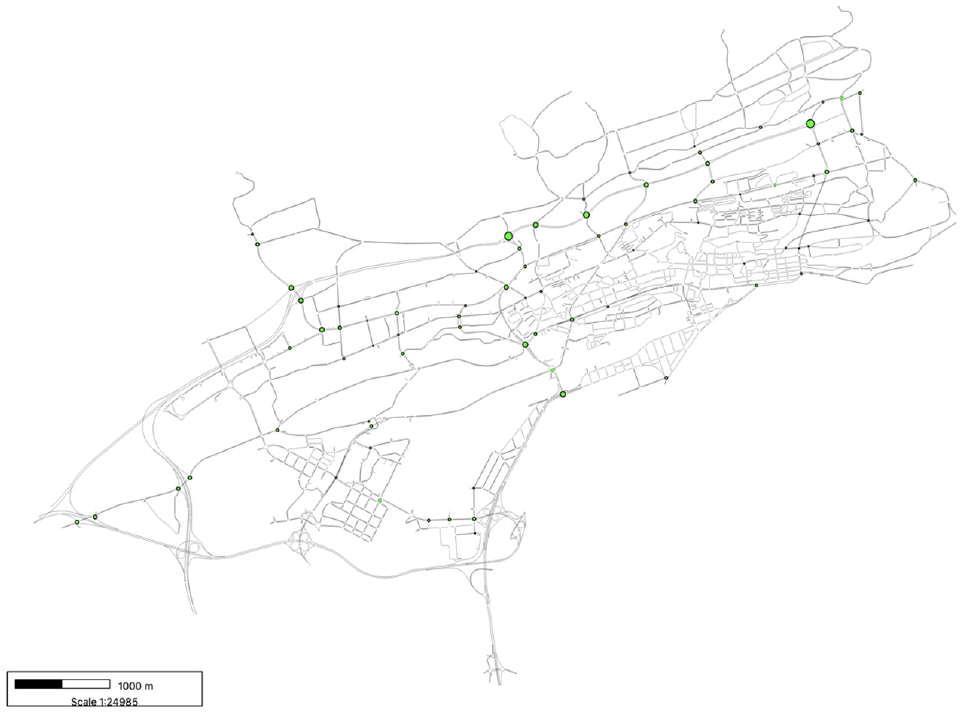
Santander network.
The characteristics of the transport network representation that covers the urban region of Santander were: size (km): 11.00 × 6.00; number of centroids: 113 (12,769 OD pairs); number of detectors: 230; number of sections: 4,106; number of nodes: 1,454; type of signal controllers: fixed ( 49 ). This area was chosen based on its availability in the Aimsun simulation software, its complexity and data availability.
Results and Policy Recommendations
The results of the base case scenario showed that SAVs could have the potential to lower the environmental impact of the transportation system, with the potential to reduce CO2 emissions by 55% to 60% based on the use of EVs and the assumed target of highly renewable energy mix in Spain for the year 2040. These results are in line with other case studies performed, which predict a decreases of between 16.8% and 87% in CO2 emissions for various urban environments, powertrain and energy mixes ( 16 ). The results show that with no SAVs introduced, the CO2, NOX and PM2.5 emissions would be significantly higher because of higher dependence on vehicles with more emissive combustion engines. Moreover, the results show that the introduction of SAV-based services would not significantly affect the congestion in a mid-sized, congestion-free city in Europe, as represented by the lower daily flows and similar average speeds in all the scenarios run for this study.
Nevertheless, the results obtained from the simulation showed that we can expect an environmental rebound effect as a consequence of the deployment of SAVs and the comfort and freedom those vehicles could offer, reducing the VOT. When the VOT was assumed to be 90% of that of a car and all the analyzed behavioral shifts are considered, (all) the CO2 emissions are 27% to 31% higher than those of a scenario in which the SAVs are introduced but do not trigger any behavioral changes (base SAV). The rebound effect significantly reduces the positive environmental impact of the electric SAVs compared with the scenarios in which all vehicles are privately owned (base no SAV). This entails that the SAVs system should be carefully designed and implemented by regional policy makers, to ensure that the final system is indeed environmentally sustainable. In the analyzed individual behavioral shifts, electricity consumption also increased because a higher share of the population opted for SAVs. The lowest environmental change was caused by the modal change for main activity location trips. Nevertheless, the CO2 emissions still increased by almost 5% to 7% compared with the base scenario, because of individuals switching to SAVs from more sustainable modes of transport, such as walking or public transport. The highest rebound effect from individual behavioral shift was caused by individuals opting to participate in more nonmandatory activities, which caused a 22% to 27% rebound effect in the CO2 emissions. A similar pattern could be seen in the vehicle kilometers traveled (VKT) by the vehicles in the system, which increased with the introduction of the SAV service. While the introduction of SAVs had the potential to lower the VKT (base SAV scenario), the behavioral changes triggered by the ability to multitask result in higher VKT. This increase was caused by more individuals opting to switch to travel in SAVs from more sustainable mobility options, such as walking or public transit, which are not included into the VKT calculations.
All of the previously described behavior of the rebound effect holds true if the assumed VOT is 70% of that of a personal car. The obtained environmental rebound effect of all behavioral changes was 34% to 38% higher compared with the scenario in which the behavioral changes are not triggered. It is worth noting that the VKT did not increase significantly, as compared with the previous scenario, manifesting the overall saturation of the daily activities in the analyzed population. Moreover, the impact of the introduction of SAVs on the transport system is positive even if behavioral changes are triggered, as the flows decrease and the average speeds in the analyzed area do not change significantly.
When the VOT was assumed to be 50%, the results followed the same behavioral patterns, increasing the environmental rebound effect even further to 38% to 43%, and slightly increasing the VKT compared with the previous scenarios. This could be explained by a further push toward clean electric technology from those who previously owned combustion engine vehicles, as well as because the rides in SAVs are shared. All the previously discussed results are presented in Table 1.
Mean Results of the Rebound Effect Study according to the Assumed Value of Travel Time
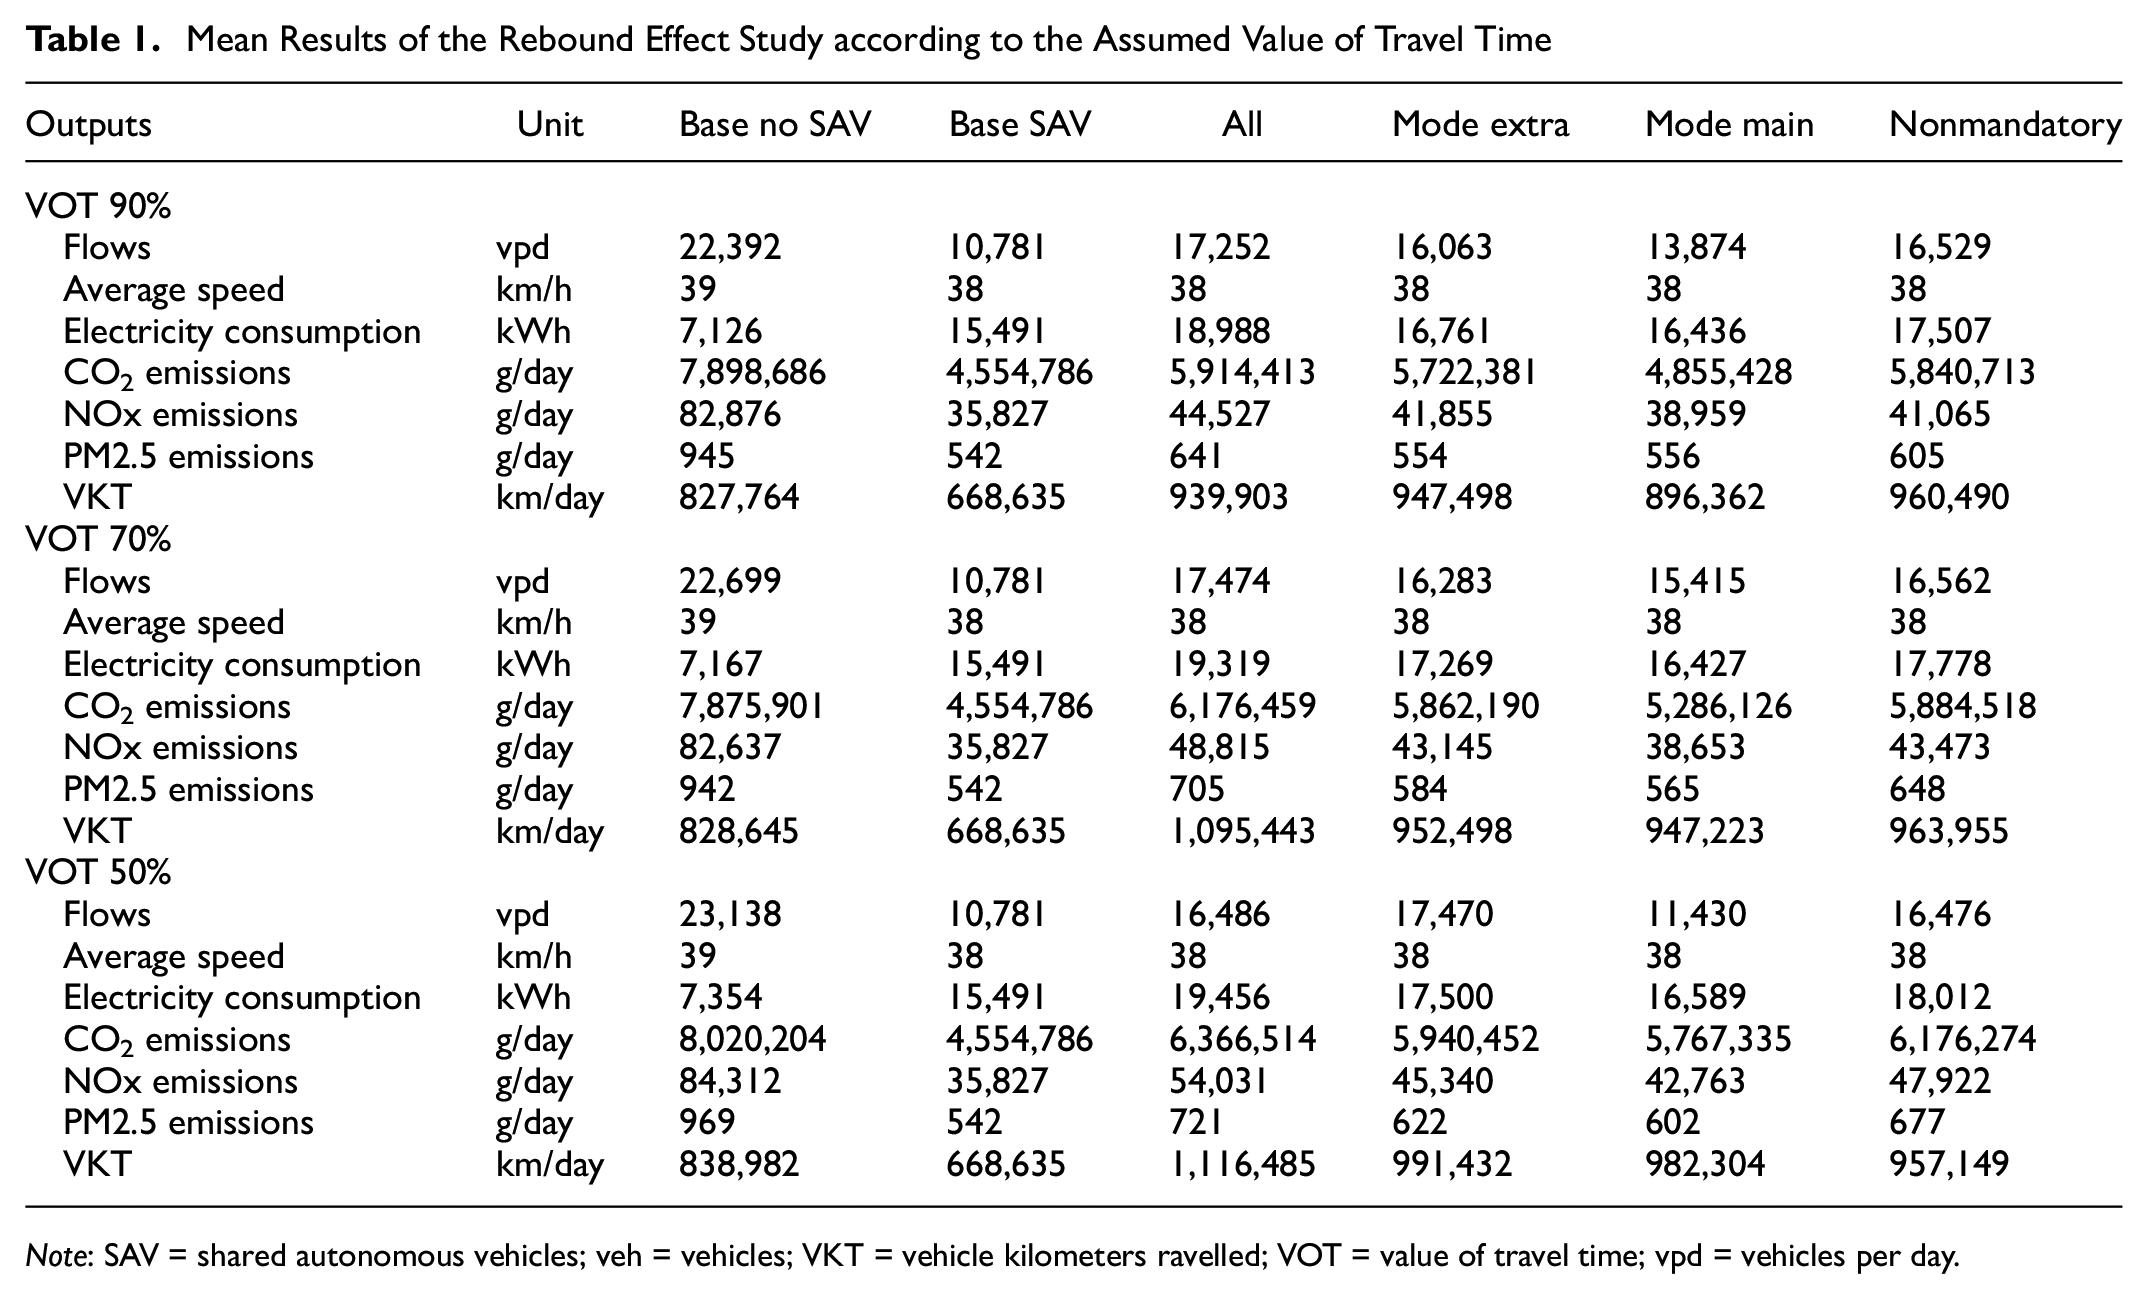
Note: SAV = shared autonomous vehicles; veh = vehicles; VKT = vehicle kilometers ravelled; VOT = value of travel time; vpd = vehicles per day.
The results of the simulated scenarios show that, while the introduction of SAVs could be overall sustainable, the rebound effect could lessen the desired impact of lowering emissions. Therefore, it is of utmost importance to design the SAV-based services along with their users, while keeping in mind the negative externalities to assure their sustainable uptake. For instance, the AV service could reduce congestion, number of vehicles, VKT and emissions if only shared rides are available. Moreover, it is important to ensure that citizens do not switch from more sustainable alternatives, such as walking or cycling, especially on shorter trips. In the era of AVs, that could be easier to achieve, as the total number of vehicles on the road as well as parking space could be vastly reduced. The freed land could be used to support those more sustainable modes and ensure comfort and safety for their users. Lastly, the service providers, regulators and citizens should co-create the interior of the SAVs, to ensure their substantial uptake, as the results of this study show that the rebound effect could be lowered if the car owners are encouraged to use SAV-based services.
Summary and Conclusions
The introduction of SAVs on the market will certainly revolutionize transport in both urban and rural areas. Nevertheless, before we allow SAVs to roam our cities, we should strive to predict the impacts that they could have and prevent as many negative externalities as possible, especially considering the contribution of transport to environmental pollution and the climate crisis. Nevertheless, the previous simulation studies that included the behavioral changes triggered by SAVs, presented in more detail in the literature review section, have focused on the efficiency of the transport system itself, without further investigating the environmental impact of SAVs. For this reason, we tried to estimate the plausible environmental rebound effect linked to behavioral changes caused by deployment of SAVs. We believe this topic to be particularly interesting for transnational or national policy makers, urban planners as well as regional authorities.
The environmental rebound effect is linked to behavioral changes, so it could only be obtained using methods that allow for the singular representation of individuals in the investigated sample. Thus, our choice of an activity-based demand estimation representing the city of Santander in Spain in a simulation platform, SimMobility. The discrete choice models, which constitute the SimMobility Pre-day package, were estimated based on travel diaries using Pandas Biogeme Python library. The demand model was calibrated using the alternative specific coefficients in the discrete choice models and the weighted results of the travel diaries. Thereafter, the results of the demand model were an input of a microsimulation of traffic in the Aimsun Next software. The microsimulation of traffic allowed us to use environmental and battery consumption models, from which the estimated environmental rebound effect was obtained. The travel times were fed back into the SimMobility Pre-day package until convergence was achieved.
The main outcome of this study is the estimation of an environmental rebound effect: results showed that the behavioral changes could indeed lead to a significant rebound effect. The maximum obtained rebound effect resulted in almost 40% higher CO2 emissions compared with a scenario in which the SAVs are introduced but no behavioral changes linked to perceived lower in-vehicle VOT were introduced. The behavioral change that caused the highest rebound effect in all the scenarios was the participation of the analyzed individuals in more nonmandatory activities, while the modal choice for a work or education trip contributed to the lowest rebound effect out of the analyzed behavior shifts. Therefore, it is of utmost importance to regulate and design the SAVs services in a sustainable manner, ensuring that the environmental rebound effect of those vehicles would be limited. The outcomes of this study show that the deployment of technology itself cannot secure the sustainable development of transport, because of the environmental rebound effect. Instead, a careful consideration of how SAVs should be incorporated in a city is needed. Such a proactive approach could allow cities to avoid the consequences of uncontrolled deployment of the technology. Those consequences we can all see nowadays in cities around the world overcrowded by private cars.
Our study offers insights into the deployment and impact of SAVs in a mid-sized European city, demonstrating a robust approach in understanding urban mobility dynamics. While our research provides valuable predictions and observations, it is tailored specifically to the unique urban fabric and mobility patterns of a mid-sized European setting. This specificity, while a strength in offering detailed, context-relevant conclusions, also suggests that our results should be contextualized when considering their application to urban areas with differing characteristics. Furthermore, our focus on shared rides in SAVs exclusively, a deliberate choice to explore the maximum potential of shared mobility, might not encompass the full spectrum of SAV usage scenarios. However, this focus allows for a deeper exploration of the benefits of shared mobility, offering a foundational understanding that can be built on in diverse urban contexts and varied SAV operation models.
Nevertheless, before using our findings for precise policy recommendations, it is important to deepen the research performed in this study. We consider that an adequate follow-up study should analyze a variety of SAV services designs, differentiating the capacity of the vehicles as well as the possibility to order a personal, unshared ride. Moreover, the service analyzed in this study assumed a perfect competition model in which a SAV ride would be available within 5 min from the request. However, such an assumption might not be accurate if the services are regulated by local or national authorities. Therefore, it would also be important to analyze a scenario in which the fleet size of SAVs is capped and could not serve every potential request. Such study could also be developed based on a new transport diary to include the behavioral changes from the long-term social-economic impact of the COVID-19 pandemic conditions. Furthermore, we conclude that recreating such studies in other areas, such as densely populated congested cities as well as thinly populated rural areas, could lead to different results and would be worth investigating.
Footnotes
Acknowledgements
This research has been funded by the Joint Research Centre (JRC) of the European Commission. The authors are especially grateful to Athina Tympakianaki and Tamara Djukic for the suggestions and for the support given to our work, and to Konstantinos Mattas for the continuous discussions which have certainly helped to improve the quality of the paper.
Author Contributions
The authors confirm contribution to the paper as follows: study conception and design: A. Garus, B. Alonso Oreña, B.Ciuffo; data collection: B. Alonso Oreña, L. dell’Olio, R. Cordera Piñera; analysis and interpretation of results: A. Garus, M. Alonso Raposo, A. Mourtzouchou, C. Lima Azevedo, R. Seshardi, M. Moraes Monteiro, B. Ciuffo; draft manuscript preparation: A. Garus, M. Alonso Raposo, A. Mourtzouchou. All authors reviewed the results and approved the final version of the manuscript.
Declaration of Conflicting Interests
The author(s) declared no potential conflicts of interest with respect to the research, authorship, and/or publication of this article.
Funding
The author(s) disclosed receipt of the following financial support for the research, authorship, and/or publication of this article: This work was realized with the collaboration of the European Commission Joint Research Centre under the Collaborative Doctoral Partnership Agreement N035297. Moreover, this research has been partially funded by the Spanish Ministry of Science and Innovation through the project: AUTONOMOUS – InnovAtive Urban and Transport planning tOols for the implementation of New mObility systeMs based On aUtonomouS driving,” 2020-2023, ERDF (EU) (PID2019-110355RB-I00).
ORCID iDs
The opinions expressed in this paper are those of the authors and should not be considered to represent an official opinion of the European Commission.