
Abstract
With the rise in frequency and severity of wildfire events, understanding evacuation behavior is instrumental for emergency planning. Since evacuations have a strong temporal component, the departure and reentry times of people affect evacuation time estimates (ETEs) and congestion. To better understand emergent behavior and to analyze the temporal patterns in evacuations for improved evacuation planning, this paper investigates the movement of people out of hazard areas into host communities during the May 2023 Alberta Wildfires. While most data for these analyses are collected via traffic counts, mobile phones, or surveys, this research overcomes several limitations of these sources via privacy-protected network mobility data provided by the TELUS Data for Good program. From these data, unique devices were located during the evacuation and reentry time periods to model curves in four communities in Alberta ranging in population from 500 to 8,000: Drayton Valley, Edson, Fox Creek, and Rainbow Lake. The resulting departure time sequences first show generally fast evacuations that best match log-normal and log-logistic functions, and slower multiday, bimodal reentry curves. Second, ETEs were 6 to 10 hours and reentry estimates were 23 to 29 hours, which could be integrated into evacuation simulations and emergency planning. Third, the results suggest stable evacuation “S-shaped” curves and functions that could be used for general wildfire evacuation planning, particularly for smaller, auto-centric communities. Finally, the research showcases the benefit of deidentified network mobility data as an alternative data source and the increasing need to consider host communities in evacuations.
Keywords
Climate change has increased the likelihood and reach of wildfires, and when taken in combination with human factors ( 1 ), wildfire events are becoming more frequent and severe. During wildfires, understanding the emergent travel behavior of individuals aids effective emergency planning during both evacuation and reentry. Since wildfires tend to be shorter-notice events, the time it takes to evacuate a community (i.e., the evacuation time estimate [ETE]) becomes increasingly important. However, ETEs and related temporal considerations have been relatively under-researched in the evacuation field compared with other areas (e.g., human behavior, traffic simulations, infrastructure resilience), with only a few examples for departure timing ( 2 – 4 ), reentry ( 5 ), and the influx of evacuees into host communities ( 6 ).
Several key challenges also exist with regard to data collection. Traffic counts, while providing detailed information about the speed, flow, and density of vehicles, are usually limited to major routes (e.g., highways) and depend on operational sensors and detectors. Survey data help identify individual departure timing behavior, though the data analysis is limited by smaller sample sizes and poor region-wide information. Finally, mobile phone data produce good accuracy with higher sample sizes but can be challenging to obtain, clean, and analyze.
To begin addressing these gaps, this research leverages a simpler form of mobile phone data that still retains sufficient geographical detail to answer the following research questions.
What departure times, evacuation curves, and relevant temporal functions emerged for wildfire evacuations in different communities?
What pattern exists for reentry to communities following a wildfire evacuation?
How were nearby host communities affected by wildfire evacuations?
This research leverages aggregated, deidentified, and privacy-protected data from the TELUS Data for Good program to analyze evacuation, reentry, and host community trends over time for the 2023 May Alberta Wildfires. Network mobility data have already been used to analyze the 2021 British Columbia Floods, which found a good match between these data and known events ( 7 ). In this paper, the communities of Drayton Valley, Edson, Fox Creek, and Rainbow Lake were analyzed over the entire evacuation/reentry period and compared with a baseline level of 2022. Expanding on ( 8 ), evacuation and reentry curves for each of these communities were formed, and simple plots were created for the change in the number of unique devices in evacuated and host communities. The resulting analysis provides a comprehensive temporal understanding of the wildfires, which can guide future evacuation and community resilience planning.
Literature Review
Evacuation Response Curves
Evacuation response curves identify the behavior of individuals when subject to hazards that require evacuations. These curves depict the cumulative departures of individuals evacuating over the time length of the evacuation period. Evacuation travel patterns and responses have been investigated for multiple hurricane events including Hurricane Katrina ( 9 ), Hurricane Irene ( 10 ), Hurricane Matthew ( 11 ), and Hurricane Irma ( 12 ). Li et al. created evacuation response curves to represent observed empirical data, noting that these curves followed an S-shape with many departures occurring once hurricane evacuation orders were issued ( 10 ). A study of evacuation departure timing during Hurricane Matthew determined that the timing of evacuation orders was the primary trigger for evacuees to leave and depicted S-curves of evacuation rates in three states ( 11 ). Evacuation travel patterns of nuclear power plant emergencies have also been explored, particularly how the relationship between evacuation and trip generation times is key for simulation ( 13 ). ETEs can be estimated directly from evacuation response curves, which highlight the amount of time it takes for an entire community to evacuate from a hazard.
Specifically for wildfires, evacuation response curves were developed for the 2016 Fort McMurray Wildfire, where the volatility of wildfire evacuations in comparison to hurricane evacuations was noted with steeper S-shaped curves ( 8 ). Furthermore, modeling and traffic simulations for wildfires require a consideration of the speed of the evacuation because of the encroaching wildfire, as opposed to the long lead time and higher predictability of hurricane evacuations ( 14 ). No-notice wildfires and their factors were investigated by Grajdura et al. through the 2018 Camp Fire, with the resulting cumulative response curves of awareness time and departure time depicting the predicted departure rates on an S-curve ( 2 ). Research has been conducted to match cumulative distribution functions for hurricanes such as logit, Rayleigh, and Poisson functions ( 10 ), though work matching these functions has not yet been conducted for wildfire evacuations. This work builds on recent research ( 2 , 8 ) to consider multiple communities, match cumulative distribution functions, and leverage network mobility data.
Wildfire Reentry Periods
Reentry is an emerging field of research in disaster and emergency planning. Siebeneck & Cova initiated an in-depth discussion on disaster reentry, presenting an overview of the process and noting key factors for return strategies ( 5 ). The factors for starting a return include the characteristics of the hazard, sociodemographic characteristics, and the status of lifelines (e.g., utilities, transportation, etc.). Work by Wolshon highlighted the role of transportation personnel in evacuations, with an observed lack of formal planning for reentry despite more attention to infrastructure assessments ( 15 ). A detailed investigation of large-scale evacuations, specifically related to modeling, discussed evacuee information sources and reentry compliance issues observed in multiple evacuations ( 16 ). The use of agent-based simulations in megaregions has assessed reentry traffic while diminishing the notion that reentry traffic is identically opposite to evacuation traffic. Rather, the temporal spread of returnees leads to more efficient network behavior ( 17 ).
Work on Hurricane Irma has explored evacuee behavior during reentry via survey data, noting the multiday nature of reentry and the perception of avoiding traffic by some who delayed returning ( 18 ). Official sources of information were revealed to not affect return as much as the evacuees’ desire to protect their property and return to work ( 18 ). A study on Hurricane Sandy studied information management, indicating the importance of providing information to evacuees such as the presence of secondary hazards in the evacuated areas ( 19 ). Investigations into hurricane reentry motivation and demographic characteristics, with survey data from Hurricane Ike ( 20 ), noted that only a minority of returnees complied with official plans and that higher income levels predicted a delayed reentry. The role of equity during reentry was revealed through a study on Hurricane Irma ( 21 ). In this work, Yabe & Ukkusuri combined census income data with mobility data to identify socioeconomic variations of reentry (and evacuation) over time. Despite recent research, identifying temporal patterns of reentry requires additional case studies, especially in wildfires. This research builds on previous work on reentry by producing reentry-specific curves following wildfire evacuations. Moreover, these curves were developed across multiple communities, which are characteristically smaller in population than in prior work.
Host Communities
Host communities play a large role in wildfire evacuations, though most evacuation research has focused on at-risk geographies rather than safe destinations. Host communities take on large populations of displaced people, further compounding existing infrastructure vulnerabilities ( 6 ). Within these communities, shelter shopping between spontaneous and formal shelters leads to varying levels of demand at emergency shelters and subsequent challenges for effective emergency planning ( 22 ). For evacuees who have been displaced from wildfires, the help of others is a key component of a strong host community ( 23 ). Despite this assistance, evacuees during the 2016 Fort McMurray Wildfire experienced difficulty in finding accommodation and heavy financial burdens ( 23 ).
Research focusing on Indigenous evacuees has identified the need to develop culturally aligned assistance plans as they temporally reside in host communities ( 24 ). Asfaw et al. tied Indigenous evacuation experiences in host communities with a community-based research approach to identify the unique cultural and sociodemographic characteristics of these populations in evacuations ( 24 ). Recommendations from McGee illustrate ways to decrease evacuation impacts on Indigenous communities. These include increased financial and social support, especially given the severe long-term impacts of evacuations on Indigenous communities ( 25 ).
Multiobjective facility location models have been used to optimize pre-identified host communities in Alberta to increase preparedness in communities that have a higher chance of hosting evacuees ( 26 ). Furthermore, potential emergency shelter locations have been identified through new hybrid group decision approaches ( 27 ), and new models have incorporated artificial intelligence into selecting shelter locations ( 28 ). To build on existing work on host communities and fill key gaps, this research identifies the temporal changes of evacuees in host communities using network mobility data.
Data Options
Various types of evacuation and reentry data can provide empirical results about emergent travel behavior. Common data sources include traffic counts ( 8 , 10 , 29–31), mobile device global positioning system (GPS) data ( 3 , 32 , 33 ), and surveys for wildfires ( 2 , 4 , 34–37). Traffic sensor information was used to create evacuation response curves for Hurricane Irene ( 10 ) and analyze wildfire evacuation traffic for the 2020 Glass Fire ( 31 ). GPS data generated by mobile devices have helped determine key evacuation choices, departure times, and evacuee destinations for the 2019 Kincade Fire ( 3 , 32 , 33 ). Cellular data for the 2017 Lilac Wildfire were used to create and validate a mathematical model ( 38 ), which can be helpful for areas with limited traffic sensors. Further research on the 2019 Kincade Fire used survey data with machine learning algorithms to further understand evacuee decision making ( 39 ). Research using survey data related to wildfires has also created joint choice models ( 36 ) and hybrid choice models ( 35 ), and discerned multiple aspects of evacuee decision making ( 4 ).
While GPS and cellular data sets have wide-ranging uses, the accessibility, cost, and required processing reduce their effectiveness. Traffic counts cannot be gathered on all roads because of sensor limitations, and surveys often lack detailed temporal data. As an alternative, Liao et al. investigated the use of network mobility data by comparing the observed traffic conditions of the 2021 British Columbia Floods with the data source ( 7 ). These data are aggregated, privacy protected, and require less processing and infrastructure, making them a strong contender for investigating large-scale travel behavior across a region with sufficiently detailed temporal information.
Data and Methods
2023 May Alberta Wildfires
The 2023 May Alberta Wildfires were a series of wildfires in May 2023 that severely affected communities and the transportation network in the province of Alberta, Canada. While numerous communities were evacuated, the detailed evacuation and reentry of four of them (Drayton Valley, Edson, Fox Creek, and Rainbow Lake) are highlighted in Figure 1 and summarized in Table 1, with information from the Alberta Emergency Alert (AEA) system. Additional information on the 2023 Alberta Wildfires can be found in Beverly and Schroeder ( 40 ).
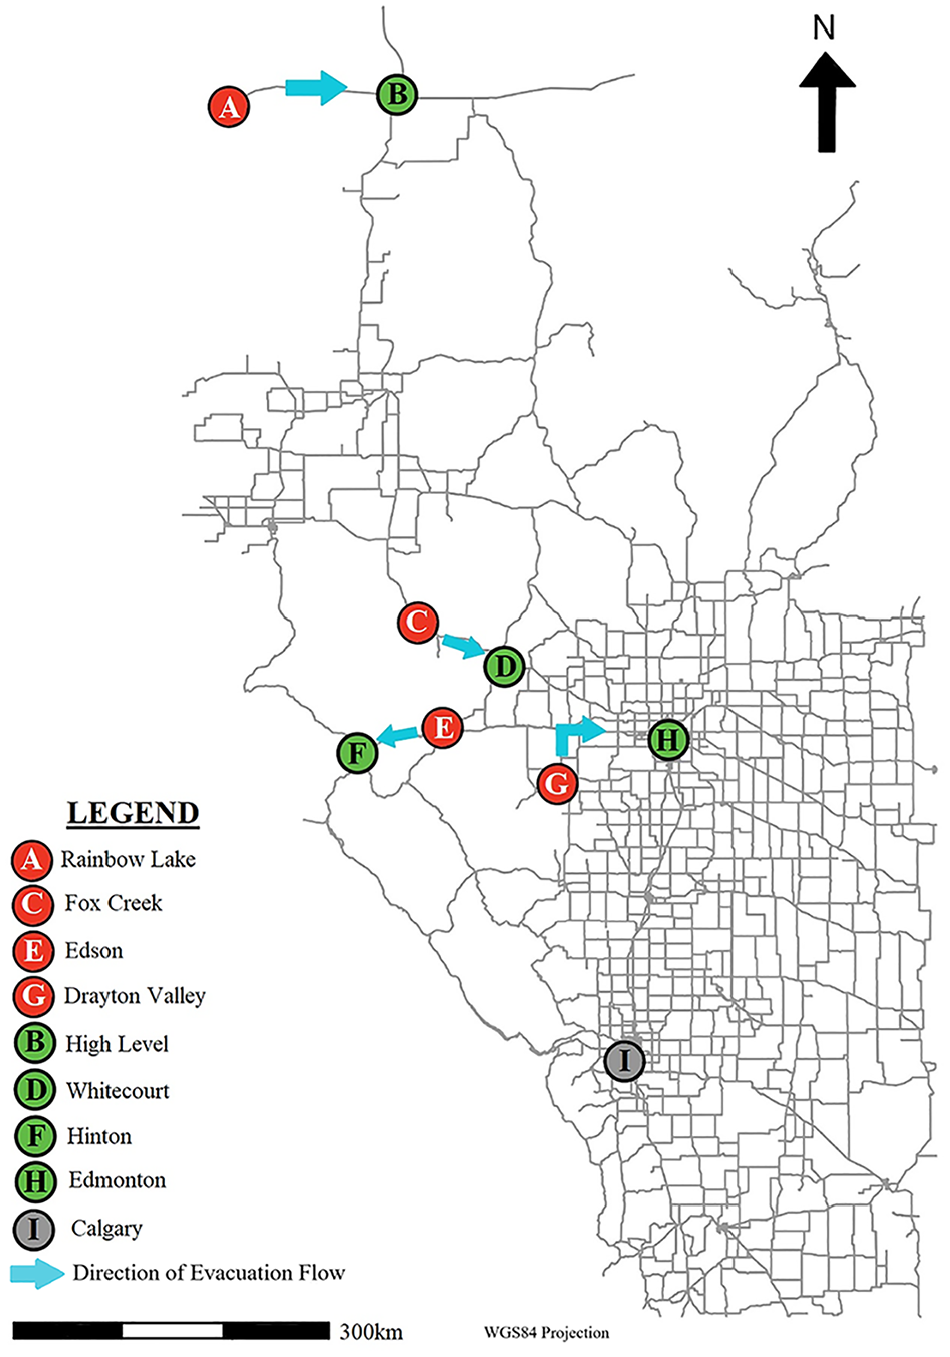
Map of Alberta including evacuated communities (in red), primary host communities (in green), and direction of evacuee movement (blue arrow) ( 41 ).
Community Populations and Evacuation Dates
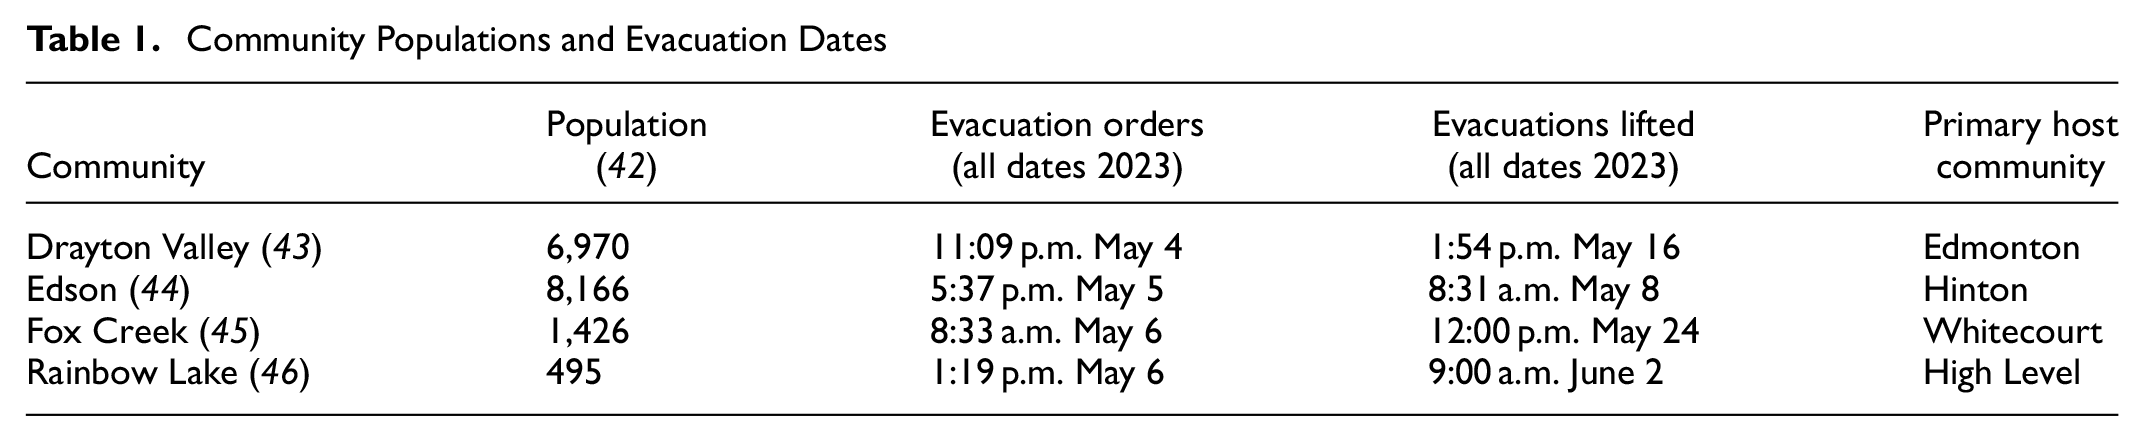
For each evacuation, varying scenario conditions were observed. Each community only featured one major egress route reflecting the nature of Alberta’s highway network. For Edson, a wildfire approached from the southeast, forcing an evacuation west along Highway 16 ( 47 ). This extremely short notice wildfire resulted in an evacuation order issued without prior warning. For Drayton Valley, the Buck Creek Wildfire initially started on the east side of the North Saskatchewan River, before crossing the river and forcing the evacuation of the community ( 48 ). Residents were forced to travel north and then east since the other major egress routes were blocked by fire. Fox Creek residents were provided with an evacuation alert late on May 5, 2023, and received an evacuation order the next morning. The nearby wildfire developed on the east side of the community, moving northwest, forcing residents to evacuate toward Whitecourt ( 49 ). Rainbow Lake, with only one egress route to the east, was quickly evacuated in the face of the approaching Long Lake Wildfire south of the community and remained evacuated for almost a month in total ( 50 ). Figure 1 also includes the general flows of evacuees to their officially (or unofficially) designated host communities.
Data Source
This study uses data from TELUS, a major Canadian telecommunications company, as a part of the TELUS Data for Good program. This program gives access to network mobility data, via an application programming interface (API), that is kept secure, deidentified, and aggregated to ensure that any identifying characteristics remain private ( 51 ). TELUS provides extrapolated results representative of the Canadian population, based on its own proprietary market share data. These results are based on TELUS’s Alberta market share of 53.6% of the overall population in Alberta in 2022 ( 52 ). Nonetheless, these data effectively capture the patterns of unique devices in an area. A device is counted in a specific geographic area if it records sending/receiving a phone call or text message, uses data, connects to a new cell tower, or remains dormant for over 30 min. On average, a device generates 300 records per day and a minimum of 48 records (because of the 30-min dormancy rule). Data for this study show the total number of unique devices available in a user-defined region, including all devices between specified start and end times. The study zones used were the publicly available census subdivisions matching municipality boundaries for chosen Alberta communities. No minimum or maximum dwell time limits were set. The bucket (grouping) intervals were 1 h, which is the most granular level of temporal detail available. Information from AEA for each of the four communities was matched to the network mobility data for each community. Finally, a comparison was developed using 2022 as a baseline, shifting one calendar day to match the same weekday in 2023 (accounting for day-to-day variations).
Departure and Reentry Curves
The evacuation and reentry curves for each community were derived through a simple cumulative count. Evacuation curves began before the first evacuation order or notice and ended once the number of unique devices within the community stabilized at a local minimum. Reentry curves began before residents in the community were officially allowed to reenter. Counting ended once the number of unique devices within the community stabilized at a local maximum. The curves were also normalized by dividing the hourly number of departures or arrivals by the total number of departures or arrivals for each community.
Departure Curve Equations
Woo et al. identified the potential to match common distributions to wildfire departure curves (8). In this study, logistic, Rayleigh, and Poisson functions were chosen, which have been used previously for hurricane evacuation departure curves ( 10 ). In addition, log-normal and log-logistic distributions were also selected. Equations 1 to 5 represent the cumulative density function of the five chosen distributions.


The logistic distribution, Equation 1, features the mean (u) and a scale parameter (s) related to the standard deviation. The Rayleigh distribution, Equation 2, features γ (scale parameter), and the Poisson distribution, Equation 3, features λ, a parameter indicating occurrences in a given time interval. Equation 4, the log-normal distribution, features μ and σ, the mean and standard deviation of the logarithmic data respectively. The log-logistic distribution, shown in Equation 5, features α, a scale parameter and β, a shape parameter. To match these functions to each normalized curve, an analysis of minimizing the root mean square error (RMSE) was performed. To further test the fit of the distributions, the Kolmogorov–Smirnov test was performed for each curve. The null hypothesis is that the data follow the selected theoretical distribution. The alternative hypothesis is that the data do not follow the distribution. A critical D statistic value for each community was derived. In this case, a p-value above 0.05 indicates that the null hypothesis cannot be rejected, and the data follow the distribution.
Results
Evacuation Timeline
The following figures (Figures 2 to 5) depict the number of pings from unique devices in the four evacuated communities in comparison to the baseline. For each community, unique devices significantly dropped in 2023 compared with 2022, indicating an evacuation at the beginning of the wildfires. Unique devices increased later in the month, indicating reentry. Edson experienced the quickest return of evacuees with just 4 days between the evacuation start and the reentry end. A large drop is observed between May 14 and 15, 2023 in Figure 5 for Rainbow Lake, likely because of a loss of cellular network. All plots show distinct evacuation and reentry periods that meet a priori expectations.
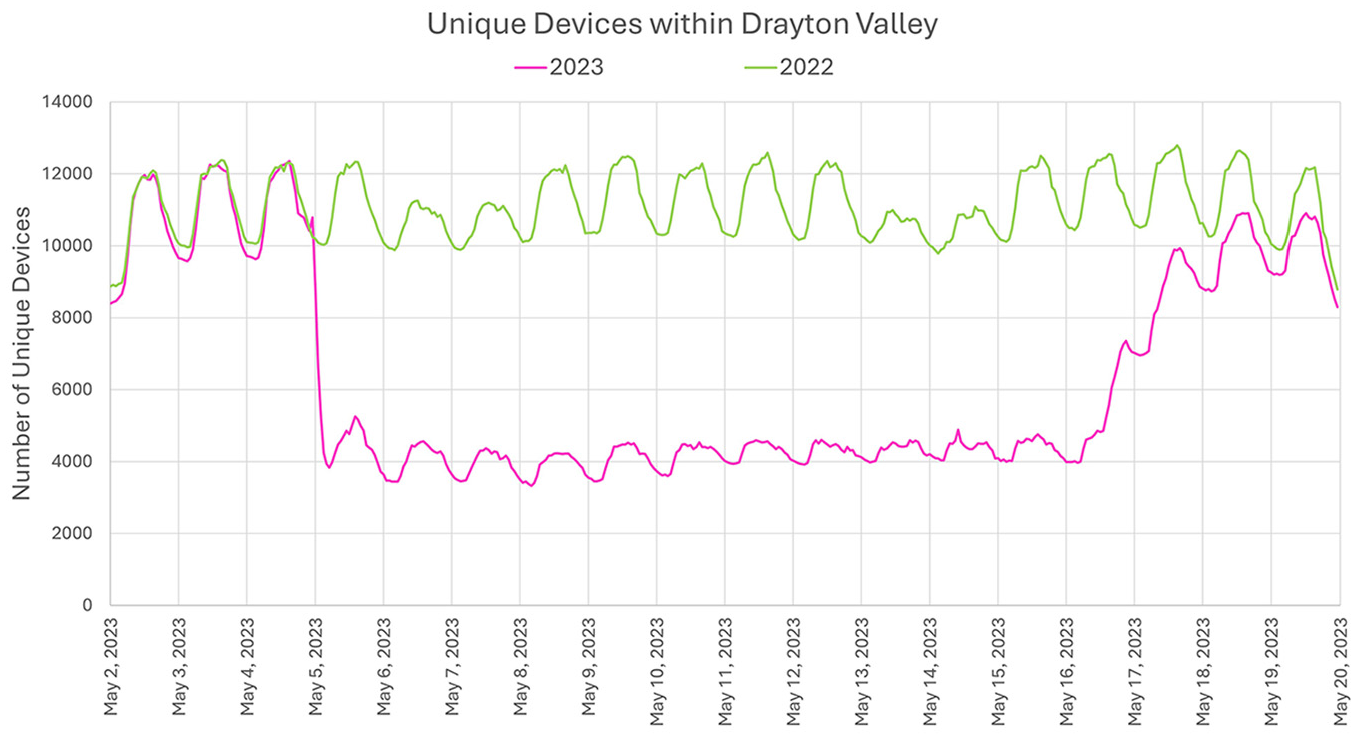
Unique devices within Drayton Valley.
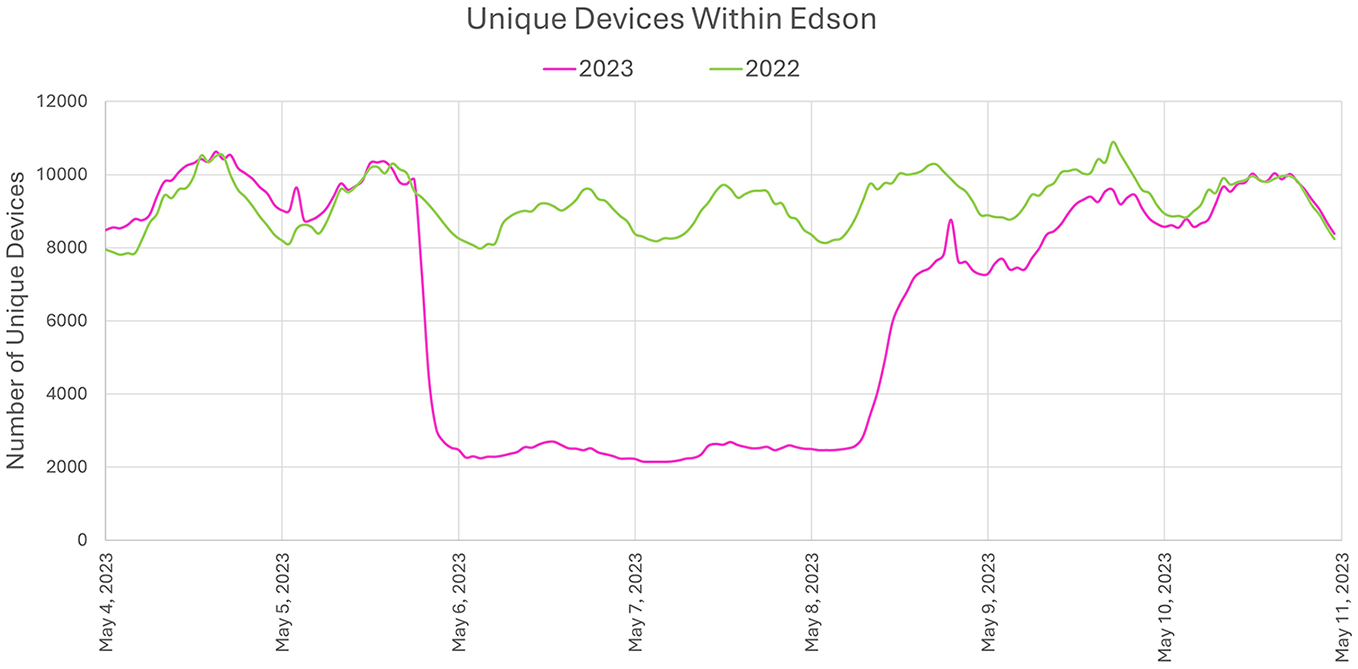
Unique devices within Edson.
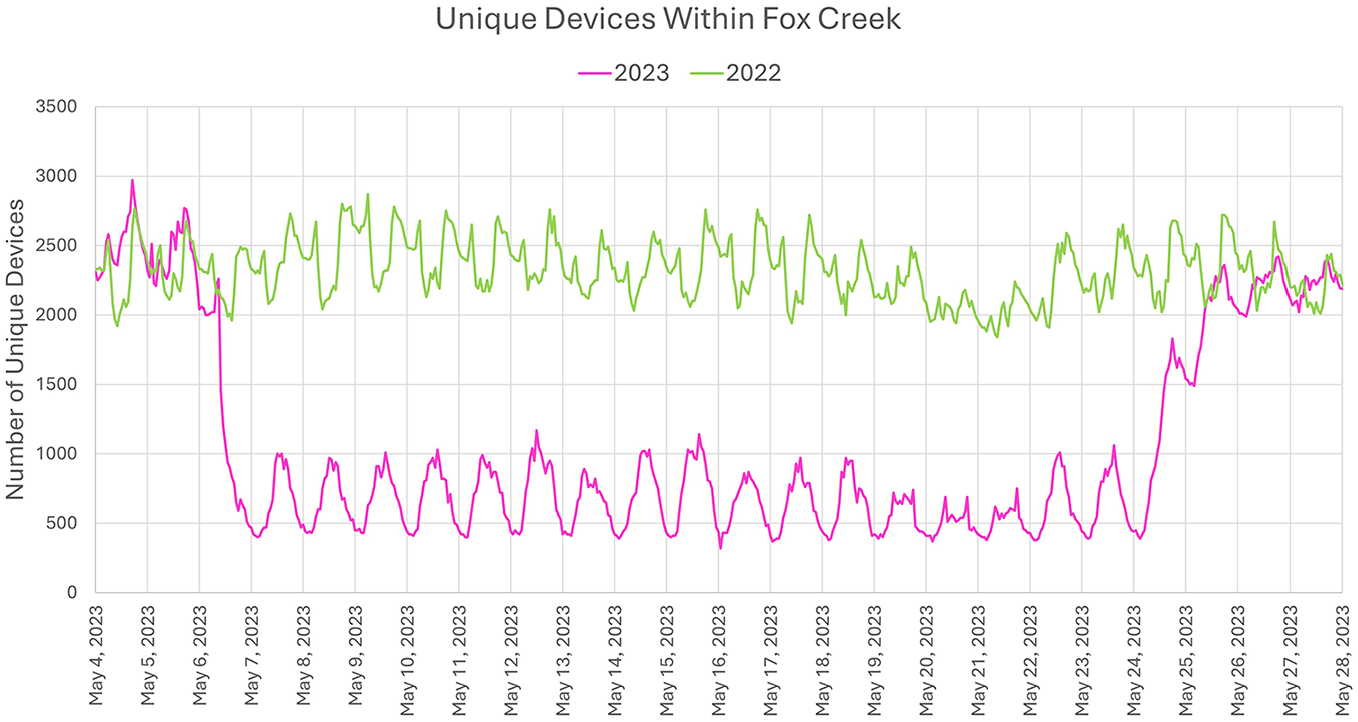
Unique devices within Fox Creek.
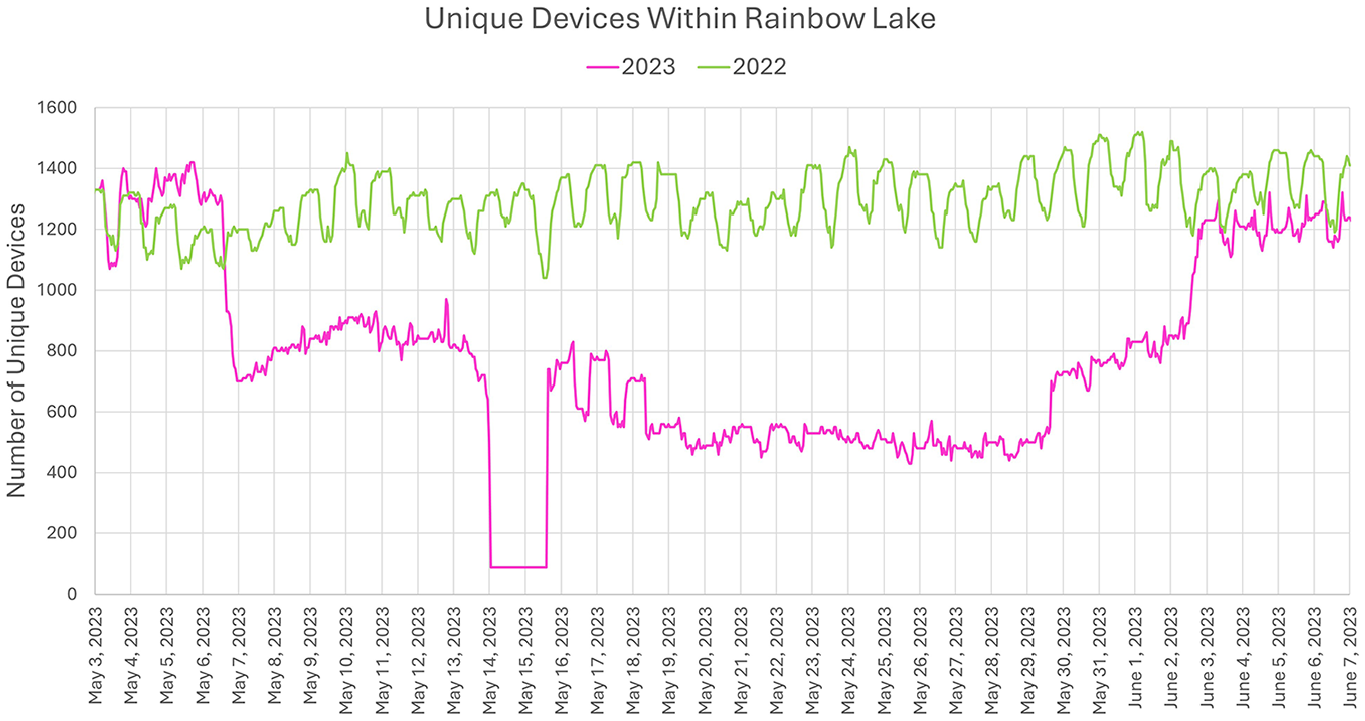
Unique devices within Rainbow Lake.
Evacuation Curves
Evacuation curves display more specific information about how the number of devices changed during the evacuation process. On the evening of May 4, an evacuation alert was issued in Drayton Valley 30 min before the evacuation order. Into May 5, the number of departures increased significantly (Figure 6). An evacuation order was also issued in Fox Creek, though it came 12 h after the initial alert (Figure 7). Departures increased following the order, though there were also small increases following an advisory on Facebook and the alert. For Edson (Figure 8) and Rainbow Lake (Figure 9), evacuation orders were issued without any other alert, and departures rose quickly following the orders. For all cases, the evacuation was relatively “smooth,” without major spikes in demand.
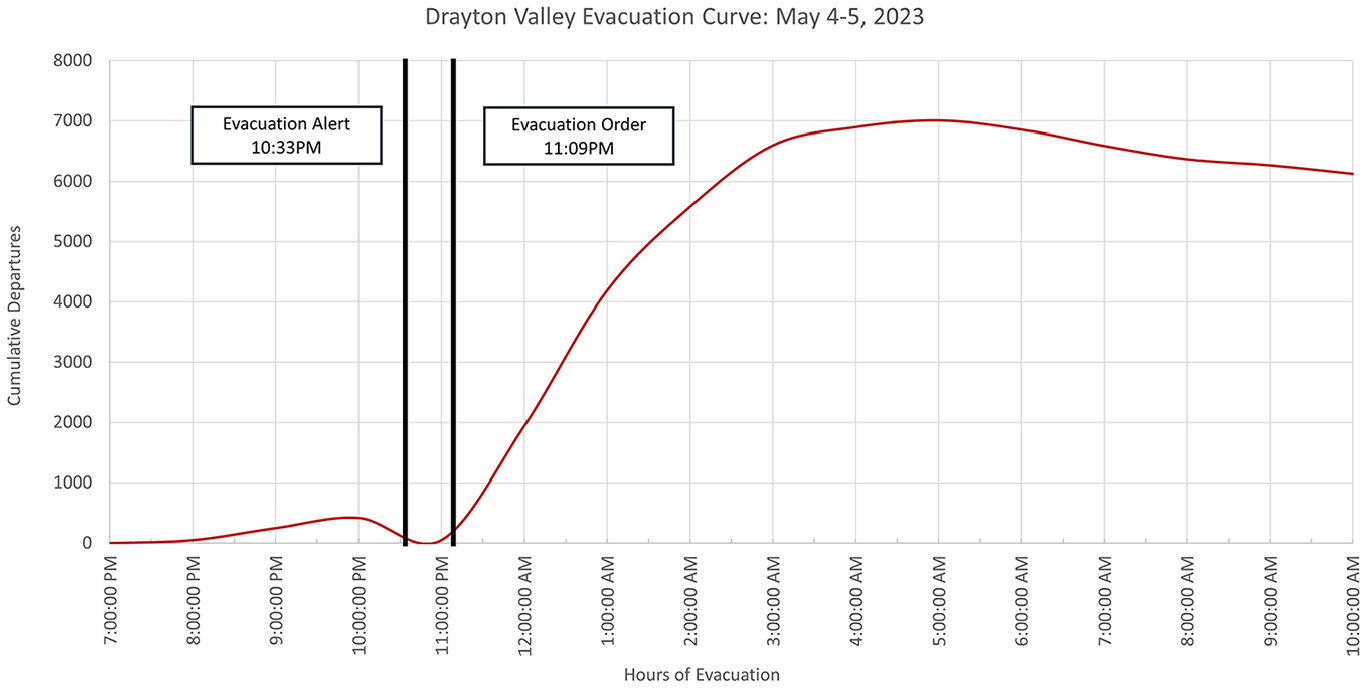
Drayton Valley evacuation curve.
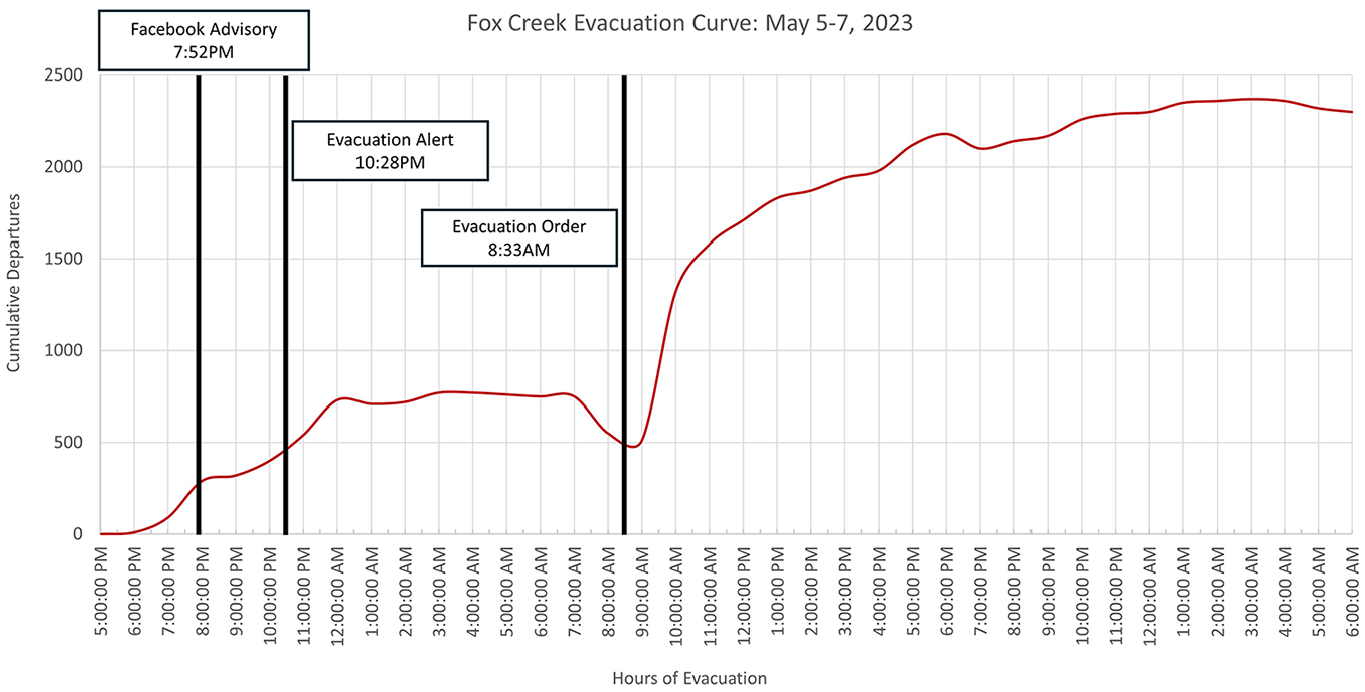
Fox Creek evacuation curve.
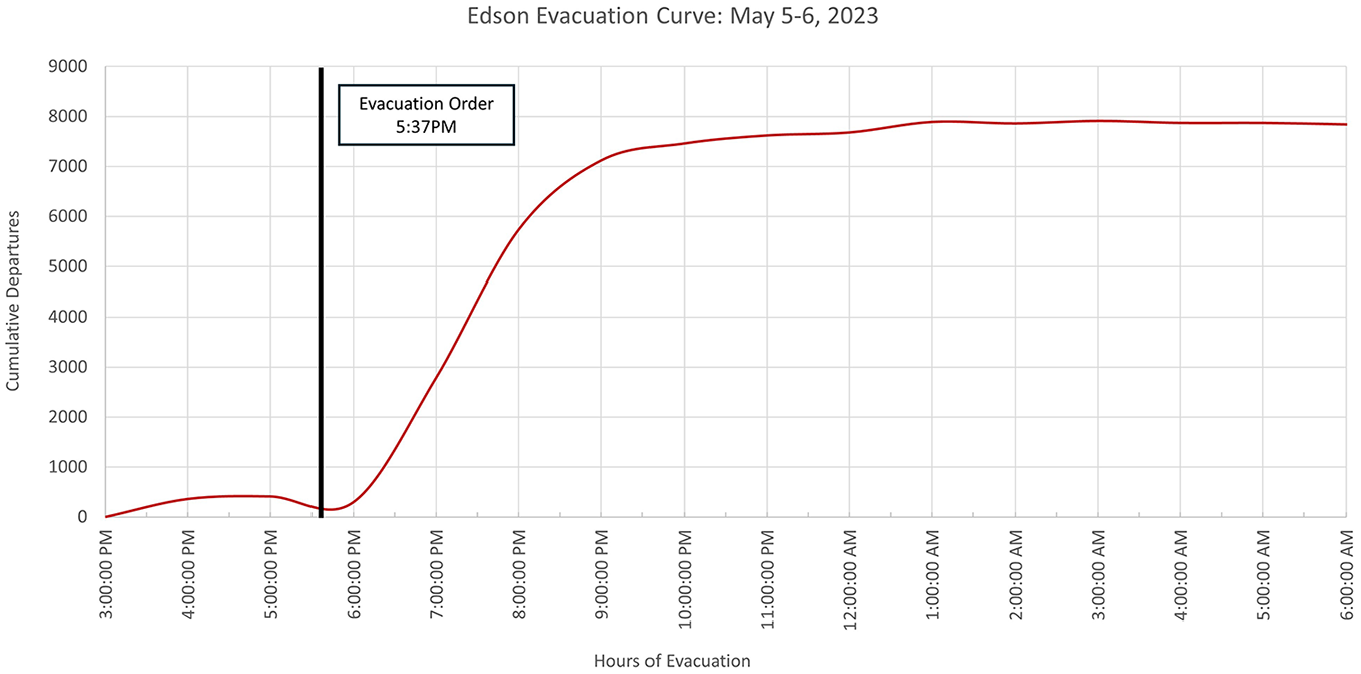
Edson evacuation curve.
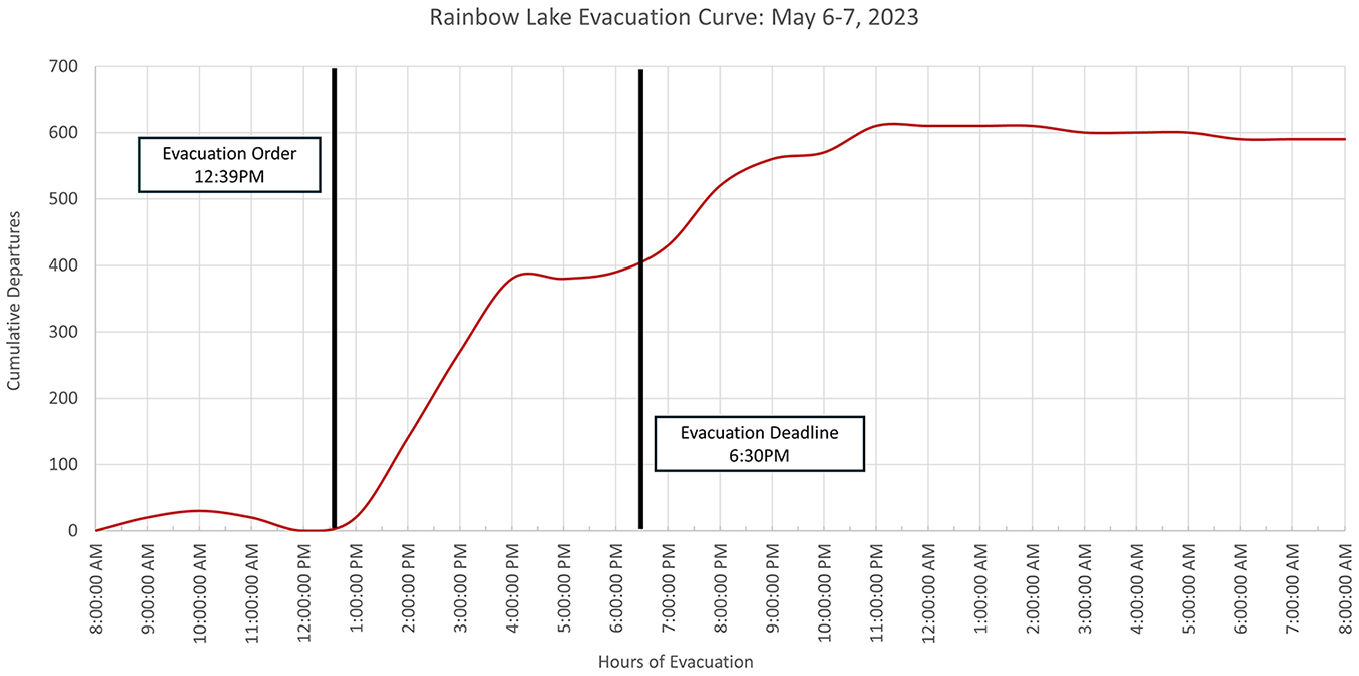
Rainbow Lake evacuation curve.
The normalized curves exhibit similarities, though some differences in flow and ETEs are present among the communities. Figure 10 shows the normalized curves, with each starting at the hour nearest to when the evacuation order was issued (either rounded up or down). The length of the evacuation (ETE) varied between each community though the magnitude was similar (between 6 and 10 hours). Drayton Valley took approximately 6 h, Edson was 5 h, Fox Creek was 9 h, and Rainbow Lake was the longest at 10 h. It should be noted that about two additional hours were needed for each community to move the cumulative count from 90% to 100%, indicating relatively “long tails.” These tails may be capturing late evacuees, officials and emergency personnel in the area, or the arrival of fire crews.
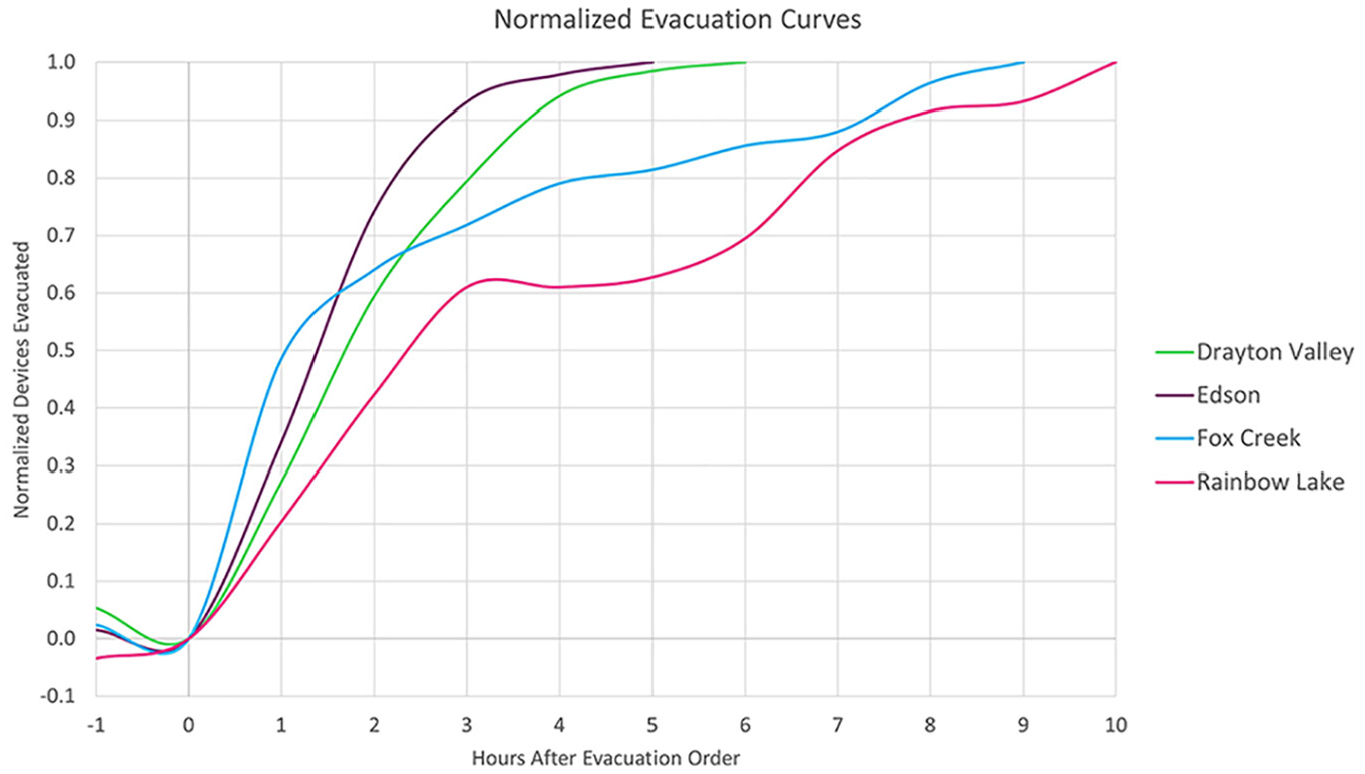
Normalized evacuation curves.
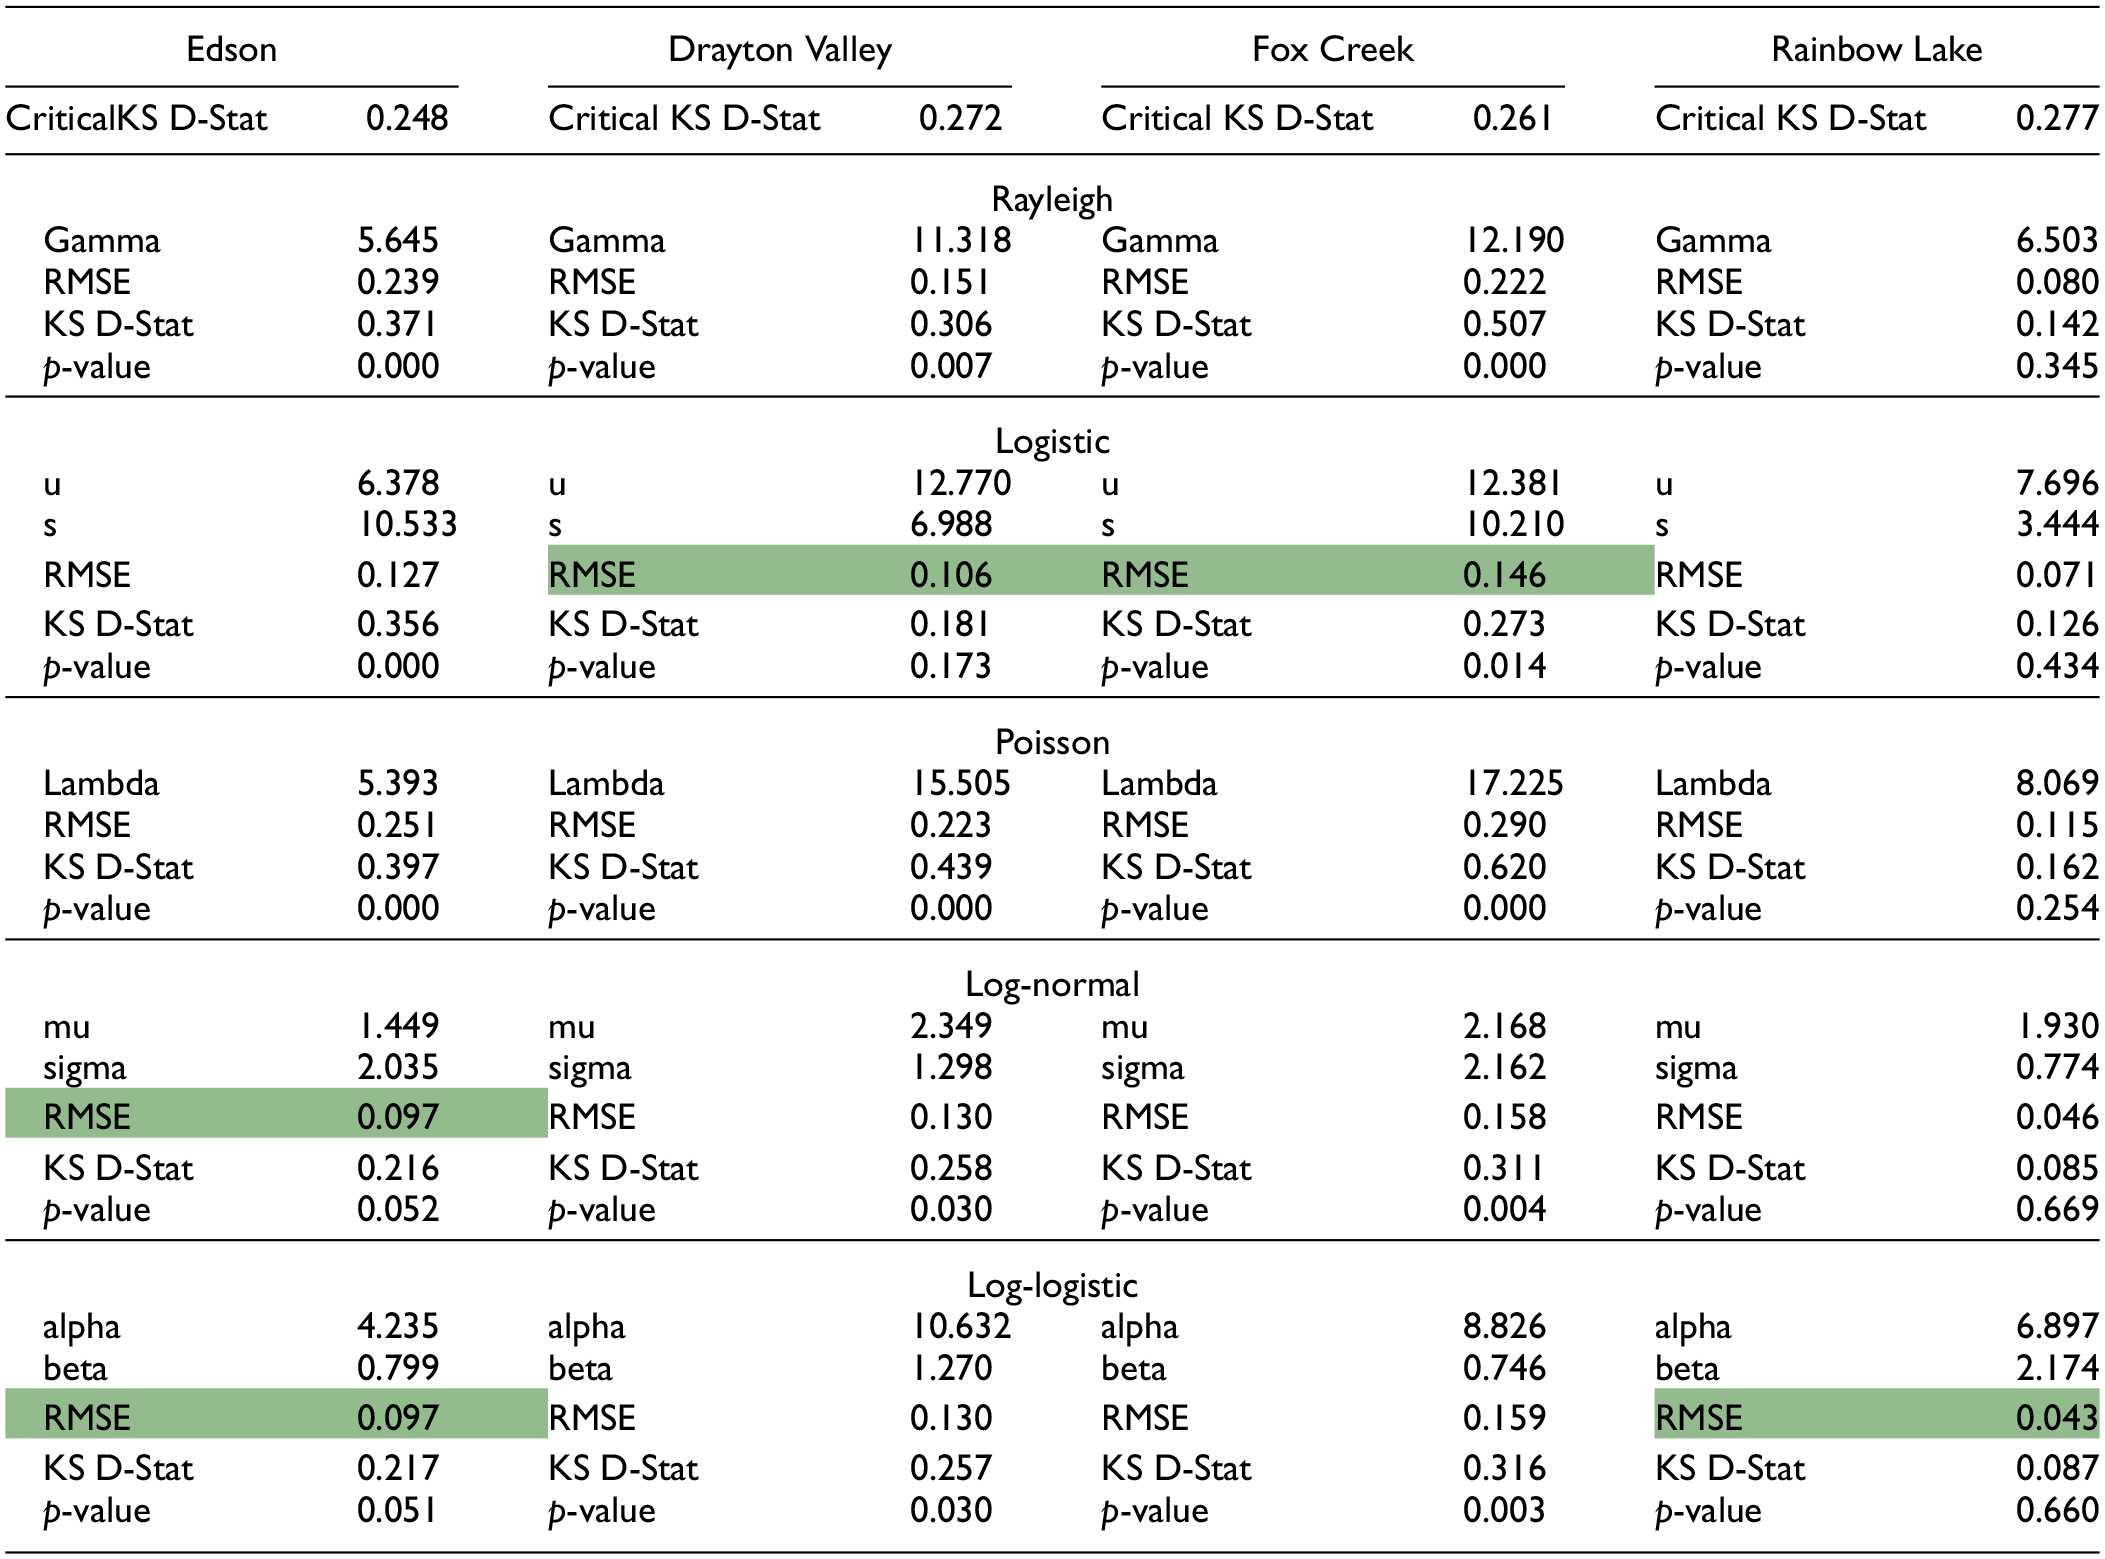
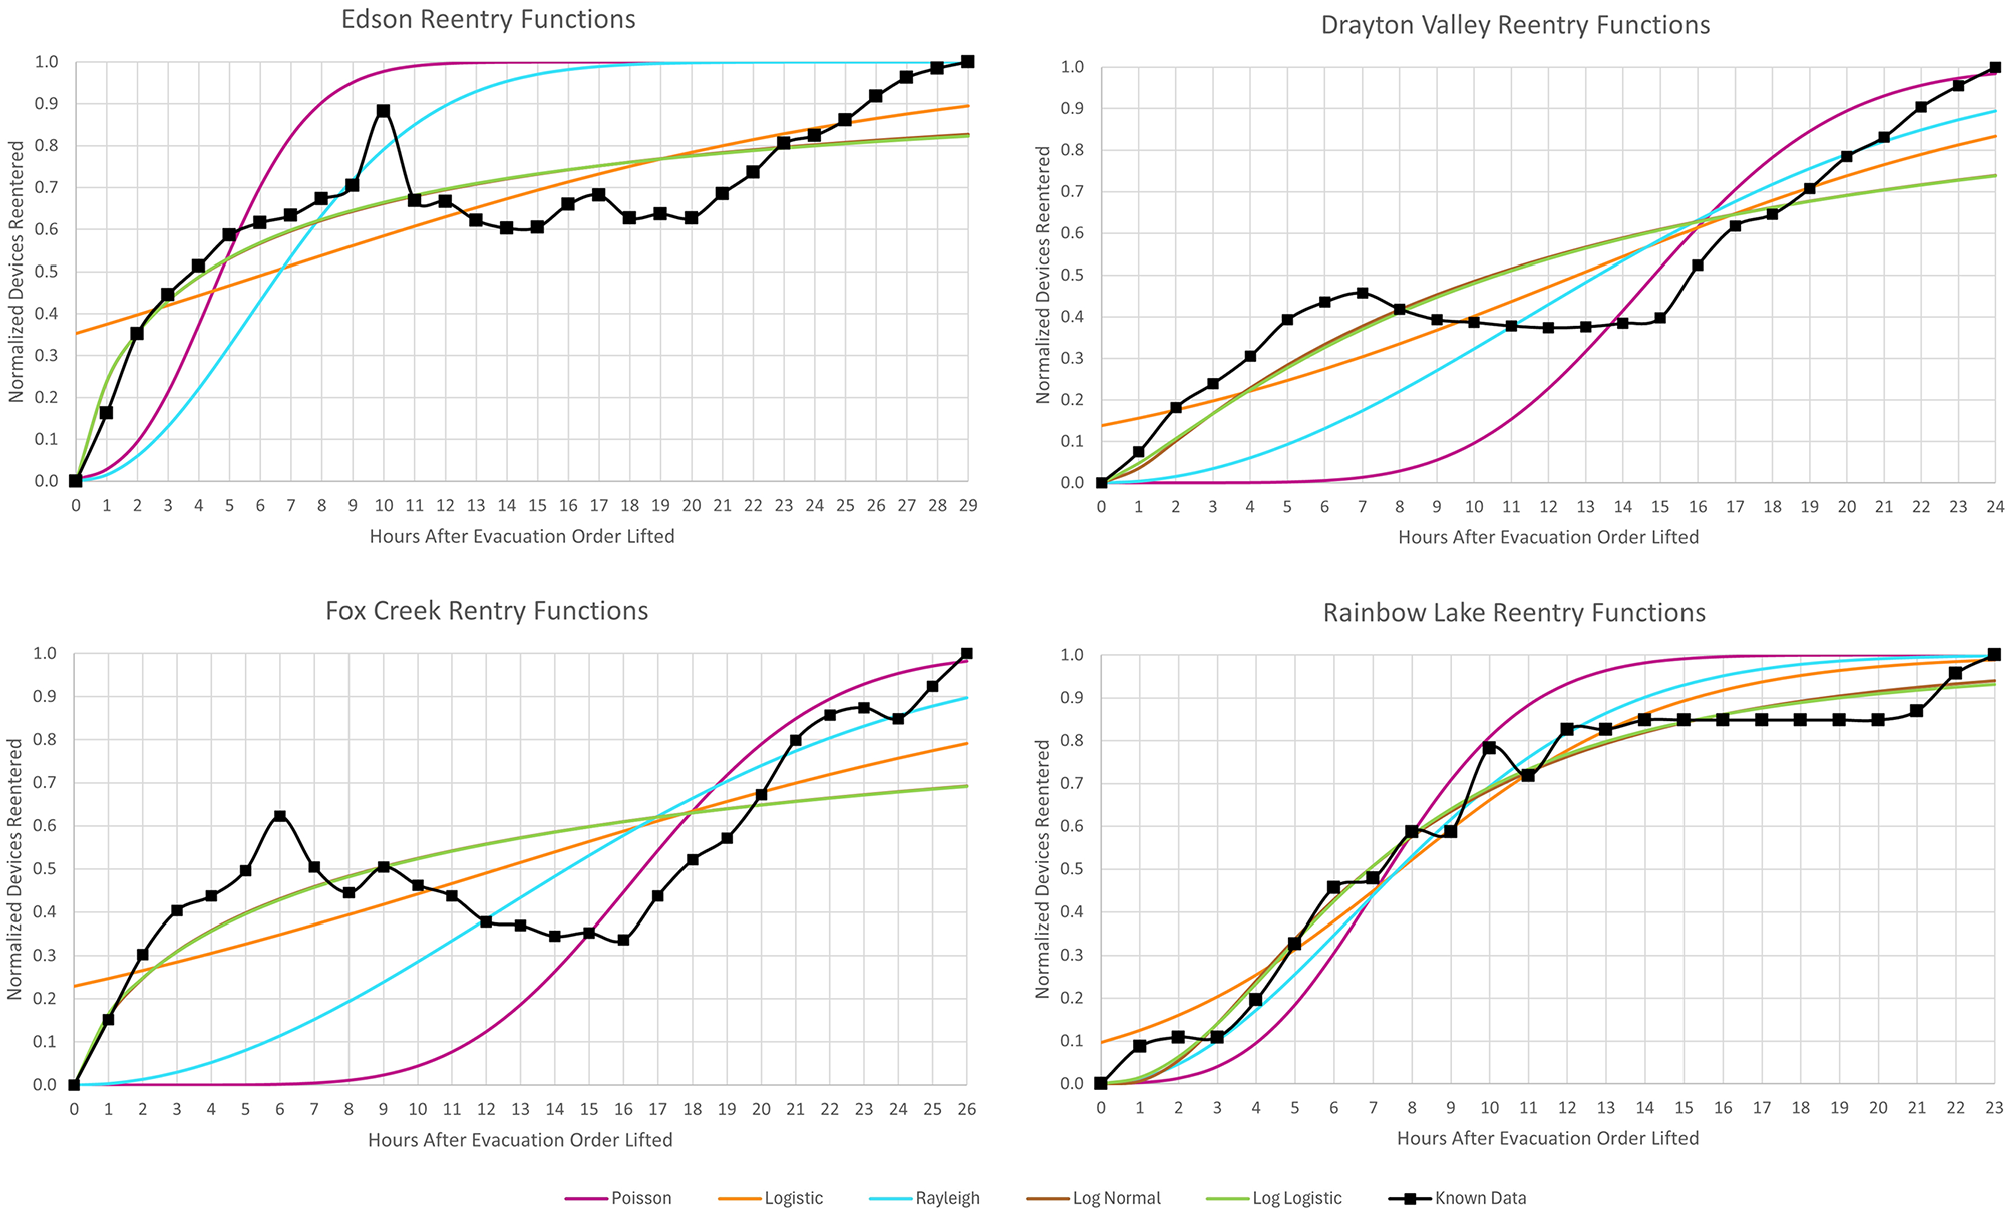
Building on research by Woo et al. ( 8 ) and Li et al. ( 10 ), the normalized curves were matched logistic, Rayleigh, Poisson, log-normal, and log-logistic functions. The variables for each function and the corresponding error values are shown in Table 2. The Kolmogorov–Smirnov test values are also shown for each function, which indicate good matches across all distribution types. The log-normal function had the lowest RMSE for all communities, albeit the log-logistic function had a similar RMSE. The Poisson distribution had the highest RMSE for Edson and Drayton Valley, and the logistic distribution was highest for Fox Creek and Rainbow Lake. A visual of the match between each function and the corresponding normalized curve, by community, is found in Figure 11.
Evacuation Curve Equation Summary
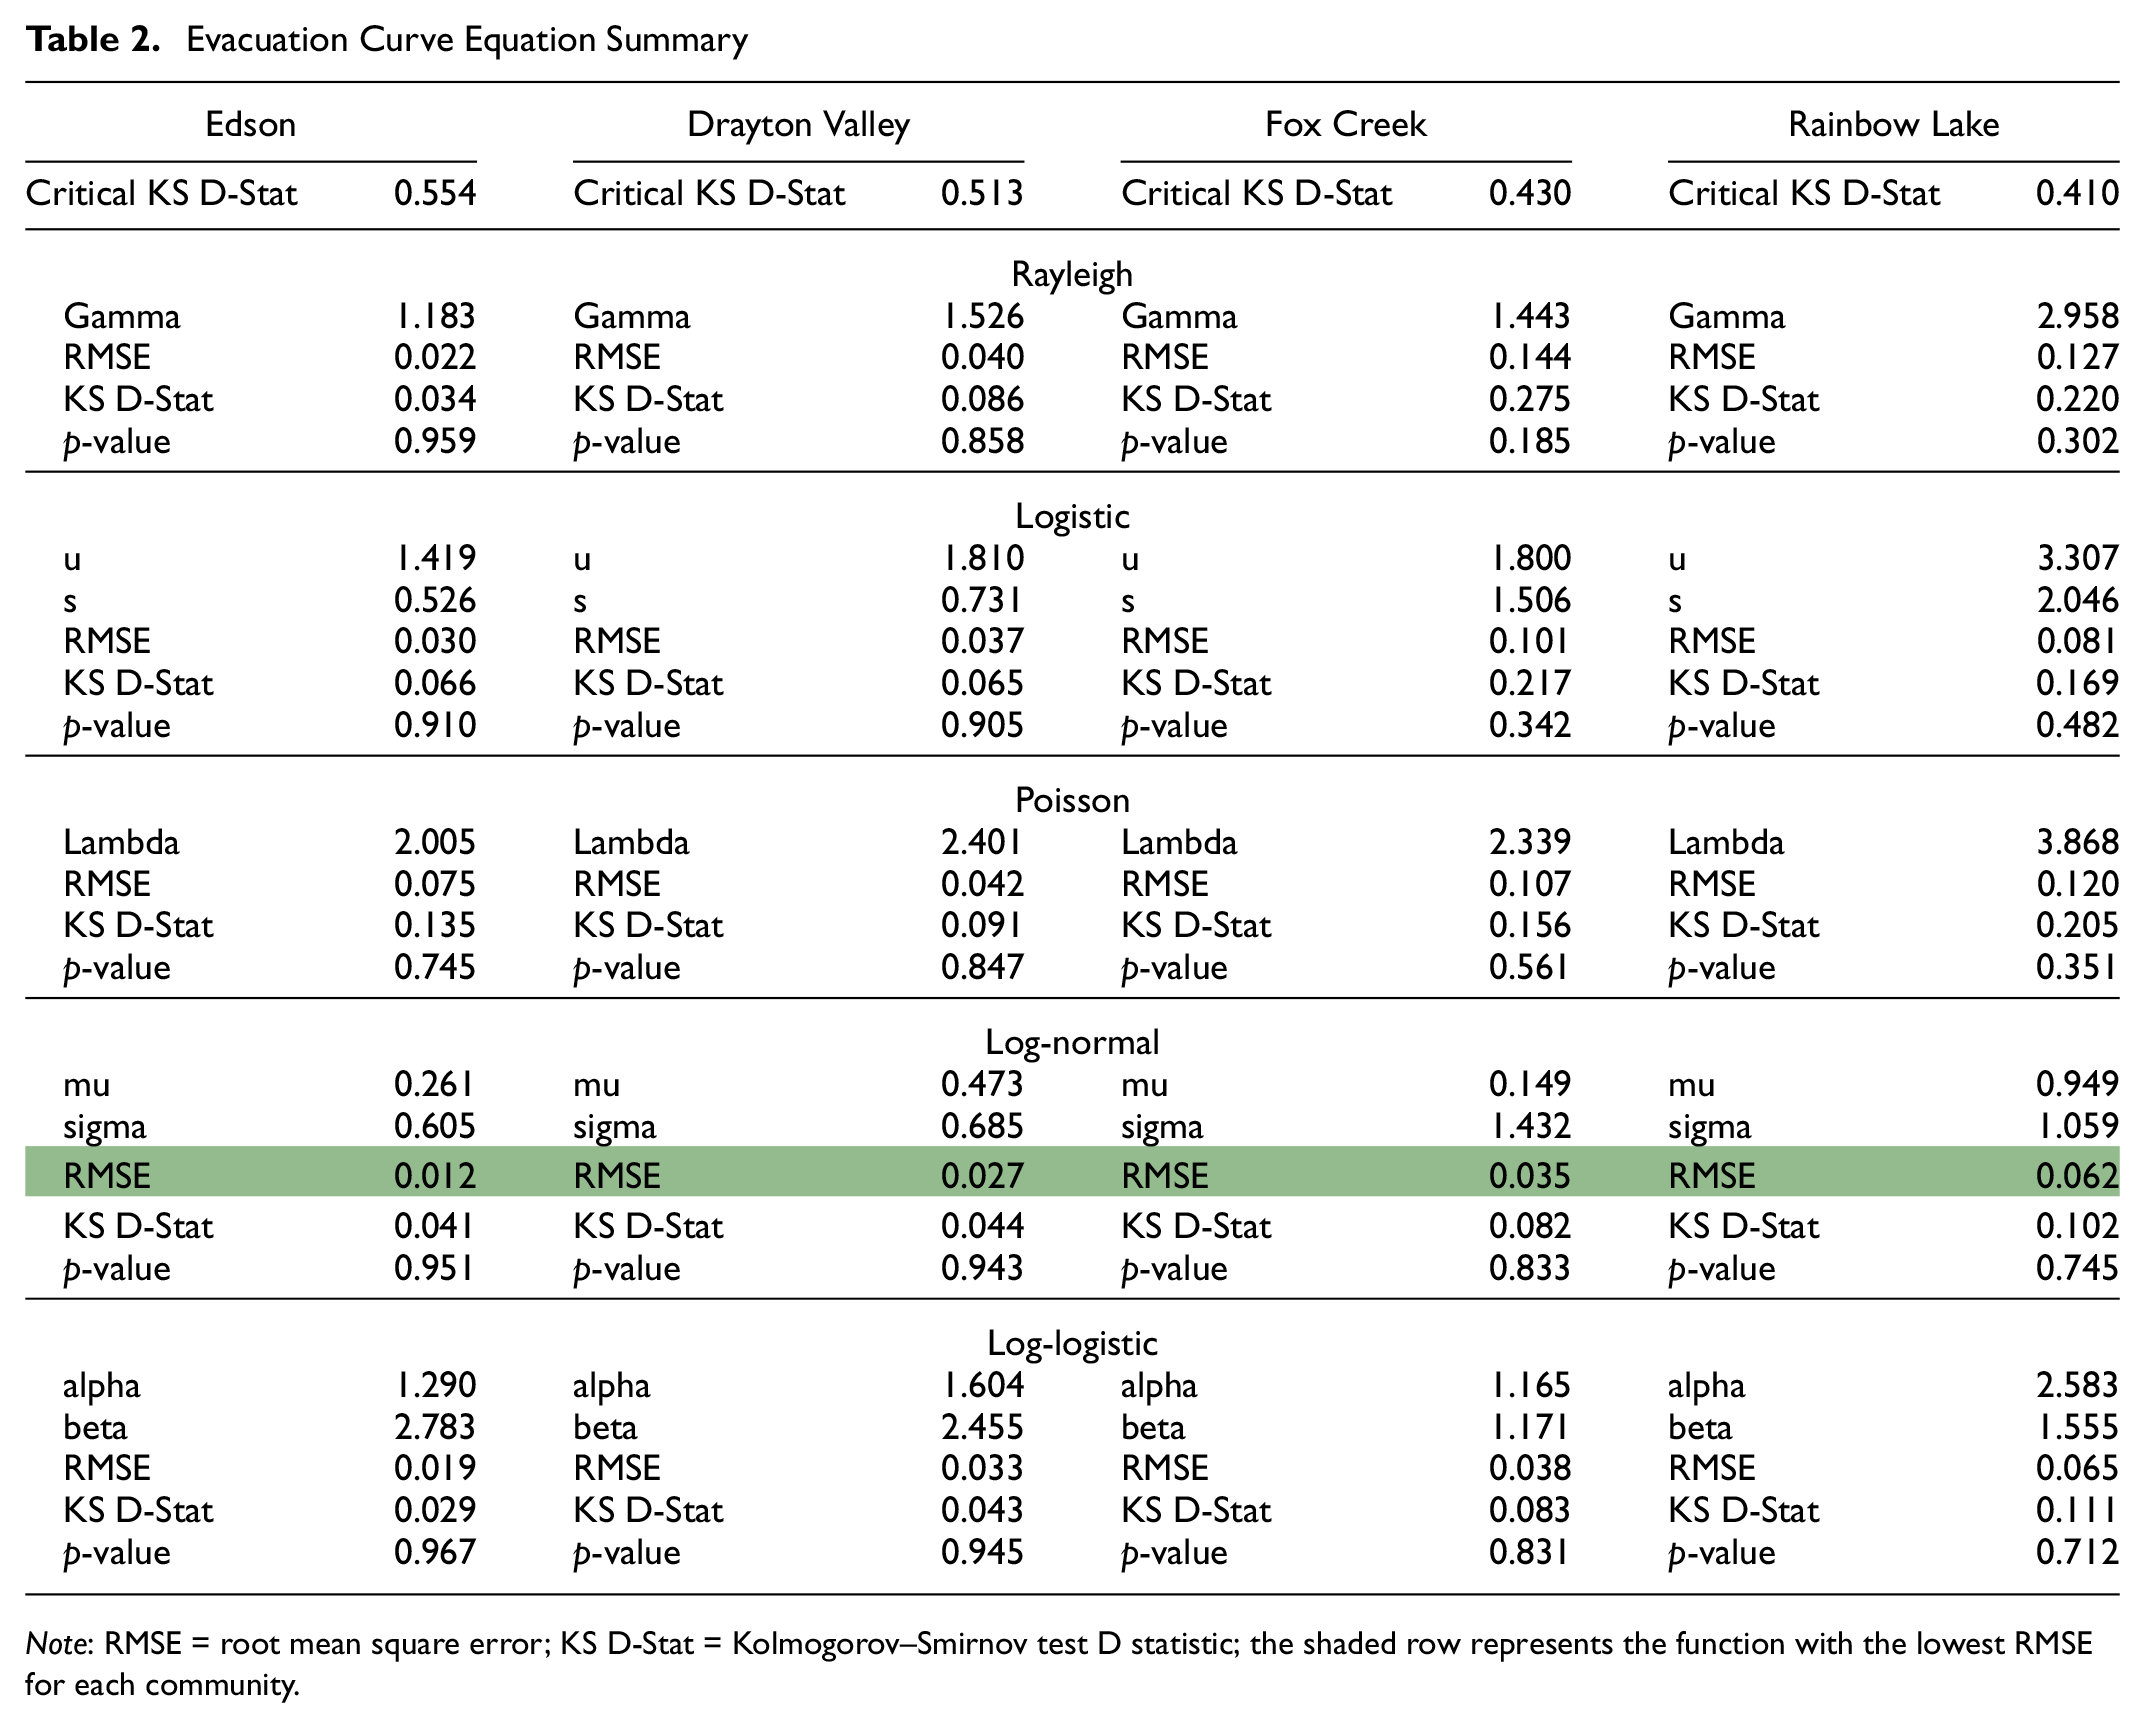
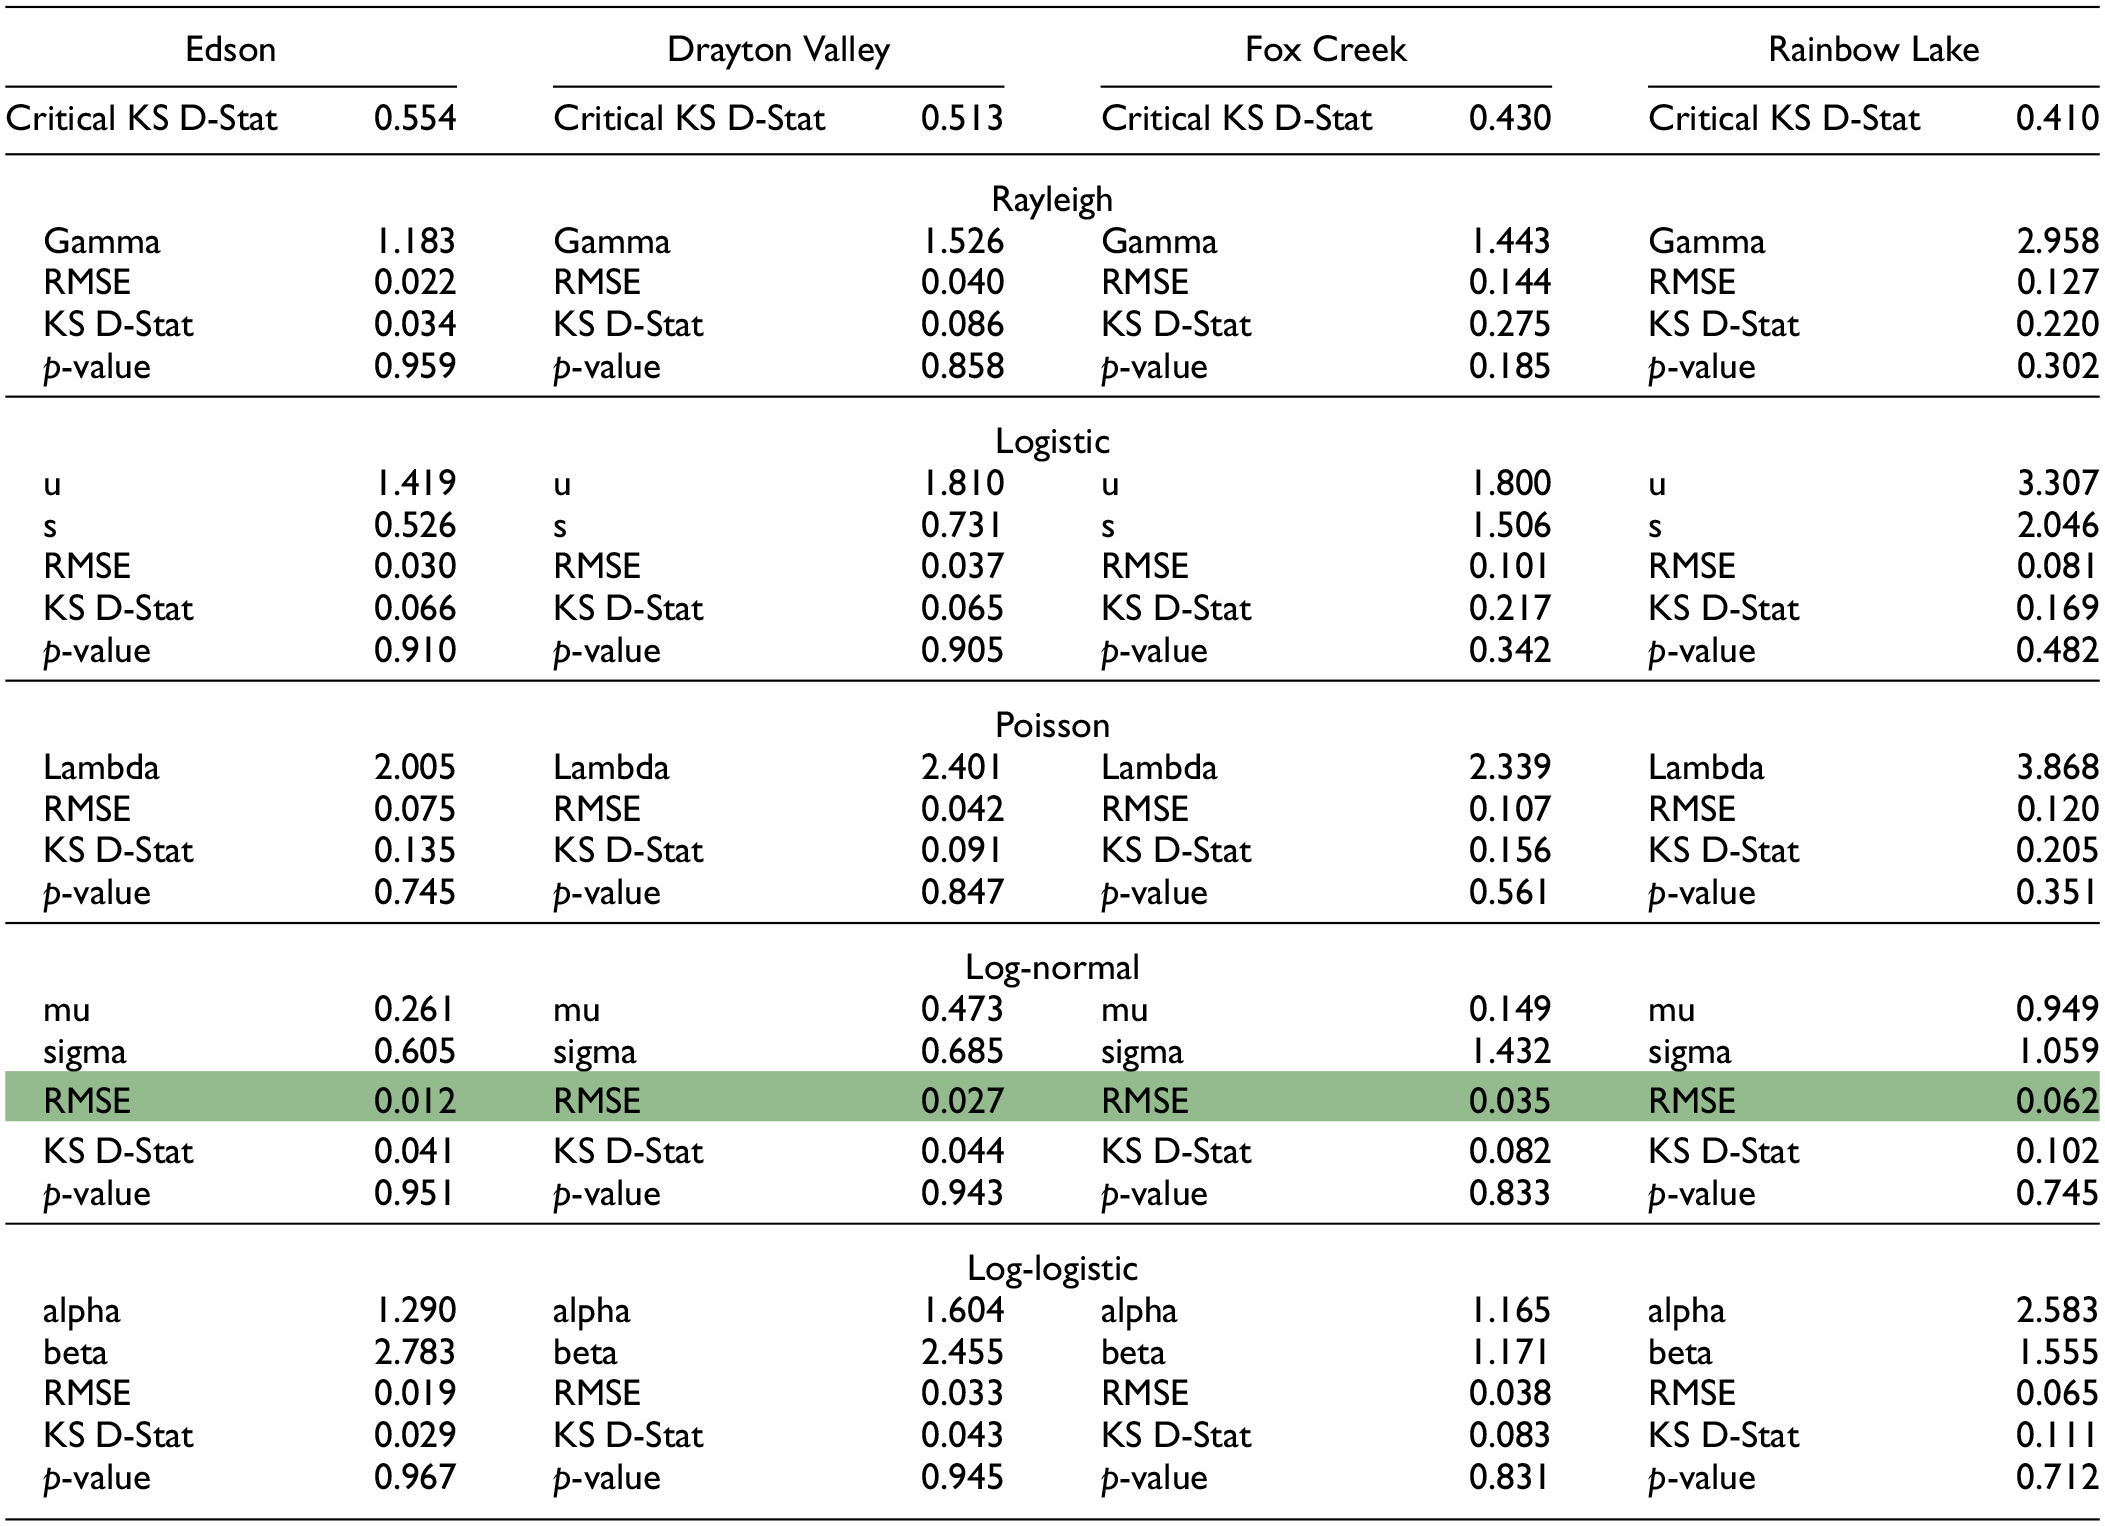
Note: RMSE = root mean square error; KS D-Stat = Kolmogorov–Smirnov test D statistic; the shaded row represents the function with the lowest RMSE for each community.
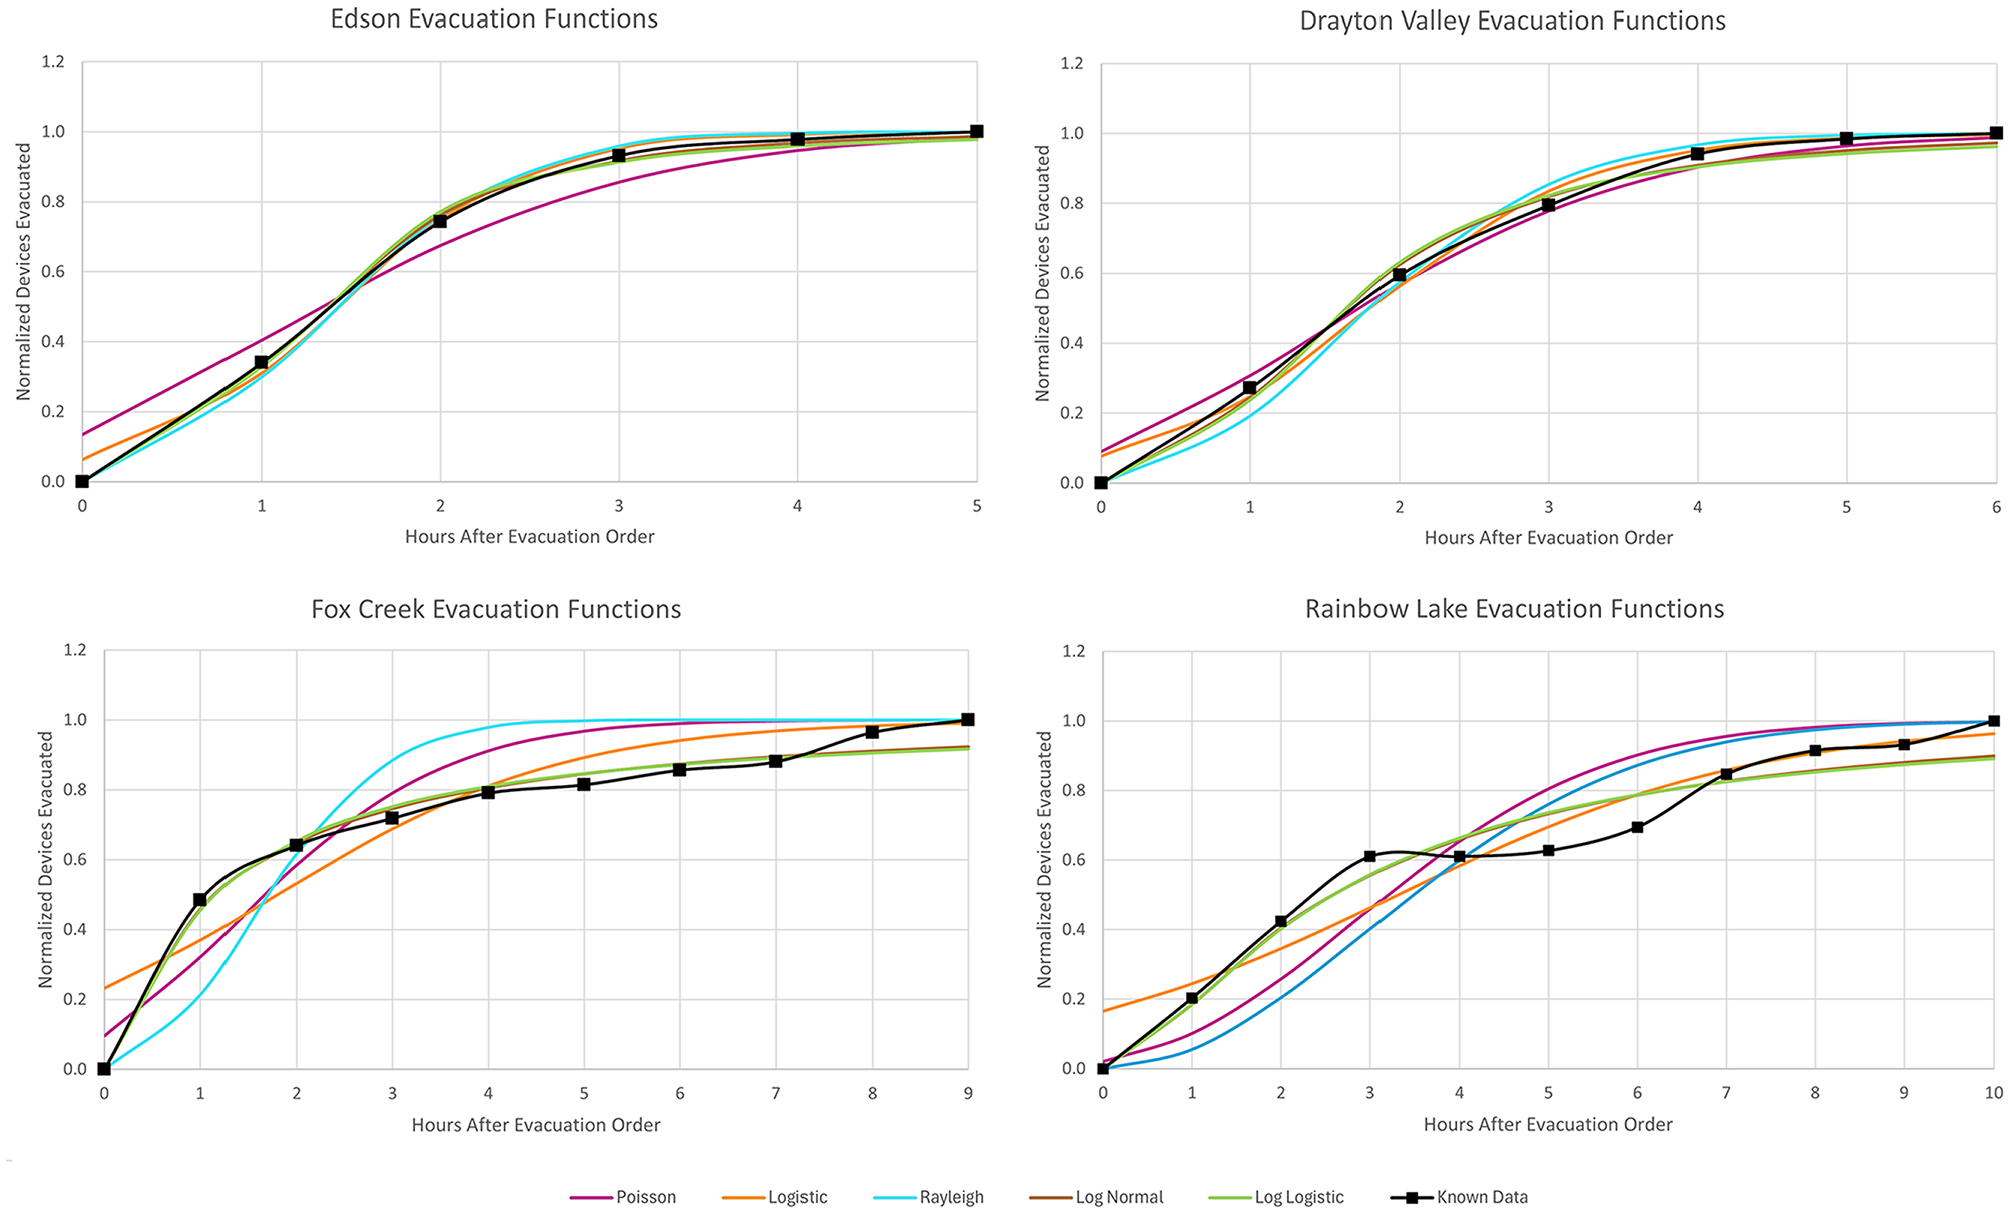
Evacuation functions.
Reentry Curves
Similar to the evacuation curves, reentry curves were developed based on the network mobility data and overlayed with any reentry orders. A clear reentry process was observed for all communities, though the process was drawn out over 23 h or more (see Figures 12 to 15). Curves exhibited a more bimodal shape than the S-shaped evacuation curves. A plateau was observed during overnight hours, indicating that individuals did not return overnight, whereas the evacuation curves depicted individuals evacuating at all times of the day. A small number of devices were recorded before the initial reentry orders in all communities, indicating some early returners.
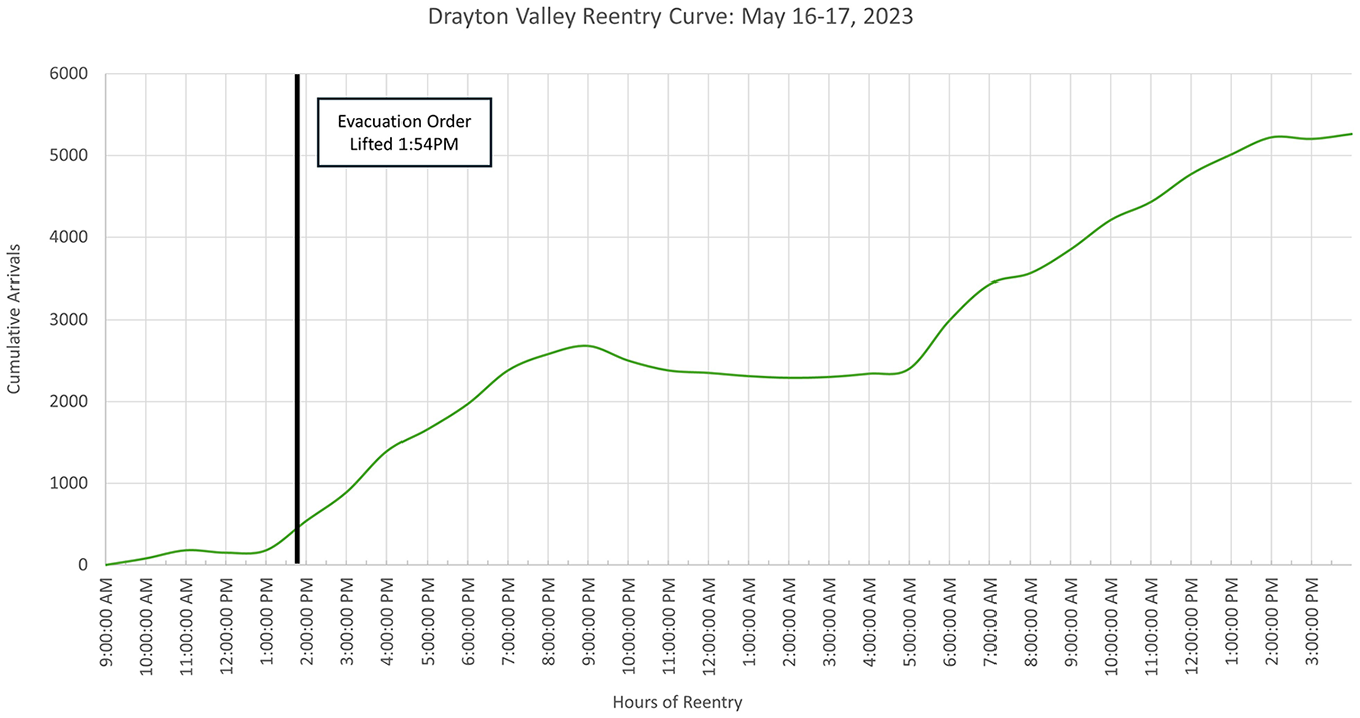
Drayton Valley reentry curve.
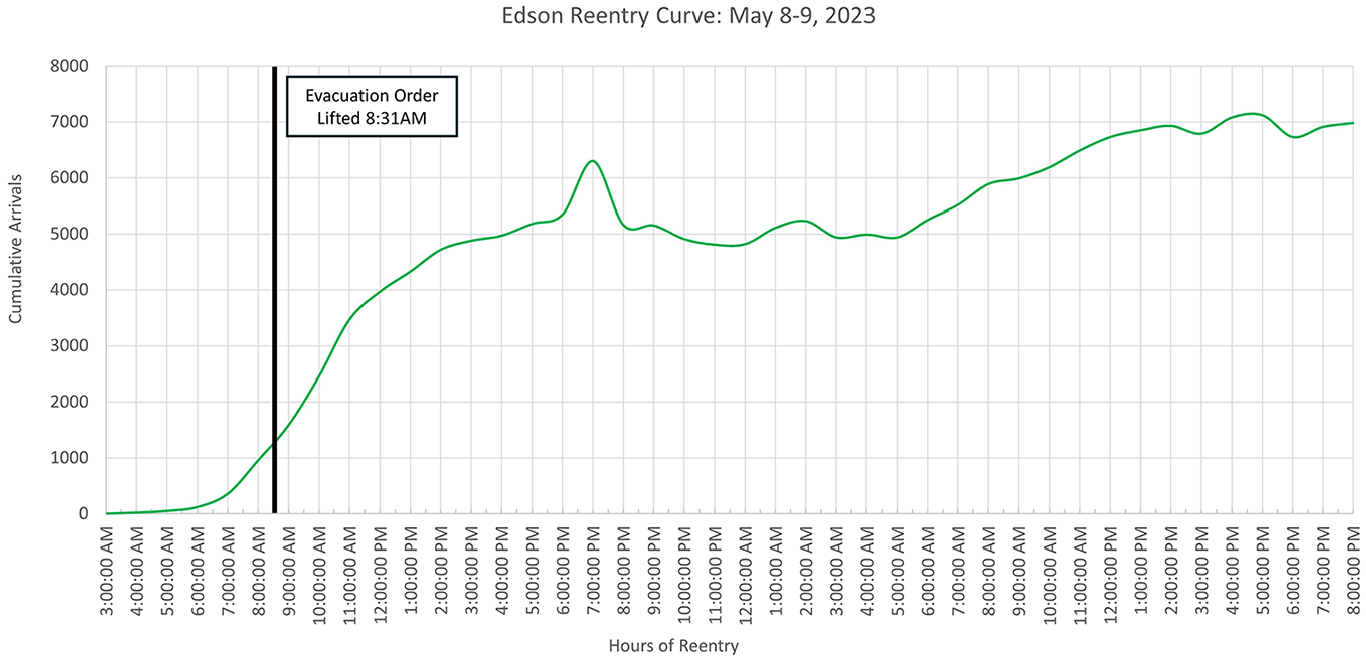
Edson reentry curve.
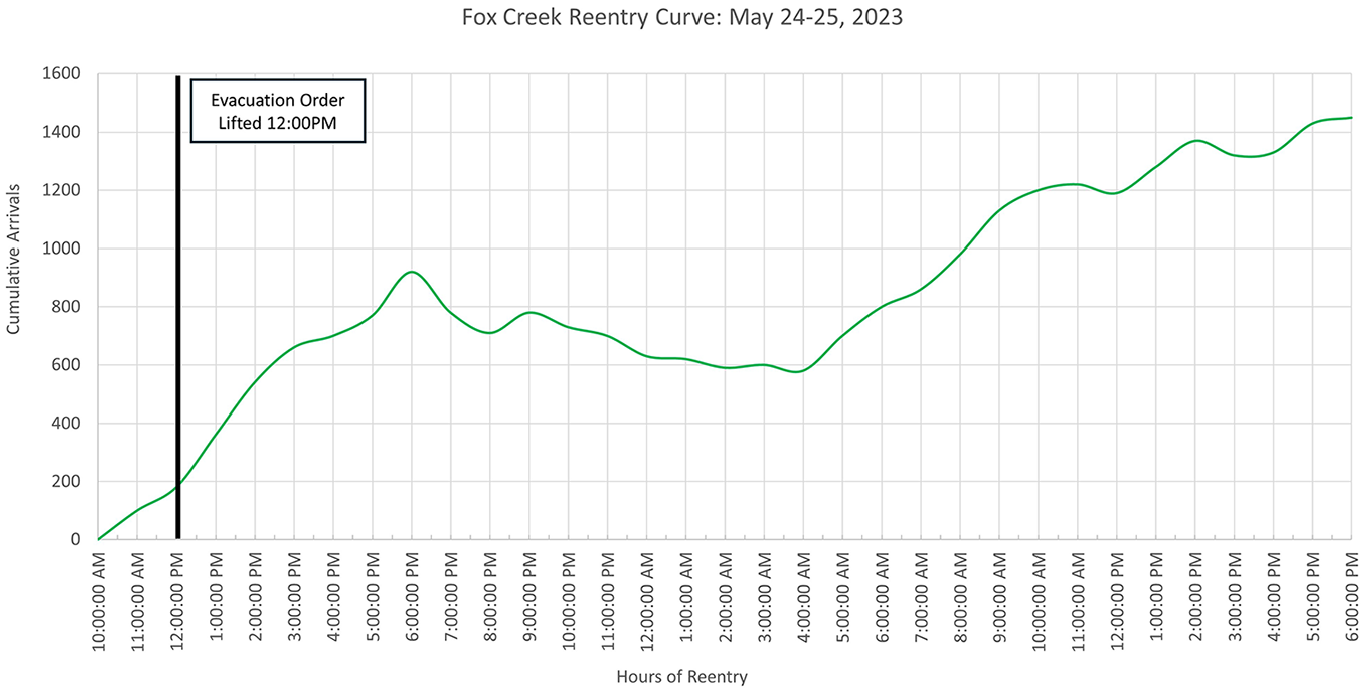
Fox Creek reentry curve.
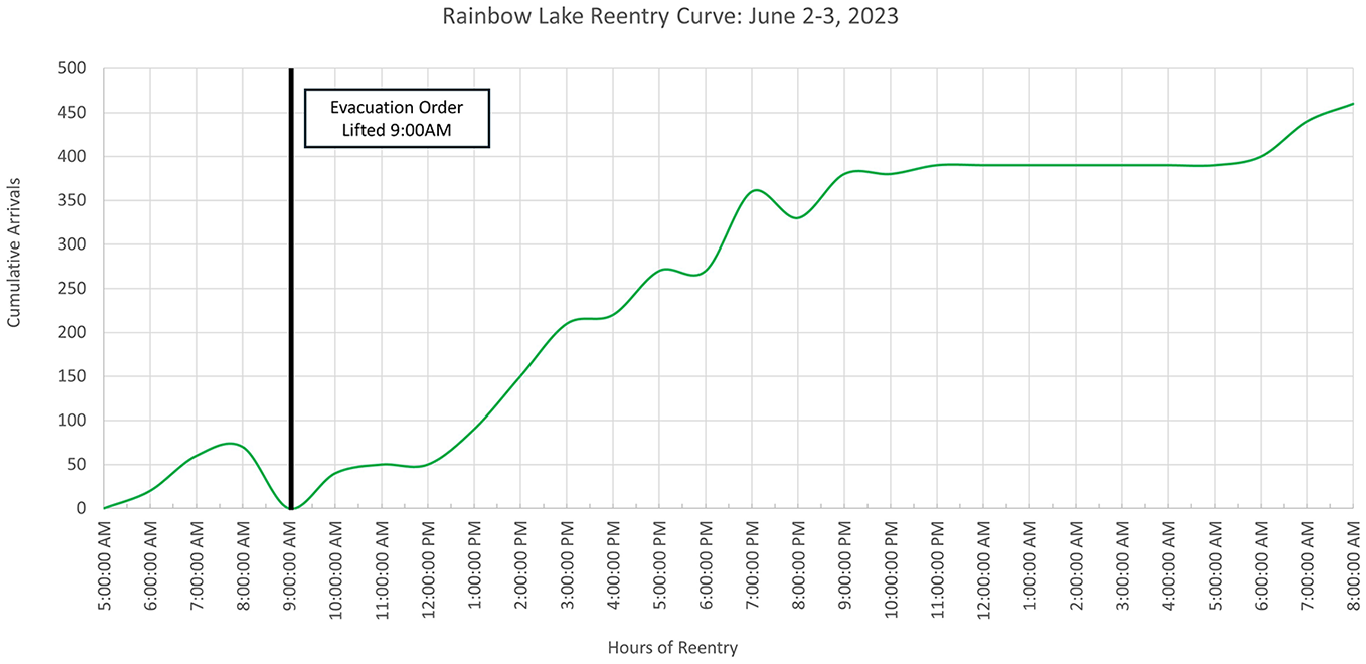
Rainbow lake reentry curve.
Figure 16 shows the normalized versions of all four reentry curves with the starting point, or zero, taken as the nearest hour to when the evacuation order was rescinded. From the normalized curves, reentry time estimates were about 24 h for Drayton Valley, 29 h for Edson, 26 h for Fox Creek, and 23 h for Rainbow Lake. An interesting result is the first 6 h for all the communities were very similar, with 45% to 60% of evacuees returning. Deviations occurred after this time, mostly as a result of there being few arrivals during the night. Overall, the reentry curves were more varied among the communities than the evacuation curves.
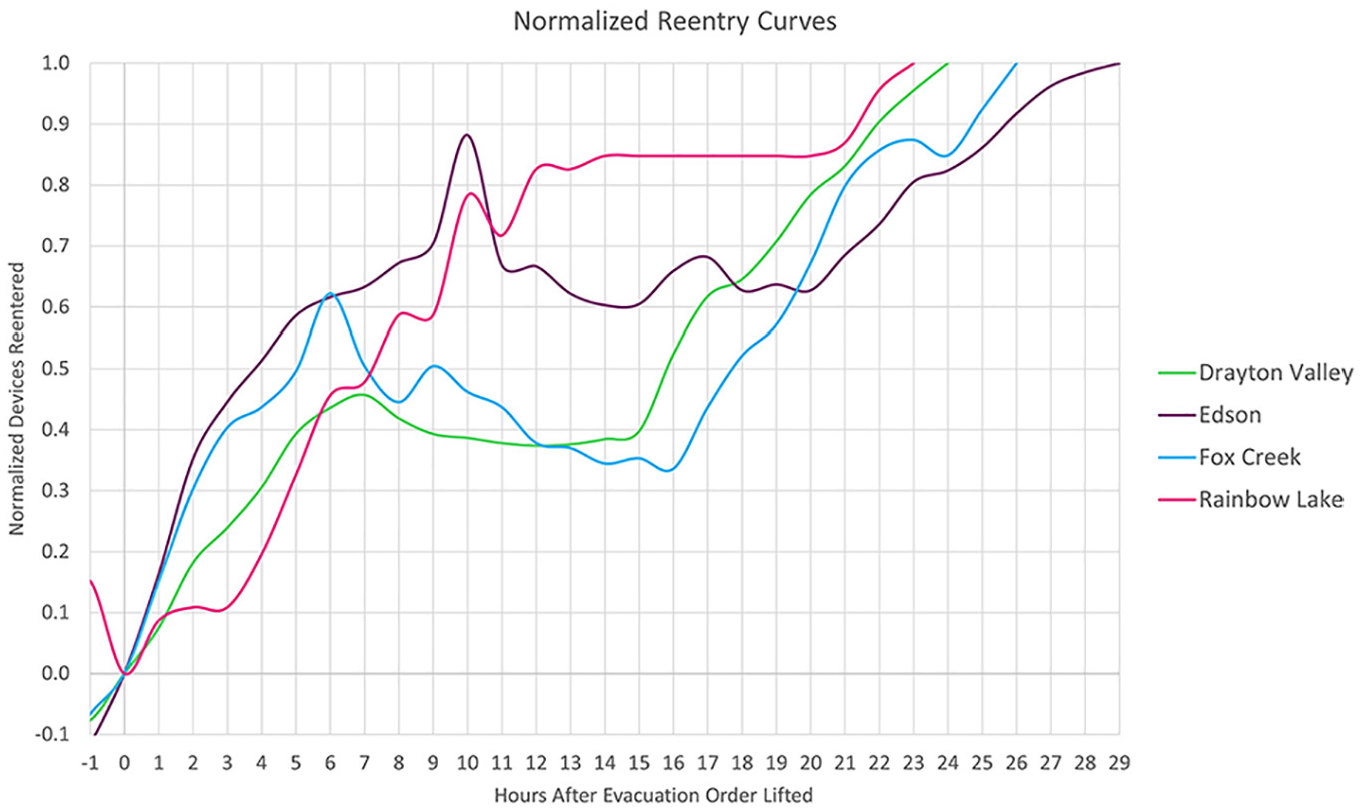
Normalized reentry curves.
Logistic, Rayleigh, Poisson, log-normal, and log-logistic functions were also matched to these curves, albeit a visual inspection of them indicates a poorer match compared with the evacuation curves. Table 3 shows the functions and associated variables, and Figure 17 displays the plot of each equation. RMSE values and the Kolmogorov–Smirnov tests indicate that no single function best fits all the curves. The log-logistic function has the lowest RMSE values for Edson and Rainbow Lake. The logistic function has the lowest RMSE values for Drayton Valley and Fox Creek. All functions have statistically significant KS D statistics for Rainbow Lake. For Edson and Drayton Valley, the log-normal and log-logistic functions were statistically significant and for Drayton Valley, the logistic distribution was also significant. The log-normal and log-logistic distributions best captured the initial rise in all communities but varied in their ability to capture further changes in returners. The results also indicate that the logistic function outperformed the remaining functions, though its concave shape hides the temporary plateau of returners at night.
Reentry Curve Equation Summary
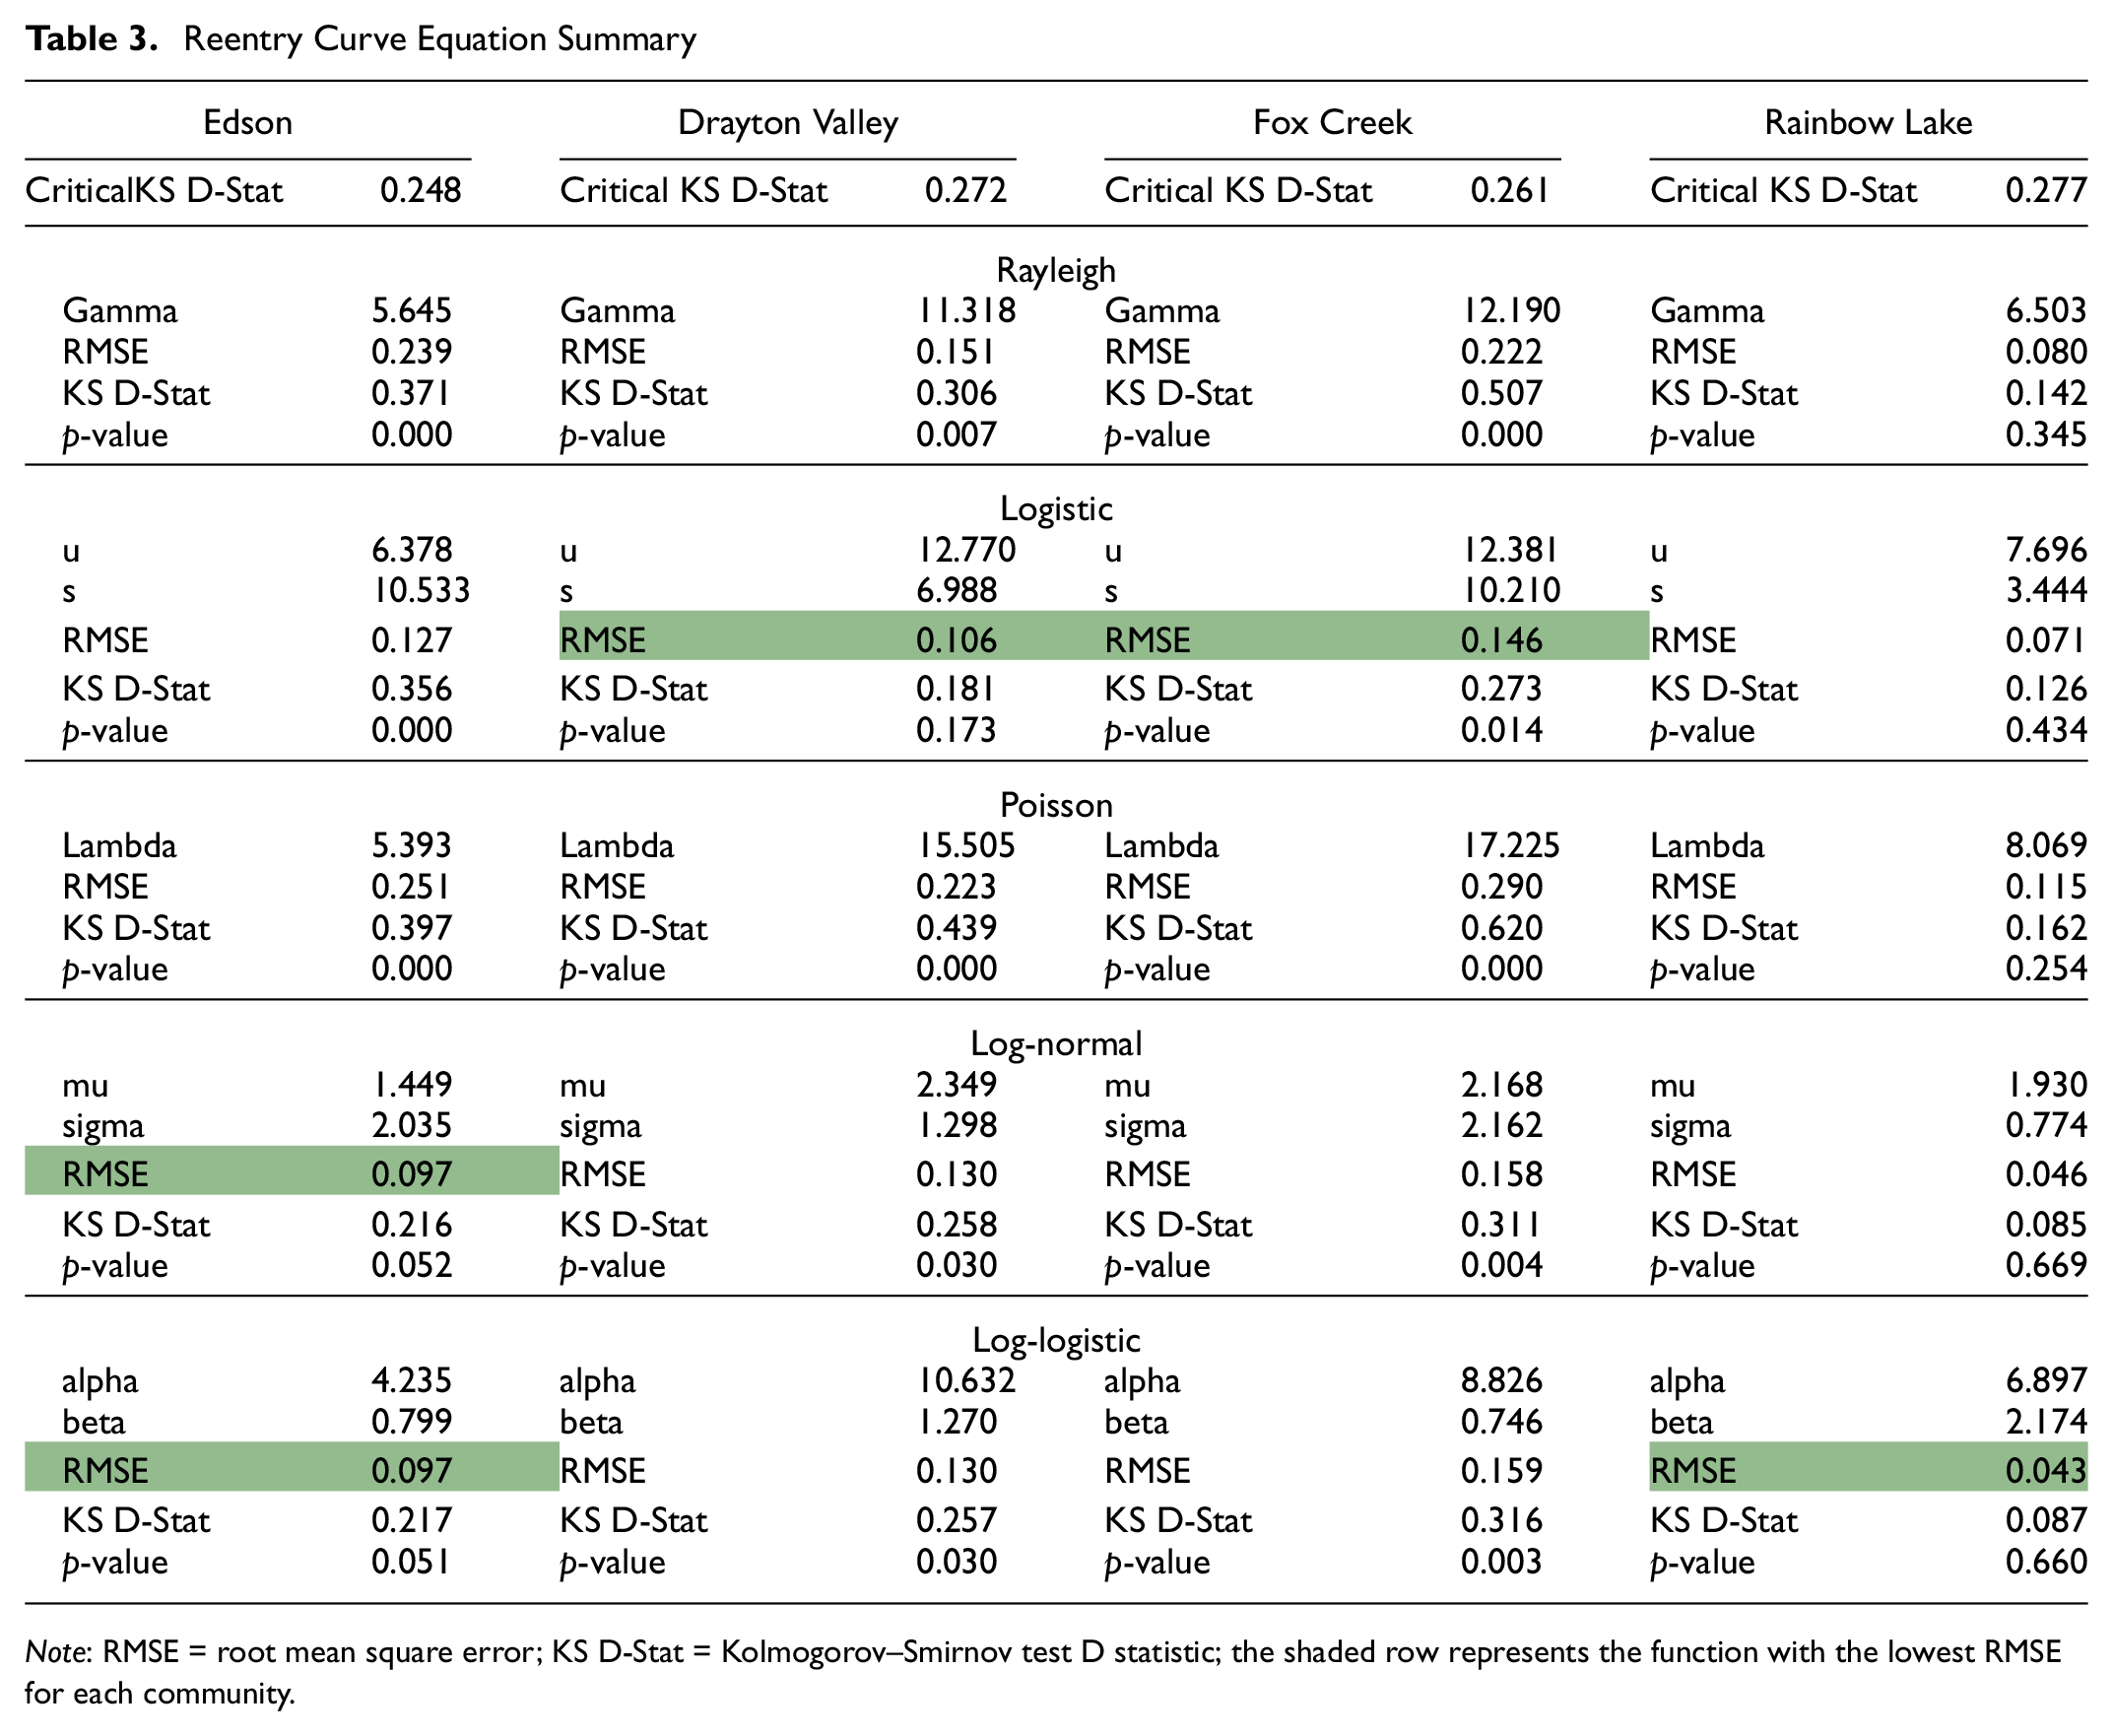
Note: RMSE = root mean square error; KS D-Stat = Kolmogorov–Smirnov test D statistic; the shaded row represents the function with the lowest RMSE for each community.
Reentry functions.
Host Communities
An additional analysis was conducted to understand the impact of the evacuations on the host communities using the number of unique devices from the network mobility data. Given a population imbalance between the Edmonton Metropolitan Region and Drayton Valley, no discernable changes were found, and the related figure is not shown. Device counts of the host communities of Edson, Fox Creek, and Rainbow Lake (Hinton, Whitecourt, and High Level respectively) are plotted in Figures 18 to 20. The rise in devices in Hinton was the most noticeable (a 64% increase), because of the large population of Edson. Observed increases were 37% in High Level and 26% in Whitecourt. The drop in devices shown in Figure 19 from May 20 to 23 can be attributed to the May Long Weekend in Canada, with the statutory holiday of Victoria Day. Figure 20 indicates a drop in the number of devices in High Level on May 20, likely because of a loss of cellular network over this period. Taken together, the results indicate substantial influxes of evacuees into host communities, which could overwhelm existing resources and services without advanced preparation.
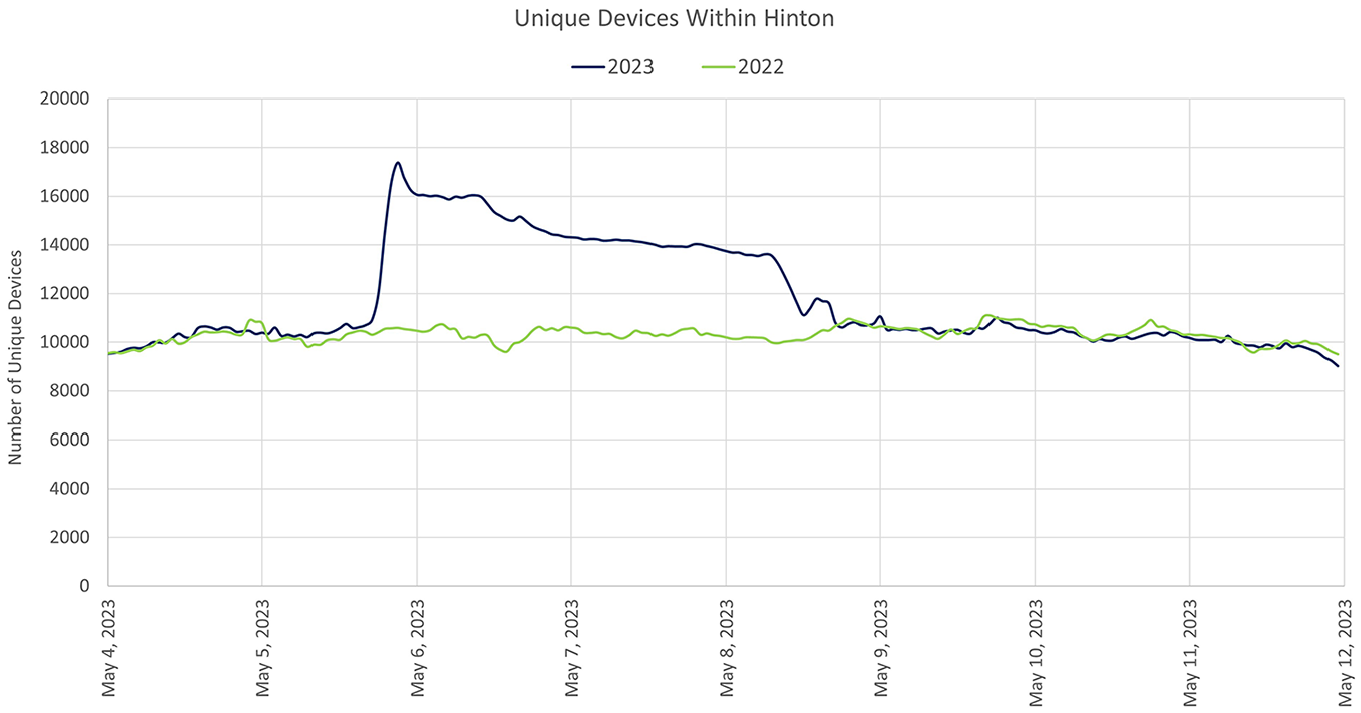
Hinton unique devices (likely evacuees from Edson).
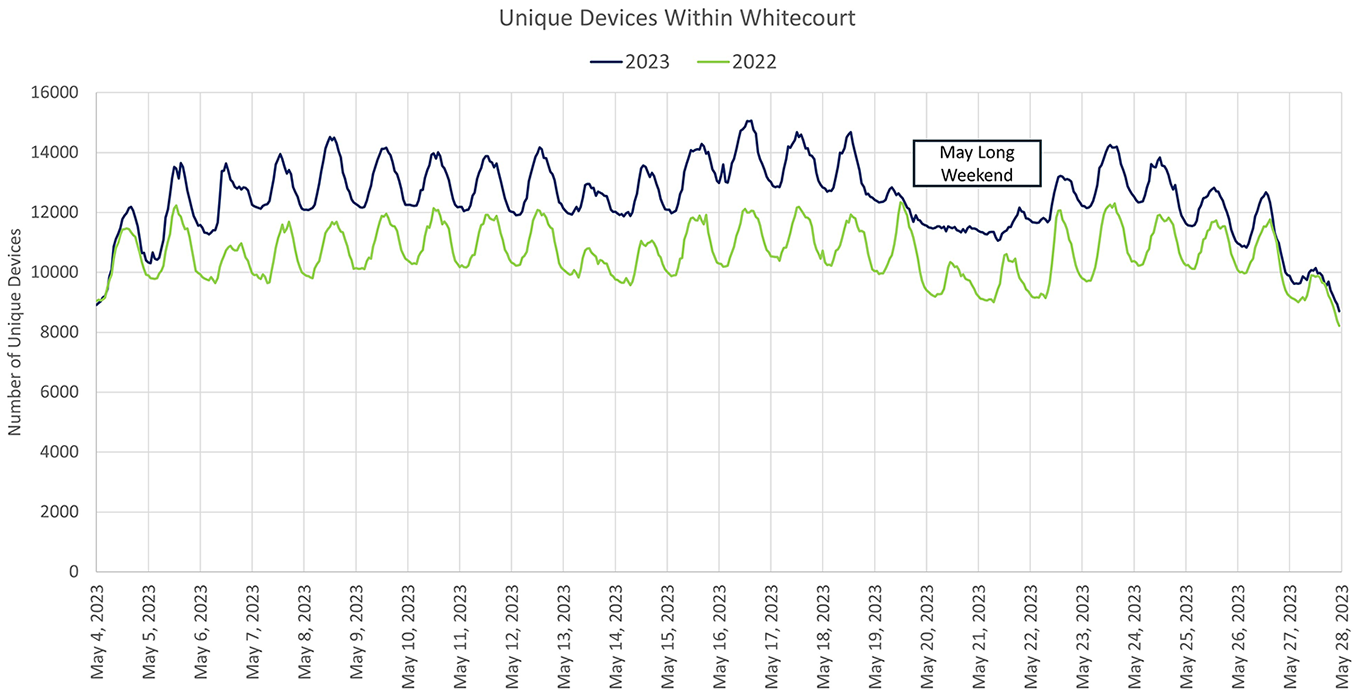
Whitecourt unique devices (likely evacuees from Fox Creek).
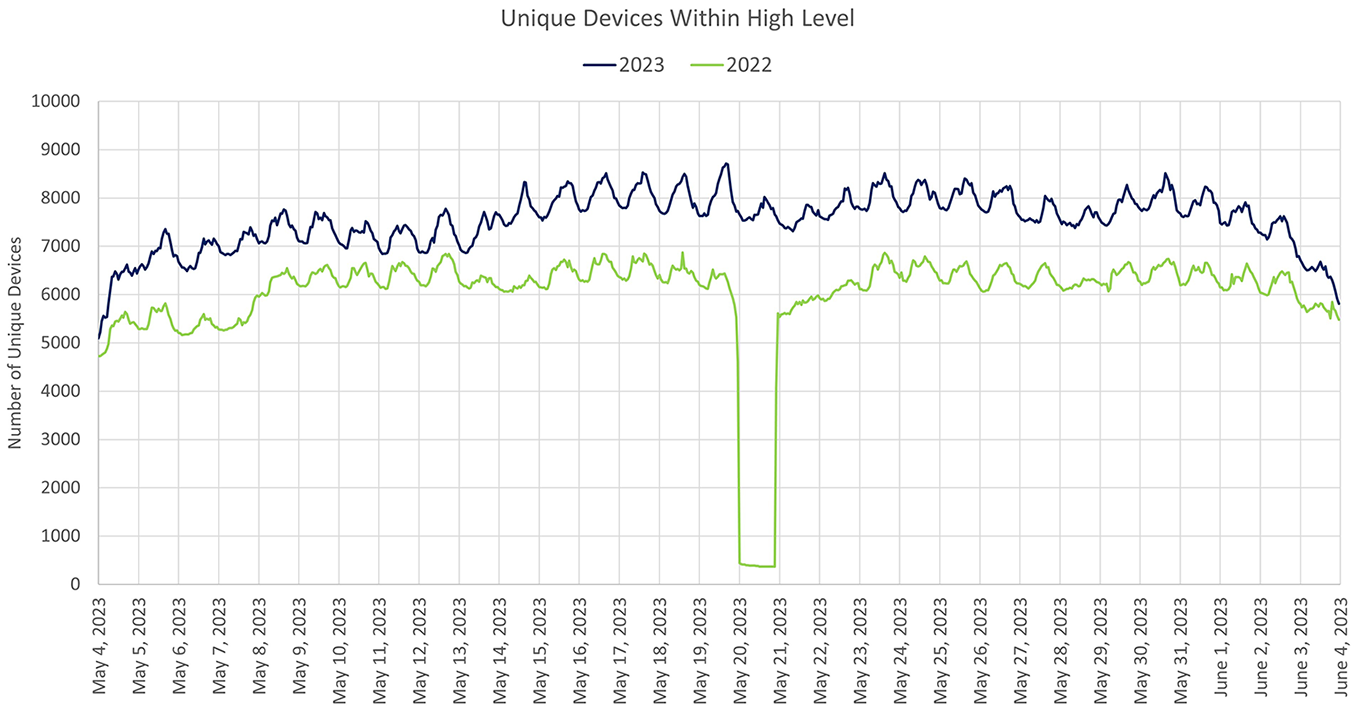
High Level unique devices (likely evacuees from Rainbow Lake).
Discussion
Curve Shapes
The results of this study, namely Figures 10 and 16, show the shapes of evacuation and reentry for multiple evacuations. From this, the S-shaped pattern of the evacuation was apparent, with high levels of evacuees departing early, followed by a longer evacuation tail for the remaining departees. Initially, the early minutes post-evacuation resembled the start of a normal distribution, before changing to a drawn-out evacuation tail. Previous hurricane evacuation curves have matched logit, Rayleigh, and Poisson distributions to empirical curves with RMSE values of 0.0321, 0.0477, and 0.0876, respectively ( 10 ). The RMSE values for the evacuation curves from this research ranged from 0.012 to 0.062 for log-normal, 0.019 to 0.065 for log-logistic, 0.022 to 0.144 for Rayleigh, 0.030 to 0.101 for logistic, and 0.042 to 0.120 for Poisson. These ranges indicate sufficient similarity with previously calculated RMSE values for hurricane curves. Log-normal and log-logistic functions best matched the wildfire evacuation curves and can be used to approximate emergent behavior in similar communities. Similar to examples for hurricane evacuations ( 10 ), logistic and Rayleigh functions also matched well with departure times. Poisson distributions had higher errors. The analysis also identified an initial shadow bump of departures (observed before the evacuation order was issued). This bump could represent the impact of background traffic or pre-order departures, though future work is necessary to verify this conclusion. For reentry, the curves varied, and a bimodal shape was observed as a result of a drop in nighttime returners. Curve fitting for reentry produced limited and varied results with RMSE values stretching from 0.043 to 0.290 among the five distributions for all four communities. This large variation indicates that future analysis to match distributions to reentry curves is necessary. Separate distributions for different days may also be required.
Timing Impacts
Across the results, evacuation orders appeared to correspond with a rise in departures, even those that were issued in the evening (e.g., Drayton Valley). Fox Creek exhibited rapid departure of evacuees following the order, while Rainbow Lake displayed a slower paced evacuation. The departure timing of evacuees in Edson and Drayton Valley were remarkably similar. Overall ETEs were between 6 and 10 h, with low levels of departures during the evacuation tail (in the last 2 to 4 h, depending on community). Reentry time estimates ranged from 23 to 29 h, with an overnight plateau. This slower pace may be associated with a wait-and-see mentality, slower communications, and safety assurances from the hazard. About 45% to 60% of evacuees returned during the first 6 h of reentry in all communities which indicates that congestion may arise early (though at lower levels than during an evacuation). The results suggest that reentry is less consistent with existing distributions and that a generalizable understanding of reentry requires further assessment.
Host Communities
Within the host communities, a noticeable jump was also observed (even as high as 64% in Hinton compared with baseline values), indicating the large evacuee populations these communities must serve. Plans within these communities will need to ensure that infrastructure can meet the demand of evacuees (even if temporarily) to create a more hospitable and thriving environment. Not all host communities experienced the same temporal impacts. Devices in Hinton were only above baseline for three days, while above-baseline days for Whitecourt and High Level were about 12 days and 30 days respectively (though the change in baseline was lower). The results indicate some heterogeneity in host community impacts (both temporally and demographically).
Takeaways
This research produced several key takeaways that set a baseline for emergent evacuee behavior over time and could assist with future wildfire evacuation planning.
a) Network mobility data were relatively easy to process and contained deidentified, privacy-protected information. As shown in other research ( 7 ), these data appear to match behavioral patterns that arise during disasters. The flexibility of the data at both local and regional levels can help model behavior for other communities and other disasters. However, validation through other sources remains an outstanding need.
b) The steepnesses of evacuation curves match previous findings ( 8 ). These curves have a steeper rise in comparison to hurricane evacuations, but the long tails caused significant increases in ETEs. Agencies must be prepared for high rates of evacuation at any time of the day and additional strategies will be needed to speed up late leavers.
c) Wildfire evacuation curves can be approximated through log-normal and log-logistic cumulative distribution functions with low error levels. This parallels research that used similar functions to approximate hurricane evacuation curves ( 10 ). Their applicability for wildfires is helpful as they could help improve the realism of departure timing estimations for evacuation planning and simulation purposes.
d) ETEs and reentry timing ranges were easily discerned as 6 to 10 h and 23 to 29 h respectively. Similar to the last takeaway, this temporal wildfire knowledge could be used for wildfire simulations ( 13 ). Importantly, the results indicate the need for strategies to reduce congestion at the beginning of the evacuation and options to speed up evacuees at the end of the evacuation. Moreover, reentry may require fewer resources than expected.
Limitations
The TELUS for Good data gathered for this study has several limitations. The main limitation is the use of unique devices as a proxy for individuals. While this is a reasonable assumption, not every person will have a device on the wireless network in the area, nor will they have a singular device on the network. Some might have both a personal and a work phone. Extrapolation from TELUS’s internal market share data addresses any potential users with multiple or no devices, but this requires further validation with other data sources. The residual devices remaining in the communities during the evacuation could be attributed to emergency management personnel and non-evacuees, but this should also be investigated further via community-specific data or evacuation compliance rates. Second, TELUS’s share of the cellular network only accounts for 53.6% of the overall network, but is extrapolated to the overall population, indicating that these graphs represent extrapolated trends in behavior (though based on a slight majority of the population ( 52 )). Third, the impact of travelers passing through these communities (background traffic) is naturally included in the analysis since dwell times were not established. Fourth, the current API interface only allows for a level of temporal detail of 1 h, which does not allow for the measurement of devices at the exact time that evacuation orders were issued and rescinded. The nearest hour to these occurrences was used in this study. Finally, the data provide emergent behavior and patterns, but it does not necessarily indicate why these exist. Though the discussion inferred several implications, the exact reasons that caused evacuees to leave would require in-depth qualitative interviewing or surveys. Further work will be required to verify this novel data source with other data sources in the near future which can offer a validation framework across different data sources in the evacuation context.
Conclusions
This research used network mobility data from TELUS’s Data for Good program to investigate evacuation and reentry in four communities as part of the May 2023 Alberta Wildfires, along with changes of evacuees in host communities. These data offer an alternative to other sources thanks to their ease of use, privacy protections, and reasonable granularity for communities when considering region-wide evacuations. The resulting evacuation and reentry curves exhibit a traditional S-shape for evacuations and a bimodal shape for reentry. Heterogeneity was found across communities in the steepness of curves, the evacuation times estimates, and the total reentry time. However, these differences were sometimes marginal, indicating that communities generally experienced similar evacuation and reentry processes even though they were threatened by different fires. For host communities, the number of unique devices rose following the evacuations, including up to 64% in one case. The results indicate the need to plan for substantial evacuee demand, especially accommodation and services. Overall, the results suggest some stability in wildfire evacuation and reentry processes, which can be leveraged for improved evacuation planning as a key input when developing transportation and housing strategies.
Footnotes
Acknowledgements
We thank the TELUS Data for Good team, especially Kendal Burtch and Dhaval Tapkhirwala for their help during the course of this study.
Author Contributions
The authors confirm contribution to the paper as follows: study conception and design: I. Borody, S. Wong; data collection: I. Borody, S. Wong; analysis and interpretation of results: I. Borody, S. Wong; draft manuscript preparation: I. Borody, S. Wong. All authors reviewed the results and approved the final version of the manuscript.
Declaration of Conflicting Interests
The author(s) declared no potential conflicts of interest with respect to the research, authorship, and/or publication of this article.
Funding
The author(s) disclosed receipt of the following financial support for the research, authorship, and/or publication of this article: The study was funded by the University of Alberta’s Vice-President (Innovation + Research) Office and the Natural Sciences and Engineering Research Council of Canada’s Discovery Grant and Undergraduate Student Research Award.
Data Accessibility Statement
The data that support the findings of this study are available from TELUS, but restrictions apply to the availability of these data, which were used under license for the current study, and so are not publicly available.