
Abstract
This paper presents a microsimulation analysis of interdependent evacuation decisions concerning departure times and destination choices in the hurricane-vulnerable coastal area of Houston, TX. Utilizing cumulative prospect theory (CPT), two predominant behaviors were identified: those of risk-conscious- and time-cautious evacuees. Risk-conscious evacuees predominantly departed early, leading to clustered departures, whereas time-cautious evacuees displayed a more evenly spread departure pattern, presumably avoiding the final stretch of the allocated 6-h window to prevent late arrivals. Time-cautious evacuations emphasized the early departure of residents from high-risk coastal zones such as Galveston Island, steering them toward safer inland refuges. On the other hand, risk-conscious evacuees tended to elect closer destinations to avoid extended travel, experiencing longer travel times, but arriving at destinations earlier owing to their early departures. Interestingly, a hybrid scenario with an equal blend of both behaviors yielded the best traffic outcomes, highlighting the potential advantages of diversified behavior. When comparing CPT with multinomial logit (MNL) outcomes, the MNL model led to a wider dispersion of departure times and exacerbated traffic conditions. A noteworthy observation was the lack of a staggered evacuation strategy in the time-cautious MNL configurations. However, the results were based on simulation data, and further validation will be needed with real-world evacuation data.
Keywords
Hurricanes are among the most frequent and deadliest natural disasters in the United States, with considerable social, economic, and infrastructural impacts ( 1 ). The devastation caused by Hurricane Harvey in 2017, with $125 billion in damages and the evacuation of 40,000 people in Houston, TX, serves as a stark example. Recently, Hurricane Laura in 2020 caused $8 to $12 billion insured losses in Louisiana including lives lost ( 2 ). Local authorities play a critical role in formulating risk management plans, issuing warnings, and coordinating evacuations. Effective management of transportation systems and the timely evacuation of vulnerable populations are essential. Evacuees’ decisions on timing and destination of evacuation, influenced by individual preferences, significantly affect the overall evacuation process.
Past studies on travelers’ departure time have considered factors such as early and late arrival penalties, with travel times treated as random variables and optimal “head-start” times chosen considering safety margins ( 3 ). In evacuation contexts, uncertainties and risks are higher, meaning factors such as attitudes toward risk ( 4 ), probability of hazard occurrence ( 5 ), timing of evacuation notices ( 6 ), and the severity as indicated by hurricane category affecting decisions ( 7 ) become pertinent. Managing evacuees’ departure times contributes to efficient evacuation planning by avoiding undue risks and severe traffic congestion.
Destination choice is another complex decision-making process influenced by demographics, trip purpose, time of day, and mode choice ( 8 – 11 ). In evacuation scenarios, considerations extend to nearby routes ( 12 ), regional geography ( 13 ), and risk attitudes ( 14 ). The spatial patterns of evacuation traffic dictate strategic shelter allocation and infrastructure planning to mitigate congestion and enhance the efficiency of large-scale evacuations ( 15 ). Joint modeling of evacuees’ departure time and destination choices has also been explored ( 16 , 17 ).
Factors affecting the evacuation departure time choices include the length of time spent in a region, time of day, household location, and destination characteristics ( 4 , 18 ). The topology of an individual’s social network affects the evacuation departure time choice as well ( 19 ). Hazard-related factors can also affect the discrete choice of evacuation departure time ( 20 ). Variables including race, income, preparation time, and changes in evacuation plans can affect the evacuation destination choice of each household ( 21 ). Even disaster-related factors such as the projected path of the storm can have an impact on the evacuee’s destination choice, for example, by avoiding the direction of the hurricane ( 22 ). A risk indicator representing whether the potential destination is vulnerable to a hurricane had a statistically significant impact on evacuee’s destination choice ( 23 ). Even joint modeling approaches for mode and destination choice ( 24 ), and time-dependent destination choices ( 12 ) were suggested.
Although various factors such as information acquisition, supply preparation, and intrahousehold coordination undoubtedly shape evacuation decisions, this study specifically focuses on modeling the influence of preferred arrival times and traffic conditions on evacuee behavior. Thereby, this paper develops a joint model for evacuation departure time and destination choices, concentrating on evacuees’ preferences for arrival times and traffic conditions. Two models are proposed, assuming either “risk-conscious” or “time-cautious” behavior. Cumulative prospect theory (CPT) is employed to depict human decision-making under risk, with evacuees’ decisions evaluated for optimal choices. The paper is organized into sections covering the network and data, methodology, analysis results, comparison of CPT with multinomial logit (MNL) models, and a summary of the findings and recommendations.
Network and Data Description
This paper’s scenario assumes a hurricane will impact Houston’s coastline, with a network encompassing 36,124 links across 5,217 traffic analysis zones (TAZs) and 7.2 million residents across eight counties: Brazoria, Chambers, Fort Bend, Galveston, Harris, Liberty, Montgomery, and Waller ( 25 ). Only coastal residents are considered for evacuation, reducing inland background traffic volumes by 50% compared with a typical weekday. The assumption of 50% reduced background traffic stems from the limited availability of precise data on traffic volume reductions during hurricane evacuations. It serves as a modeling simplification to enhance computational feasibility and to approximate the general trends in traffic behavior typically observed in emergency scenarios. The “hurricane risk zone” includes five counties (Brazoria, Chambers, Galveston, Harris, and Liberty) and is categorized into five risk zones defined by the Texas Natural Resources Information System (TNRIS) ( 26 ).
TNRIS defines five hurricane risk zones: someone in Risk zone 1 is threatened only by Category 1 hurricanes, whereas those in Risk zone 5 are threatened by Category 1 through 5 hurricanes (with 5 being the strongest and heading furthest inland). The population data guided the sampling of residents’ home locations (origins) within corresponding TAZs. Evacuation destinations were designated at eight exit sites in the Houston network, with no further trips tracked. Following the evacuation route map announced by the regional metropolitan planning organization (Houston–Galveston Area Council, H-GAC), eight total exit points were identified, as shown in Figure 1. To enhance realism, a 30-min warm start was assumed, to populate the empty network with daily traffic before a 6-h evacuation commencing 6 a.m. until noon. All evacuees were modeled to make their departure decisions within a 6-h duration. This assumption was based on the recent evacuation order issued by the mayor of Galveston, TX on August 25, 2020 in response to Hurricane Laura, which was activated at 6 a.m., followed by city services being suspended at 12 p.m. ( 27 ). Under this assumption, we modeled a scenario anticipating a hurricane akin to the strength and scale of 2020’s Hurricane Laura. By varying the assumptions about evacuation timing, we can simulate different disaster magnitudes and observe how these changes influence evacuee behavior and the overall effectiveness of the evacuation process. Figure 1 depicts the five-level risk zones from red- to yellow-colored regions (by TAZ level), eight destinations, and recommended evacuation routes as per the H-GAC.

Evacuation route and destinations.
Evacuation Travel Time Estimation
Travel times for evacuees from origins to destinations are influenced by departure times and changing traffic conditions, especially during mass evacuations. Given the rarity of evacuations, simulation methods are required to estimate these times. Agent-based traffic simulations are pivotal in capturing these traffic dynamics. A staggered evacuation can reduce congestion onset and enhance overall evacuation efficiency ( 28 ). Nevertheless, real-world evacuations reveal diverse departure patterns resulting from nonadherence to staggered schedules. Figure 2 illustrates four departure time schedules based on a Beta distribution: early-, late-, uniform-, and bell-curved evacuations. Examples include early evacuation in nuclear powerplant scenarios ( 29 ) and both bell-curved and uniform evacuations during hurricanes. The late evacuation pattern was noted in the Hurricane Matthew 2016 evacuation in Georgia, USA ( 30 ).
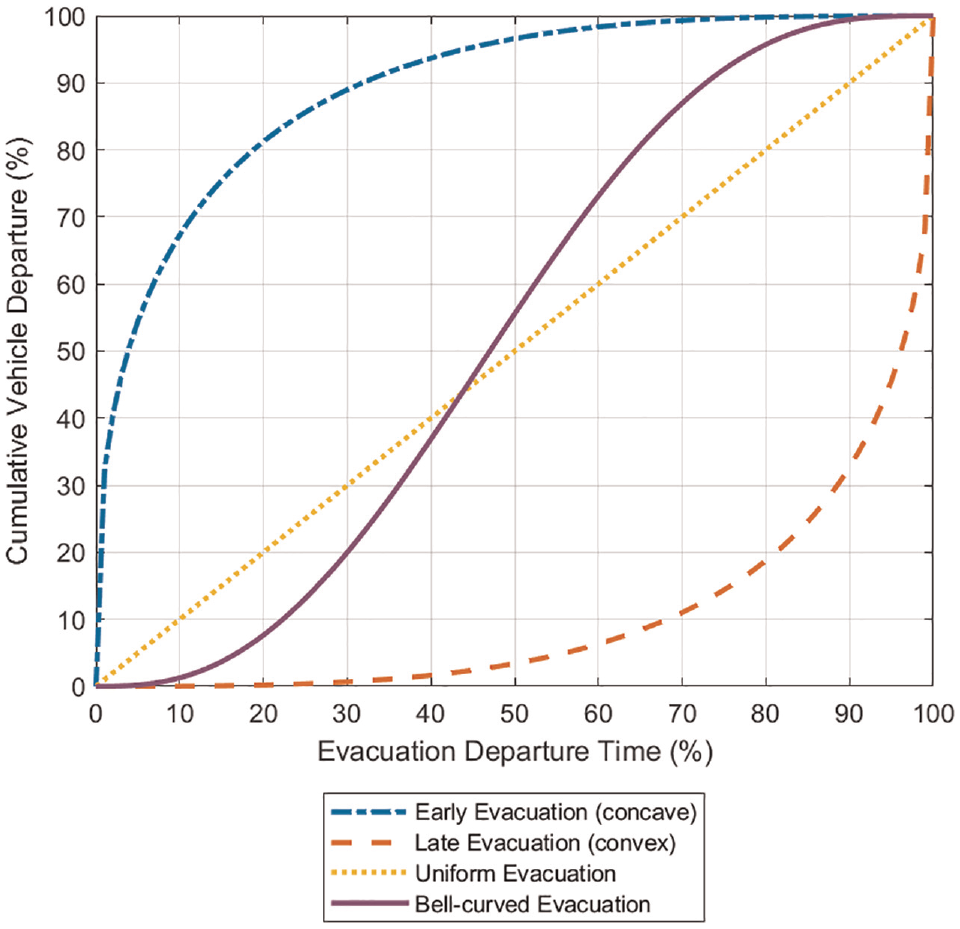
Example departure time schedules.
This study utilized the Beta distribution in Equation 1 with two parameters to represent these departure time variations. The shape parameters,
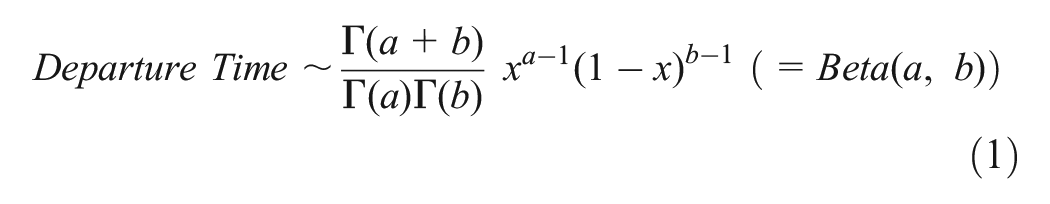
where
Using Equation 1, 6,000 distinct departure schedules were simulated over a 6-h period with a 10% sample population. The choice of a 10% sampling rate was made for computational efficiency. Utilizing the Texas Advanced Computing Center’s Frontera supercomputer, the simulation extended beyond 30 days to achieve optimal results even with this sampling rate. To preserve the authenticity of this study’s findings, the roadway capacity was carefully adjusted, ensuring it accurately reflected realistic traffic conditions during evacuations. These departure times were consolidated into 24 intervals of 15-min each across the 6-h span. For each interval, t, travel times between every origin, i, and destination, j, are aggregated from these simulations, generating a travel time distribution for all ijt (origin–destination–departure time interval) triplets. As specified in Equation 2, an evacuee leaving from origin i during interval t is likely to opt for destination j with the shortest travel time from among the eight exit sites.

where
Given the substantial number of samples simulated, this study assumed the ijt triplet’s travel time distribution adhered to a normal distribution characterized by mean
From the
This study assumed that each household possessed a single privately owned vehicle in which all members evacuated. The assumption of using a single vehicle per household in this analysis was underpinned by observations that evacuating households typically utilize between 1.3 to 1.7 vehicles ( 31 ). This observation supports the simplification to one vehicle, facilitating a more streamlined and manageable approach to the modeling undertaken in this study. Traffic simulations were executed using the open-source tool SUMO, paired with the Python API, TraCI ( 32 ). Only 10% of the population was sampled in the simulation, utilizing the mesoscopic SUMO because of computational constraints. This variant adopts a queuing theory approach, offering faster processing than its microscopic counterpart ( 33 ). To preserve traffic attributes, roadway capacity was scaled down in line with the sampling rate. The simulation’s result, specifically the travel time distribution from origin i to destination j at time t, served to fine-tune evacuee departure times and destination preferences.
Methodology
This section outlines the methods employed to simulate departure time and destination choices during evacuation using CPT. The first model assumed that evacuees’ choices hinged on the aim to reach their destinations as early as possible. In contrast, the second model assumed these choices were guided by the intent to arrive precisely at the desired time.
Risk-Conscious Evacuation Simulation using CPT
This section outlines the methods for the first model, assuming that evacuees’ decisions prioritized arriving at their destinations promptly: this choice here termed the “risk-conscious” model. Various models and theories in the field of decision-making choices have been proposed including expected utility models ( 34 ), attribute-based methods ( 35 ), and regret minimization ( 36 ). However, CPT, introduced by Tversky and Kahneman, is used here, which delineates human decision-making in the face of risks and uncertainties ( 37 ). This property of CPT was utilized to explain evacuation decisions, assessed on 1) outcome valuation in relation to gains and losses, and 2) a weighted function characterizing the probability of the outcome. CPT distinguishes itself from the original prospect theory by accommodating varying attitudes toward probabilities of gains and losses via cumulative probability of outcomes ( 38 ).
Theoretical Background
In this paper,
This value function often manifests as a bifurcated nonlinear function with separate equations for gains and losses. A particular value function from Liu and Li is presented as Equation 3, where
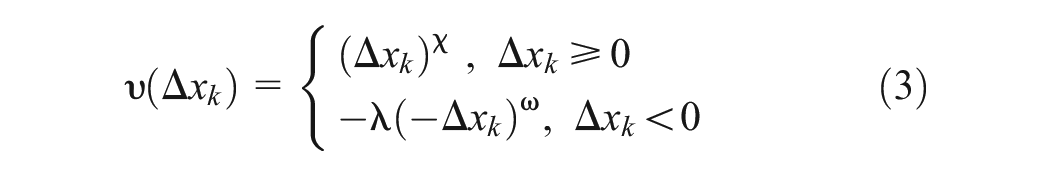
where
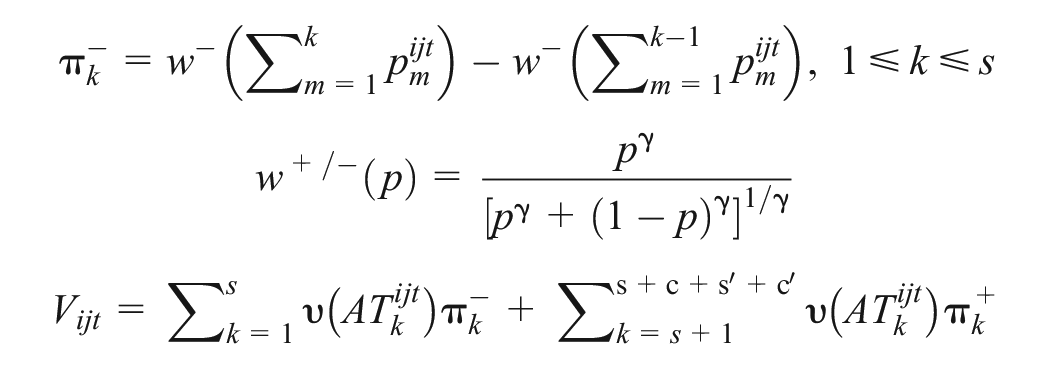
The probability of observing the outcome, k, and its associated value function
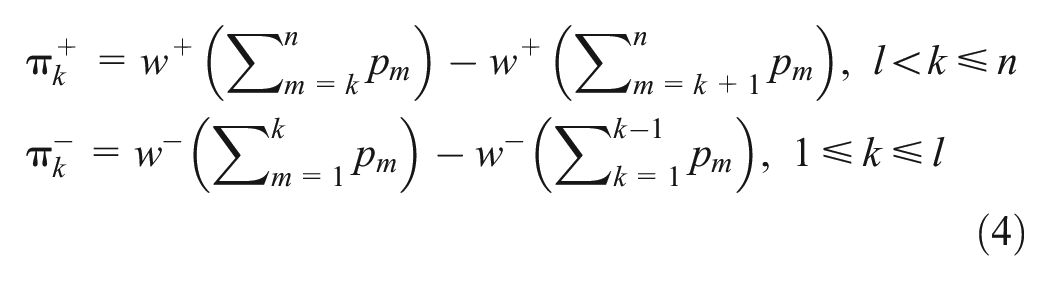
where
By integrating the value function
CPT for Evacuation Departure Time and Destination Choice
CPT has been leveraged in transportation realms, notably in emergency response scenarios (
41
), and to profile travelers’ routing preferences (
42
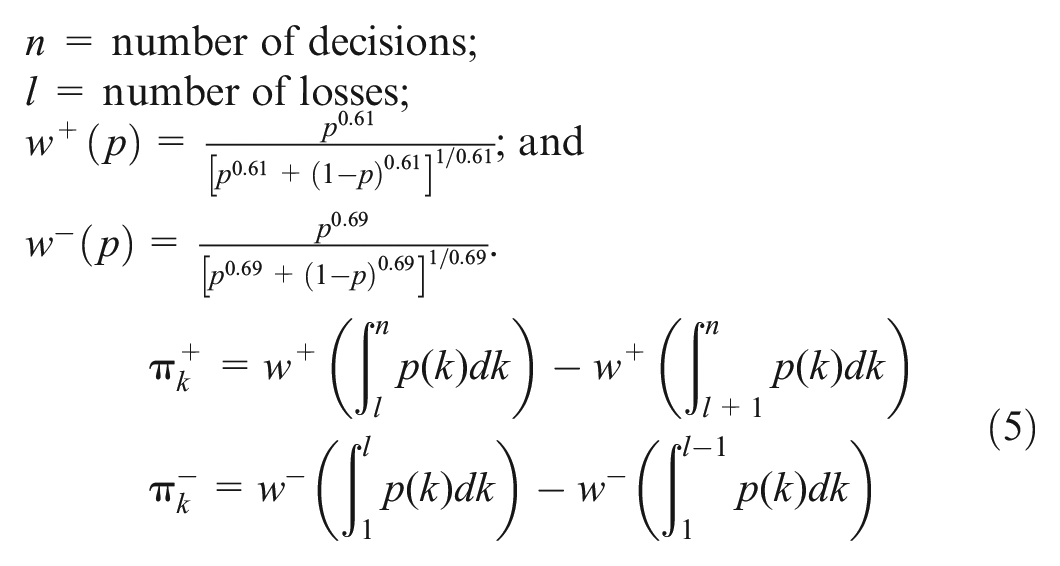
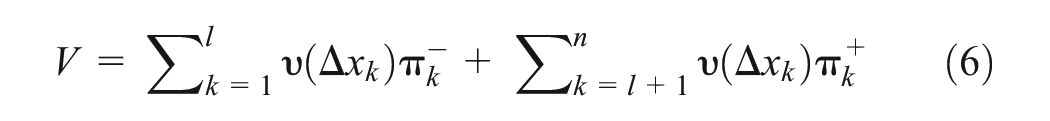
). For evacuations, the kth outcome for an evacuee departing from origin i to destination j during departure time interval t denotes the arrival time, symbolized as
The kth arrival time from an ijt decision,
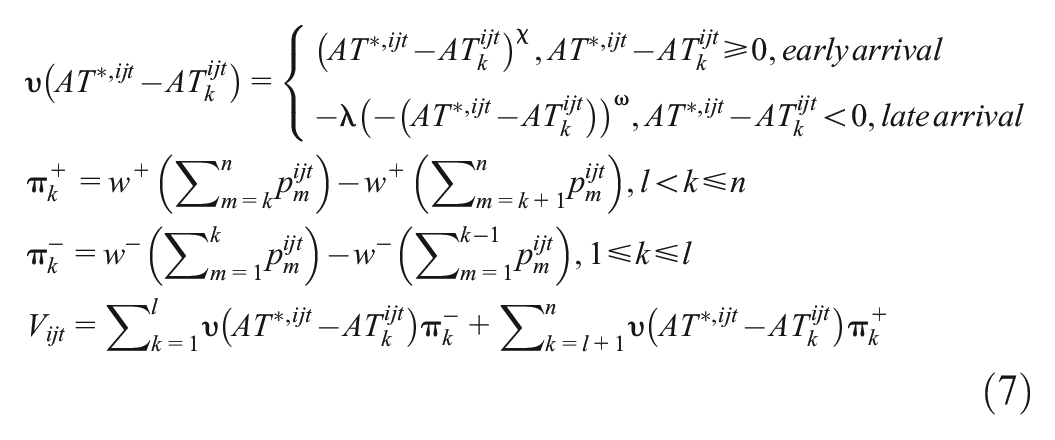
where
In Equation 7, all variables and parameters are known except the desired arrival time of the ijt decision,
Time-Cautious Evacuation Simulation using CPT
This section outlines the methods for the second model that assumes that evacuees’ decisions prioritize arriving precisely at the desired time. Within this study, this choice is termed “time-cautious” model.
Time-Cautious Evacuation and Risk-Conscious Evacuation
The value function in the preceding section suggests that evacuees strive to arrive as soon as possible. This function may enhance the realism of modeling human behavior but might not guarantee optimal evacuation efficiency. Studies indicate staggered evacuations outperform simultaneous ones in managing roadway capacity and reducing evacuation time ( 43 , 44 ). However, the effectiveness of such an evacuation plan is contingent on evacuee compliance ( 45 ). Evacuees’ trust in reliable information technology can alleviate excessive risk-consciousness, emphasizing the importance of devices such as computers, smartphones, and automated vehicles (AVs). AVs, in particular, can be centrally directed to boost compliance ( 46 ). Consequently, the second model—the time-cautious CPT model—shifts the emphasis from “arrive as early as possible” to “arrive precisely at the desired time.”
The time-cautious CPT model prioritizes evacuees reaching their desired arrival time,
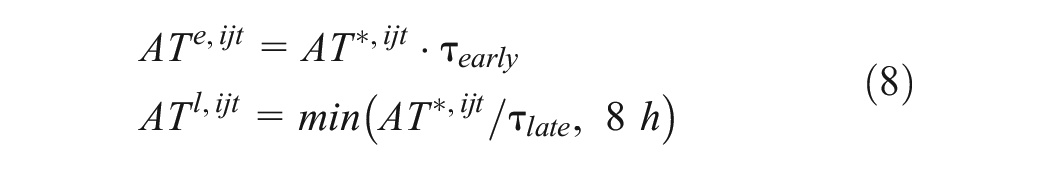
where
This study contrasted the arrival time
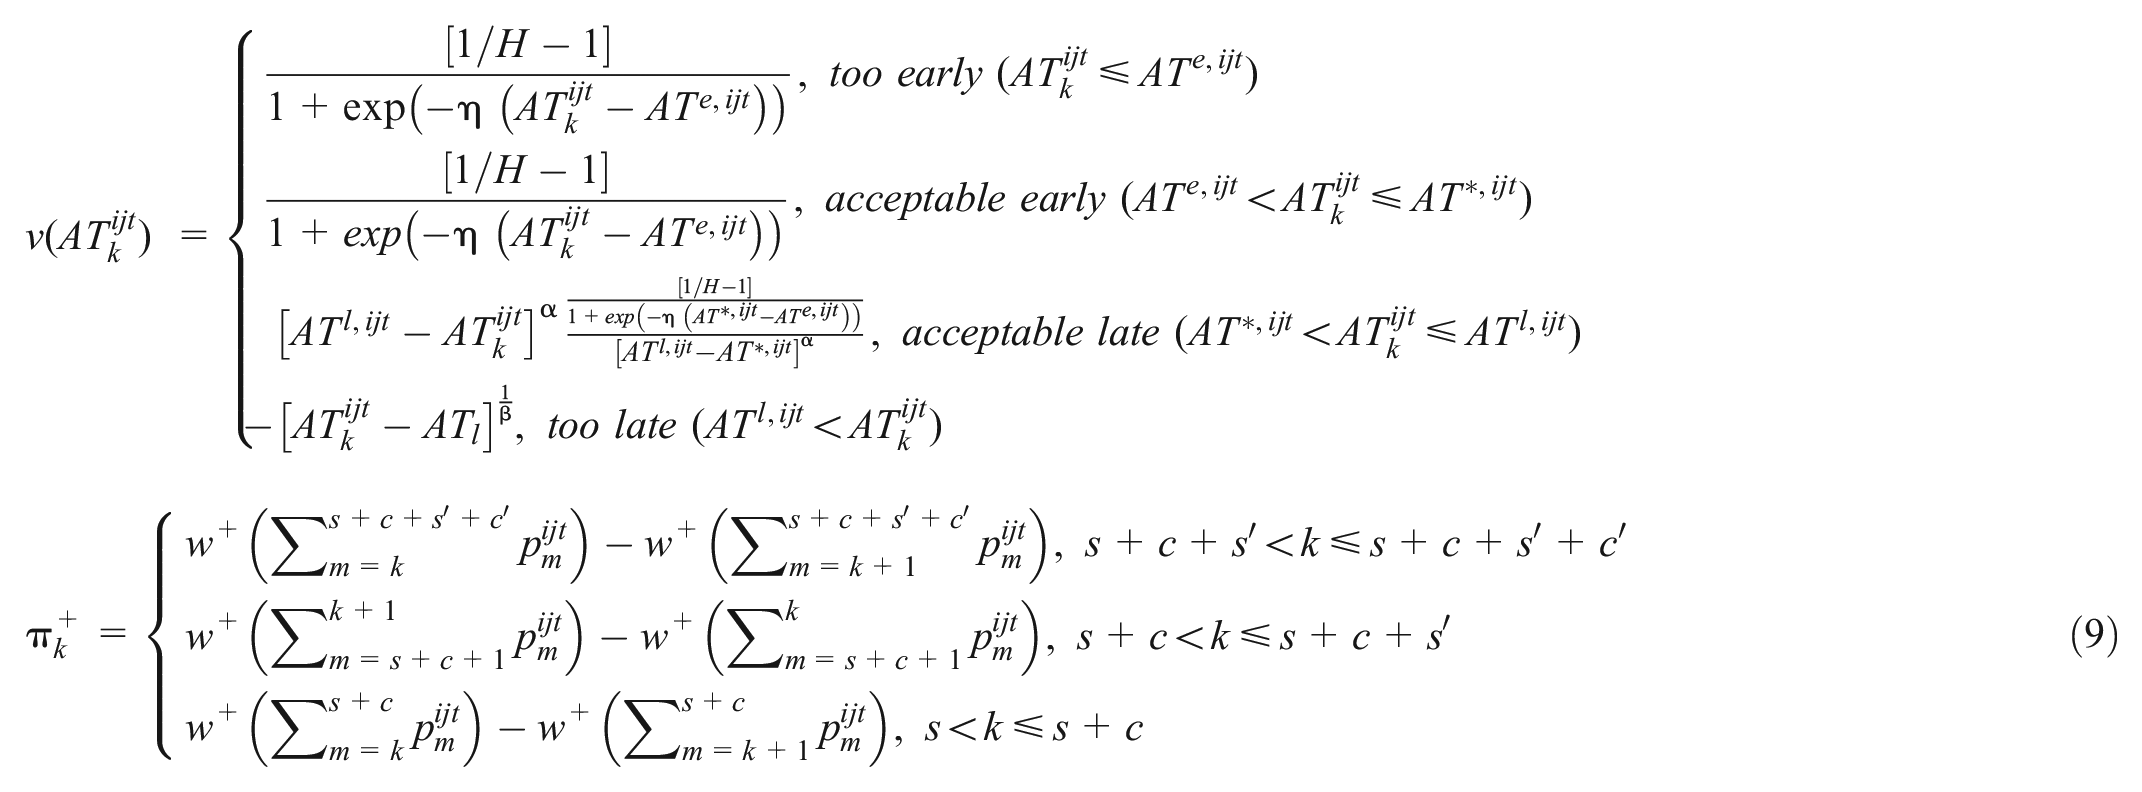
where
Figure 3 illustrates the distinctions between the two CPT models. Figure 3a shows the first CPT model, risk-conscious evacuation, where the value function’s maximum is anticipated when

Value functions of two cumulative prospect theory (CPT) models. (a) Risk-conscious, (b) Time-cautious.
In contrast, Figure 3b highlights the second model in which the maximum value function is expected when
The proposed model emphasizes an increased sensitivity to being late, suggesting evacuees become more aware of slight delays. In the proposed model, avoiding late arrival is emphasized more stringently than in the original model. In reality, evacuees would do all they could to avoid the worst outcomes, as the ultimate cost of being late during evacuation is life—irreplaceable. This view offers a more detailed understanding of evacuation behavior compared with the risk-conscious CPT model, in which the evacuee’s reaction to being late was reduced.
Parameter Calibration
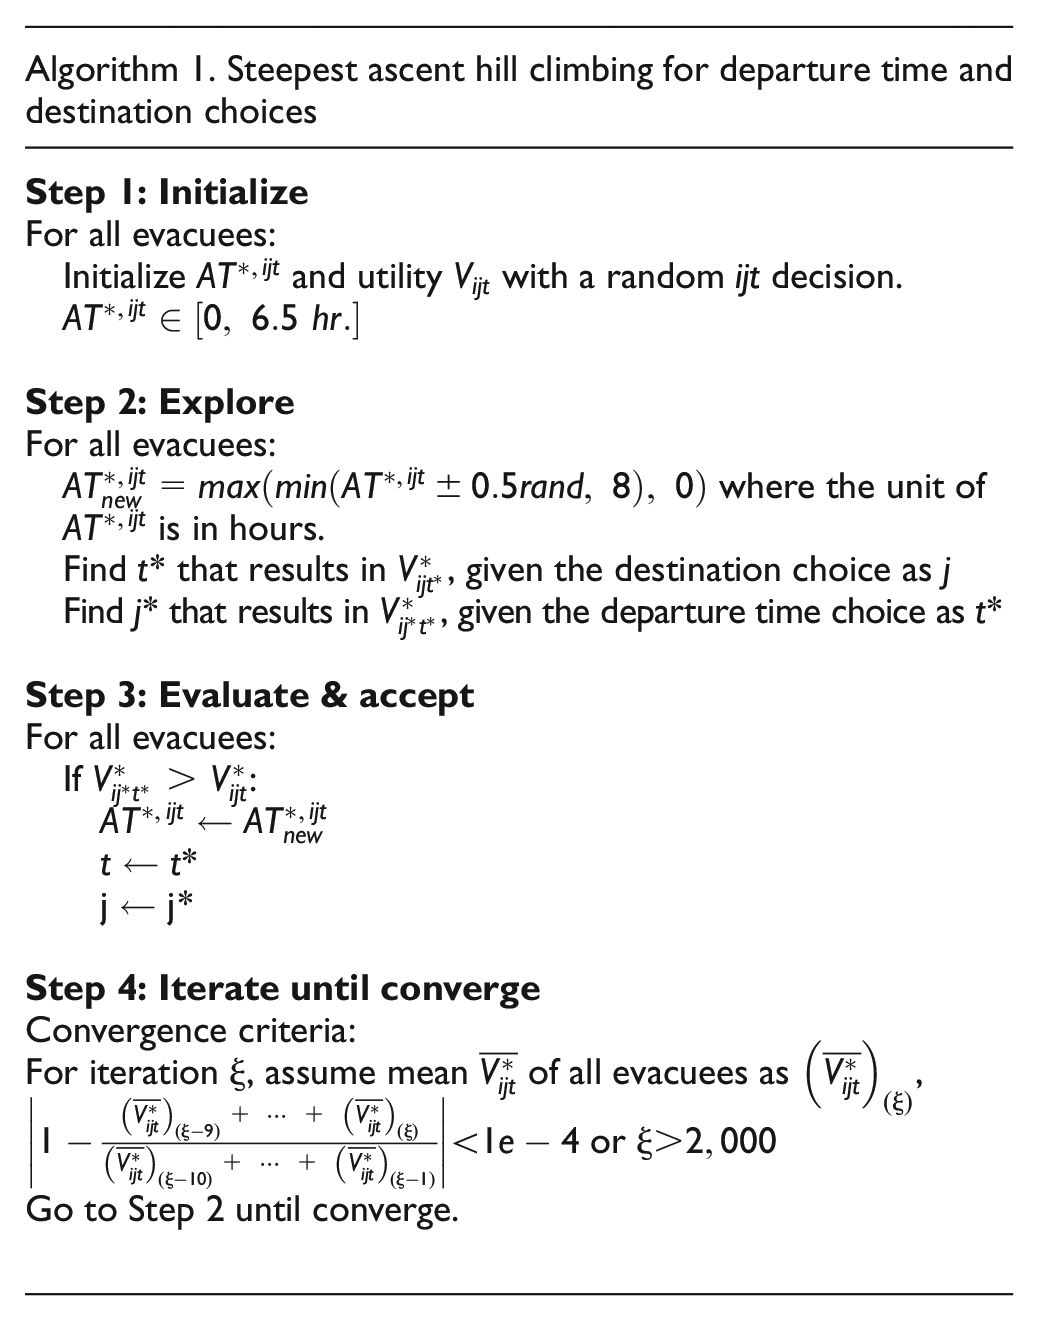
Before executing Algorithm 1, the time-cautious CPT model’s parameter vector,
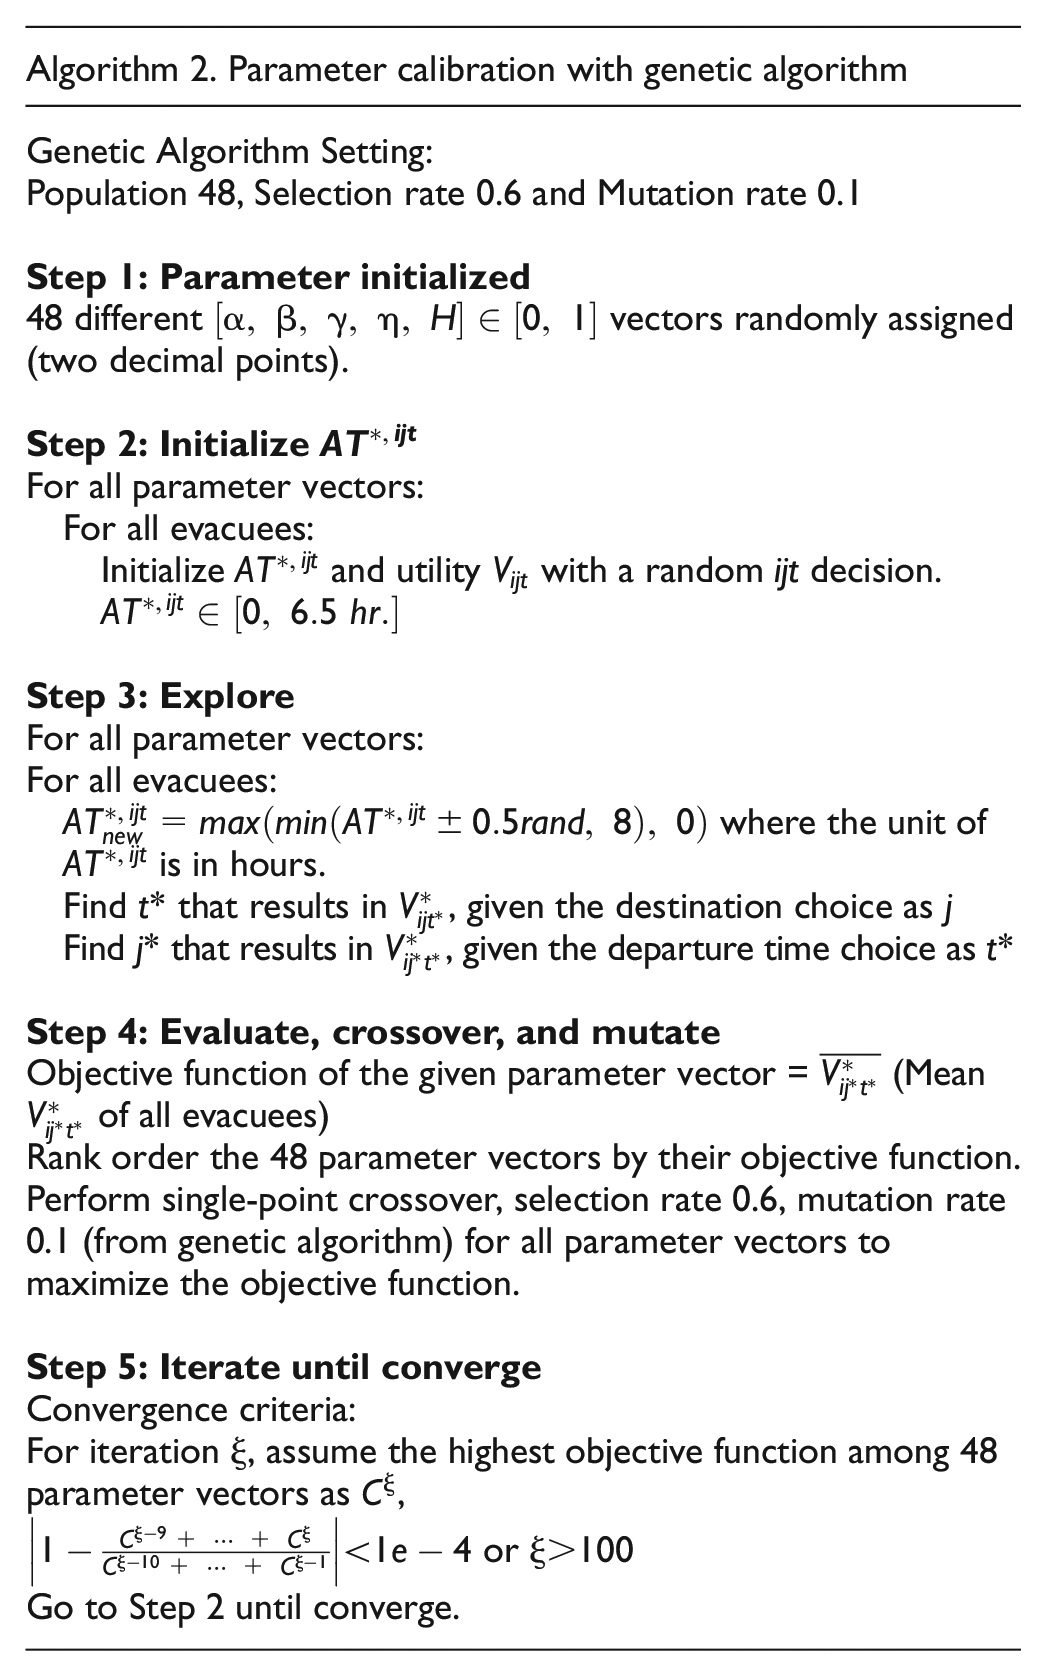
Figure 4 shows calibration results. Because of the stochastic nature of genetic algorithms, unexpected jumps in the objective function are possible, as seen at Iteration 4. The optimization ceased after 24 iterations, meeting the convergence criteria. The identified parameters, to be used for the time-cautious evacuation simulation, were
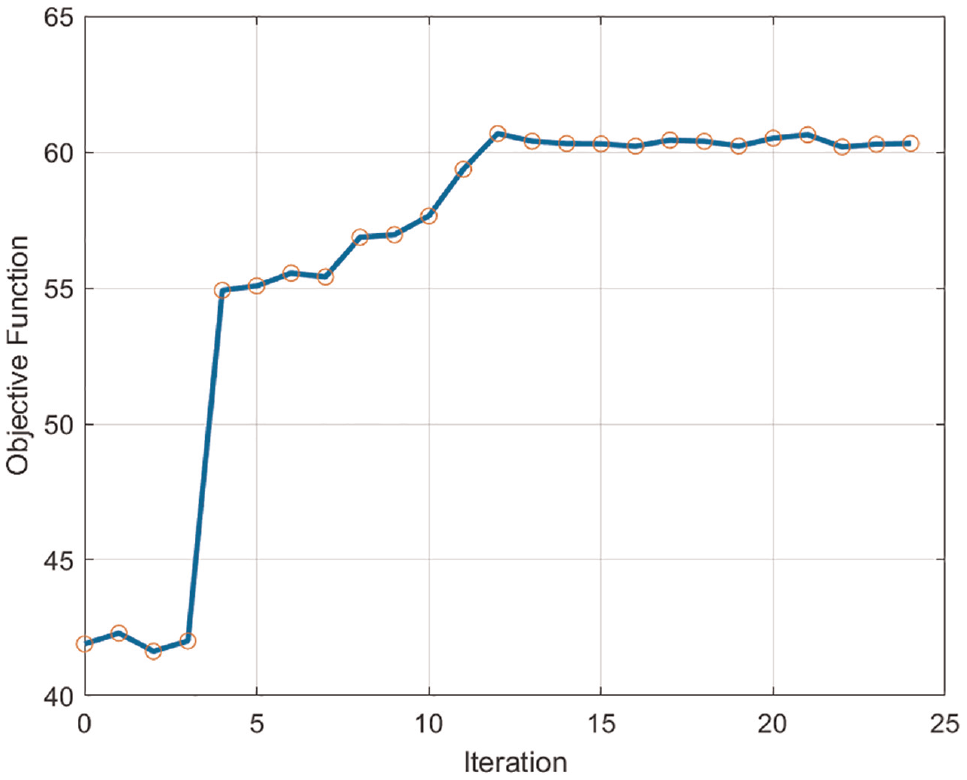
Genetic algorithm convergence results.
Model Convergence
In the evacuation simulation of both CPT models, a sample of 10% of the population was taken owing to computational limitations, and non-evacuating regions were presumed to experience 50% of typical weekday traffic. The departure time and destination choices for each evacuee were refined using Algorithm 1 to optimize utility. Figure 5 displays the convergence outcomes for both models. The time-cautious evacuation model utilized parameters from Algorithm 2. The risk-conscious and time-cautious models underwent 1,876 and 240 iterations respectively, concluding once convergence criteria were met. Post iterations, the mean utility for the risk-conscious model stood at 6.57, whereas the time-cautious model recorded 84.18.
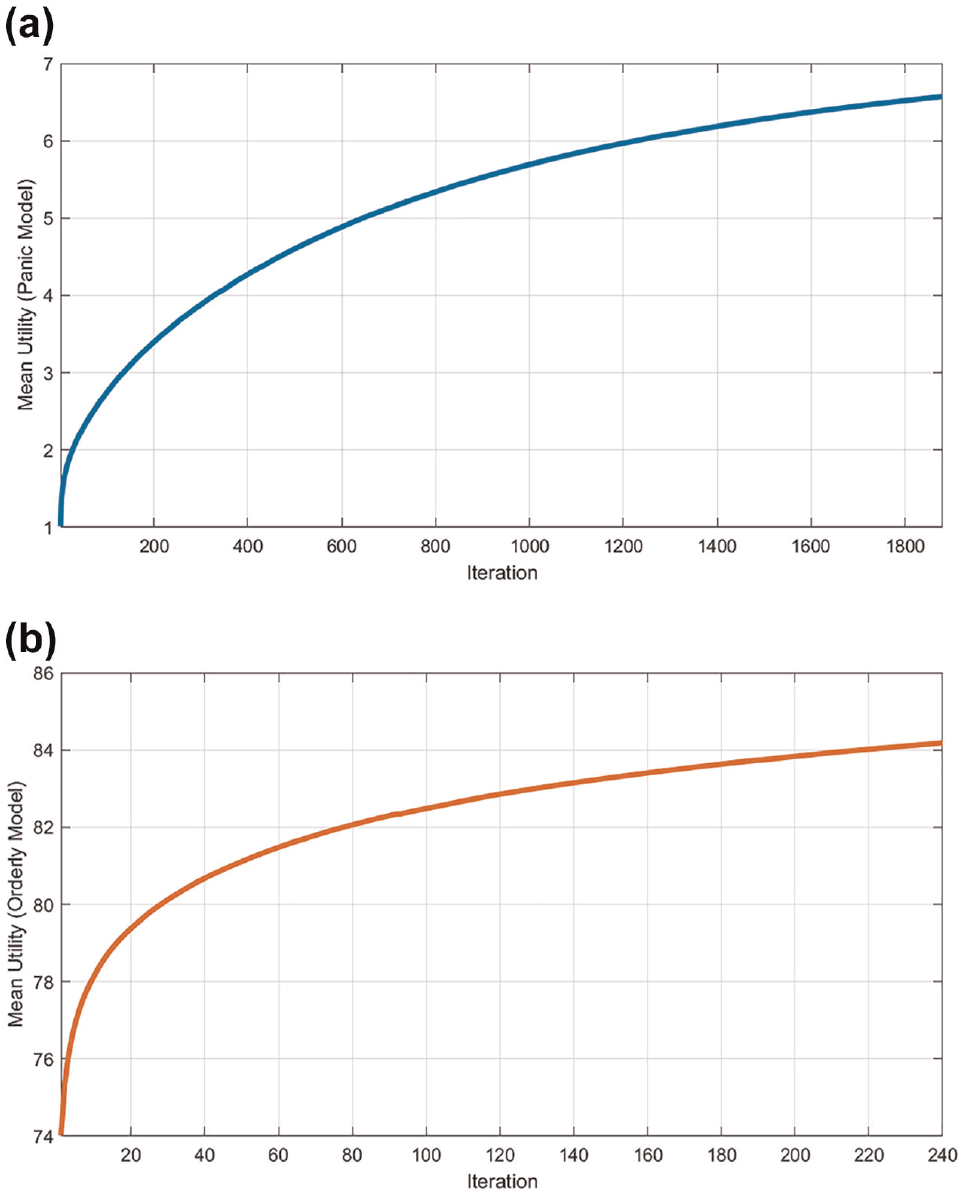
Model convergence results for two cumulative prospect theory (CPT) models. (a) Risk-conscious CPT model, (b) Time-cautious CPT model.
It was notable that although the utility of the time-cautious model exceeded that of the risk-conscious model, this was the result of differing value functions. It does not suggest superiority of the time-cautious model merely based on higher utility. The results from each model’s convergence were subsequently leveraged to assess their comparative performance in evacuations.
Summary
To determine the travel time distribution for each ijt triplet, 6,000 evacuations were simulated using SUMO. With this distribution, evacuee departure times and destinations were simulated via the steepest ascent hill climbing method (Algorithm 1). Two models, “risk-conscious” and “time-cautious,” were introduced. The risk-conscious model incorporates parameters and functions from Liu and Li ( 39 ) as shown in Equation 4. The time-cautious model, devised in this study, calibrates its parameters with a genetic algorithm (Algorithm 2). Evacuation simulation outcomes will be dissected in upcoming sections, highlighting macroscopic departure timings, destination choice analyses, and agentcentric traffic simulations with mesoscopic SUMO. Figure 6 illustrates the workflow of the models and simulations described in this paper.
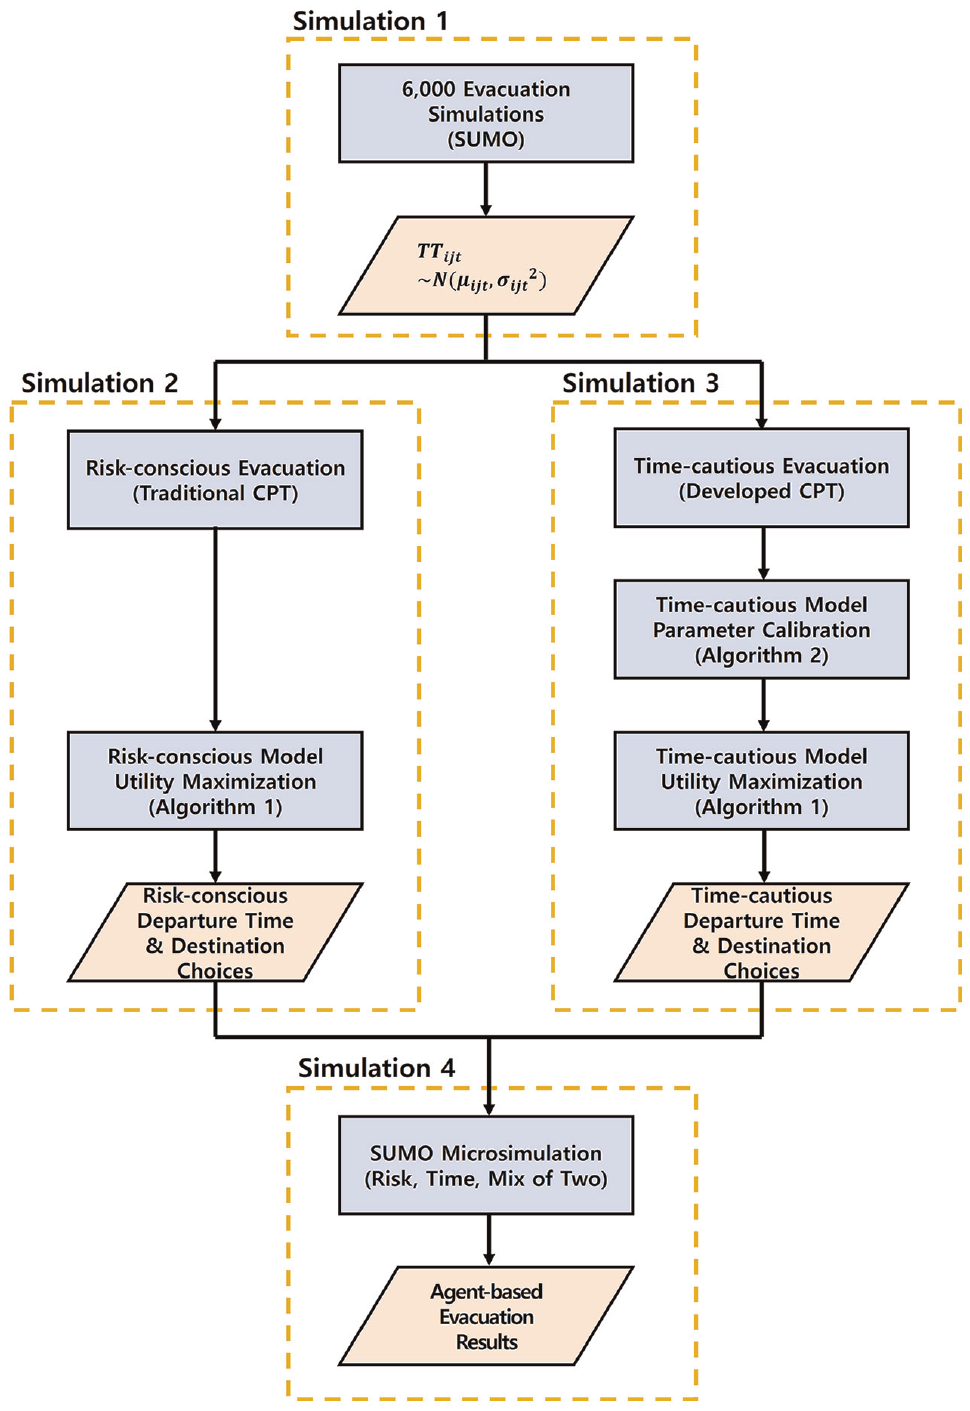
Flow chart of the methods.
Evacuation Simulation
This section begins its analysis of departure time and destination choices at the macroscopic level, further supplemented by agent-based traffic simulations, to evaluate the evacuation performance of the two models. Subsequently, a sensitivity analysis will determine the effects of differing evacuee types on evacuation outcomes.
Departure Time and Destination Choices
Figure 7, a and b , displays normalized departure time histograms for both models using a 12-min bin width. Figure 7a illustrates a scenario in which most evacuees, under risk-conscious behavior, departed within the initial 2 h (6 to 8 a.m.). Conversely, Figure 7b suggests that time-cautious model evacuees utilized the full 6-h window (6 a.m. to noon) for evacuation, indicating ample preparation time. The height of the bars in Figure 7a surpasses that in Figure 7b, suggesting a more concentrated departure pattern in the risk-conscious model, potentially exacerbating traffic congestion. Conversely, Figure 7b shows decreasing bar heights as departure time nears the 6-h mark, illustrating heavy penalties for late arrivals.
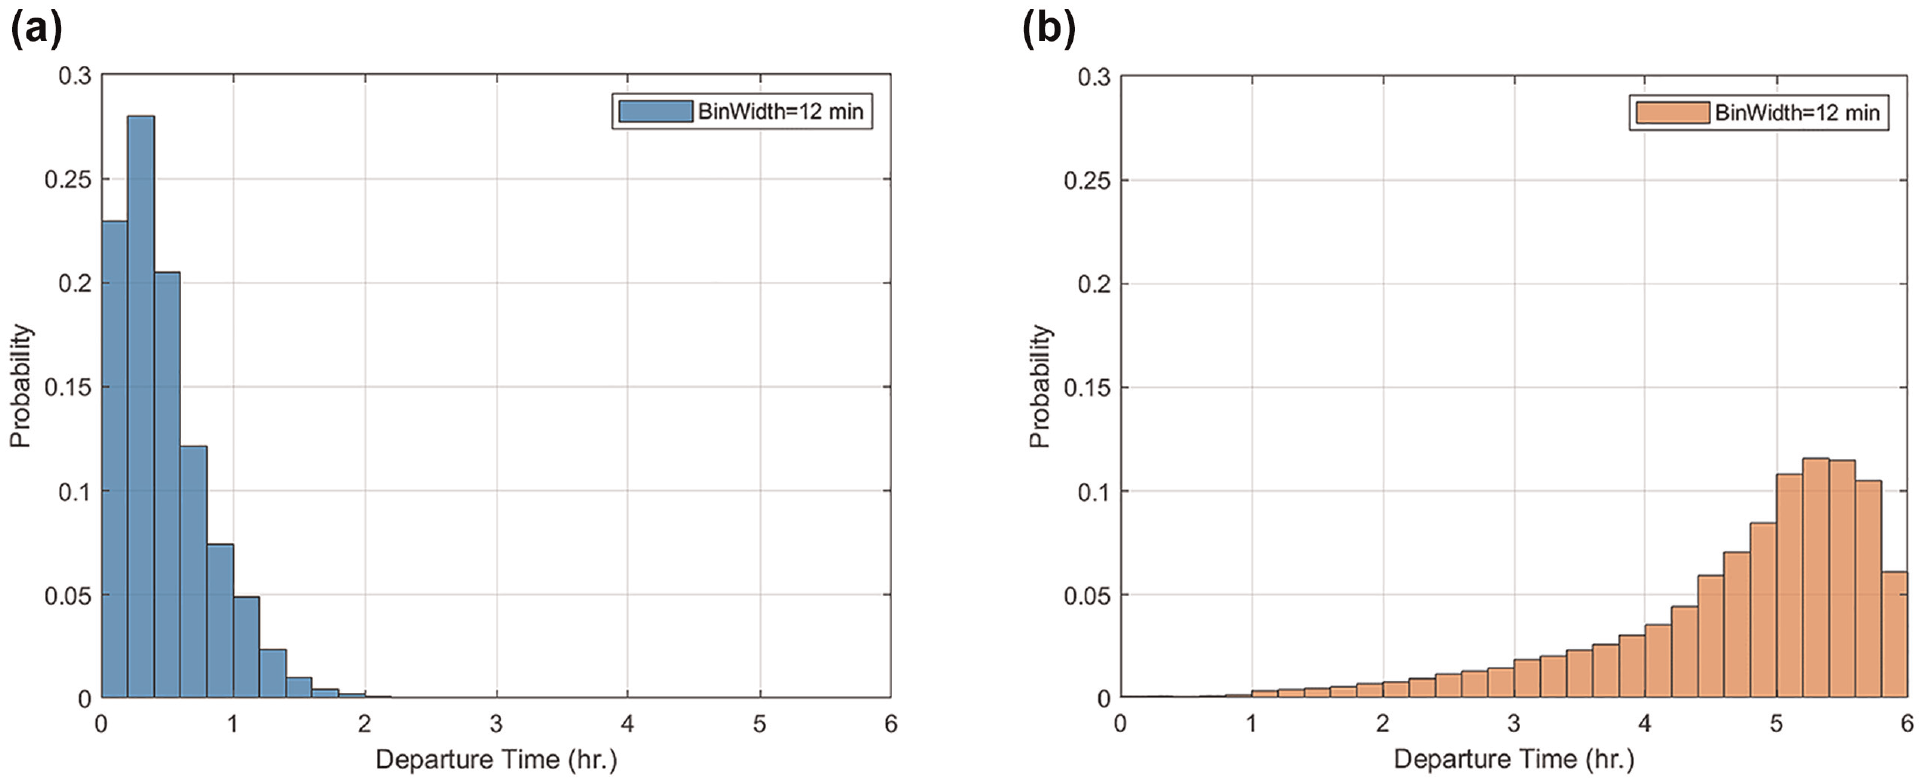
Departure time histogram for two cumulative prospect theory (CPT) models. (a) Risk-conscious, (b) Time-cautious.
Utilizing ArcGIS Pro’s geometric interval method, Figure 8 illustrates the average departure time for each TAZ. This technique ensures consistent observation frequency per class. Several TAZs, owing to their small population, lack sampling. For these TAZs, the average value from the 30 nearest TAZs, determined using the K-nearest neighbor method, was adopted. Figure 8 marks these TAZs with patterned areas. Figure 8a reveals that coastal Galveston Island residents departed later than their inland counterparts, potentially endangering those in high-risk coastal areas. In contrast, Figure 8b shows an orderly, phased evacuation: coastline residents left first, followed by those inland. Notably, coastal evacuees faced longer travel durations than their inland peers. For efficient evacuation, coastal residents should precede others, especially given the potential bottlenecks, like the bridge linking Galveston Island to Interstate 45. Spatially, the risk-conscious model’s concentrated departure times may intensify congestion, without any strategic time prioritization based on location.
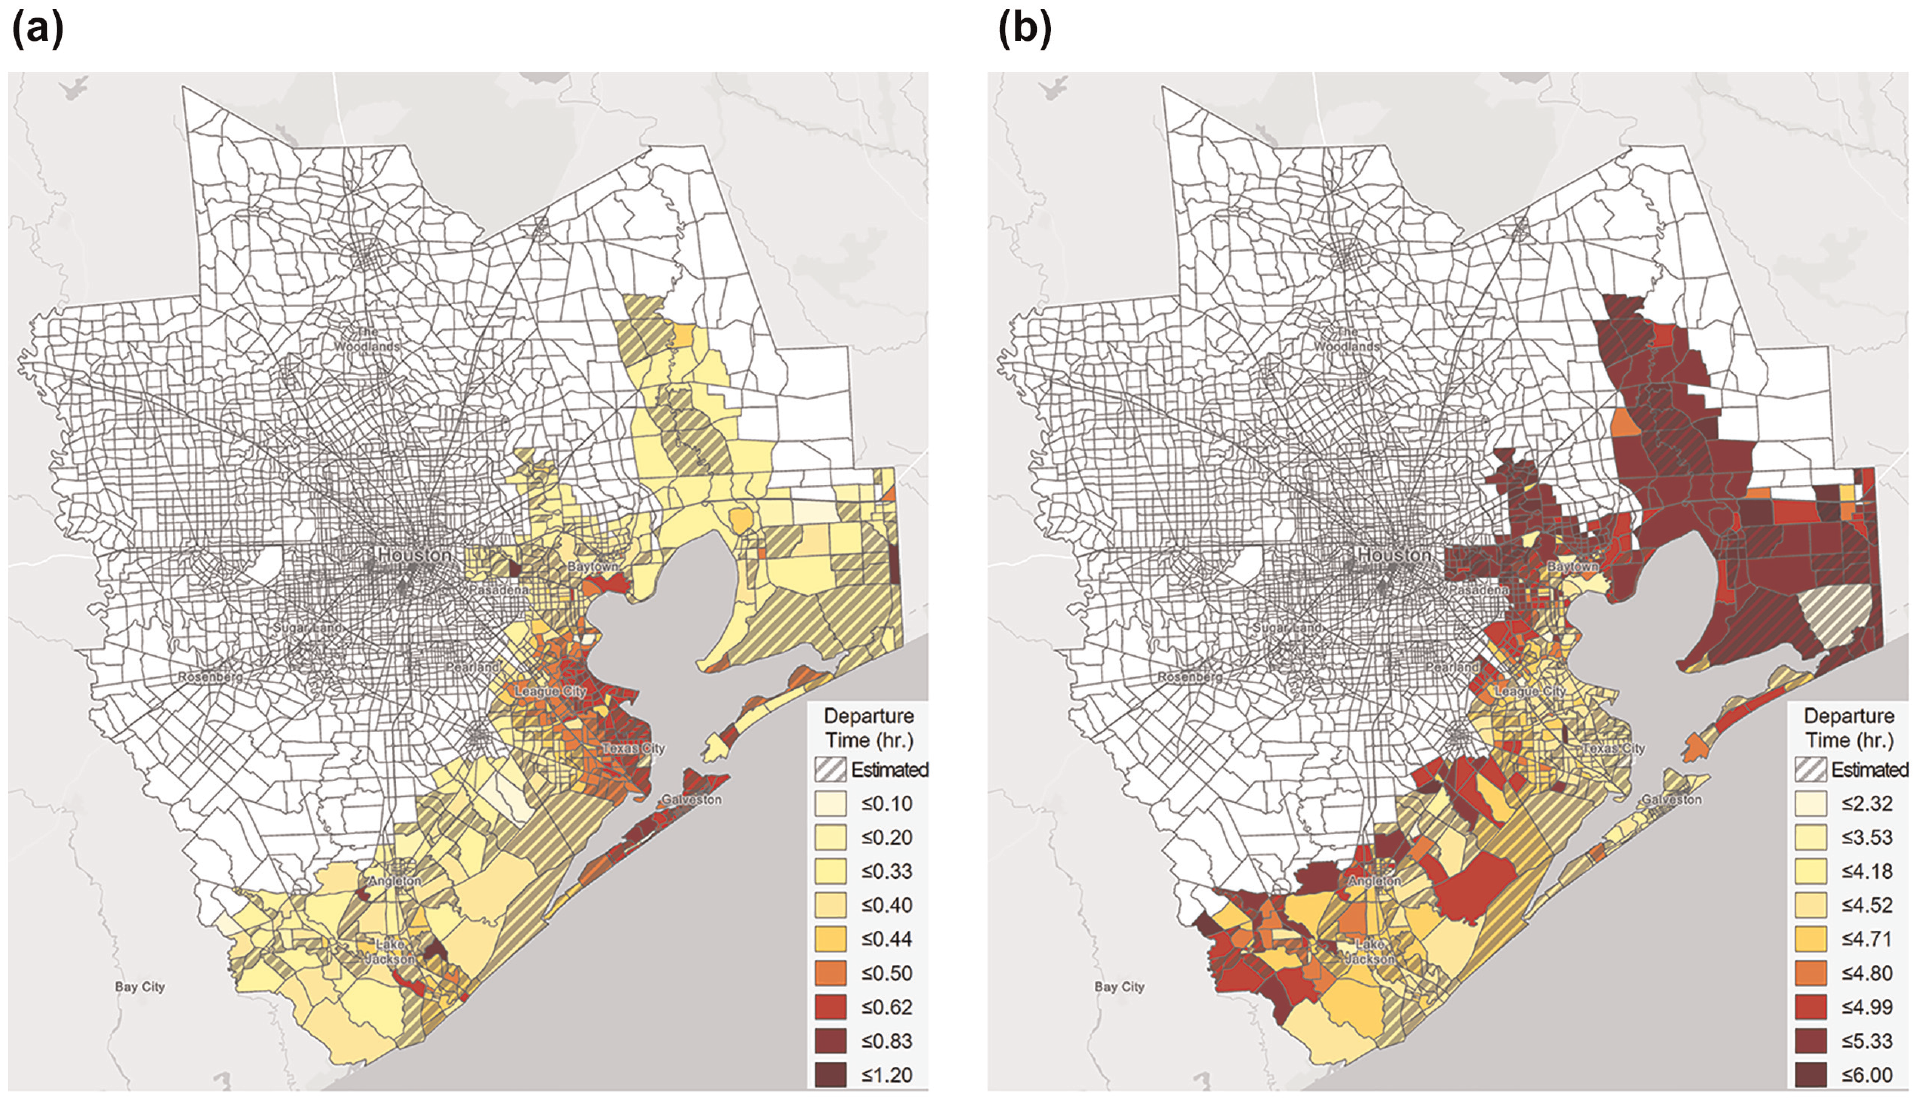
Traffic analysis zone’s average departure time for two cumulative prospect theory (CPT) models. (a) Risk-conscious CPT, (b) Time-cautious CPT.
Figure 9, a and b , delineates destination choices by displaying the percentage selecting each destination and lines from origin to destination depicting individual TAZ-level choices. Line thickness, normalized by choice frequency, signifies the popularity of a particular origin–destination pair. Figure 9a conveys the risk-conscious model’s tendency toward proximal destinations. In contrast, Figure 9b reveals the time-cautious model’s inclination toward distant, inland locations. The risk-conscious model’s congested departure timings might deter distant choices, whereas the time-cautious model’s favorable traffic conditions might encourage farther destinations. Although all destinations were presumed to carry equal risk in this study, locations further inland may be preferable during hurricanes.
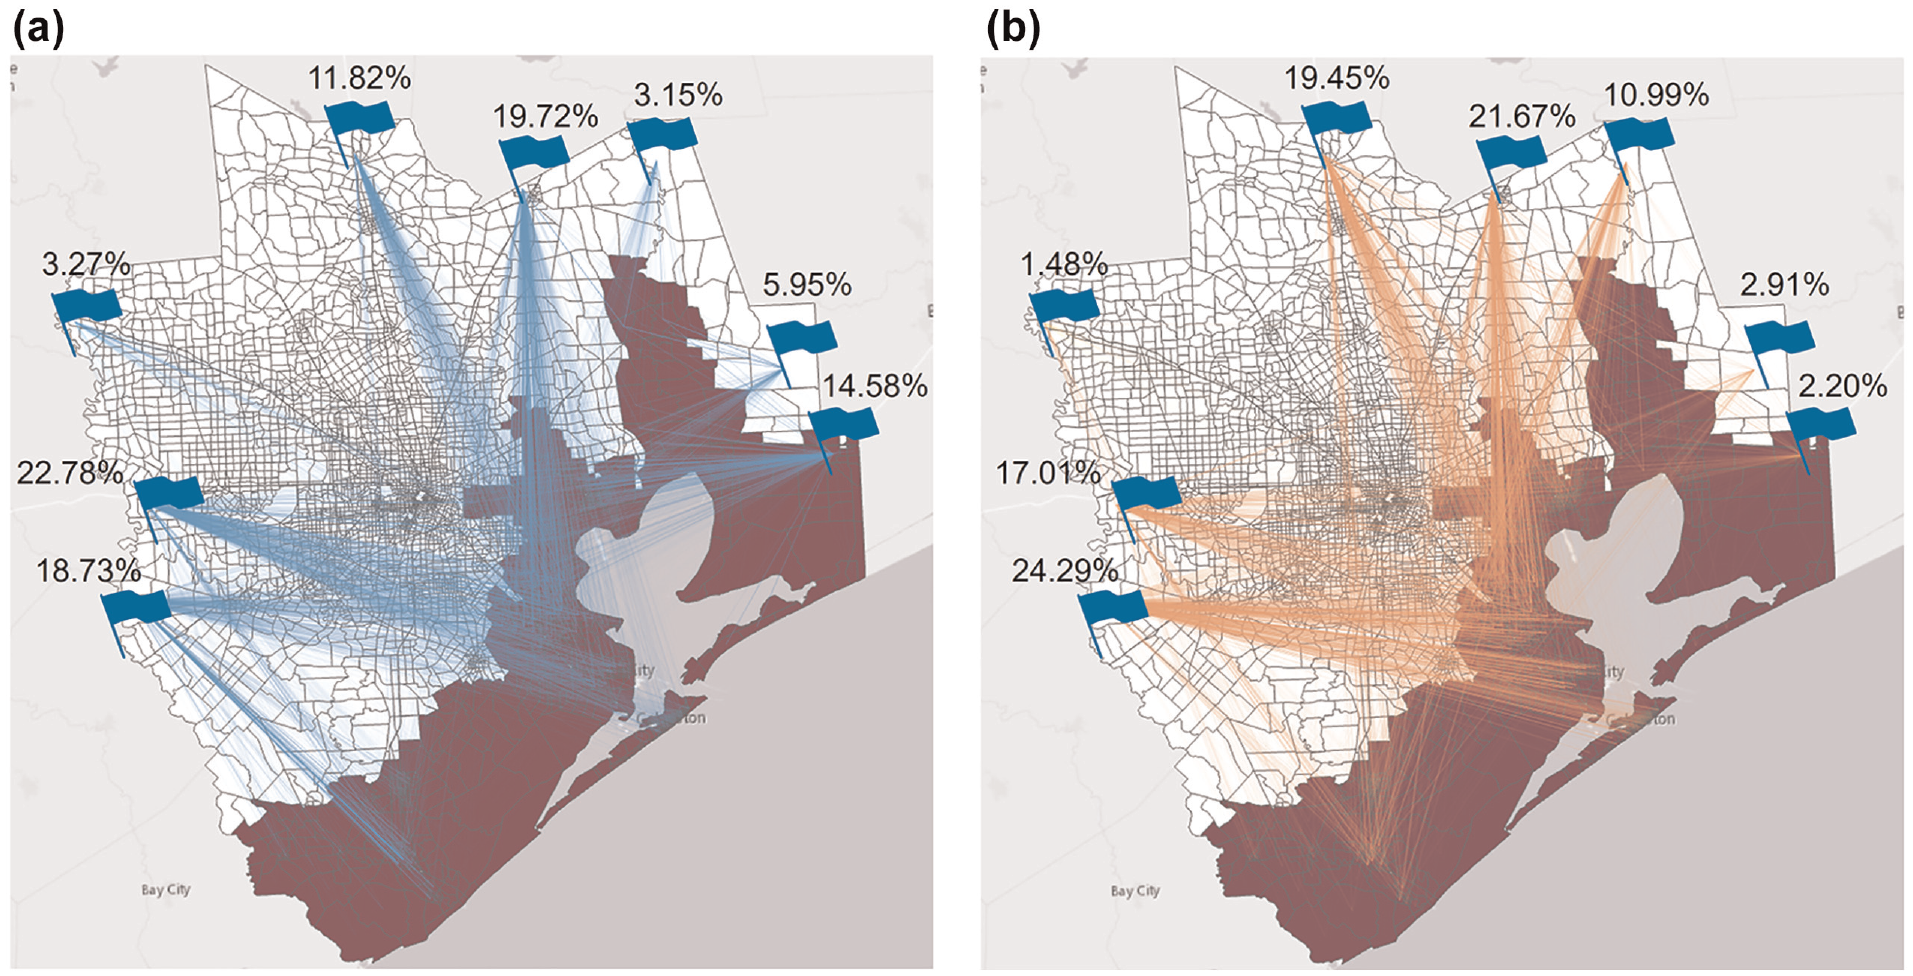
Destination choice for two cumulative prospect theory (CPT) models. (a) Risk-conscious CPT, (b) Time-cautious CPT.
Agent-based Evacuation Simulation
On deriving departure time and destination choices for the two types of evacuee from the CPT models, we conducted an agent-based evacuation simulation to monitor evacuees from departure to arrival, while keeping all other conditions constant. Simulations were executed 10 times for computational efficiency, with the average value represented in Figure 10, which plots departure time against cumulative vehicle percentage. In the risk-conscious CPT model (Figure 10a), a steep rise in the initial 2-h period suggests swift departures and a substantial gap between departure and arrival curves, indicating lengthy travel durations as a result of congestion. In contrast, the time-cautious CPT model (Figure 10b) depicts later departures but potentially shorter travel durations, evident from the reduced gap between curves. Yet, time-cautious model evacuees reached their destinations after their risk-conscious model counterparts owing to their prolonged preparation time.
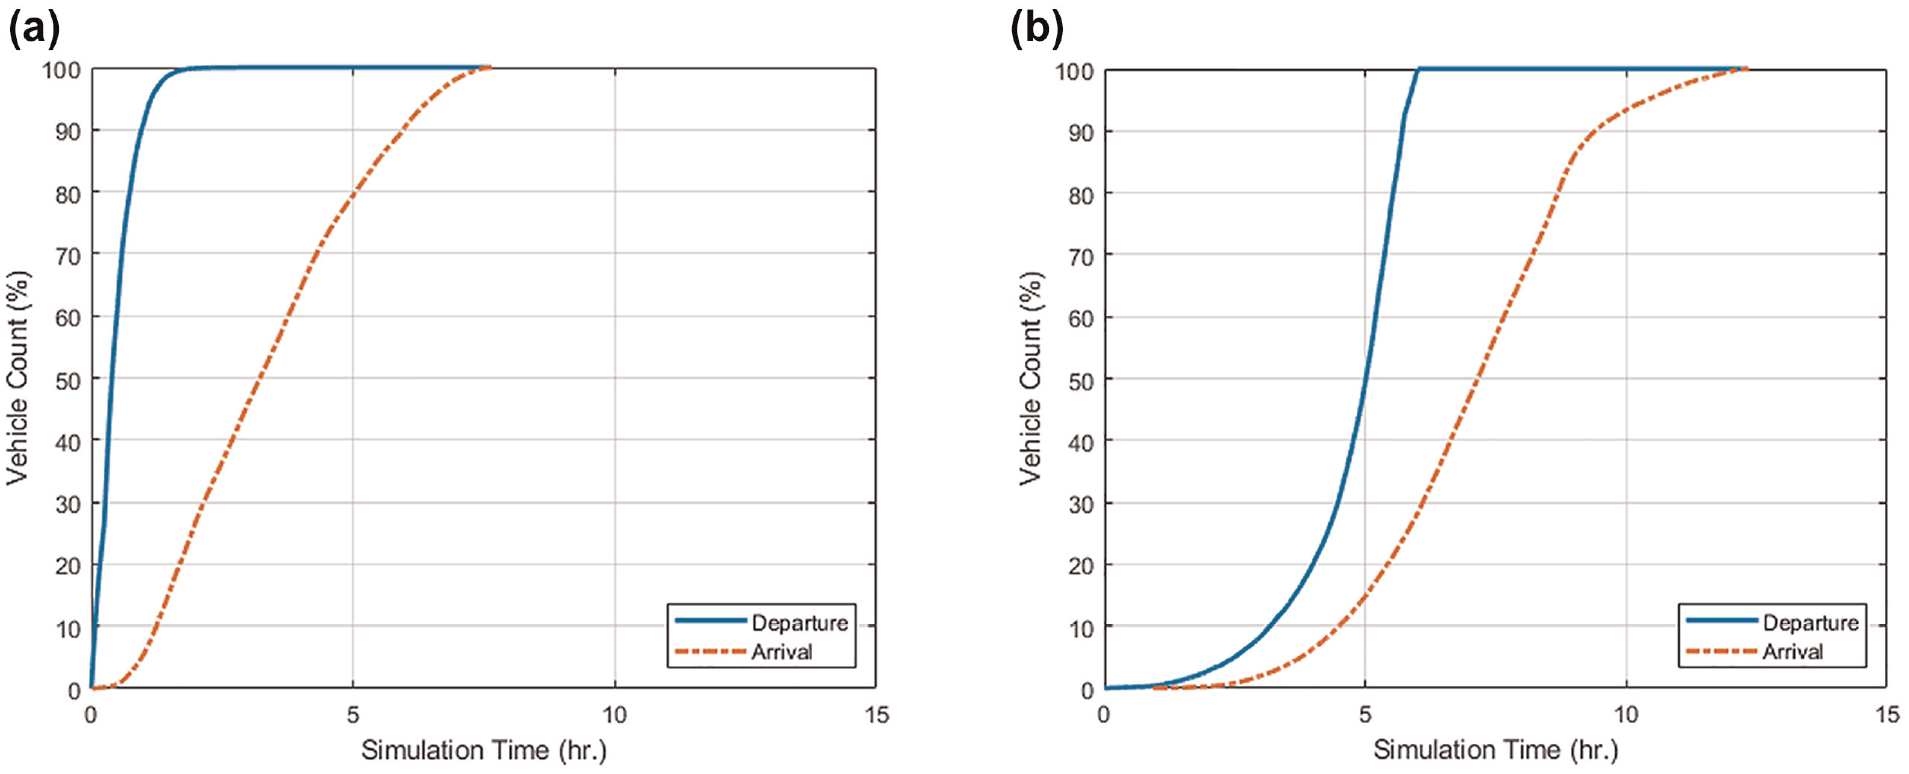
Agent-based simulation result for two cumulative prospect theory (CPT) models. (a) Risk-conscious CPT, (b) Time-cautious CPT.
Table 1 details the simulation outcomes, including metrics like average travel time and distance, travel time index, and specific percentile arrival times. Interestingly, the time-cautious evacuation model reported lower travel times despite longer distances compared with the risk-conscious model, hinting at greater average speeds. A smaller standard deviation in both travel time and distance for the time-cautious model indicated a more consistent evacuation process. The travel time index, or the ratio of experienced to free-flow travel time, was lower in the time-cautious model, suggesting fewer congestion issues.
Evacuation Performance after Agent-based Traffic Simulation
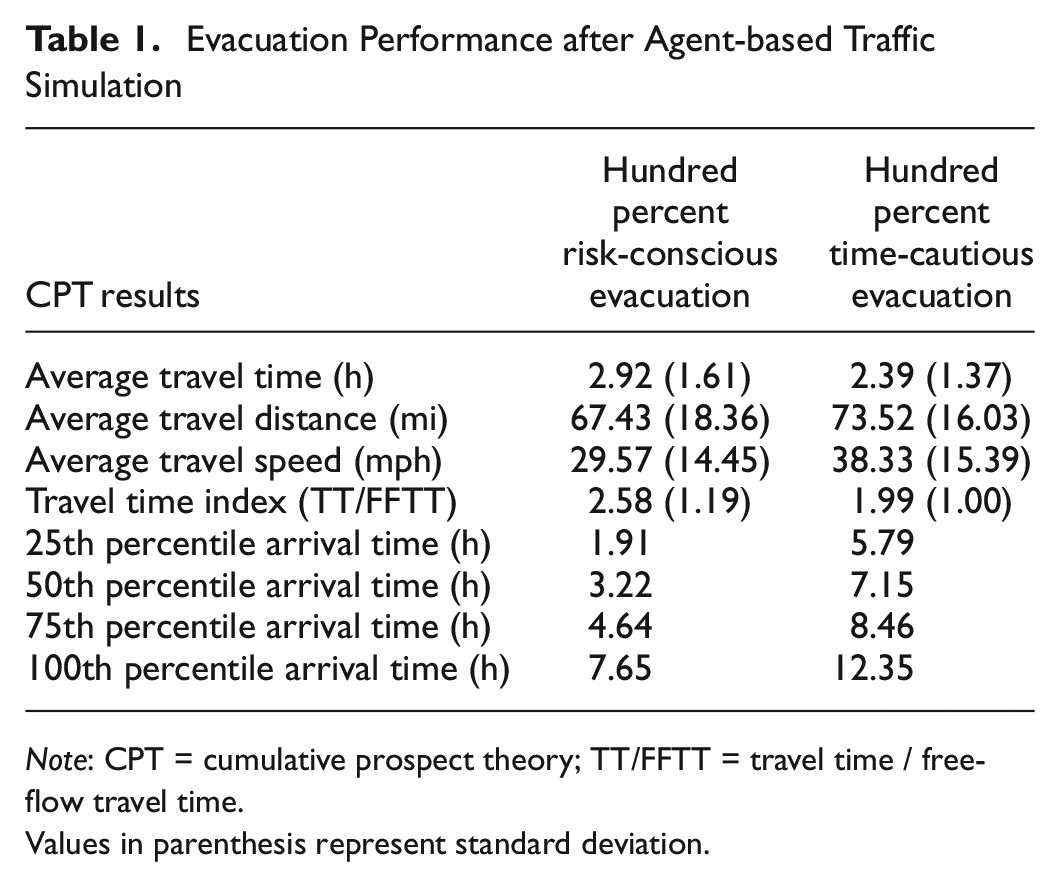
Note: CPT = cumulative prospect theory; TT/FFTT = travel time / free-flow travel time.
Values in parenthesis represent standard deviation.
However, the time-cautious model reported later arrivals for the 25th, 50th, and 100th percentiles owing to the deferred departures. This study operated under the premise that evacuees were not facing an immediate threat from the disaster, suggesting that delayed arrivals might not entail significant risk. Accordingly, dedicating additional time for thorough preparation at home before embarking on the evacuation, thereby reducing time spent on the roads, could be a strategic approach. However, considering potential uncertainties during evacuation, aiming for an earlier arrival remains a prudent strategy. Assumptions in this study, such as the 6-h departure window, could influence outcomes, warranting further inquiry into their optimization.
Figure 11b, which displays vehicle miles traveled (VMT) weighted by departure time, indicated that earlier departures were associated with larger VMT values, which diminished with increasing departure time percentiles. Given the weighting system, Figure 11b suggests evacuees with longer routes departed first, epitomizing a staggered evacuation. Figure 11a, however, shows the opposite trend for the risk-conscious model, in which those nearer to exits evacuated earlier.
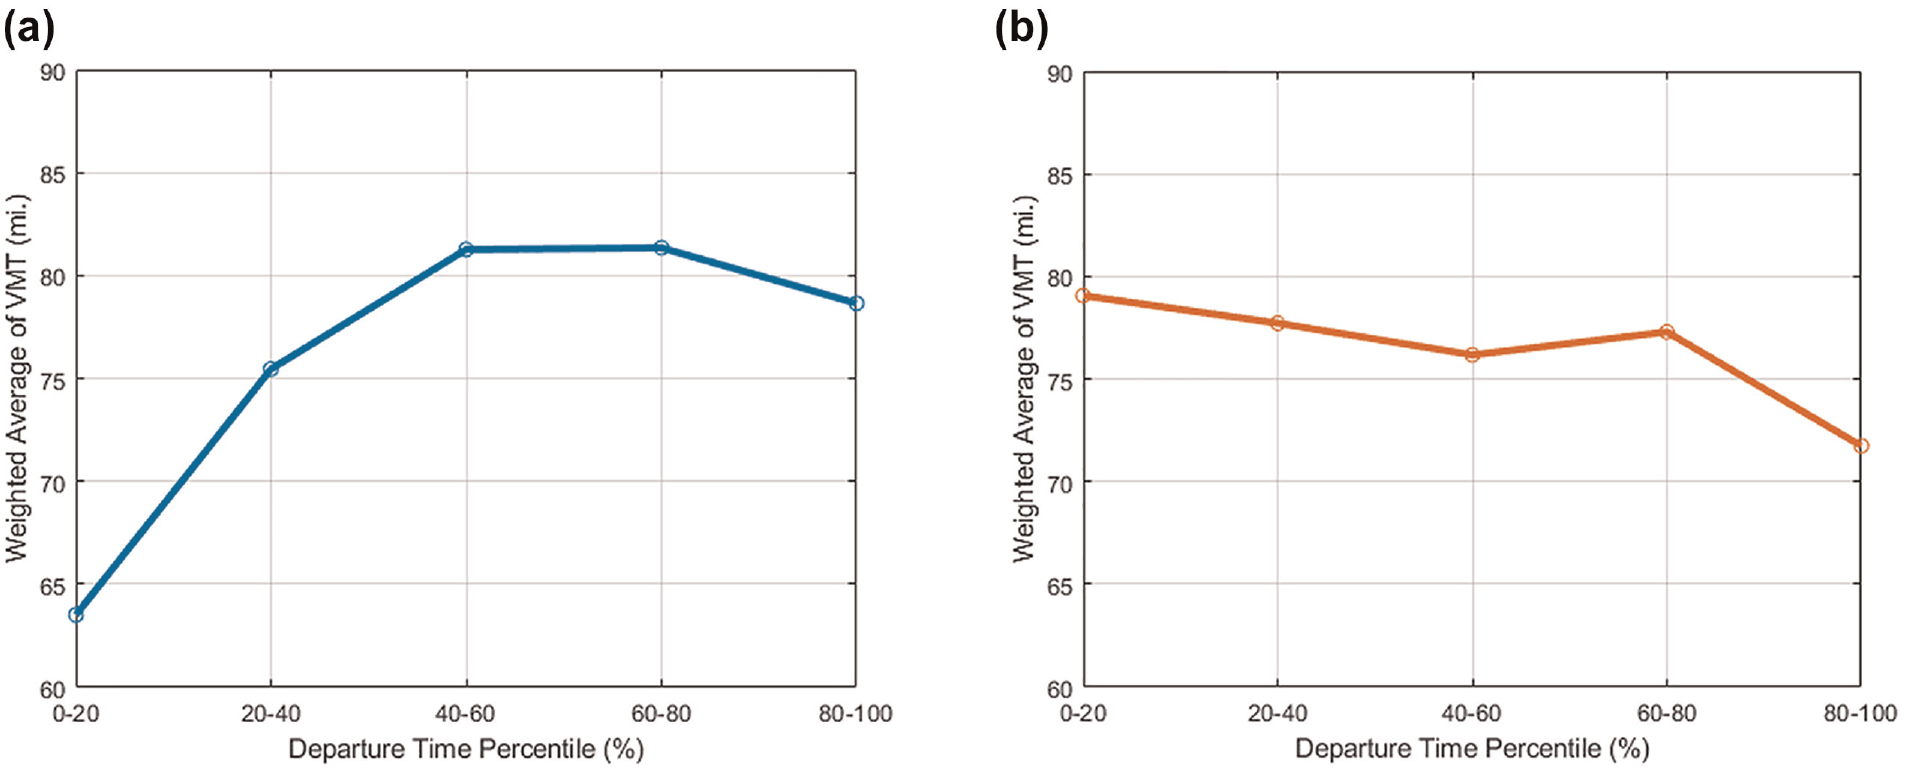
Departure time: VMT for two cumulative prospect theory (CPT) models. (a) Risk-conscious CPT, (b) Time-cautious CPT.
The time-cautious CPT model was not explicitly designed for staggered evacuations based on risk zone. Instead, it modeled the concept of “arriving at the precise desired time.” Those facing longer journeys opted for earlier evacuations, whereas those with shorter routes left later after more preparation. This sequential evacuation is a byproduct of the strategy, contrasting the “earliest possible arrival” approach of the risk-conscious model. These findings hint at the potential dangers of prioritizing early arrivals, especially when the strategy jeopardizes vulnerable populations.
Scenario Analysis
Having analyzed the behaviors of two distinct evacuee types, we simulated their mixed behaviors in heterogeneous configurations. Table 2 presents the agent-based traffic simulation results across three evacuee configurations. A notable finding was that as the proportion of time-cautious evacuees increased in the network, all percentile arrival times extended, and there was an inclination for evacuees to cover longer distances, evident from the longer average travel distance. Yet, the mix of both evacuee types enhanced both average travel time and the travel time index. Although these metrics escalated when 75% of the evacuees were time-cautious, 50:50 mixed configurations demonstrated superior performance in relation to a lower travel time and travel time index than when 100% were time-cautious. Such findings imply that a heterogeneous configuration, encompassing varying evacuee types, might be favorable for curtailing traffic congestion.
Evacuation Performance by Mix of Evacuee Behaviors
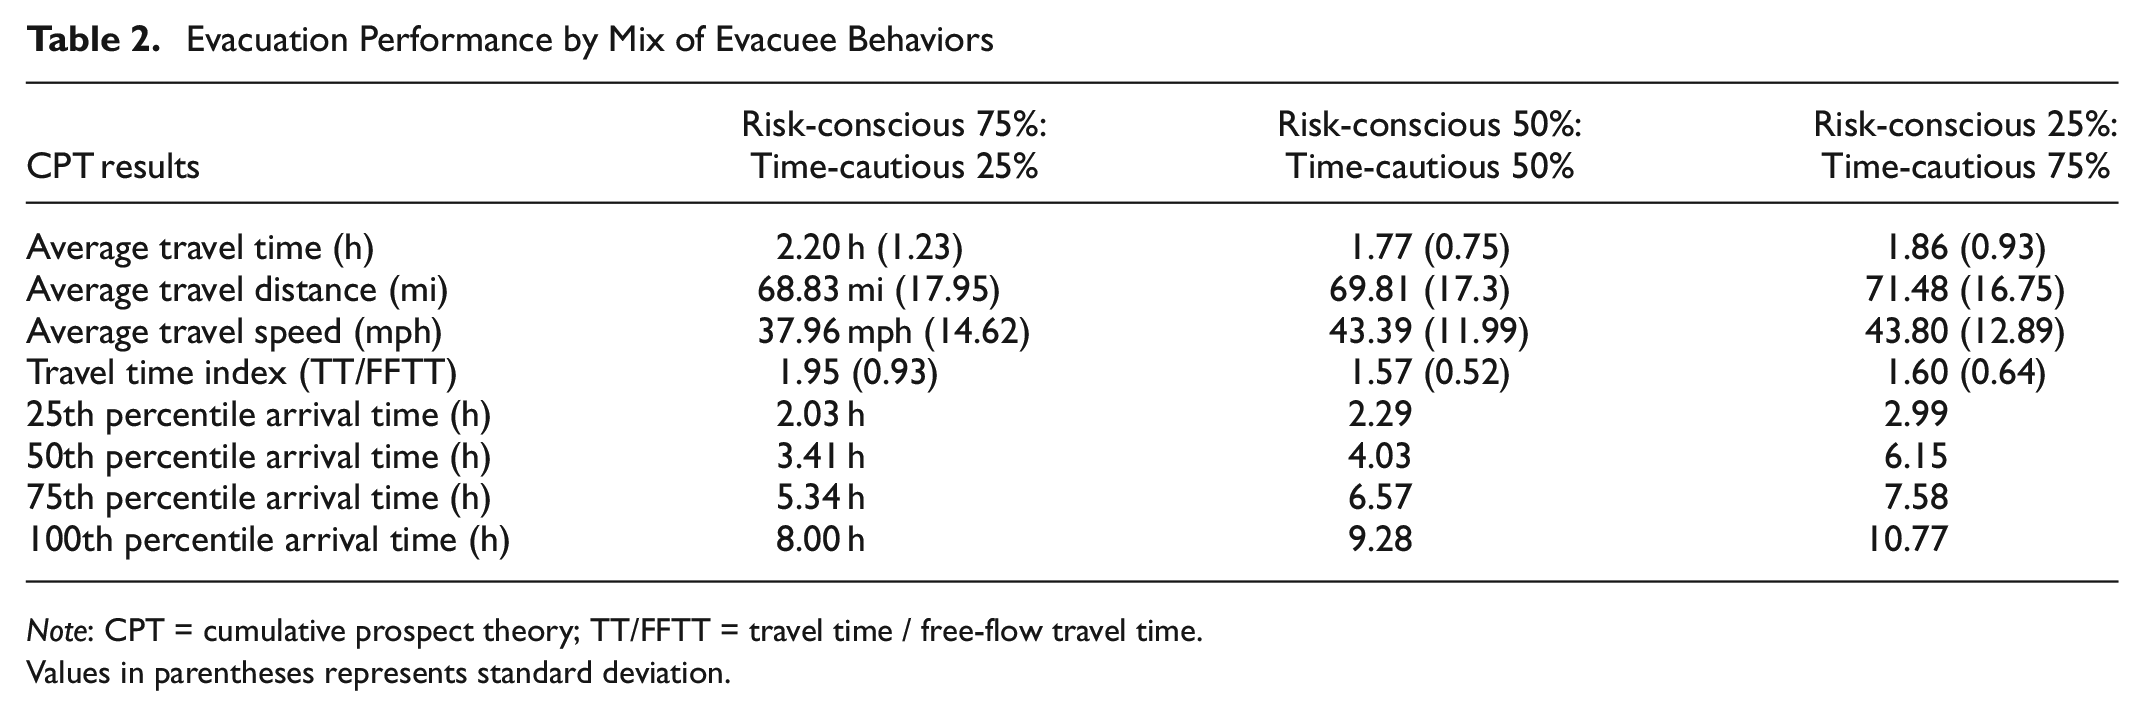
Note: CPT = cumulative prospect theory; TT/FFTT = travel time / free-flow travel time.
Values in parentheses represents standard deviation.
Figure 12 delineates the weighted VMT average across departure time intervals. Interestingly, all mixed configurations highlighted a trend in which those covering shorter distances initiated their evacuation earlier than those embarking on lengthier routes. Even though merging different evacuee behaviors improved traffic scenarios, there remained an underlying need for staggered evacuations, especially for prioritizing specific high-need evacuees, such as residents of Galveston Island who face the challenge of bridge crossing. Consequently, embracing a mixed evacuee setup complemented by binding evacuation mandates for certain high-priority groups could streamline evacuation processes while catering to those with the most pressing requirements.
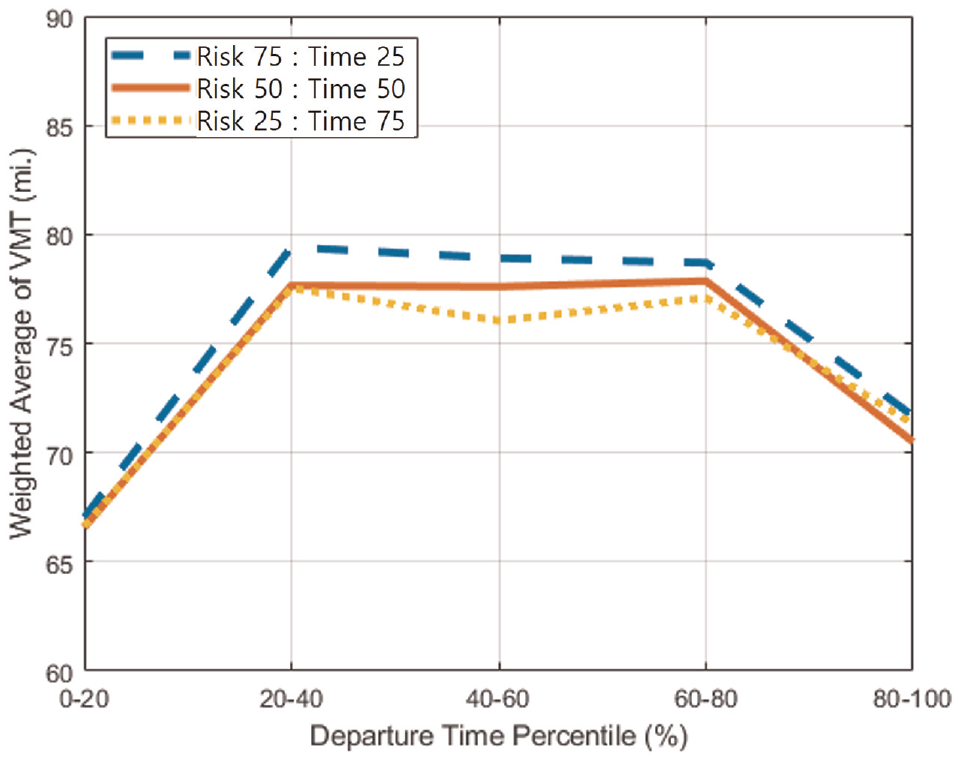
Departure time: VMT by mix of evacuee behaviors.
Comparison of CPT and MNL Choice Behaviors
This section contrasts the evacuation outcomes of the traditional MNL model with those of CPT. The analysis first formulates two MNL models representing risk-conscious and time-cautious behaviors, analogous to prior CPT specifications. A macroscopic decision analysis precedes a microscopic SUMO simulation.
Evacuation Modeling using MNL Model
MNL models are renowned in discrete choice analysis, affording a handy closed form for multiple choice scenarios ( 48 ). A 1999 survey, encompassing 1,029 respondents affected by Hurricane Bonnie in North Carolina, was employed to estimate evacuation travel time values ( 49 ). The survey collected data on each household’s evacuation behaviors, including destinations, distances traveled, and responses to hypothetical future hurricanes with varying storm intensities. The study focused on both revealed preferences (actual behavior during Hurricane Bonnie, with an average round trip distance of 178 mi for the 26% who evacuated) and stated preferences (hypothetical scenarios, averaging a 262-mi trip for those who would evacuate).
The mean and standard deviation of the respondents’ evacuation travel time values from that survey were adjusted to 2020 U.S. dollars, accounting for inflation, amounting to estimates of $97.65/h (mean) and $87.66/h (standard deviation). A study published in 2021, examining ordinary traffic conditions such as commuting, recreational travel, and errands, estimated the average value of travel time at $40.32/h ( 50 ). Considering the distinct nature of these scenarios compared with emergency situations, the evacuation value of travel time assumed in this paper was considered to be significantly higher, appropriately reflecting the urgency of emergency conditions.
The relationship between early and late arrival times is articulated in Equation 10, indicating that late arrival typically incurs a higher cost as a penalty for delay. In this equation, Small proposes the total travel cost (TTC) for regular commuting scenarios, not evacuations, factoring in the costs of early and late arrivals as well as the overall travel time ( 51 ). This study incorporated the value of evacuation travel time from the Hurricane Bonnie survey into a VOTT variable in Equation 10, and derived each resident’s evacuation costs based on the shortest paths from SUMO. The VOTT variable for each evacuee was derived from a normal distribution truncated at zero, based on the mean and standard evacuation travel time data from Hurricane Bonnie.
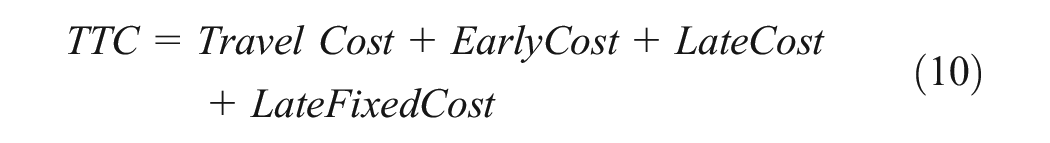
where
This paper aims to identify decisions that minimize overall evacuation costs by optimizing the utility expressions depicted in Equation 11. Although the parameters
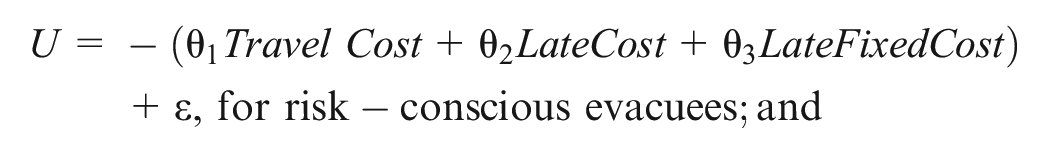
where
Simulation Results with MNL
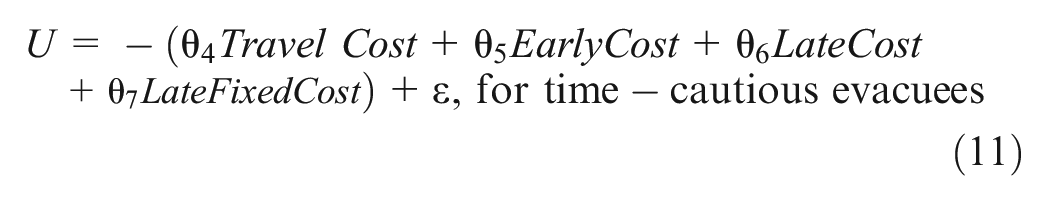
Figure 13 presents the simulation outcomes of the two MNL models. Specifically, Figure 13a indicates the MNL risk-conscious model’s convergence after 158 iterations, yielding a mean utility of −51, whereas Figure 13b shows the MNL time-cautious model’s convergence at 115 iterations with a mean utility of −73. The departure time distributions of these two MNL models, depicted in Figure 13, c and d , offer a point of comparison to the CPT models displayed in Figure 7. Distinct patterns emerged from both the MNL and CPT models: firstly, both exhibited a pronounced peak in the early phase of the 6-h duration (Figure 7a and Figure 13c), indicative of a preference for early arrival. Secondly, histogram bars waned after the 5-h mark (Figure 7b and Figure 13d), implying aversion to late arrival penalties in both time-cautious models.
Simulation results of two MNL models. (a) Risk-conscious MNL convergence, (b) Time-cautious MNL convergence, (c) Risk-conscious MNL departure time histogram, (d) Time-cautious MNL departure time histogram.
The MNL models depict more dispersed histograms than their CPT counterparts. In this study’s MNL model configuration, decisions were assessed without considering the probability of observing a specific travel time. This means evacuees might opt for high-performing yet improbable choices. Conversely, the CPT model did factor in the likelihood of travel times when assessing utility. Consequently, individuals weighed both outcome quality and its probability when deciding. This distinction suggests that the CPT model could potentially offer a more nuanced understanding of decision making than the MNL model in scenarios marked by uncertainty, like evacuations, although further validation with real-world data is necessary for a definitive conclusion.
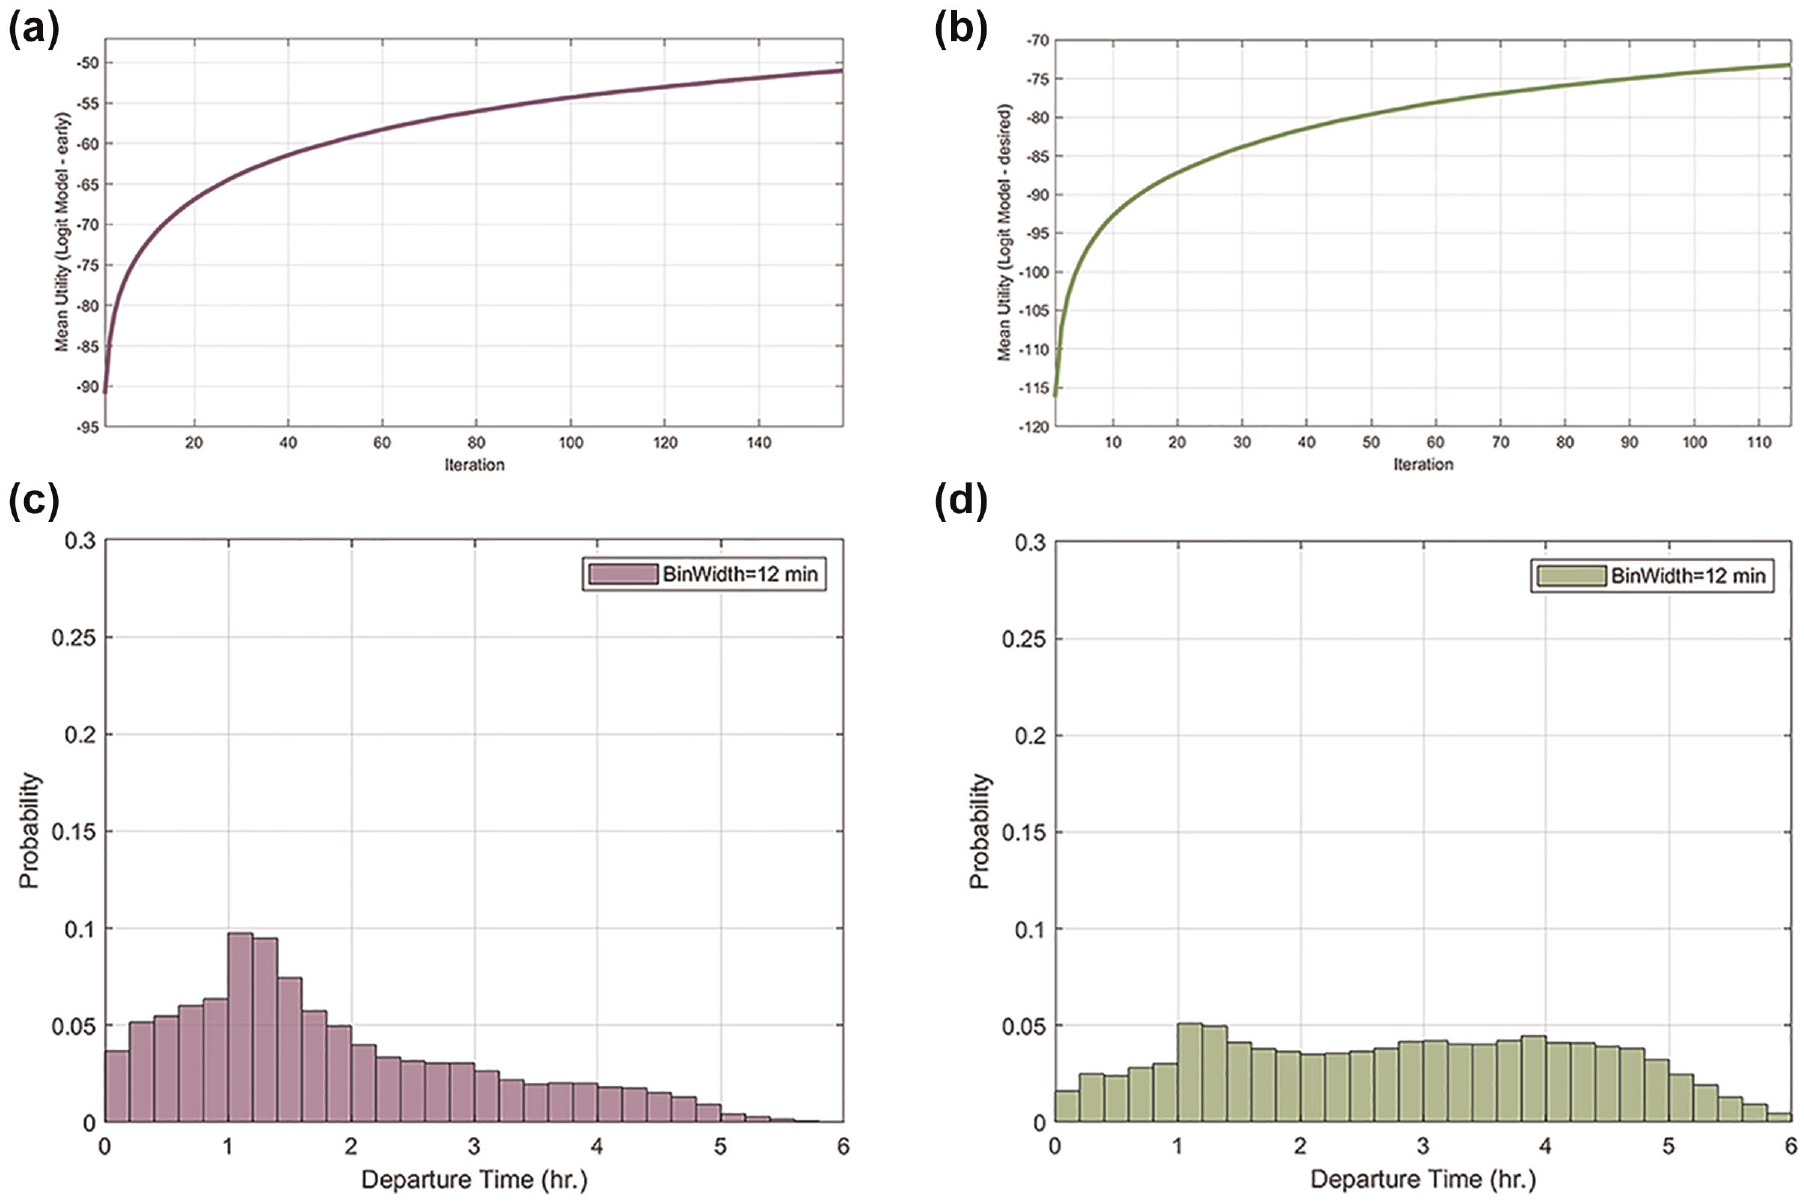
Figure 14 delineates departure timings and destination preferences by TAZ level. Direct comparisons can be drawn between Figure 14, a and b (MNL) and Figure 8, a and b (CPT). Notably, more coastal TAZs in the MNL risk-conscious model evacuated later than in the CPT equivalent. No staggered evacuation was observed in the MNL time-cautious model, contrasting with the CPT time-cautious model. In Figure 14a, residents proximate to Houston’s downtown, benefiting from shorter travel distances, departed within 1 h, whereas the majority residing further out delayed their departure. The destination choices in Figure 14, c and d (MNL), suggest evacuees favored nearer destinations compared with those in Figure 9, a and b (CPT). These TAZ-level findings indicated that the MNL models might be less predictive in certain aspects of evacuation modeling, given the less organized departure time schedules and heightened demand for specific destinations. Caution when in interpreting these results is therefore recommended.
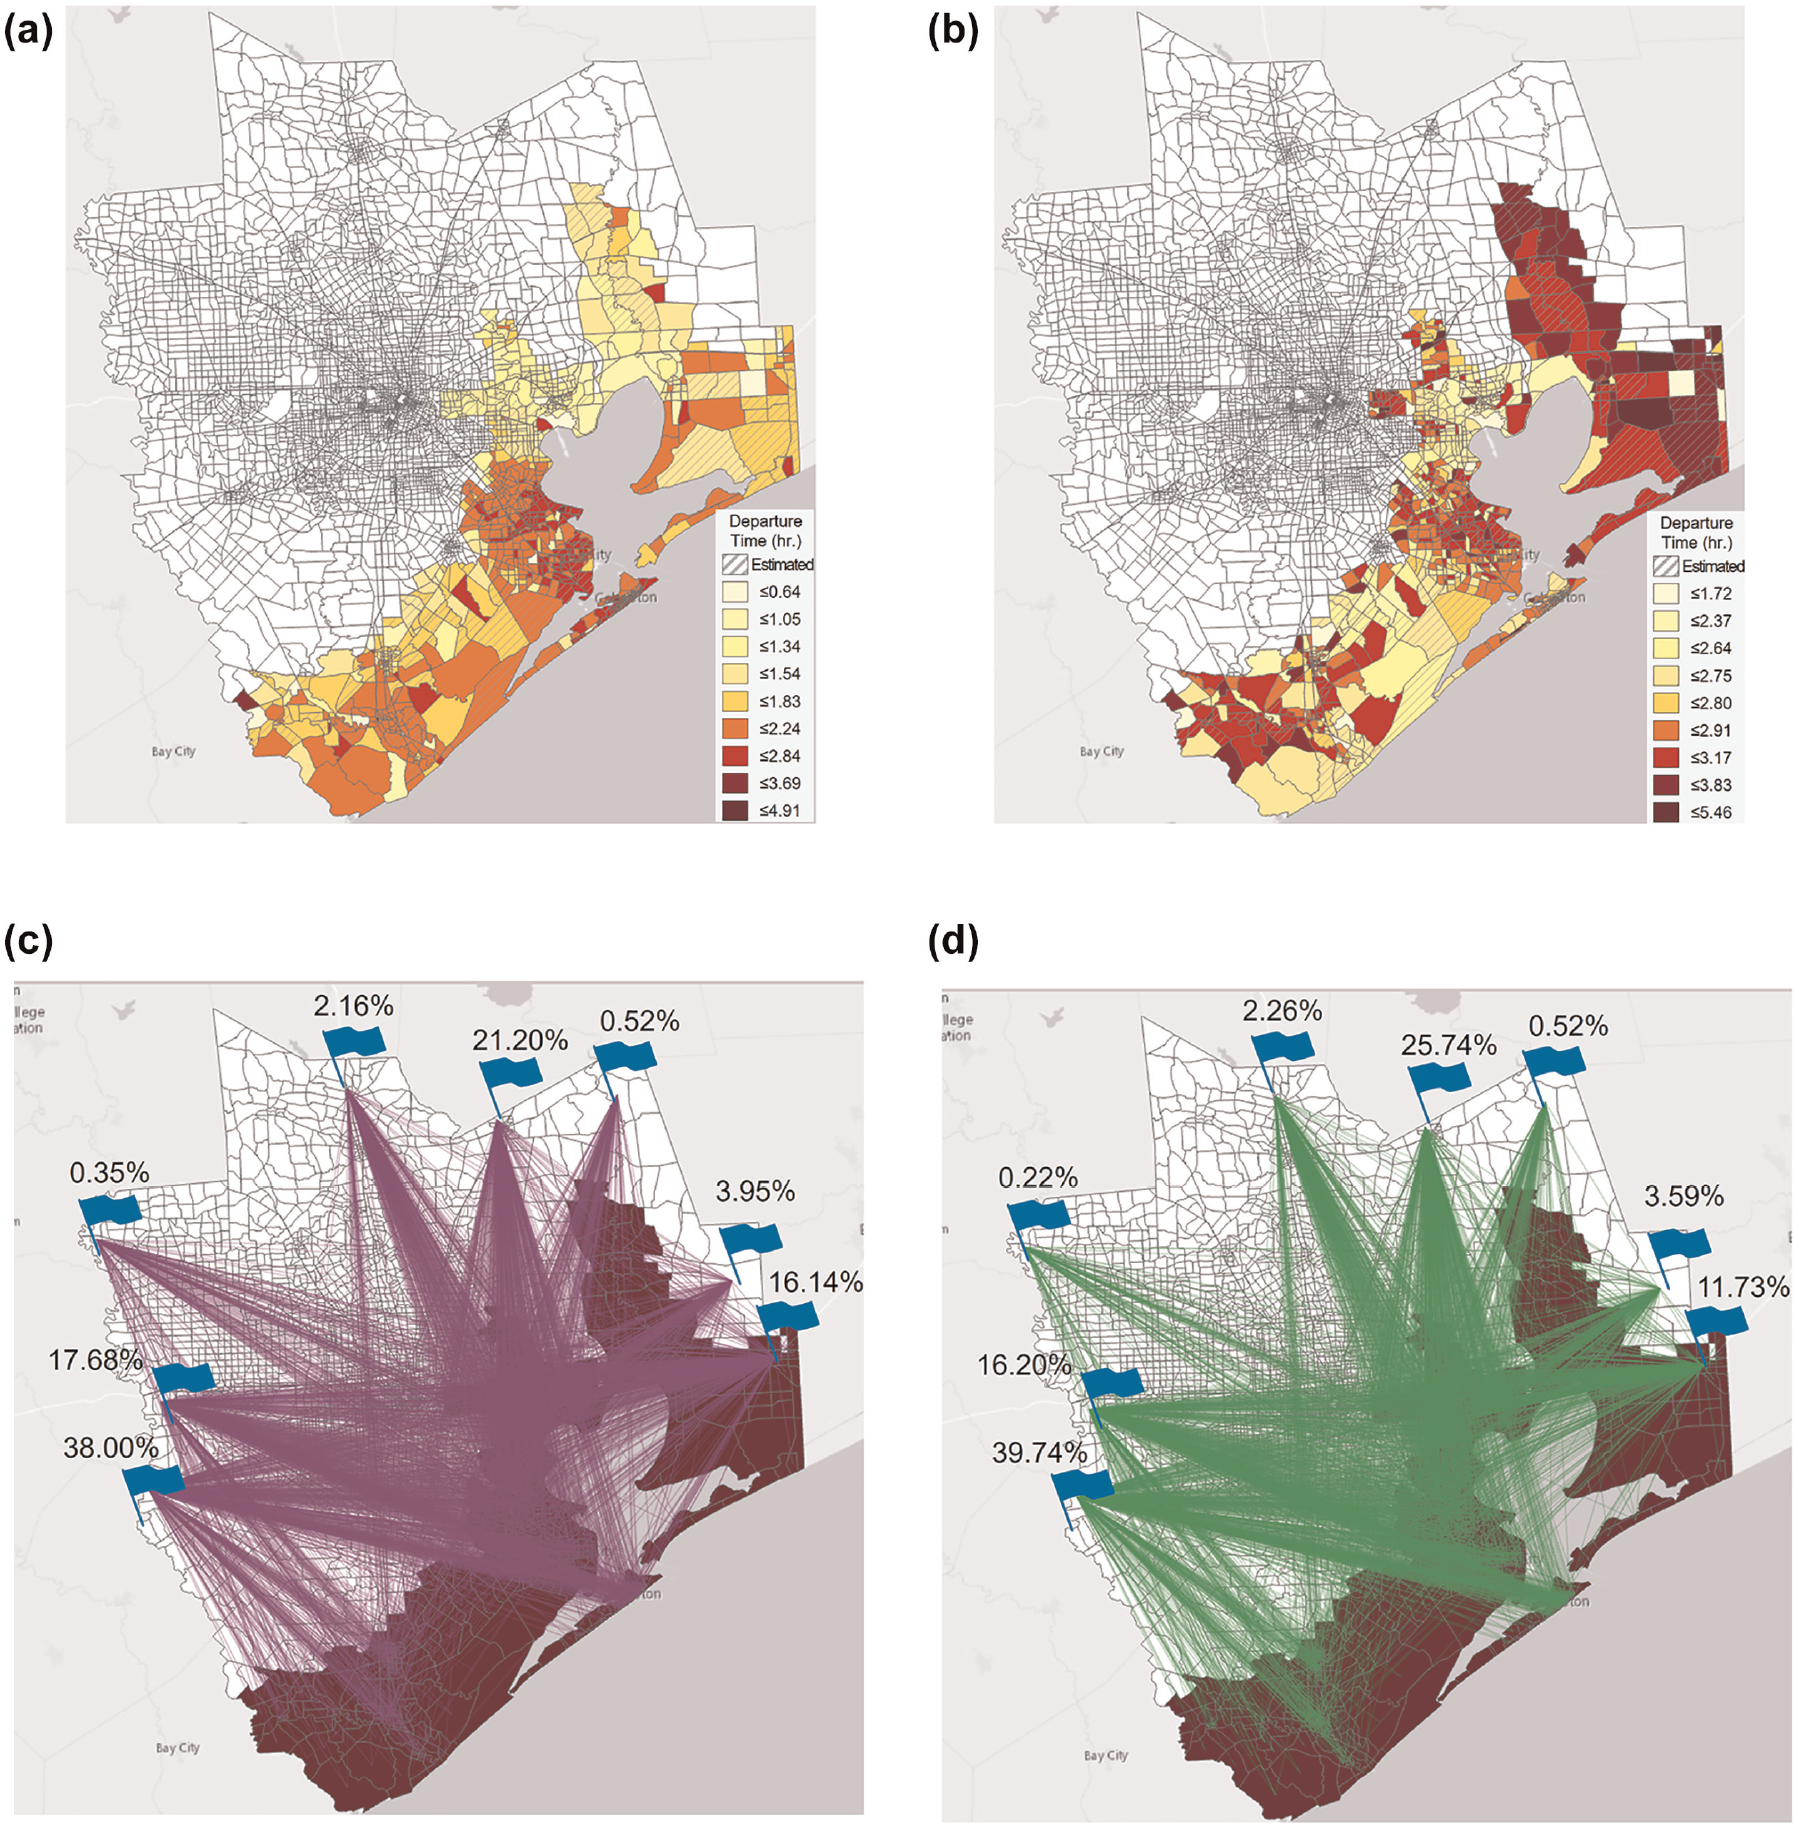
Departure time and destination choices of two MNL models. (a) Risk-conscious MNL departure time choices, (b) Time-cautious MNL departure time choices, (c) Risk-conscious MNL destination choices, (d) Time-cautious MNL destination choices.
Table 3 shows the microsimulation outcomes using a blend of the two MNL models, similar to Tables 1 and 2 (CPT). Contrasting the MNL and CPT results revealed the MNL simulations yielded longer travel times yet shorter distances, suggesting evacuees tended toward closer destinations, possibly at lower speeds. The percentile-based arrival times in the MNL models were also found to be less satisfactory when compared with the CPT models, further highlighting the MNL models’ inferior performance.
MNL Models’ Evacuation Performance by Mix of Evacuee Behaviors
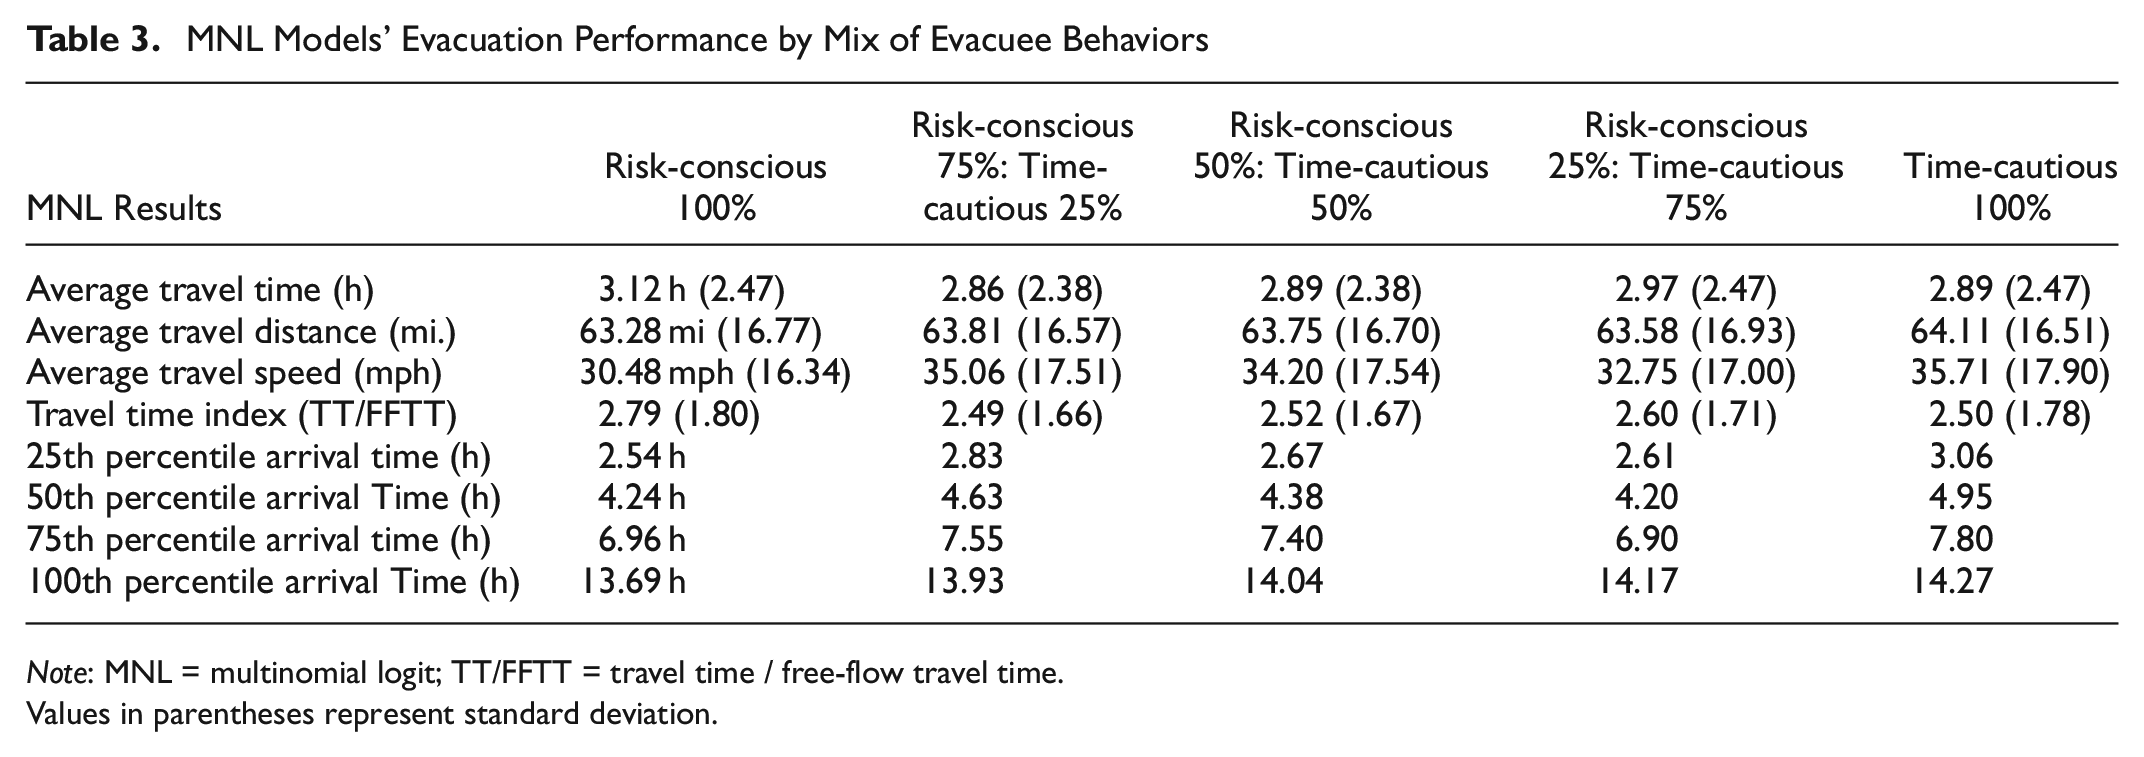
Note: MNL = multinomial logit; TT/FFTT = travel time / free-flow travel time.
Values in parentheses represent standard deviation.
Lastly, Figure 15 shows the departure-time-weighted VMT from the MNL models—mirroring Figure 11 (CPT). Unlike Figure 11b (CPT time-cautious model), both Figure 15, a and b (MNL), lacked the staggered evacuation pattern, revealing that evacuees with shorter VMTs (probably from inland areas) departed ahead of those with extended VMTs (likely to have been from coastal areas). In light of these findings, we concluded that the CPT model more accurately captured decision making under uncertainty in evacuation contexts, yielding improved evacuation outcomes and suggesting a possible preference for CPT in this case, though this preference is contingent on the context and the data available.
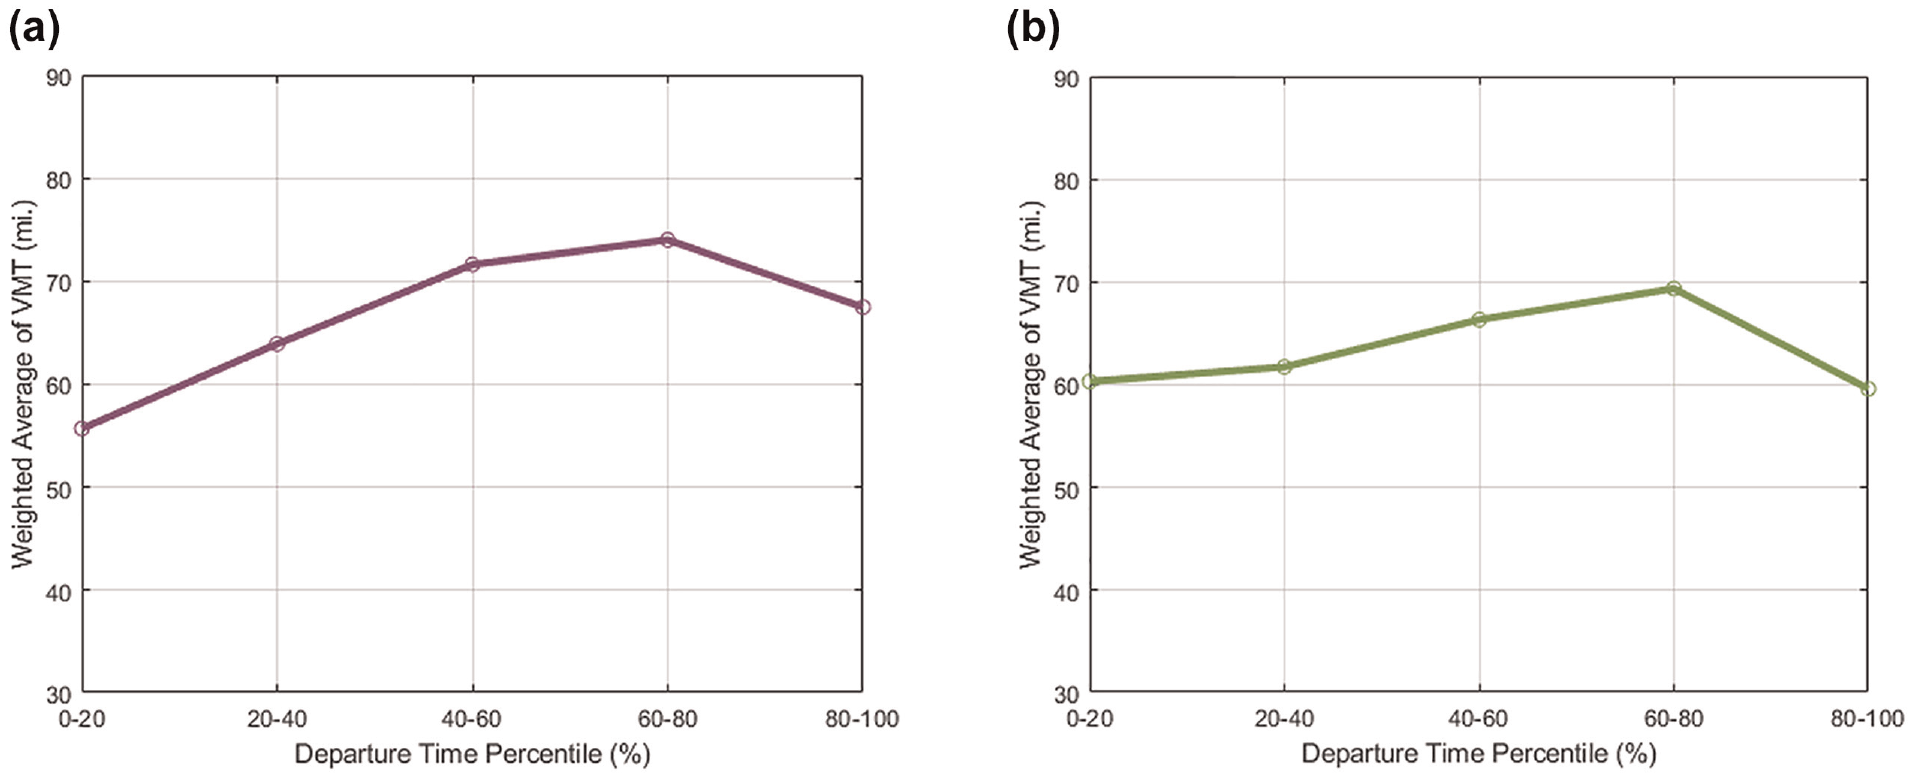
Departure time VMT for two MNL models. (a) Risk-conscious MNL, (b) Time-cautious MNL.
Discussion on Proposed MNL Model
In a standard MNL model, parameters
To explore the impact of varying the ratio of systematic utility to the Gumbel error term on the models’ outcomes, various risk-conscious MNL model scenarios were simulated. Here, the error term,
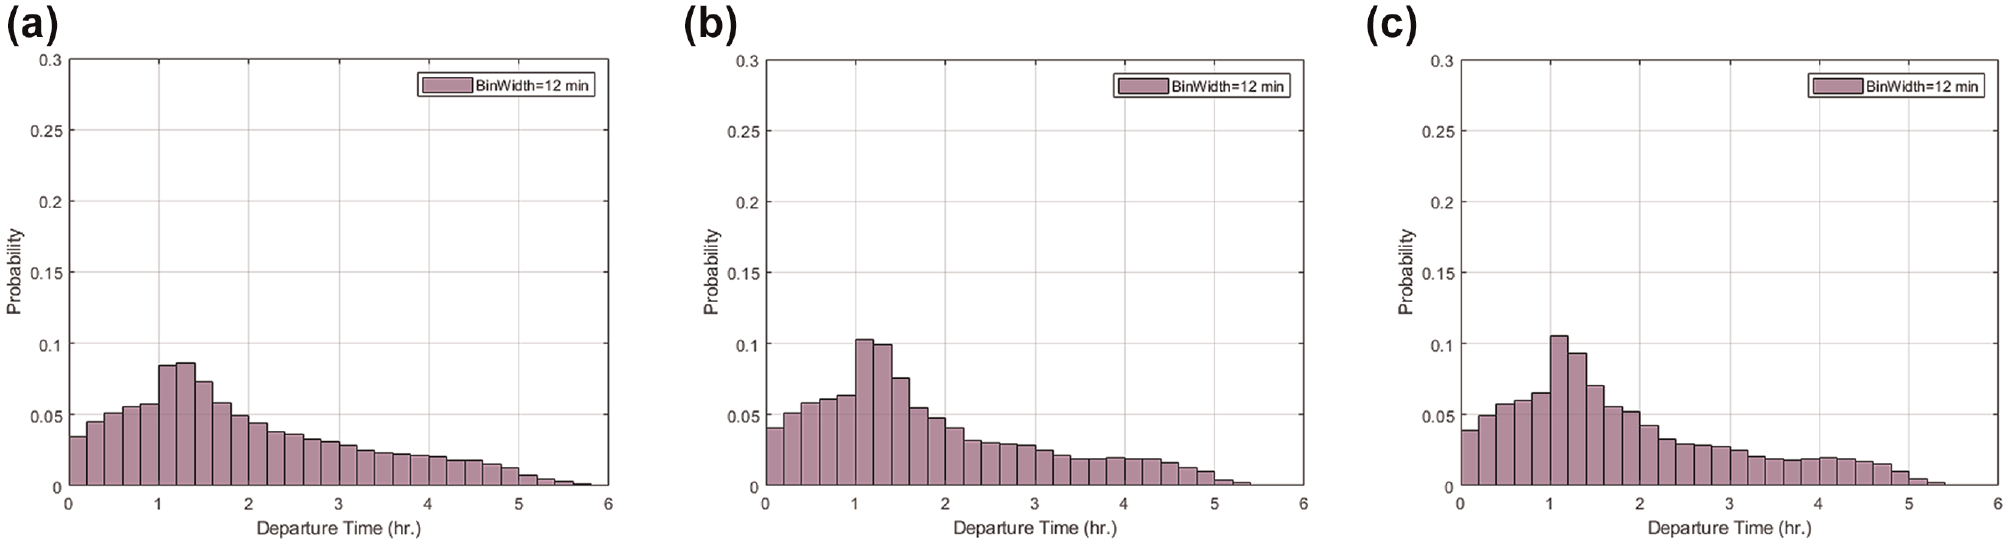
Departure distribution of various risk-conscious multinomial logit (MNL) models. (a) Gumbel being 20%, (b) Gumbel being 5%, (c) Gumbel being 1%.
This observation indicated that, regardless of the specific parameters in the MNL models, CPT might better represent individual decision-making in uncertain evacuation contexts, solidifying a preference for CPT over MNL.
Conclusions
This paper presents two behavioral models based on CPT, illustrating evacuee behaviors from Houston, TX, in anticipation of a hurricane. Both models evaluate the potential outcomes and their probabilities, providing insight into an evacuee’s decision-making amidst uncertainties. The risk-conscious evacuation model underscores a preference for early arrivals, whereas the time-cautious evacuation model emphasizes on-time arrivals. Each model optimizes departure times and destination choices, reflecting most probable evacuation decisions. Although evacuees within each model shared a unified decision-making framework, factors like origin location, local traffic conditions, and individual perceptions on timeliness led to varied choices.
The risk-conscious model’s departure distribution indicated a concentration within the initial 2 h of a 6-h window, with inland residents departing sooner. Conversely, the time-cautious model spread departures across the entire 6 h, with a reluctance toward the end to prevent undue lateness. In relation to spatial choices, those near the Gulf of Mexico’s coastline evacuated sooner, indicating a staggered approach prioritizing distant residents. Destination choices highlighted risk-conscious evacuees favoring nearer locations, and time-cautious evacuees preferring areas that were further inland. Considering the concurrent modeling of both time and destination, the risk-conscious model’s concentrated departures led to heavy traffic, deterring distant choices. However, as the time-cautious model dispersed departures, favorable traffic ensued, encouraging distant evacuations. Areas that are further inland present notably greater safety from hurricanes.
An agent-based simulation was employed to monitor each evacuee’s decisions. The risk-conscious model demonstrated lengthier travel and more congestion, but its evacuees reached their destinations earlier owing to premature departures. Although prolonged road time might be unfavorable, staying home longer undertaking preparations has benefits. However, early destination arrivals are advantageous given the potential hazards. In the risk-conscious model, long-distance travelers lost early departure advantages to those traveling shorter distances. The time-cautious model exhibited staggered evacuations based on travel distance.
Simulations blending both evacuee types were conducted to gauge the effects of varied configurations. The 50/50 risk-conscious and time-cautious mix produced optimal travel times and traffic conditions, suggesting that a mixed evacuee configuration could enhance evacuations. Nevertheless, shorter-distance travelers still left earlier across all mix scenarios. Implementing regulations, like mandatory evacuation orders prioritizing the most vulnerable, could complement mixed evacuation strategies.
Whereas the CPT model showed promising results in capturing decision making under uncertainty, it appears to have certain advantages over the MNL model in this context. The CPT model incorporated both the potential outcomes and their likelihood, offering a more comprehensive view of decision-making processes. In contrast, the MNL model primarily focused on decision performance without accounting for the probability of outcomes. This difference could lead to scenarios in which MNL model predictions favored higher-reward- yet less likely choices, which could affect the model’s effectiveness in realistically simulating evacuation behaviors compared with the CPT model. However, it is important to note that each model has its merits and limitations, and the choice between them should be based on the specific requirements of the study and the availability of data.
This study’s findings could aid in predicting departure and destination choices for different agents and assist in evaluating diverse evacuation scenarios, examining their infrastructural impacts. However, the study mainly factors in travel and arrival times. Real-life determinants like family members’ locations, disaster nuances, and varied evacuation resources, remain outside the scope of this analysis.
Limitations
The results presented in this paper offer a significant advancement in understanding evacuation decision-making processes using CPT and MNL models. Despite its contributions, it is important to acknowledge several limitations that point toward areas for future research and improvement.
One limitation is the lack of focus on vulnerable populations. Vulnerable groups, such as individuals with disabilities and nursing home residents, have unique evacuation needs and behaviors that were not addressed in this research. This omission highlights a gap in evacuation planning, underscoring the necessity for future studies to concentrate on these groups to ensure that evacuation strategies are comprehensive and inclusive.
Another aspect is the influence of various information sources on evacuation decisions. Whereas this paper primarily assumes that decisions are influenced by official evacuation notices and technical assessments from authorities, evacuees’ choices may also be significantly affected by other channels of information. These include social media, personal networks, and individual past experiences. Understanding the role of these diverse information sources is crucial, as they could have a profound impact on evacuation behavior. Future research should delve into this aspect to gain a more holistic view of the factors influencing evacuation decisions.
The reliance on simulated data is another limitation of this paper. Although the CPT and MNL models provide theoretical insights, their predictive accuracy and applicability in real-world scenarios need validation with actual evacuation data. This validation is critical to confirm the models’ effectiveness and to ensure that the theoretical findings are grounded in practical, real-world applications.
The paper’s focus on the Houston, TX area also raises questions about the generalizability of the results. Different regions may exhibit varied evacuation behaviors owing to diverse geographic, socioeconomic, and cultural contexts. This geographic limitation suggests that the findings may not be directly applicable to other regions without considering these regional differences.
Lastly, it is important to note that the paper, while offering a theoretical exploration of evacuation decision-making, may simplify the actual complexity of these decisions. Real-world evacuations involve a multitude of variables and personal circumstances that may not be fully captured by the theoretical models used in this research.
In conclusion, addressing these limitations in future studies will significantly enhance our understanding of evacuation processes. By expanding the scope of research to include a broader range of factors and populations, and by validating theoretical models with real-world data, more effective, inclusive, and accurate evacuation planning and management can be expected.
Footnotes
Acknowledgements
The authors thank Jade (Maizy) Jeong of The University of Texas at Austin for her excellent editing and administrative support. The authors acknowledge the Texas Advanced Computing Center at The University of Texas at Austin for providing high performance computing resources that contributed to the research results reported within this paper.
Author Contributions
The authors confirm contribution to the paper as follows: study conception and design: J. Lee, K. Kockelman; data collection: J. Lee; analysis and interpretation of results: J. Lee, K. Kockelman; draft manuscript preparation: J. Lee, K. Kockelman. All authors reviewed the results and approved the final version of the manuscript.
Declaration of Conflicting Interests
The authors declared no potential conflicts of interest with respect to the research, authorship, and/or publication of this article.
Funding
The authors received no financial support for the research, authorship, and/or publication of this article.
The ChatGPT 4.0 AI language model was utilized to improve the paper’s English grammar and fluency; however, the authors maintained the integrity of the original content, ensuring that responsibility for the original content, ideas, data, findings, and scientific validation rests solely with the authors.