
Abstract
The prevalent method for assessing the forces on a restrained occupant during a collision involves evaluating the restraining forces as the body decelerates in what is known as the occupant load criterion (OLC) model. This model quantifies the restraining forces on frontal occupants during vehicle deceleration in frontal crashes. The original OLC model features a single mass representing the occupant connected to the vehicle via a spring with constant stiffness. The original OLC model assumes that no force is applied to the occupant until the restraint reaches a specified relative distance (slack length). Then, a constant force is applied until the occupant reaches the maximum restraint length. However, the original model neglects the forces on the occupant during the initial collision phase that result from factors like seatbelt slack, elasticity, occupant characteristics, and restraint system delays. This article proposes a time-dependent OLC model that utilizes a standard linear solid (SLS) model to incorporate creep and stress relaxation. Unlike the ideal restraint assumption in the original model, the proposed model can address nonlinear interactions between occupants and restraints. Spring and damper coefficients in the SLS model were calibrated using New Car Assessment Program (NCAP) frontal crash test data for four-door sedans. The coefficients determined for this vehicle class could be used to predict the peak chest forces applied by the restraint system to within an average of 10% of measured values.
Keywords
Accident reconstruction plays a vital role in understanding and analyzing the dynamics of vehicular crashes. During a vehicle crash, occupants are subjected to various forces and loads that can cause injuries. By accurately predicting these loads, researchers and engineers can design and optimize safety systems such as seat belts, airbags, and vehicle structures to provide better protection for occupants. Additionally, this knowledge can help in the development of safety standards and regulations to ensure the overall safety of vehicles. Occupant loads during a crash are influenced by various factors, including vehicle kinematics, crash severity, occupant positions, restraint systems, and vehicle structural characteristics. Traditional models for predicting occupant loads often rely on simplified assumptions and idealized scenarios, which may not accurately represent real-world crash conditions. In recent years, the introduction of the occupant load criterion (OLC) has significantly enhanced the accuracy and reliability of occupant load assessment.
The crash pulse is an acceleration curve that is measured in the car during a crash and can identify the loads transferred to the occupant. The severity of an impact can be analyzed and measured by different crash pulse criteria. By applying simplified mechanical models, the amount of restraining force that is transformed into the occupant’s chest can be measured. This method can be utilized to determine OLC. Accordingly, OLC is based on the measurement of the restraining force applied to the occupant’s chest and assumed to be constant over the duration of deceleration ( 1 , 2 ). The restraint system is assumed to have two boundary lengths: the slack length L0 and the maximum restraint length L1, with corresponding times t0 and t1. OLC is then defined as the acceleration experienced by the occupant as a result of force application from the restraint system between these two times and is assumed to be a constant value.
While OLC provides a simple metric that can be related to occupant injury risk, to accurately predict the occupant kinematics and injury risk during a crash, the full crash pulse needs to be considered, as opposed to focusing only on single measurements such as the peak or average acceleration ( 3 , 4 ). Prior work observing crash pulse parameters has correlated crash testing with the real-world head, neck, and chest injury risk because of intrusions and interactions with the restraint system ( 2 , 5–9) and determined the optimal crash pulse shapes and vehicular structural properties that would minimize injury risk ( 10 , 11 ). Previous research has also found that the application of a constant force to the occupant by the seat belt is optimal for minimizing the risk of thoracic injuries ( 12 – 14 ); while using the OLC to predict thoracic injury risk is consistent with this optimal scenario, additional crash pulse factors need to be considered to predict head, neck, and chest injury risk ( 3 , 4 , 15 , 16 ).
The original OLC model also assumes that because of the seatbelt slack distance and the elasticity of the seatbelt, the force on the occupant’s chest in the first phase of the collision is negligible; the occupant is essentially treated as being unrestrained until the relative displacement between the vehicle and the occupant reaches time t0. At this point, the force applied to the occupant by the restraint reaches a constant value until the relative distance between the occupant and the vehicle reaches the maximum restraint length at t1 ( 1 , 2 ). This behavior is represented by a simple mechanical model in the original OLC model, which includes a mass (occupant) linked to a spring with a constant stiffness. To simplify the model and because of the low crash force during the seatbelt slack length, the restraining force in the original OLC model is set at zero during the initial phase. The restraining force is applied to the occupant from when the relative distance between the vehicle reaches the restraint slack length of 65 mm until this distance reaches the maximum restraint length of 300 mm ( 1 ).
OLC has been correlated with multiple vehicle crash pulse metrics, such as the maximum vehicle acceleration, moving average acceleration, time to zero velocity, and maximum dynamic displacement ( 1 , 8 ). This metric, however, has shown insignificant linear relationships with occupant injury responses, including the head injury criterion (HIC15), peak chest acceleration, and peak chest deflection ( 8 ), because of its ideal constant deceleration assumptions described above. Expanded research into this specific topic has determined an “improved OLC” metric, OLC++, which consists of combinations of OLC and vehicle crash-pulse measures such as time to zero velocity ( 16 ); however, this criterion still correlates weakly with the real-world injury risk factors mentioned above ( 8 , 16 ).
Another recent improvement for predicting the occupant load called the real occupant load criterion for prediction (ROLCp), considers vehicle pulse data along with more detailed restraint system properties ( 17 ). ROLCp uses predictive methods to more accurately determine the starting and ending points of force application by the restraint, and it can predict the maximum chest acceleration more accurately than OLC++, OLC, or any of the vehicle pulse metrics described above. While ROLCp greatly increases the accuracy for predicting maximum chest acceleration and its related injury risk, it still suffers from the same limitation as prior OLC models: it assumes that the occupant–restraint interaction is a simple spring–mass system and does not account for any time-dependent interactions between the occupant and the restraint.
While metrics such as OLC, OLC++, and ROLCp produce single, easily interpreted values representing the constant deceleration of an occupant during a crash, they do not account for time-dependent characteristics of the interaction between the occupant and the restraint. The time-dependent developed model can represent the real-time actual loads applied to the occupants of vehicles equipped with seatbelt pretensioners and load limiters that would affect the initial slack length. The model, therefore, can be developed to analyze the performance and the types of pretensioners and load limiters. As such, the objective of this study is to quantify the spring and time-dependent damper parameters required to model the realistic accelerations and loading rates occupants may experience during a frontal collision; the results will consist of a set of applicable spring and damper coefficients that may be utilized to determine peak occupant accelerations and loading rates in the absence of restraint length assumptions.
The methods described in this article focus on developing the OLC lumped element model by taking into account the complexity and dynamic nature of crashes, considering factors such as vehicle kinematics, crash severity, and occupant position. These methods of describing occupant–restraint interactions could also provide a framework for reconstructing the actual loads experienced by vehicle occupants during the crash, leading to more accurate and reliable results. Specifically, with established literature describing how the interactions of occupants with restraint systems cannot be described as simple linear spring systems ( 13 , 18 ), different mechanical representations of the occupant–restraint interaction during a crash are necessary to provide more accurate injury risk predictions. This enhanced accuracy allows for a better understanding of injury mechanisms and helps identify potential injury risks. The results can also serve as a validation tool for computational models used in accident reconstruction. Common accident reconstruction software in the market do not use Finite Element Analysis (FEA) computational simulation in their analyses. Therefore, a model that could provide more realistic occupant data could be beneficial in investigating the forces and motions occupants experience during frontal collisions. Finally, by incorporating real occupant load criteria, safety standards can be more closely aligned with the actual crash conditions, leading to improved occupant protection.
As explained above, OLC and its more recent improvements have attempted to describe occupant injury risk during a crash, but these methods sacrifice accuracy for simplicity. Published studies discussed earlier found that constant occupant deceleration during a frontal crash is ideal for minimizing injury risk, and they approached vehicle design around reaching this desired occupant acceleration. While the scenario of constant deceleration is ideal, it does not currently reflect real-world occupant motion, and therefore this realistic occupant motion cannot be precisely described with simplified metrics such as OLC; a more accurate metric for determining occupant loading is necessary for predicting real-world injury risk. The purpose of this study is to take the first step toward establishing an improved method related to the occupant load criterion by describing the nonlinear interactions between occupants and the restraint system.
Methods
Dummy–Restraint Interface Modeling
The interaction between the dummy and the restraint was modeled using a standard linear solid (SLS) model (Figure 1). Specifically, the Kelvin representation was selected, which consists of a spring (KS) in series with a parallel spring (KP) and damper (C).
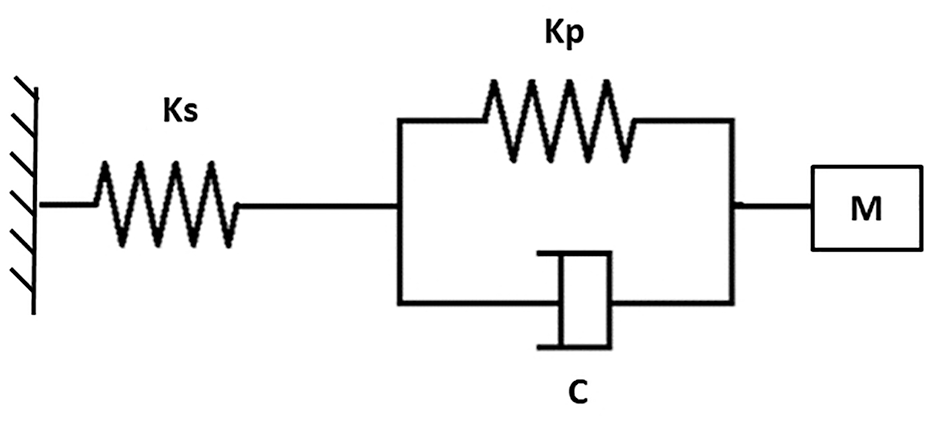
Diagram of the standard linear solid model used to describe the dummy–restraint interface as the dummy moves relative to the vehicle. KS and KP represent the coefficients of series and linear springs, respectively (expressed in kN m−1), C represents the damper coefficient (kN s m−1) in parallel with KP, and M is the mass of the dummy.
While prior research observing occupant–restraint interactions has considered a Maxwell model (spring and damper in series) ( 13 ), this method is unable to describe creep. Similarly, a Kelvin–Voight model (a spring and damper in parallel) was not used because of its inability to account for stress relaxation. The SLS model, on the other hand, is more suitable for systems where deformation asymptotically approaches a maximum limit. Finally, the SLS model consisting of a spring in series with a parallel spring and damper can more accurately describe both the viscoelastic properties of the occupant (like the parallel spring and damper) and the primarily elastic properties of the restraint system (like the series spring). Therefore, this version of the SLS model is the simplest model that can include the properties of both the occupant and the restraint while describing their interaction during a crash.
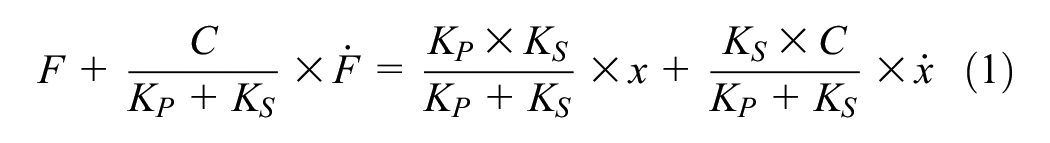
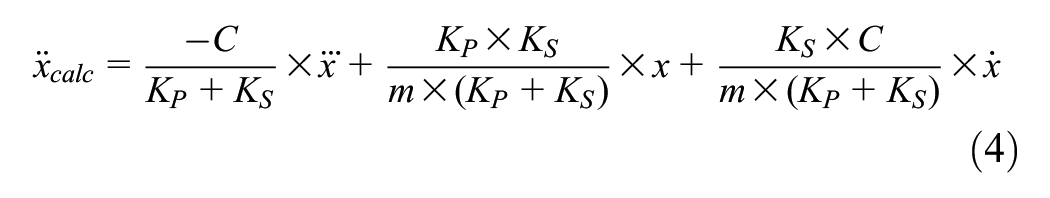
The force (F) and displacement (x) in the SLS model can be described using the given spring and damper coefficients shown in Equation 1, where F and x are functions of time. Using Newton’s second law (Equation 2), this model can be fully described using the displacement (and its derivatives with respect to time) and the mass (m) of the anthropomorphic test device (ATD) along with the spring and damper coefficients described above (Equation 3).


where
F = force (kN)
C = damper constant (kN s m−1)
KP = parallel spring coefficient (kN m−1)
KS = series spring coefficient (kN m−1)
m = mass (kg)
x = displacement (m)
Data Collection
This study observed ten NHTSA (National Highway Traffic Safety Administration) New Car Assessment Program (NCAP) frontal barrier impact tests for imported four-door sedans with model years ranging from 2014 through 2022 ( 19 ). Each test involved crashing a vehicle moving at approximately 56.3 km/h (35 mph) to determine crashworthiness and occupant restraint system performance. Two ATDs were placed in each vehicle: a fiftieth-percentile male Hybrid III dummy was located in the driver’s seat, and a fifth-percentile female Hybrid III dummy was placed in the front passenger’s seat. Both of the ATDs were equipped with triaxial accelerometers and load cell transducers. Additionally, each test vehicle was instrumented with triaxial accelerometers, and the tests were documented using high-speed and real-time cameras.
Each NCAP test collected accelerometer data at either 10 or 20 kHz, starting at 50 ms before impact and ending at 300 ms after impact. Because the data collected for each trial consist of the same outputs (i.e., accelerometer and motion capture data), the findings for each trial are directly comparable with each other. The chest acceleration for the fiftieth-percentile male ATD and vehicle acceleration from a rear-seat cross member, both in the global x direction (i.e., the initial direction of travel of the vehicle), were used for analysis and observed from the time of impact until 150 ms after impact.
Data Analysis
All data analysis was performed using a Python script. First, a fast Fourier transform (FFT) and power spectrum analysis were performed on both the chest and vehicle accelerations. Consistent with prior research, the accelerations were then filtered using a fourth-order low-pass Butterworth filter with a 20 Hz cutoff frequency (
20
). The displacement and velocity of the vehicle and the ATD were determined via integration and plotted for comparison with existing literature (
1
). Finally, the displacement and velocity of the ATD relative to the vehicle (i.e.,
To determine the best-fit spring and damper coefficients for each vehicle, an optimization algorithm was utilized to independently vary the damper and both spring coefficients across a wide range of possible values, using the known displacement, velocity, and jerk arrays to calculate the acceleration for each set of inputs (
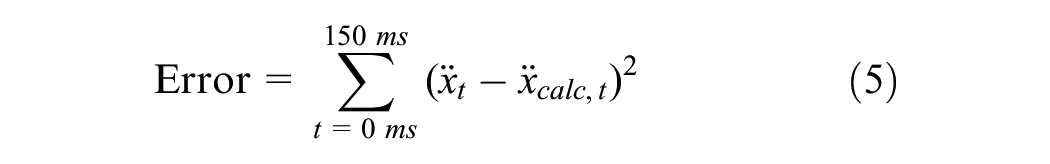
The optimized spring and damper coefficients were validated by comparing peak-modeled dummy accelerations with the actual peak accelerations for each trial, and the average coefficient values across the full sample were also used to calculate the peak accelerations for each trial. Comparing peak accelerations within each trial demonstrates the accuracy in describing the dummy–restraint interaction with the SLS model described above, while comparing peak accelerations using the average of the best-fit values provides insight into how applicable the values are within a class of similar vehicles.
Results
Complete sets of ATD and vehicle accelerations and their derived measurements were collected and processed for the desired 150 ms observation window for each NCAP frontal barrier impact test. Example plots of filtered data for vehicle and ATD displacements and velocities are shown in Figure 2. These results are consistent with those demonstrated in prior research ( 8 ). The best-fit KS, KP, and C values for each test, as well as the average values for the study population, are shown in Table 1, which indicates average best-fit values of 395 kN m−1, 57.7 kN m−1, and 4.55 kN s m−1, respectively.
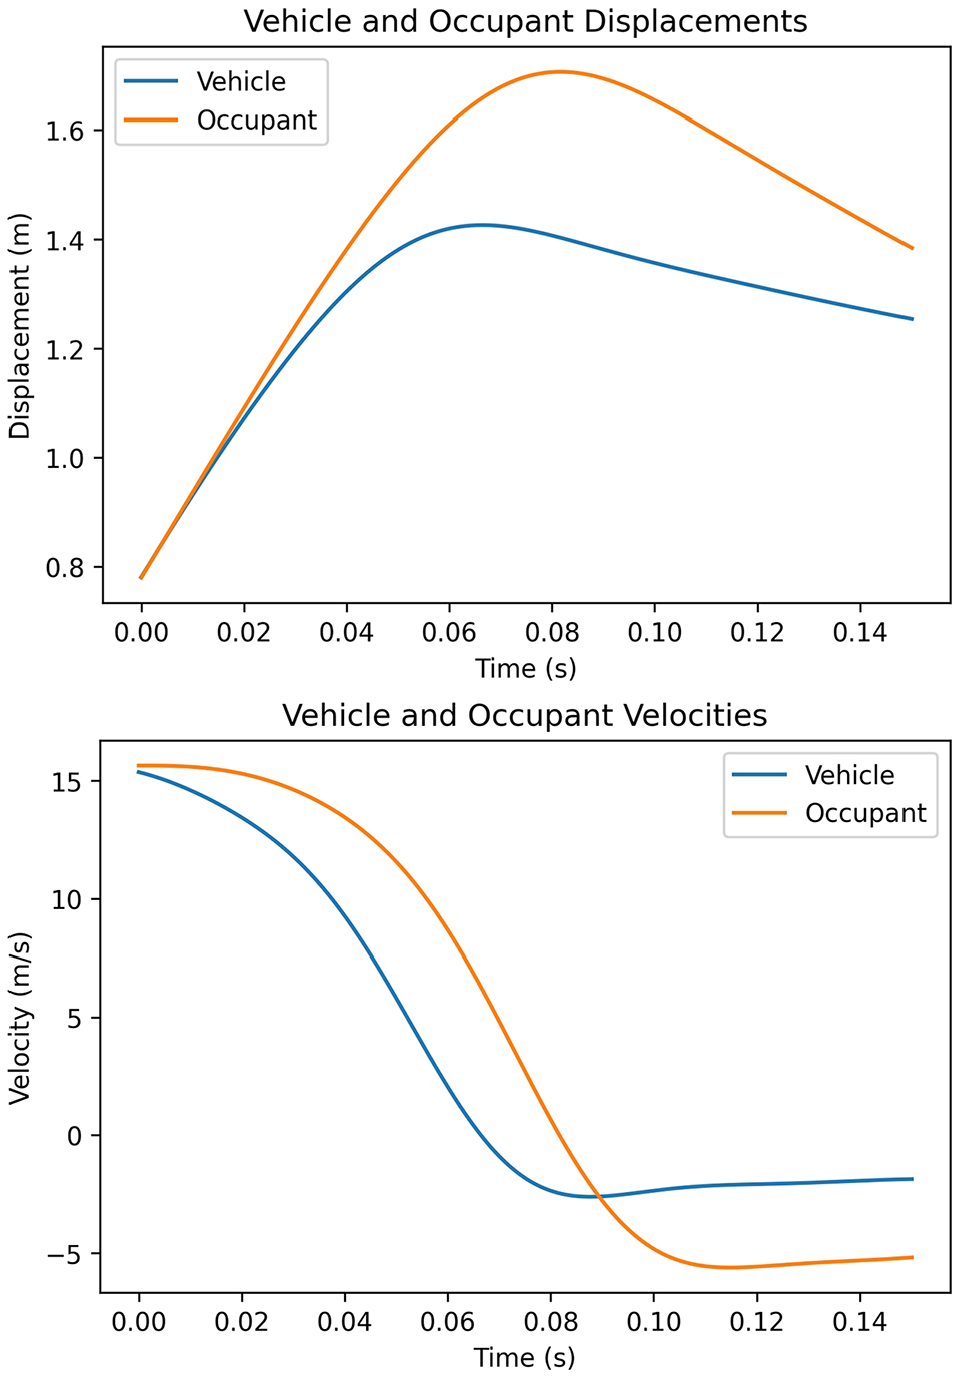
Example plots of vehicle and chest displacements (top) and velocities (bottom) for the 2017 Hyundai Elantra crash test. The data have been filtered at 20 Hz and trimmed so that t = 0 s indicates the initial impact between the vehicle and the barrier and t = 0.15 s indicates the end of the observation window.
Best-Fit C, KS, and KP Values for Each Vehicle, Along with the Mean and Standard Deviation for the Sample
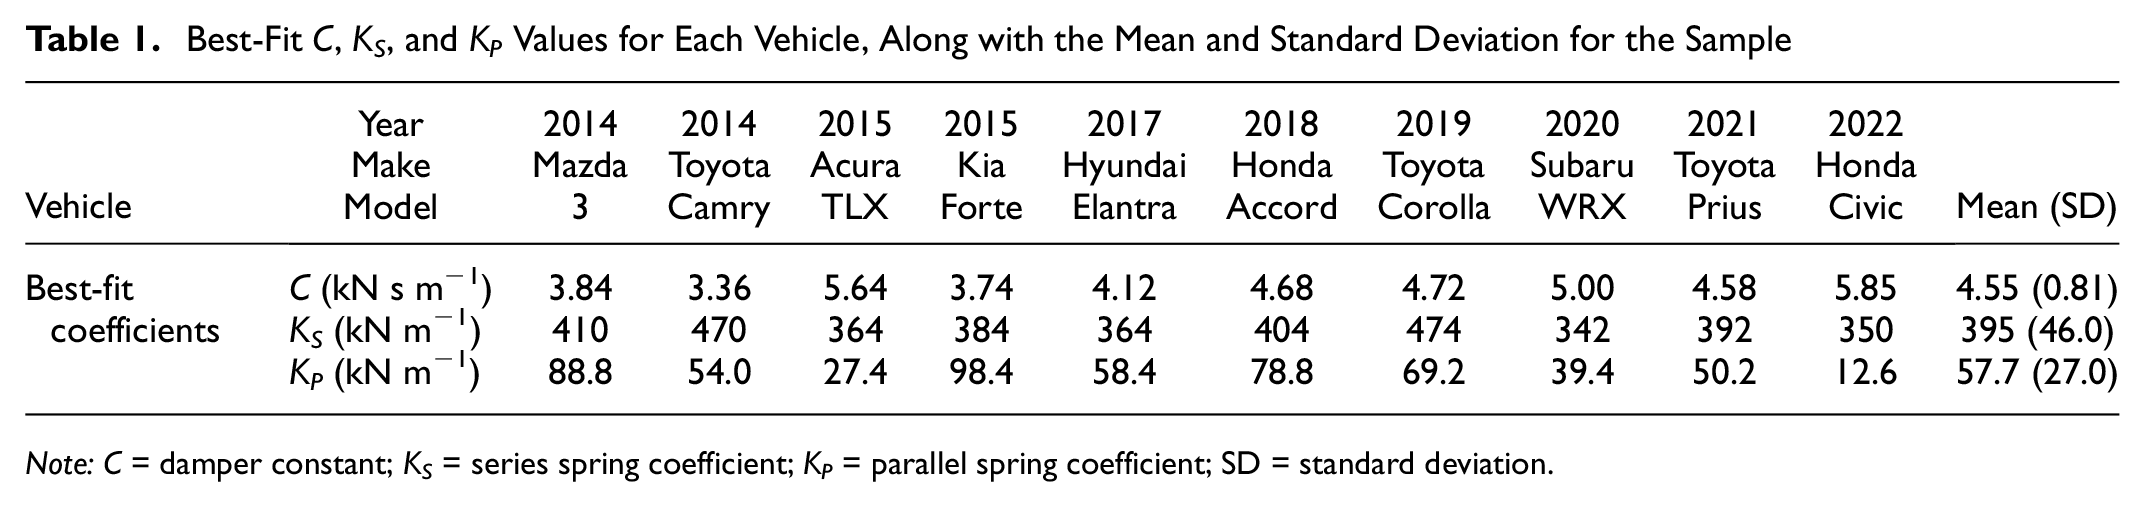
Note: C = damper constant; KS = series spring coefficient; KP = parallel spring coefficient; SD = standard deviation.
Modeling the ATD–restraint interaction allowed the calculation of the peak ATD acceleration to within an average of 5 percent of the measured peak (Tables 2 and 3), while the average of the best-fit coefficients predicted peak accelerations to within less than 10 percent of their measured values. As shown in Figure 3, the modeled acceleration curves approximately match the overall shape and peak acceleration values, with the actual peak acceleration being in between the best-fit and average modeled values.
Chest Acceleration Values for Each Trial
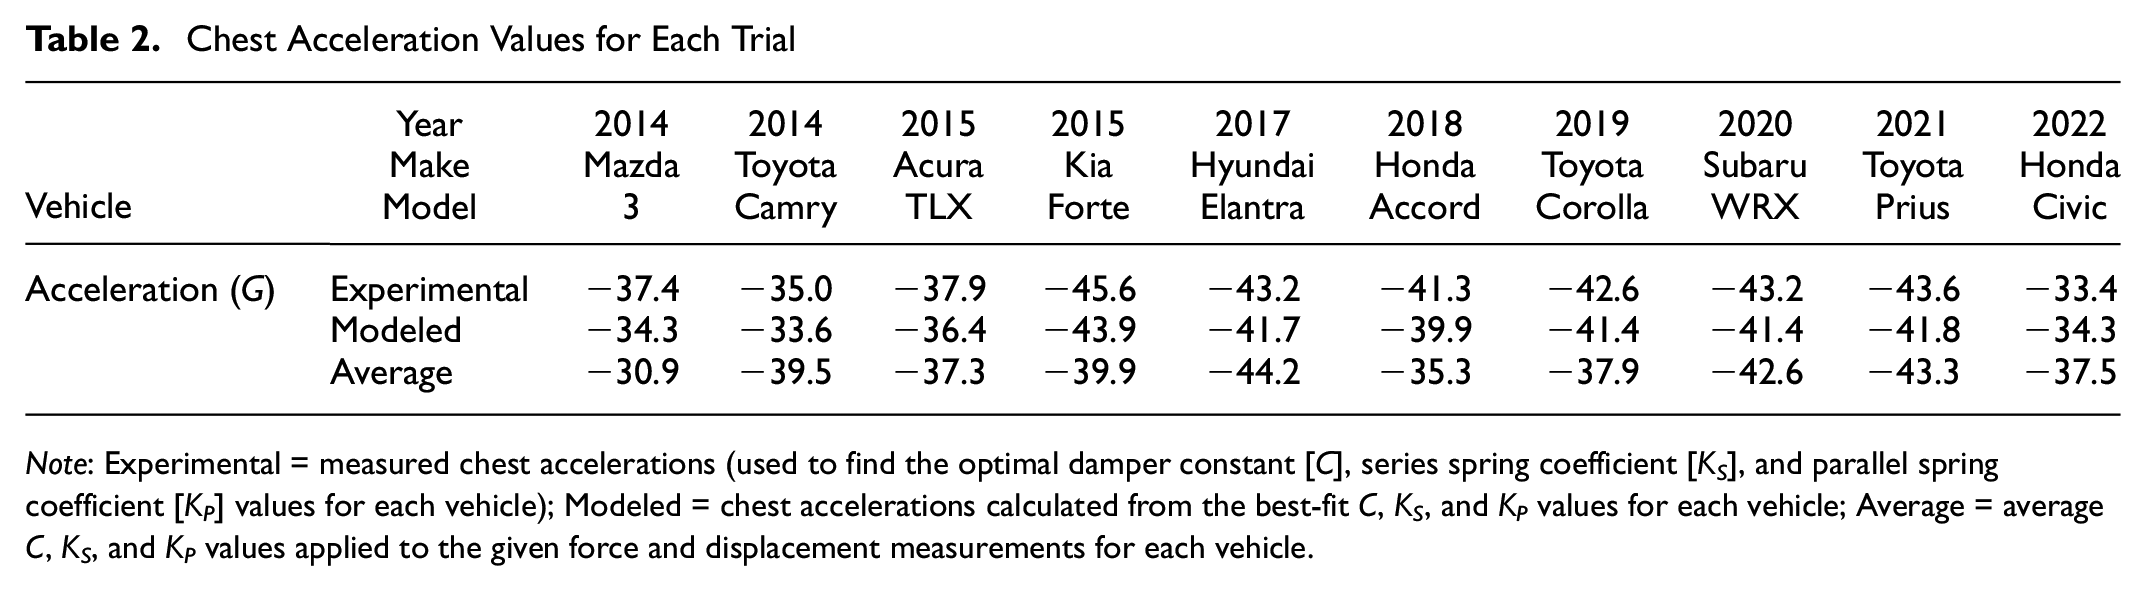
Note: Experimental = measured chest accelerations (used to find the optimal damper constant [C], series spring coefficient [KS], and parallel spring coefficient [KP] values for each vehicle); Modeled = chest accelerations calculated from the best-fit C, KS, and KP values for each vehicle; Average = average C, KS, and KP values applied to the given force and displacement measurements for each vehicle.
Differences Between Peak Accelerations Based on Measured Values and Expressed as Percentages of the Measured Peak Values (Negative Values Indicate that the Given Set of Coefficients Underestimated the Peak Acceleration Magnitude)
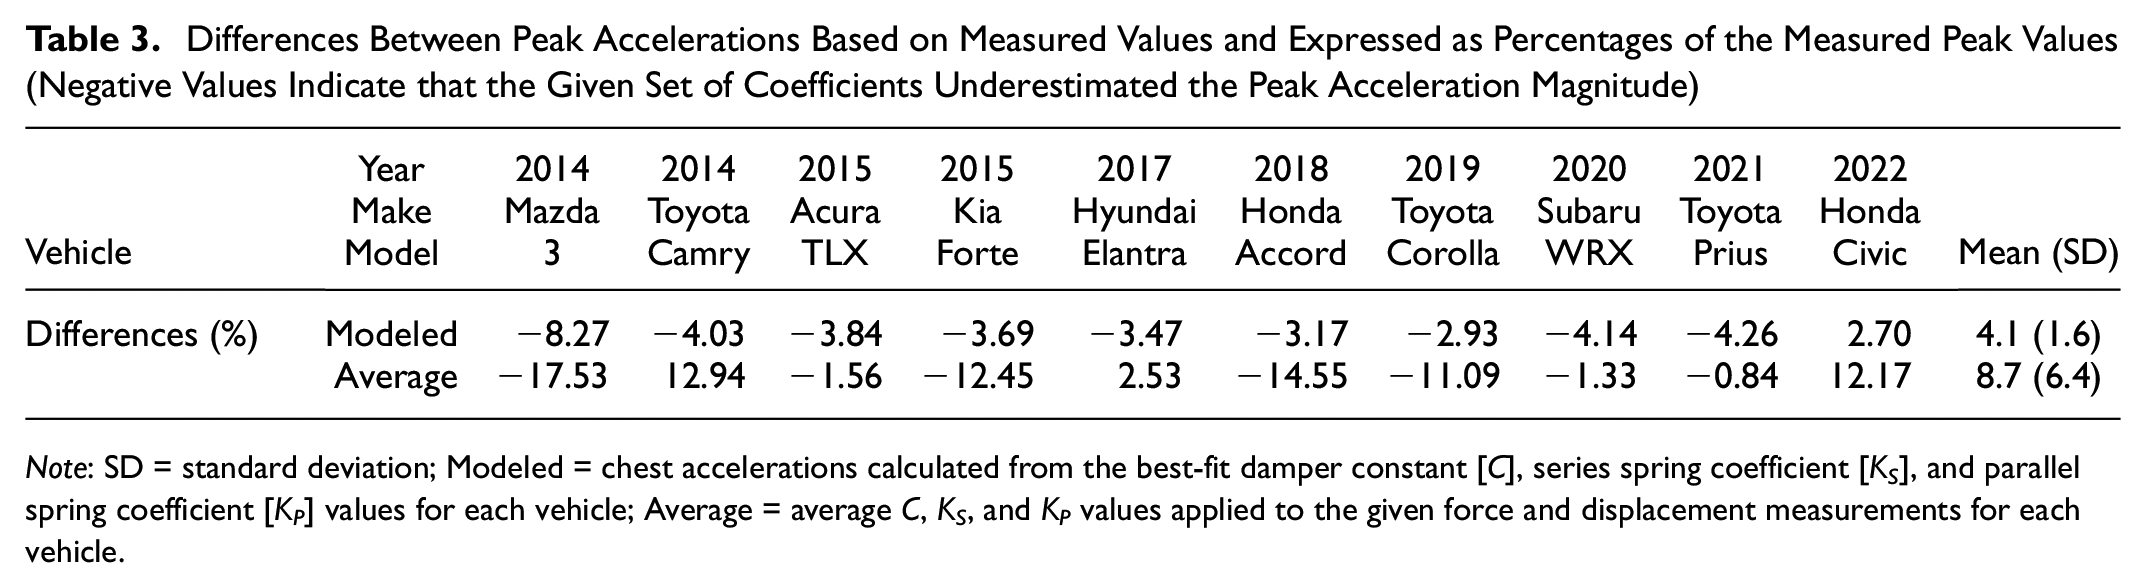
Note: SD = standard deviation; Modeled = chest accelerations calculated from the best-fit damper constant [C], series spring coefficient [KS], and parallel spring coefficient [KP] values for each vehicle; Average = average C, KS, and KP values applied to the given force and displacement measurements for each vehicle.
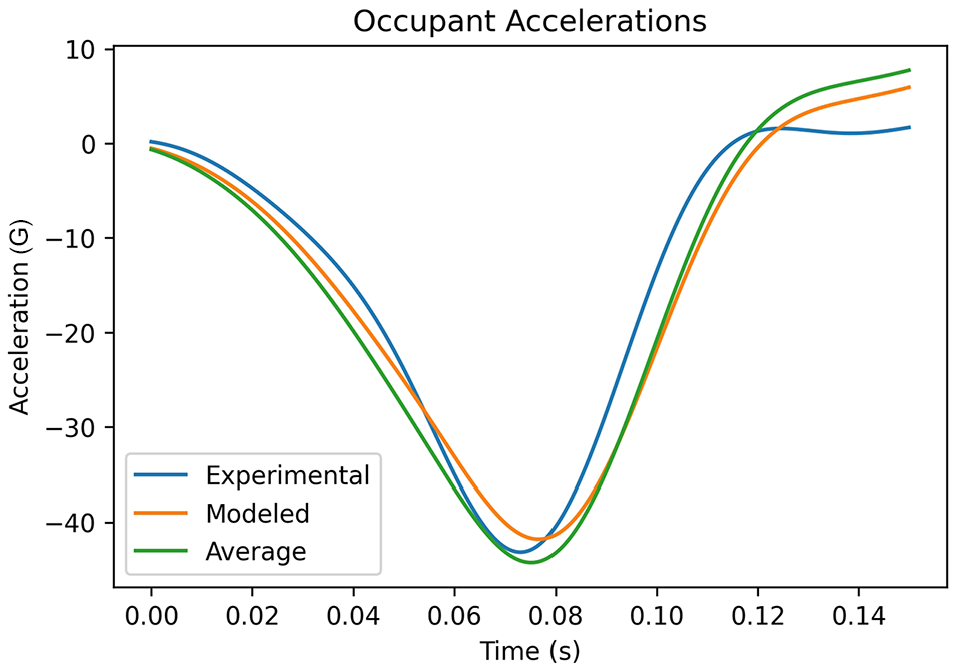
Example plot of the dummy chest accelerations for the 2017 Hyundai Elantra crash test. The data have been filtered at 20 Hz and trimmed so that t = 0s indicates the initial impact between the vehicle and the barrier and t = 0.15s indicates the end of the observation window. This plot includes the experimental (measured) acceleration, the modeled accelerations from the best-fit spring and damper coefficients, and the accelerations calculated from the average best-fit coefficients from all vehicles in the sample population.
The example plots in Figures 2 and 3 show that the occupant acceleration caused by interactions with restraint systems during a crash cannot be accurately modeled as a simple constant acceleration. Additionally, the plots in Figure 4 demonstrate that the new model provides a more accurate representation of occupant velocity compared with previous OLC models. In other words, the old models focused on modeling the vehicle velocity, whereas the proposed model demonstrates the occupant velocity more accurately. Because of how the magnitude of the acceleration continuously and nonlinearly increases for the first 70–90 ms following impact, attempting to quantify the force applied to an occupant by the seatbelt as a single constant value would not be representative of the actual forces and related injury risks experienced by the occupant. Multiple published articles using computational simulations, modeling, and data from the crash tests, such as articles from Carroll et al. ( 21 ), Lefer and Rebolloso ( 1 ), and Antona-Makoshi et al. ( 22 ), have shown nonlinear changes in force and chest deflection in the first 70–90 ms for belted front-seat occupants in frontal crashes.
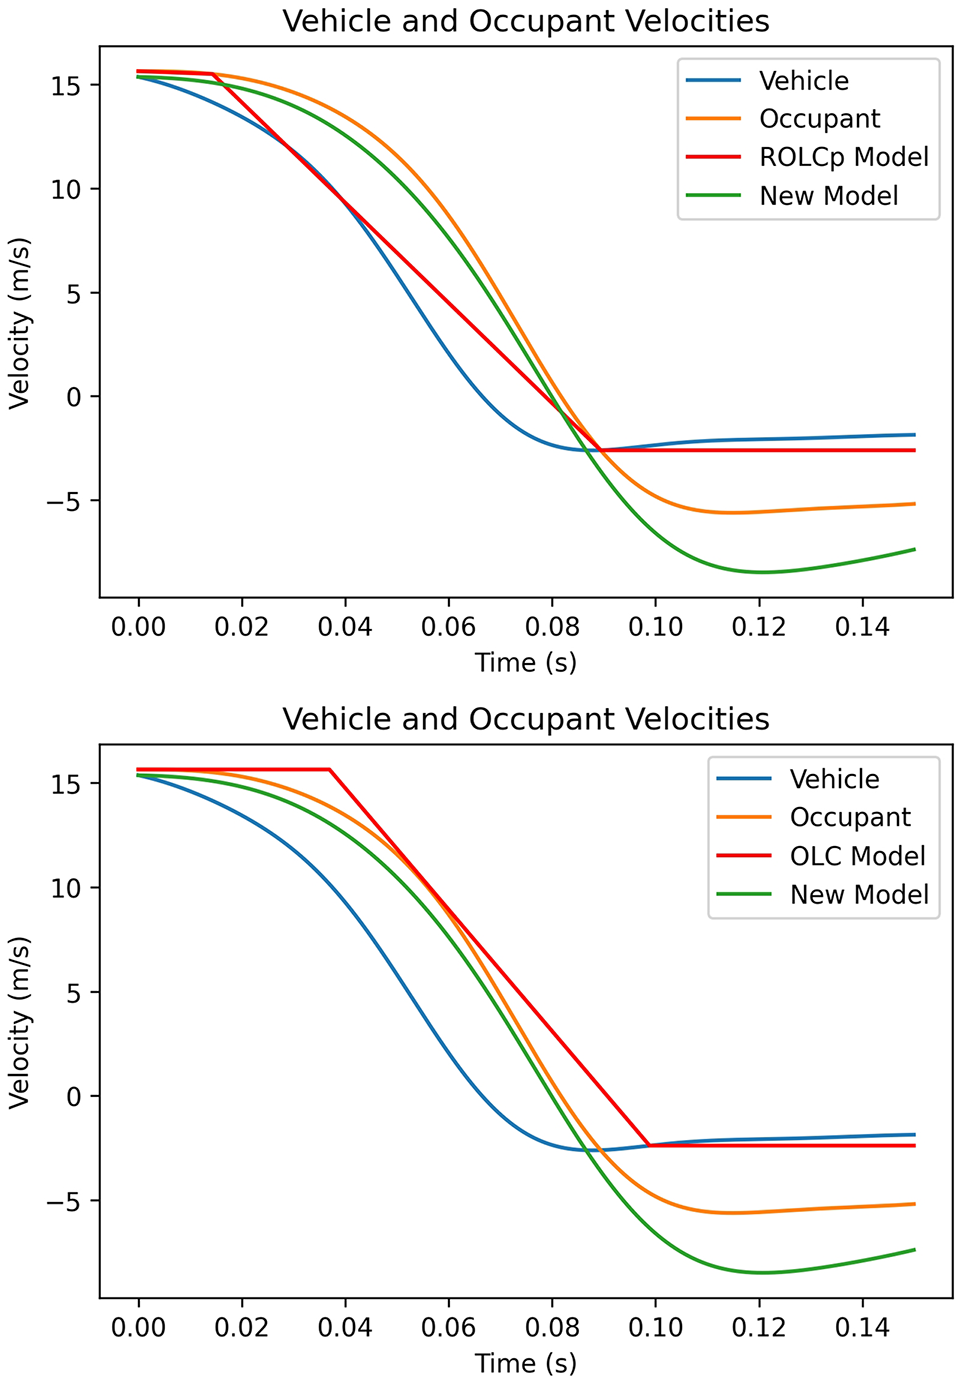
Example plots of the occupant, vehicle, and modeled occupant velocities compared with the velocities from the original occupant load criterion (OLC) model (top) and the real occupant load criterion for prediction (ROLCp) model (bottom).
Discussion
This paper proposes a time-dependent spring–damper model that can be used to quantify occupant interactions with restraint systems during frontal crashes and provides average spring and damper values for a set of imported four-door sedans. The primary objective of this study is to develop a dynamic lumped parameter model that is grounded in the results of standard crash tests. By utilizing accurately measured crash parameters extracted from these test data, the study seeks to create a model that closely reflects the real-world conditions experienced during vehicle collisions. The accuracy of the model compared with the measured acceleration values for each included crash test, as well as its improvement in describing occupant motion compared with prior OLC models, shows that the results can be meaningfully applied to similar vehicles.
This dynamic model is intended to serve as a practical tool for experts in automotive safety, accident reconstruction, and injury biomechanics, enabling them to analyze real-world accidents with a higher degree of accuracy. The model’s utility lies in its ability to incorporate data from standard crash tests, which are widely recognized and utilized across the automotive industry, ensuring its applicability to a range of collision scenarios. Furthermore, the study aims to bridge the gap between controlled crash test environments and real-world accident conditions, offering a model that can be applied to datasets containing field data from actual accidents.
This model provides significant improvements over the established OLC model because it does not operate under the assumption of constant acceleration between two defined time points. The average and peak accelerations as well as the rate of acceleration (i.e., the jerk) during crashes will provide more insight into injury risk and can contribute to restraint system design. While these outputs are not all quantifiable under the assumptions of the original OLC metric, the inclusion of both the spring and damper coefficients described in the models above allows for the calculation of more descriptive acceleration and injury risk values compared with OLC. As stated above, during severe frontal collisions, peak head and body accelerations and chest deflection could arise during the initial phase, especially in the events where frontal airbags deploy. This could potentially increase the risk of injury. The National Highway Transportation Safety Administration (NHTSA) defined head injury criteria (HIC) for the first 15 ms and 36 ms post-collision ( 23 ), as experimental studies show that the highest rate of acceleration the occupant experiences occurs during that phase.
The previously published OLC++ ( 16 ) developed the accuracy of the original OLC model but still used the displacement-based model and depended on the assumed initial slack length. ROLCp further improved the predictive power of OLC by more accurately identifying starting and ending points for the application of force on the occupant by the restraint ( 17 ). Injury metrics previously investigated in the context of OLC, such as HIC15 and peak chest deflection ( 8 ), may demonstrate significant relationships with the actual time-dependent nonlinear peak chest acceleration derived from the OLC model. Furthermore, the peak chest acceleration and jerk, which are representative of the occupants’ experiences with restraints during frontal collisions, are important to analyze and evaluate in the context of injury risk ( 24 ).
Modern-day seatbelts are equipped with protective systems such as pretensioners and load limiters, both of which directly contradict the initial OLC assumptions in relation to slack length and the application of a constant force ( 25 ). These systems affect the dynamics of the occupants during frontal collisions and need to be taken into consideration when analyzing the forces occupants experience; models using the spring and damper values provided in this study are not limited by either of these safety features because they do not require the slack length and constant force assumptions. As such, the proposed time-dependent models can predict peak chest acceleration and loading rates more accurately and incorporate the parameters involved in the dynamic occupant kinematics.
The outputs of this analysis are significant because they can be applied to a variety of crash pulses; they are not constrained by assumptions about vehicle acceleration or energy absorbed over the duration of the crash. These results also do not need to rely on assumptions of “ideal restraints” and the related force applications over the time or distance over which the occupant’s body experienced accelerations. Future work may expand the application of these results by developing similar spring and damper coefficients for other classes of vehicles to account for any differences in vehicle-specific interactions between occupants and restraint systems. Finally, future work may investigate relationships between damper and spring values and injury measures such as peak acceleration and chest deflection during crashes at varying speeds across different vehicle categories.
Conclusions
The presented model marks an improvement over the initial occupant load criterion (OLC) model and is specifically designed to evaluate the accelerations and displacements experienced by front-seat occupants in frontal collisions. By incorporating a time-dependent component, this enhanced model provides a more comprehensive and dynamic analysis of the forces and movements during a crash event. This is particularly important in the early phase of a collision when the restraint systems are not fully engaged, and traditional models may have underestimated the complexities involved.
One of the key developments of this model is its ability to address force dynamics and interactions between restraint systems and occupants, especially during the elastic initial phase characterized by slack in the seatbelt system. By modeling this phase more accurately, the enhanced framework accounts for real-world scenarios where seatbelt slack or inadequate initial restraint could significantly affect occupant safety outcomes.
Moreover, the model explicitly integrates the effects of modern protective systems, such as seatbelt pretensioners and load limiters, which play crucial roles in occupant protection. Pretensioners reduce slack in the seatbelt by tightening the belt during the early stages of a collision, while load limiters allow controlled belt elongation to reduce chest forces; both of these influence occupant displacement and acceleration profiles. By considering these advanced restraint technologies, the model provides a more realistic assessment of occupant kinematics during a crash and improves predictive accuracy for injury outcomes.
Future work could extend this model by incorporating additional variables such as varying types, makes, and models of vehicles, varying seat configurations and seat material characteristics, and varying occupant sizes, or even by using multidirectional collision forces, to further refine its predictive capabilities. Nonetheless, this model represents a robust and meaningful contribution to vehicle safety modeling, providing deeper insights into occupant protection during frontal collisions.
Limitations
A limitation of this study is that only frontal-impact NCAP tests of imported four-door sedans with no airbag deployment were observed. Therefore, the results of the study are limited by the effects of certain parameters such as the crash test speed, the vehicle size, the type of ATDs used, the seated position of the ATDs inside of the vehicle, and the characteristics of the seatbelts used in the standard NCAP crash tests. As a result, the applications of the nonlinear models may not accurately describe occupant forces and motions that may occur as a result of interactions with airbags or in other classes of vehicles. That being said, the study relied on the standardized frontal crash tests run by a governmental organization and the data reported by the national institution.
Because of the acceleration values used for both the dummies and the vehicles, which were integrated to calculate the relative velocity and displacement, any errors in the acceleration measurements would also be present in the other values. Additionally, the relative inputs of any higher-frequency accelerations may not have been present in the displacement and velocity values. These higher-frequency accelerations and any noise that could not be filtered during the initial signal analysis would have been propagated when deriving the jerk from the acceleration inputs.
The data analyzed in this study came from fiftieth-percentile male Hybrid and fifth-percentile Hybrid female crash dummies that were utilized in the standardized frontal crash tests conducted by NCAP, and the ATDs were positioned in the driver’s seat. Antona-Makoshi et al. ( 22 ) looked into other types of ATDs in their study, and a new set of coefficients based on the type of ATD could be developed in future studies. It is worth noting that airbags would not interact with the occupant during the initial phase of forward motion before the slack length of the seat belt is reached. Because of differences in vehicle stiffness and energy absorption during frontal crashes, other types of vehicles will likely have different time-dependent damper coefficients for occupant–restraint interactions.
Footnotes
Author Contributions
OK: literature search, introduction, results, discussion, conclusions study concept and design, data collection, interpretation of the results, draft manuscript preparation.
ZM: literature search, introduction, data analysis, results, figures analysis, and interpretation of the results, data collection, draft manuscript preparation.
Declaration of Conflicting Interests
The author(s) declared no potential conflicts of interest with respect to the research, authorship, and/or publication of this article.
Funding
The author(s) received no financial support for the research, authorship, and/or publication of this article.