
Abstract
Road safety research in developing countries has evolved in two categories: (a) crash frequency prediction modeling and (b) injury severity analysis. In injury severity analysis, the focus is to identify the influential factors for different injury severity categories. However, limited research has been undertaken in this domain, especially to assess the injury severity of the occupants of unconventional vehicles (UVOs) (including both human-pulled and engine-operated vehicles). This study investigates the injury severity of UVOs in Dhaka, Bangladesh adopting a hybrid of latent segments and random parameters logit (LSRPL) models. The model is developed utilizing police-reported collision records for the years 2011–2015. The LSRPL model captures multi-dimensional heterogeneity by allocating victims into discrete latent segments (i.e., inter-segment heterogeneity) and allowing a continuous distribution of parameters within the segments (i.e., intra-segment heterogeneity). The model is estimated for two segments using victim and crash attributes, where segment one is lower risk and segment two is higher risk. The model results suggest that victim and driver profiles, crash attributes, environmental factors, road network attributes, transportation infrastructure, and land use attributes influence the injury severity of UVOs. The model confirms the existence of significant inter-segment heterogeneity. For example, mid-block crashes are more likely to result in severe injury in higher-risk segments, and less likely to result in severe injury in lower-risk segments. The model further confirms intra-segment heterogeneity for areas with higher levels of mixed land use. For example, for mid-block crashes, higher mixed land use shows a significantly lower mean in high-risk segments, revealing lower likelihood of sustaining severe injury.
Keywords
The issue of traffic collisions in developing countries has been of growing concern in recent decades. Developing countries include low- and middle-income countries with gross domestic product (GDP) per capita of less than US$6,500 (in 2013 values) ( 1 ). According to the World Health Organization (WHO) ( 2 ), the number of deaths in traffic crashes has been on the rise since 2013 in low- and middle-income countries. However, a limited amount of research can be found in this context. Traffic characteristics are different in developing countries than in developed countries. Developed countries, also known as high-income countries, have GDP per capita of more than US$23,000 in 2013 values ( 1 ). One of the distinctive features of the traffic in developing countries such as Bangladesh is the prevalence of unconventional modes of transportation, such as human-pulled three-wheeler vehicles ( 3 , 4 ). For example, traffic in Dhaka, the capital of Bangladesh, includes around 0.5 million human-pulled three-wheelers ( 5 ), and this mode of travel comprises around 38% of daily trips ( 6 ). Unconventional vehicles are comparatively slow-moving vehicles, which potentially creates severe conflict with other, faster modes such as private cars ( 5 ). Around 11.6% of traffic crashes in Bangladesh involve unconventional vehicles ( 3 ). The severity of injuries sustained by the occupants of unconventional vehicles (UVOs) is potentially higher, as the occupants typically do not have any safeguard such as a seatbelt or handlebar to hold on to. Furthermore, because of the non-traditional design, the protection of occupants and safety features, among other characteristics, vary significantly among different unconventional vehicles. For this reason, injury severity of UVOs might also vary significantly across the victims, collision types, and locations of collisions. The research question addressed in this paper is: how to develop advanced modeling techniques to capture multi-dimensional unobserved heterogeneity of collision injury severity of UVOs?
This study investigates the collision injury severity of UVOs in Dhaka, Bangladesh. Specifically, the types of unconventional vehicles studied include human-pulled three-wheeler vehicle, motorized three-wheeler taxi, and motorized three-wheeler paratransit. To capture multi-dimensional heterogeneity, a hybrid of latent segments and random parameters logit (LSRPL) models has been developed. The model allocates victims into discrete latent segments which is known as the inter-segment heterogeneity. The model further captures heterogeneity by allowing a continuous distribution of parameters within the segments which is known as intra-segment heterogeneity. The model is developed utilizing five years of police-reported crash records from Dhaka. This study tests the effects of several factors including victim profile and environmental factors, and built environment attributes such as land use, road network configuration, and transportation infrastructure characteristics.
Literature Review
Collision Injury Severity Modeling Techniques
Research in the domain of crash injury severity modeling has adopted several modeling techniques, which can be divided into two broad categories: (i) ordered models and (ii) unordered models. The ordered modeling technique addresses the ordinal nature of injury severity, for example: no injury, minor injury, major injury, and fatal injury. Among the studies relating to ordered modeling, Garrido et al. ( 7 ) investigated the collision injury severity of motor vehicle occupants in Coimbra, Portugal using an ordered probit model. They categorized injury severity of victims on a three-point ordinal scale: no injury, slight injury, serious/fatal injury. They assessed how different vehicle types, road environments, lighting conditions, traffic types, and accident types affected the injury severity of motor vehicle occupants. Habib and Forbes ( 8 ) utilized an ordered probit model to assess injury severity of bicyclists in Nova Scotia, Canada. They considered five-year crash data (2007–2011) and investigated the effect of the age and gender of the bicyclists, collision characteristics, and neighborhood characteristics on bicyclists’ injury severity. However, standard ordered models do not incorporate the effect of exogenous variables on alternative injury severity levels. This limitation is tackled by a generalized ordered model. For instance, Eluru et al. ( 9 ) developed a mixed generalized ordered response model to assess injury severity of non-motorist victims in the U.S.A. They explored the risk factors, for example, driver characteristics, vehicle types, roadway design characteristics, accident locations, environmental factors, and crash characteristics influencing higher injury severity. They also estimated how these factors affect different injury severity levels. Castro et al. ( 10 ) analyzed crash-level injury severity in Texas, U.S.A. using a spatial random coefficient generalized ordered response model. The authors examined the effect of driver characteristics, vehicle characteristics, crash characteristics, highway design characteristics, and environmental factors on injury severity. Chen and Shen ( 11 ) utilized a generalized ordered logit model and generalized additive model to investigate the risk factors influencing injury severity of bicyclists. They analyzed 10-year crash data for Seattle, U.S.A. and assessed the effect of built environment characteristics such as employment density, land use mixture, number of street lights, and so forth within 50 m buffers of collision locations. Quddus ( 12 ) investigated injury severity of drivers in the United Kingdom utilizing three-year crash data. They utilized an ordered logit model incorporating multi-level mixed effects and tested the effect of driver-level and crash-level variables. Kim et al. ( 13 ) investigated the influence of crash and municipality characteristics on the injury severity of pedestrians in South Korea. They developed a hierarchical ordered model where crash-related variables were used as lower-level attributes and municipality variables as upper-level attributes.
In the case of unordered modeling technique, injury severity levels are assumed to be discrete levels. The advantage of this approach is that it captures unobserved heterogeneity. For example, Yan et al. ( 14 ) adopted a multinomial logit model to find the risk factors of irregular maneuvers in collisions involving bicyclists. They also developed a binary logit model to investigate the injury severity of bicyclists considering injury severity level as a discrete outcome of severe injury and non-severe injury. Utilizing the binary model, they assessed the effect of crash characteristics, bicyclist demographics, vehicle characteristics, and environmental factors on severe injury. Koopmans et al. ( 15 ) adopted a multivariate logistic regression approach to analyze the pedestrian injury severity in Illinois, U.S.A. They developed separate models for younger and older age groups and considered three discrete levels of injury severity: fatal, severe injury, and moderate/minor injury. They investigated the effect of gender of the pedestrian, lighting conditions, road conditions, weather conditions, and collision location on different injury severity levels. Chen et al. ( 16 ) utilized a hybrid model combining multinomial logit model and Bayesian network to identify the factors influencing drivers’ injury severity in rear-end crashes. They considered a two-year crash record (2010–2011) from New Mexico, U.S.A. and assessed the effect of risk factors such as driver behavior, demographic characteristics, vehicle characteristics, geometric characteristics, and environmental characteristic on different injury severity levels. Haleem et al. ( 17 ) employed a mixed logit model to examine the injury severity of pedestrians at signalized and un-signalized intersections. The authors utilized three-year crash data from Florida, U.S.A. and examined the effect of the characteristics of pedestrians, drivers, traffic, road geometry, and weather on the injury severity of pedestrians. Behnood and Mannering ( 18 ) adopted a random parameters multinomial logit model to investigate the injury severity of bicyclists in Los Angeles, U.S.A. The model estimated the effect of characteristics of bicyclists and of drivers of counterpart vehicles, collision types, weather and environmental characteristics, and so forth on different injury outcomes, and captured unobserved heterogeneity adopting heterogeneity in mean and variance approach.
Furthermore, injury severity modeling research has put significant emphasis on capturing unobserved heterogeneity. Injury severity is a complex phenomenon, influenced by a wide array of factors which are not available in the commonly collected data. Thus, heterogeneity may exist across the victims and crashes ( 19 ). As a result, ignoring heterogeneity might result in biased and inconsistent parameter estimates. To capture such heterogeneity, ordered and unordered modeling techniques are extended to advanced methods such as random parameters model and latent segmentation-based model. The random parameters model captures heterogeneity by allowing a continuous distribution of parameters over the individuals ( 20 ). For example, Azimi et al. ( 21 ) investigated crash-level injury severity for truck rollover crashes in Florida, U.S.A. using a random parameter logit model. The model examined the existence of heterogeneity across the crashes for operating speed and lighting condition. However, one of the limitations of the random parameters model is the requirement to make an a priori hypothesis in relation to the distribution of the density function. The latent segmentation-based model has relaxed this restriction by allowing a discrete distribution of the parameters which is unknown to the analyst ( 22 , 23 ). This method captures heterogeneity by allocating the victims into discrete latent segments. For example, Yasmin et al. ( 24 ) employed a latent segmentation-based model to assess the factors affecting the injury severity of pedestrians in New York, U.S.A. The model was estimated based on two segments: fatality segment and serious injury segment. The analysis confirmed that various variables relating to victim profile, weather condition and vehicle type show heterogeneity across two segments. However, one of the limitations of this approach is that it ignores potential heterogeneity within the segments. Specifically, injury severity analysis demands the accommodation of multi-dimensional heterogeneity, since injury severity exhibits complex interactions with various factors such as the victim’s health and physical dimensions. Such data is often not readily available in the collision record databases. As a result, injury severity might have a wide array of variation across several unobserved factors. To accommodate such multi-dimensional heterogeneity, advanced modeling techniques need to be developed.
Collision Injury Severity Analysis for Developing Countries
Limited studies can be found in the domain of road safety analysis in developing countries. These studies can be broadly categorized into two types: (a) crash frequency prediction modeling and (b) injury severity analysis. Among crash prediction modeling, Ahsan et al. ( 25 ) analyzed crash records for three years (2007–2009) to identify the high-risk crash zones and collision types for Bangladesh. The results showed that head-on and rear-end collisions are the major collision types. They also showed that rear-end collisions take place because of changes in speed whereas careless driving causes head-on collisions. Anjana and Anjaneyulu ( 26 ) explored the crash factors in mixed traffic conditions for three cities in the state of Kerala, India using two regression models. The model showed that closed-circuit television (CCTV) surveillance of right of way, and count-down based traffic signals have been effective in reducing crashes. Gebretensay and Juremalani ( 27 ) utilized a macro-level multiple linear regression model to develop a collision prediction model for the city of Vadodara, India. The analysis identified that involvement of a two-wheeler vehicle and drivers at fault are the major causes of crashes.
In the case of injury severity analysis for developing countries, research has not occurred to any significant extent. Among the few, Sarkar et al. ( 28 ) examined nine years of records of pedestrian-involved collisions from Bangladesh with a binary logistic model. The authors found that, compared to cars, unconventional modes such as motorized three-wheeler taxi and motorized three-wheeler paratransit triggered higher injury severity risk of pedestrians. Anowar et al. ( 29 ) developed a generalized ordered logit model to explore the crash factors for intersection crashes using nine years of crash data for Dhaka, Bangladesh. The authors identified that involvement of a non-motorized vehicle and a two-wheeler, and absence of a divider in the roadway are more likely to result in severe injury in crashes. Anjuman et al. ( 30 ) analyzed collision records of Bangladesh for the years 1993–2003 and found that 24% of fatal crashes took place in the presence of a non-motorized vehicle. Ijaz et al. ( 31 ) utilized machine learning technique to assess the crash-level injury severity in collisions involving three-wheeled motorized rickshaws in Rawalpindi, Pakistan. They found that younger drivers, wide road (three lanes or more), highway with posted speed limit of 60 mph or above, and daytime aggravate the injury severity of crashes. Hegazy et al. ( 32 ) investigated victim-level injury severity in auto-tricycle involved crashes in Egypt. They concluded that younger occupants (aged below 20 years) and collision with two-wheeled motorcycle were more likely to result in severe injury of victims. In Dhaka, a major proportion of the traffic stream is comprised of unconventional vehicles. The design and safety features vary significantly among unconventional vehicle types. For example, in a human-pulled three-wheeler vehicle, occupants (i.e., drivers and passengers) sit in an open-setting without any vehicle body part covering them, no seatbelt is available, and passengers have no platform to hold while traveling. In the case of motorized three-wheeler paratransit, passengers sit sideways, the vehicle body covers the passengers, but neither seatbelts or any platform to hold on to are available, and boarding/alighting happens through an opening in the back that does not have any door. The limited availability and variation of safety features means that the injury severity sustained by UVOs might be higher and vary significantly. There exists a research gap related to the modeling of injury severity of UVOs; specifically, advanced models need to be developed to accommodate the multi-dimensional heterogeneity of such crash injury severity.
Contribution of This Study
This study contributes to the literature in the following two dimensions: (i) it investigates collision injury severity by developing a hybrid of latent segments and random parameters logit modeling techniques to capture multi-dimensional heterogeneity across victims, and (ii) it tests the model to analyze injury severity of UVOs in a developing country. The LSRPL model accommodates multi-dimensional heterogeneity by assuming a continuous and finite mixture of the parameters. A latent segment allocation model is formulated within the LSRPL modeling framework to allocate individual victims into discrete latent segments. Further heterogeneity within the segments is accommodated by assuming a continuous distribution of the parameters over the individuals. This study further contributes by examining the injury severity of UVOs in vehicles such as human-pulled vehicles and motorized three-wheeler vehicles. The model is tested for a megacity in a developing country—Dhaka, Bangladesh.
Data
This study utilized a five-year police-reported collision record (2011–2015) from Dhaka, Bangladesh. This database includes victim-specific and crash-specific information about the crashes. For example, the victim-specific component provides information related to victim type, vehicle type, injury severity, victim gender, and age, among others. Crash-specific attributes provide information in relation to the year, time of day, day of the week, collision type, weather type, lighting conditions, road geometry, road type, surface type, surface quality, and location of crash, among others. Further data such as land use, sidewalk length, railroad alignment, and location of bus terminals and water vehicle (ferry) stations were retrieved from the Rajdhani Unnayan Kartripakkha (RAJUK), Dhaka.
The crash database includes a record of 1,835 collisions involving 2,203 victims over the five-year period. Among these, a total of 246 collisions involved unconventional vehicles. This study considers three vehicle types as “unconventional vehicle”: human-pulled three-wheeler vehicle (known as “rickshaw”), motorized three-wheeler taxi (known as “baby-taxi”), motorized three-wheeler paratransit (known as “tempo”) ( 33 ). Human-pulled three-wheeler vehicles can accommodate two passengers, whereas the occupancy of motorized three-wheeler paratransit is 14 passengers operating on a fixed route. Motorized three-wheeler taxis operate as taxi services in Dhaka, and have an occupancy of three passengers. A total of 414 UVOs were injured over the five years. In each crash record, injury severity is reported in the following four categories: fatal, major injury, minor injury, no injury. Fatal refers to the death of the victim; major injury indicates victims being admitted to hospital; minor injury requires first-aid treatment but does not require the victim to be hospitalized; and the final category is no injury. In this study, fatal and major injury are included in “severe injury” and rest are included in “non-severe injury.” The reason for aggregating the four injury severity groups into two is the lower number of victims in the minor injury group. For example, the distribution of victims among the four injury groups is as follows: fatal injury 29.95%, major injury 25.60%, minor injury 8.45%, no injury 35.99%. Using such a relatively small group might affect the convergence of the model and result in insignificant parameter estimates. As a result, the four categories are aggregated into two, which is also consistent with the literature ( 34 ). Figures 1 to 4 illustrate the percentage share of injury severity based on vehicle type, age group, collision type, and land use type, respectively. Figure 1 indicates that the shares of both severe injury and non-severe injury are higher for human-pulled three-wheeler vehicle occupants (40% and 19% respectively) among all the UVOs. In the case of age group distribution (Figure 2), a higher share of younger and middle-aged victims are severely injured, since the share of severe injury for younger (age 16–30) and middle-aged groups (age 31–45) are 24% and 21% respectively. The distribution of injury severity based on collision type (Figure 3) suggests that rear-end collisions result in the highest share of severe injury (35%) and non-severe injury (21%). In contrast, head-on collisions have the second highest share of severe injury (12%). Figure 4 depicts the percentage share of injury severity based on land use type, which is categorized based on the land use mix index (LUMI). LUMI values range from 0 to 1 ( 35 ). A unit value of LUMI indicates that the area surrounding the crash location is perfectly heterogeneous with multi-purpose usage; whereas a value of zero indicates that the land use is perfectly homogeneous. Figure 4 shows that the shares of severe and non-severe injury are higher in areas of less mixed land use (31% and 30% respectively).
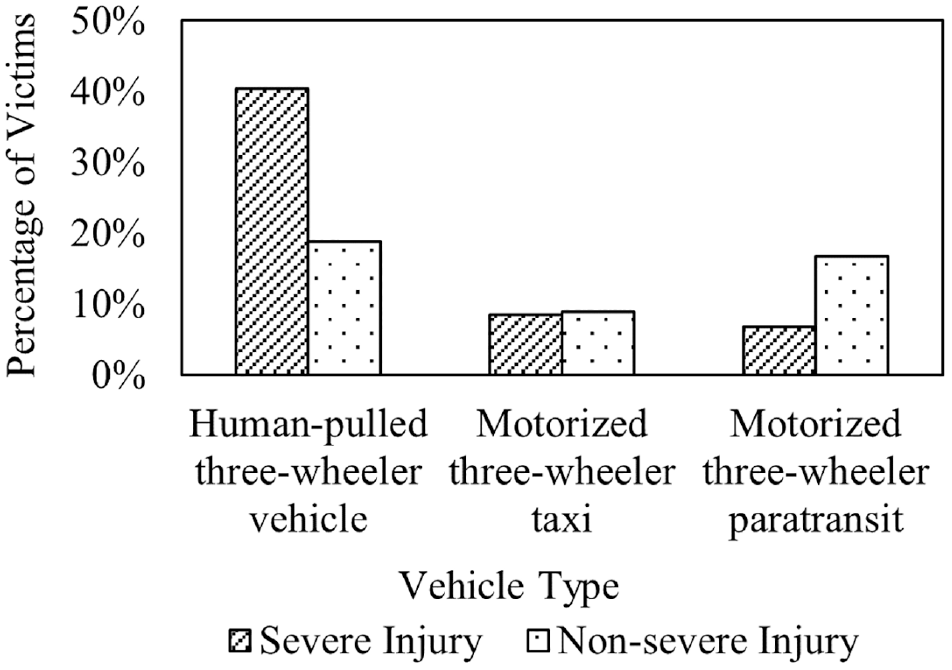
Injury severity of unconventional vehicle occupants (UVOs) based on vehicle type.
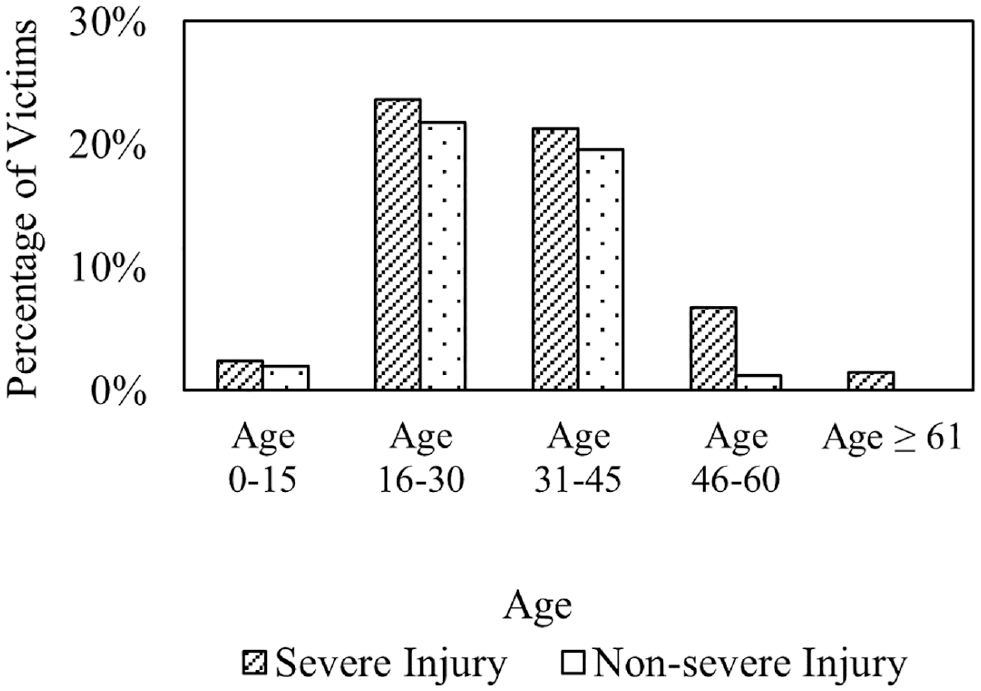
Injury severity of unconventional vehicle occupants (UVOs) based on age.
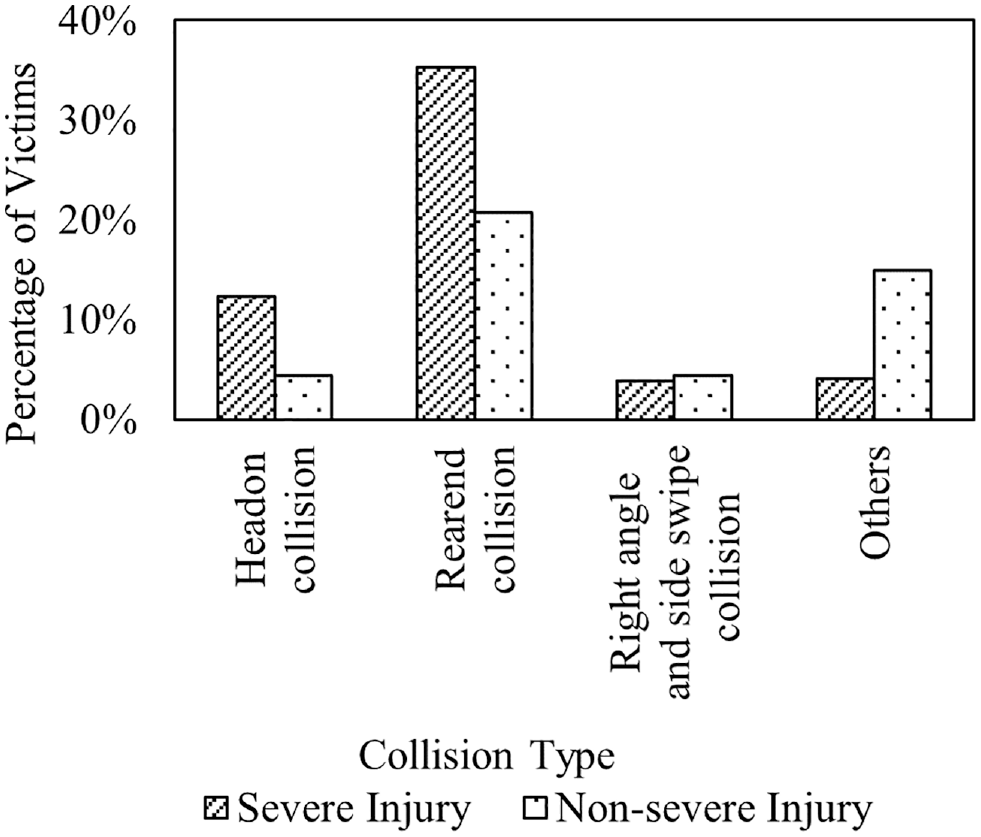
Injury severity of unconventional vehicle occupants (UVOs) based on collision type.
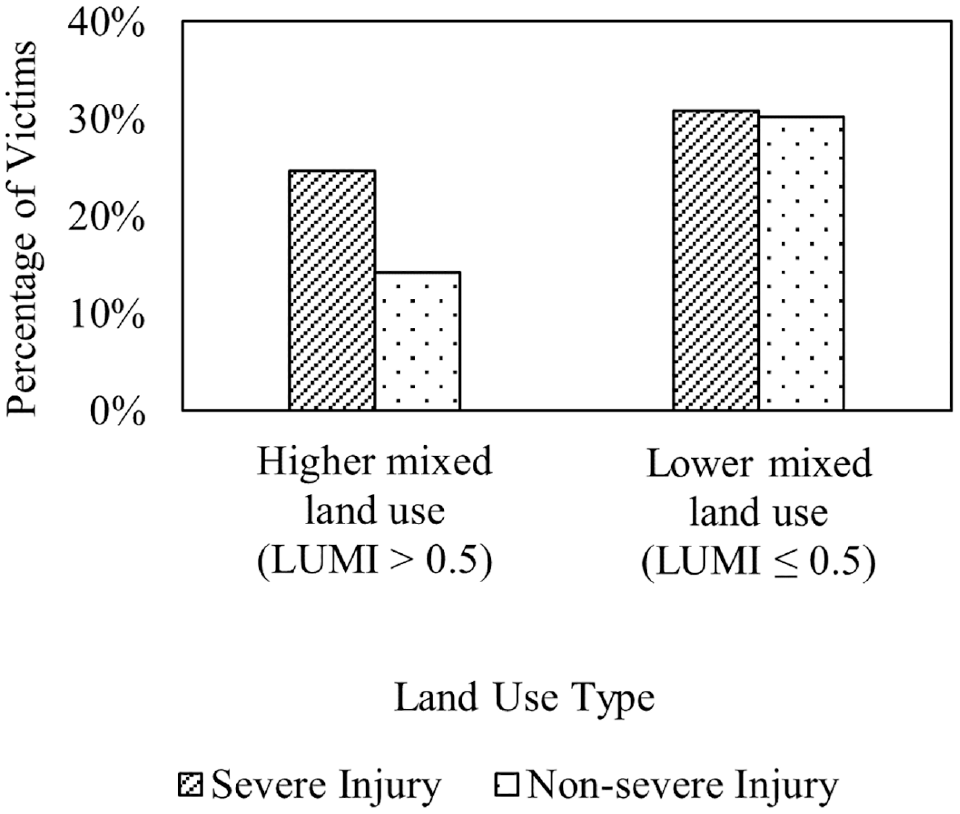
Injury severity of unconventional vehicle occupants (UVOs) based on land use type.
To capture the effects of built environment attributes, several data preparation steps were followed to connect the nearby built environment information with the corresponding crashes. In this regard, land use attributes within a 250 m buffer from each crash location were generated. These attributes include land use characteristics such as percentages of residential and commercial areas, and transportation infrastructure characteristics such as length of sidewalk and railroad, bridge area, and number of bus terminals, truck terminals, and ferry stations within the 250 m buffer. The geocoded crash locations were also used to identify the crash region in the city such as the Airport region and the central business district (CBD). Moreover, the land use information is utilized to generate LUMI for the 250 m buffer area.
Methodology
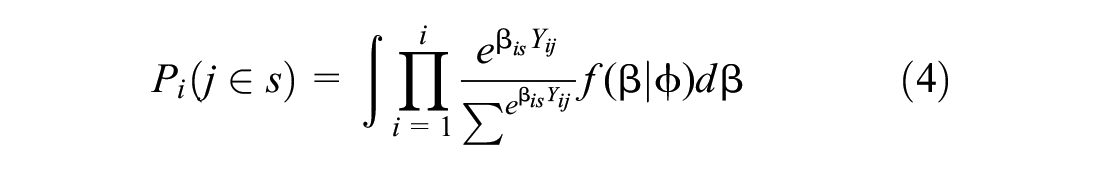
This study develops a hybrid of latent segments and random parameters logit models to capture multi-dimensional heterogeneity among the collision victims. The model captures heterogeneity by allowing continuous and finite mixture of the parameters. This model is utilized to examine the factors influencing injury severity of UVOs, which has been categorized into the following two injury severity levels: non-severe injury and severe injury. In the case of the LSRPL model formulation, a segment allocation model is developed within the LSRPL framework to capture inter-segment heterogeneity by allocating UVOs into discrete latent segments. Assuming that victim j is allocated to segment s, the segment allocation model takes the following logit form:

where

where

where
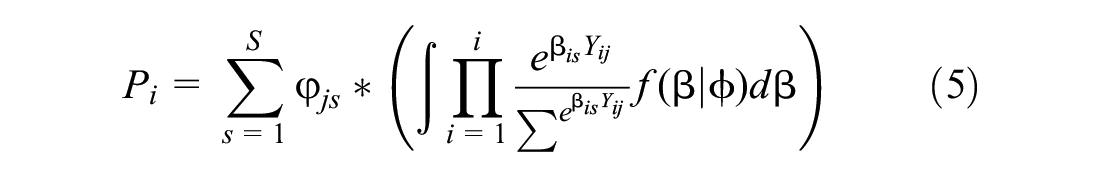
The unconditional probability can be calculated using the following equation:
The parameters of the model are calculated by maximizing the log-likelihood function that can be written as:
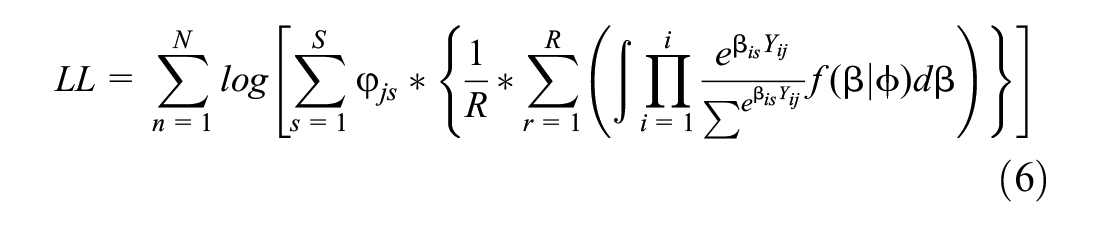
where N is the number of observations and R is the number of draws. Values of
Independent Variables Considered
This study tests the effects of several factors including victim profile, crash attributes, environmental factors, and built environment attributes such as network configuration and transportation infrastructure. Victim and driver profile include gender and age of UVOs (i.e., driver and passenger), occupants of different unconventional vehicles (i.e., human-pulled three-wheeler vehicle, motorized three-wheeler taxi and motorized three-wheeler paratransit). Crash attributes include collision type (e.g., head-on, rear-end, sideswipe, and overturned), and vehicle type involved in the collision (e.g., public transit, truck, and private car). Road network characteristics involve road intersection type (e.g., four-leg intersection, three-leg intersection, roundabout, and non-intersection such as mid-block), traffic control system (e.g., police-controlled, and traffic light), and road configuration (e.g., one-way road and two-way road). Environmental factors include weather condition (e.g., rainy, foggy, and windy), lighting condition (e.g., day light, dark, and streetlights on), season (e.g., summer and winter), time of the day (e.g., morning peak, evening peak, and mid-day) and day of the week (e.g., weekday, and weekend). The model extensively tests various land use and transportation infrastructure attributes such as number of bus stops, bus terminals, truck terminals, water stations, and length of sidewalk and railroad. Furthermore, percentage of residential and commercial area, and LUMI have been examined. The variables are tested and retained in the final model based on confirmation of priori hypotheses and their statistical significance. Summary statistics of the variables retained in the final model are demonstrated in Table 1. Since occupants include passenger, Pearson correlation coefficient between occupants and passengers of human-pulled three-wheeler vehicles has been estimated to check existence of correlation and a value of 0.48 has been found. Since Pearson correlation coefficient value of less than 0.60 indicates no significant correlation between variables ( 38 , 39 ), it can be concluded that variables representing occupants and passengers of human-pulled three-wheeler vehicle are not correlated. Similarly, variables representing occupants and passengers of motorized three-wheeler paratransit do not have any significant correlation as the Pearson correlation coefficient value for these two variables is 0.45.
Summary Statistics of Explanatory Variables Retained in the Model
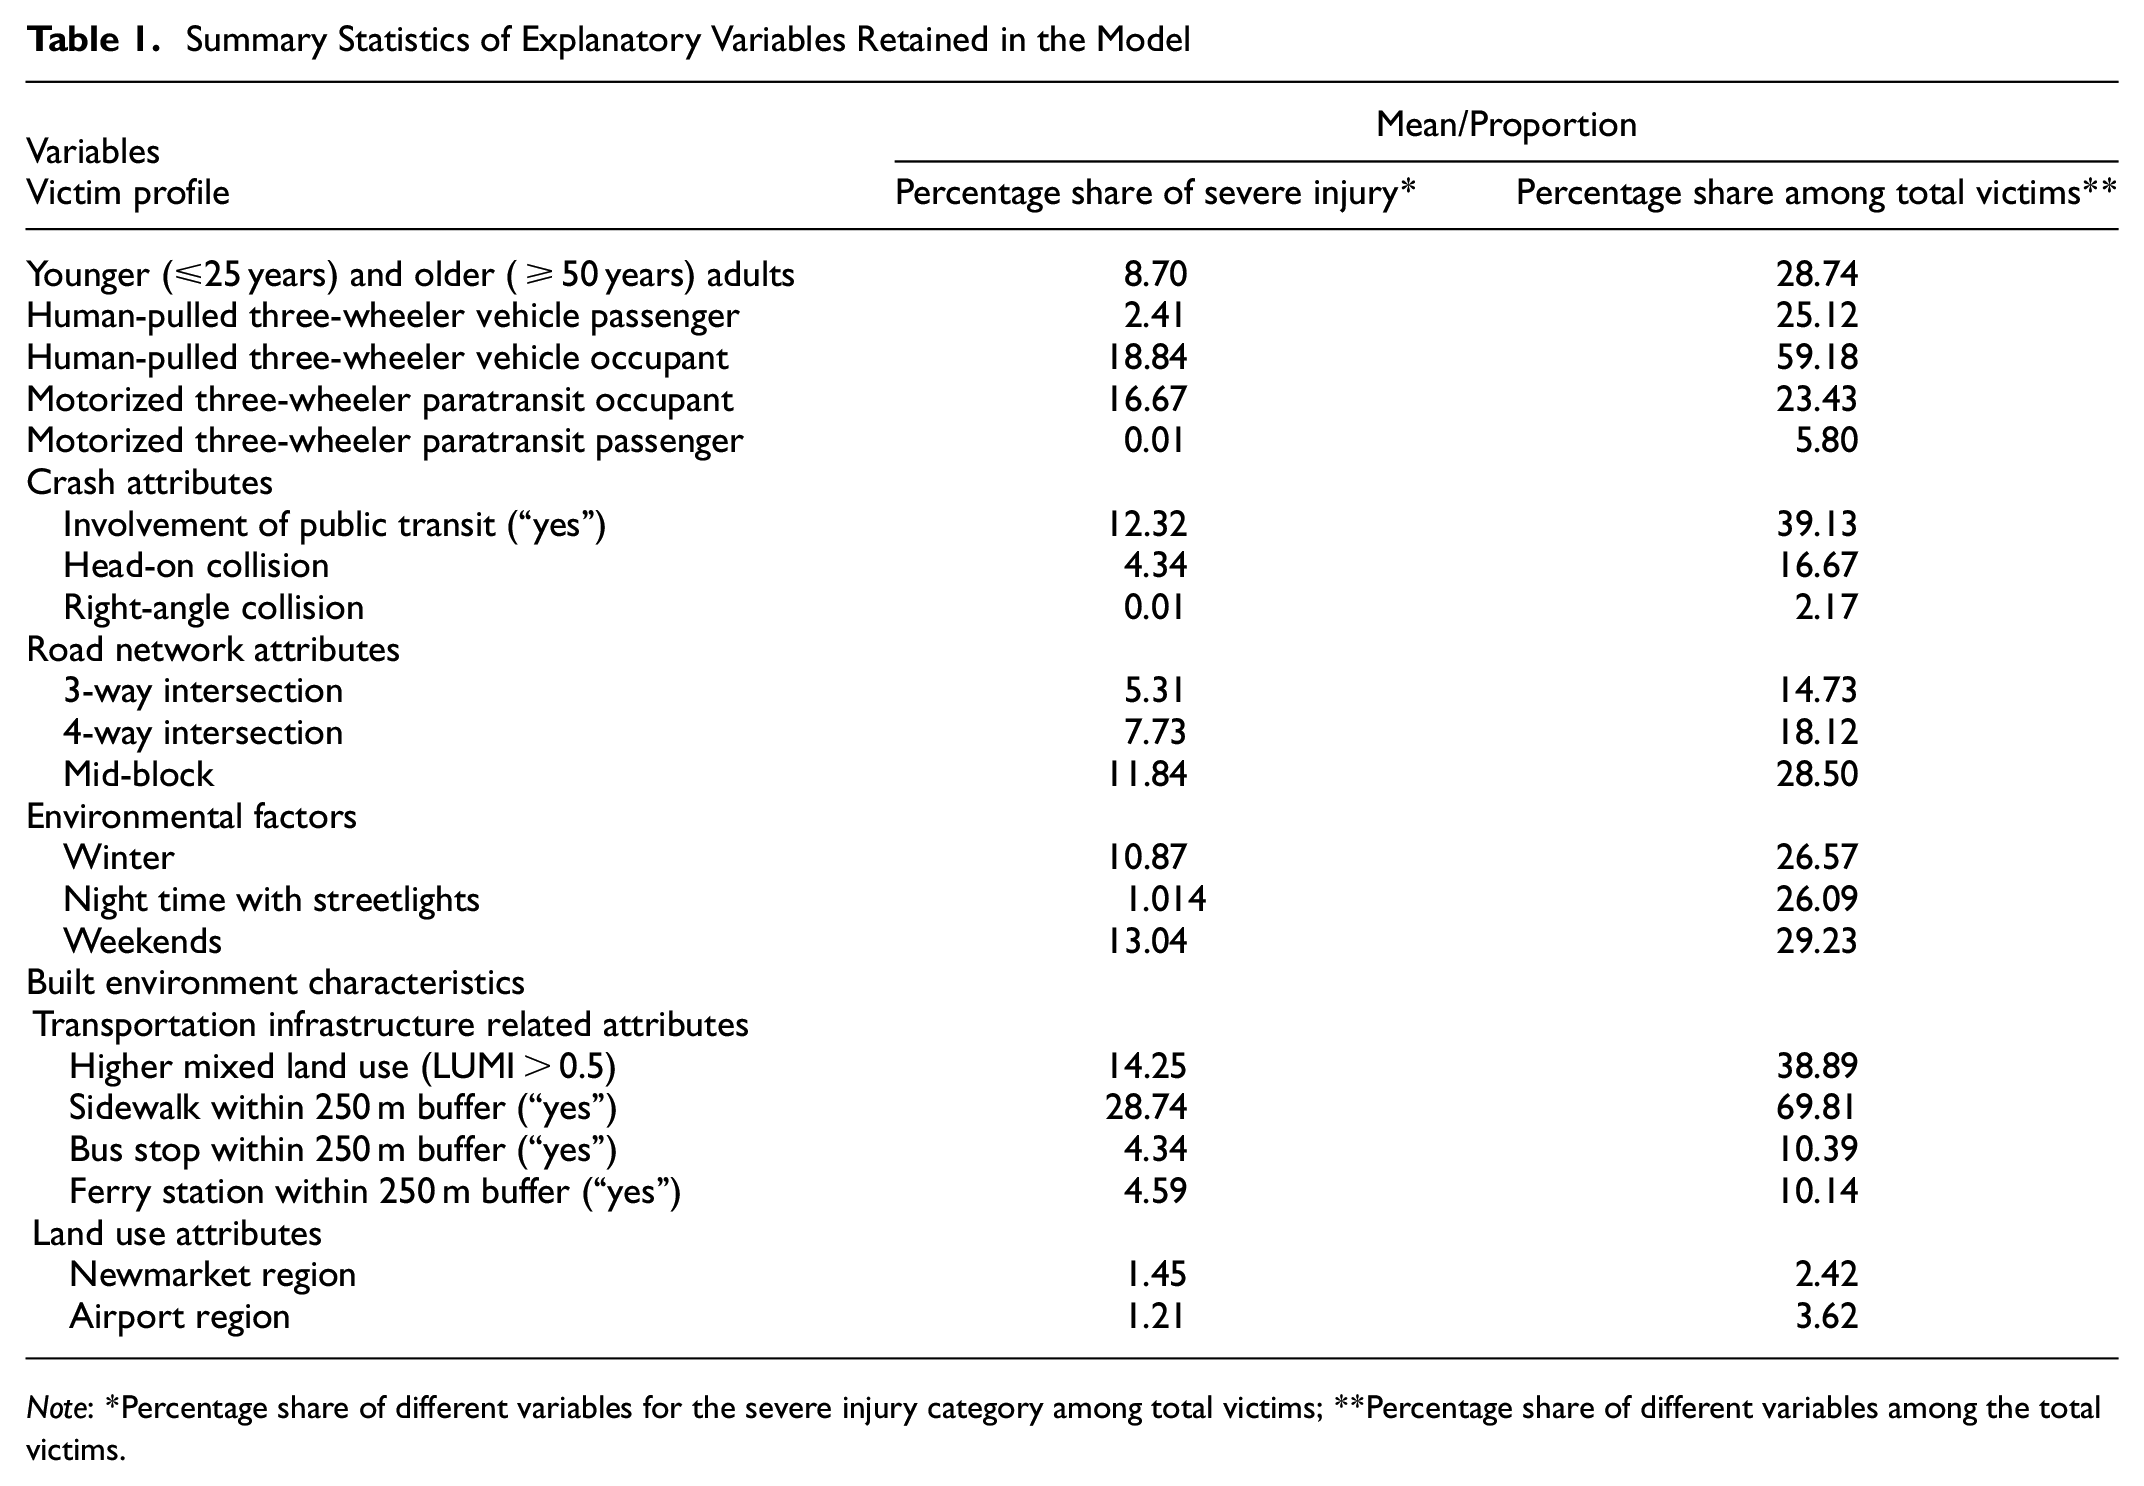
Note: *Percentage share of different variables for the severe injury category among total victims; **Percentage share of different variables among the total victims.
Model Results
Goodness-of-Fit Measures
The proposed LSRPL model offers flexibility to capture inter- and intra-segment heterogeneity. To accommodate inter-segment heterogeneity, the number of segments needs to be determined. The LSRPL model captures unobserved heterogeneity by distributing victims into discrete latent segments based on victim and crash attributes. The model is estimated for several numbers of segments (two segments and three segments). The number of segments that fit the data best is determined based on the AIC and BIC measures, where the model with the lower AIC and BIC values outperforms other models. The model results suggest that the AIC and BIC values of the two-segment model are 421.1 and 454.7 respectively, which is lower than that of the three-segment model (i.e., for the three-segment model, AIC and BIC values are 429.6 and 464.4). Therefore, the model with two segments is considered for further discussions. In addition, this two-segment LSRPL model is compared with a multinomial logit (MNL) model. In the case of the goodness-of-fit measures, the LSRPL model with two segments yields a log-likelihood value of −155.5, and a pseudo r-squared value of 0.36. On the other hand, the pseudo r-squared and log-likelihood values for the MNL model are 0.27 and −194.1, respectively. Therefore, the LSRPL model outperforms the MNL model. Therefore, the LSRPL is the final model and is considered in the further discussion of the model results.
Results of the Latent Segment Allocation Model
The latent segment allocation model is estimated based on the age of the victim and crash attributes such as vehicle type involved in the crash (e.g., public transit and private car). The parameters of the segment allocation model are estimated for segment one only, considering segment two as the reference segment. For example, a positive relationship of a variable in segment one indicates that victims with that characteristic have a higher likelihood to be allocated to segment one, and lower likelihood to be allocated to segment two. The parameter estimation results are shown in Table 2. The model confirms a negative sign for the variable representing victim’s age less than 25 years and more than 50 years, which indicates that younger and older victims are less likely to be included in segment one. On the other hand, segment two is more likely to include younger and older adults aged below 25 years and above 50 years respectively. Elderly and younger victims are more likely to experience severe and fatal injury, since they have the least physical capacity to overcome a major injury which eventually leads to death. Furthermore, a similar negative relationship is found for crashes involving public transit in segment one. Crashes involving public transit are likely to result in severe injury, since the heavy vehicles used in public transit exert extreme impact on the colliding victim. Therefore, segment two can be identified as a higher injury severity risk segment, as it has a higher probability of including older and younger victims involved in collisions with public transit. On the contrary, segment one can be identified as a comparatively lower injury severity risk segment, since it is more likely to include middle-aged victims involved in collisions with smaller vehicles such as private cars.
Parameter Estimation Results of the Latent Segments and Random Parameters Logit (LSRPL) Model
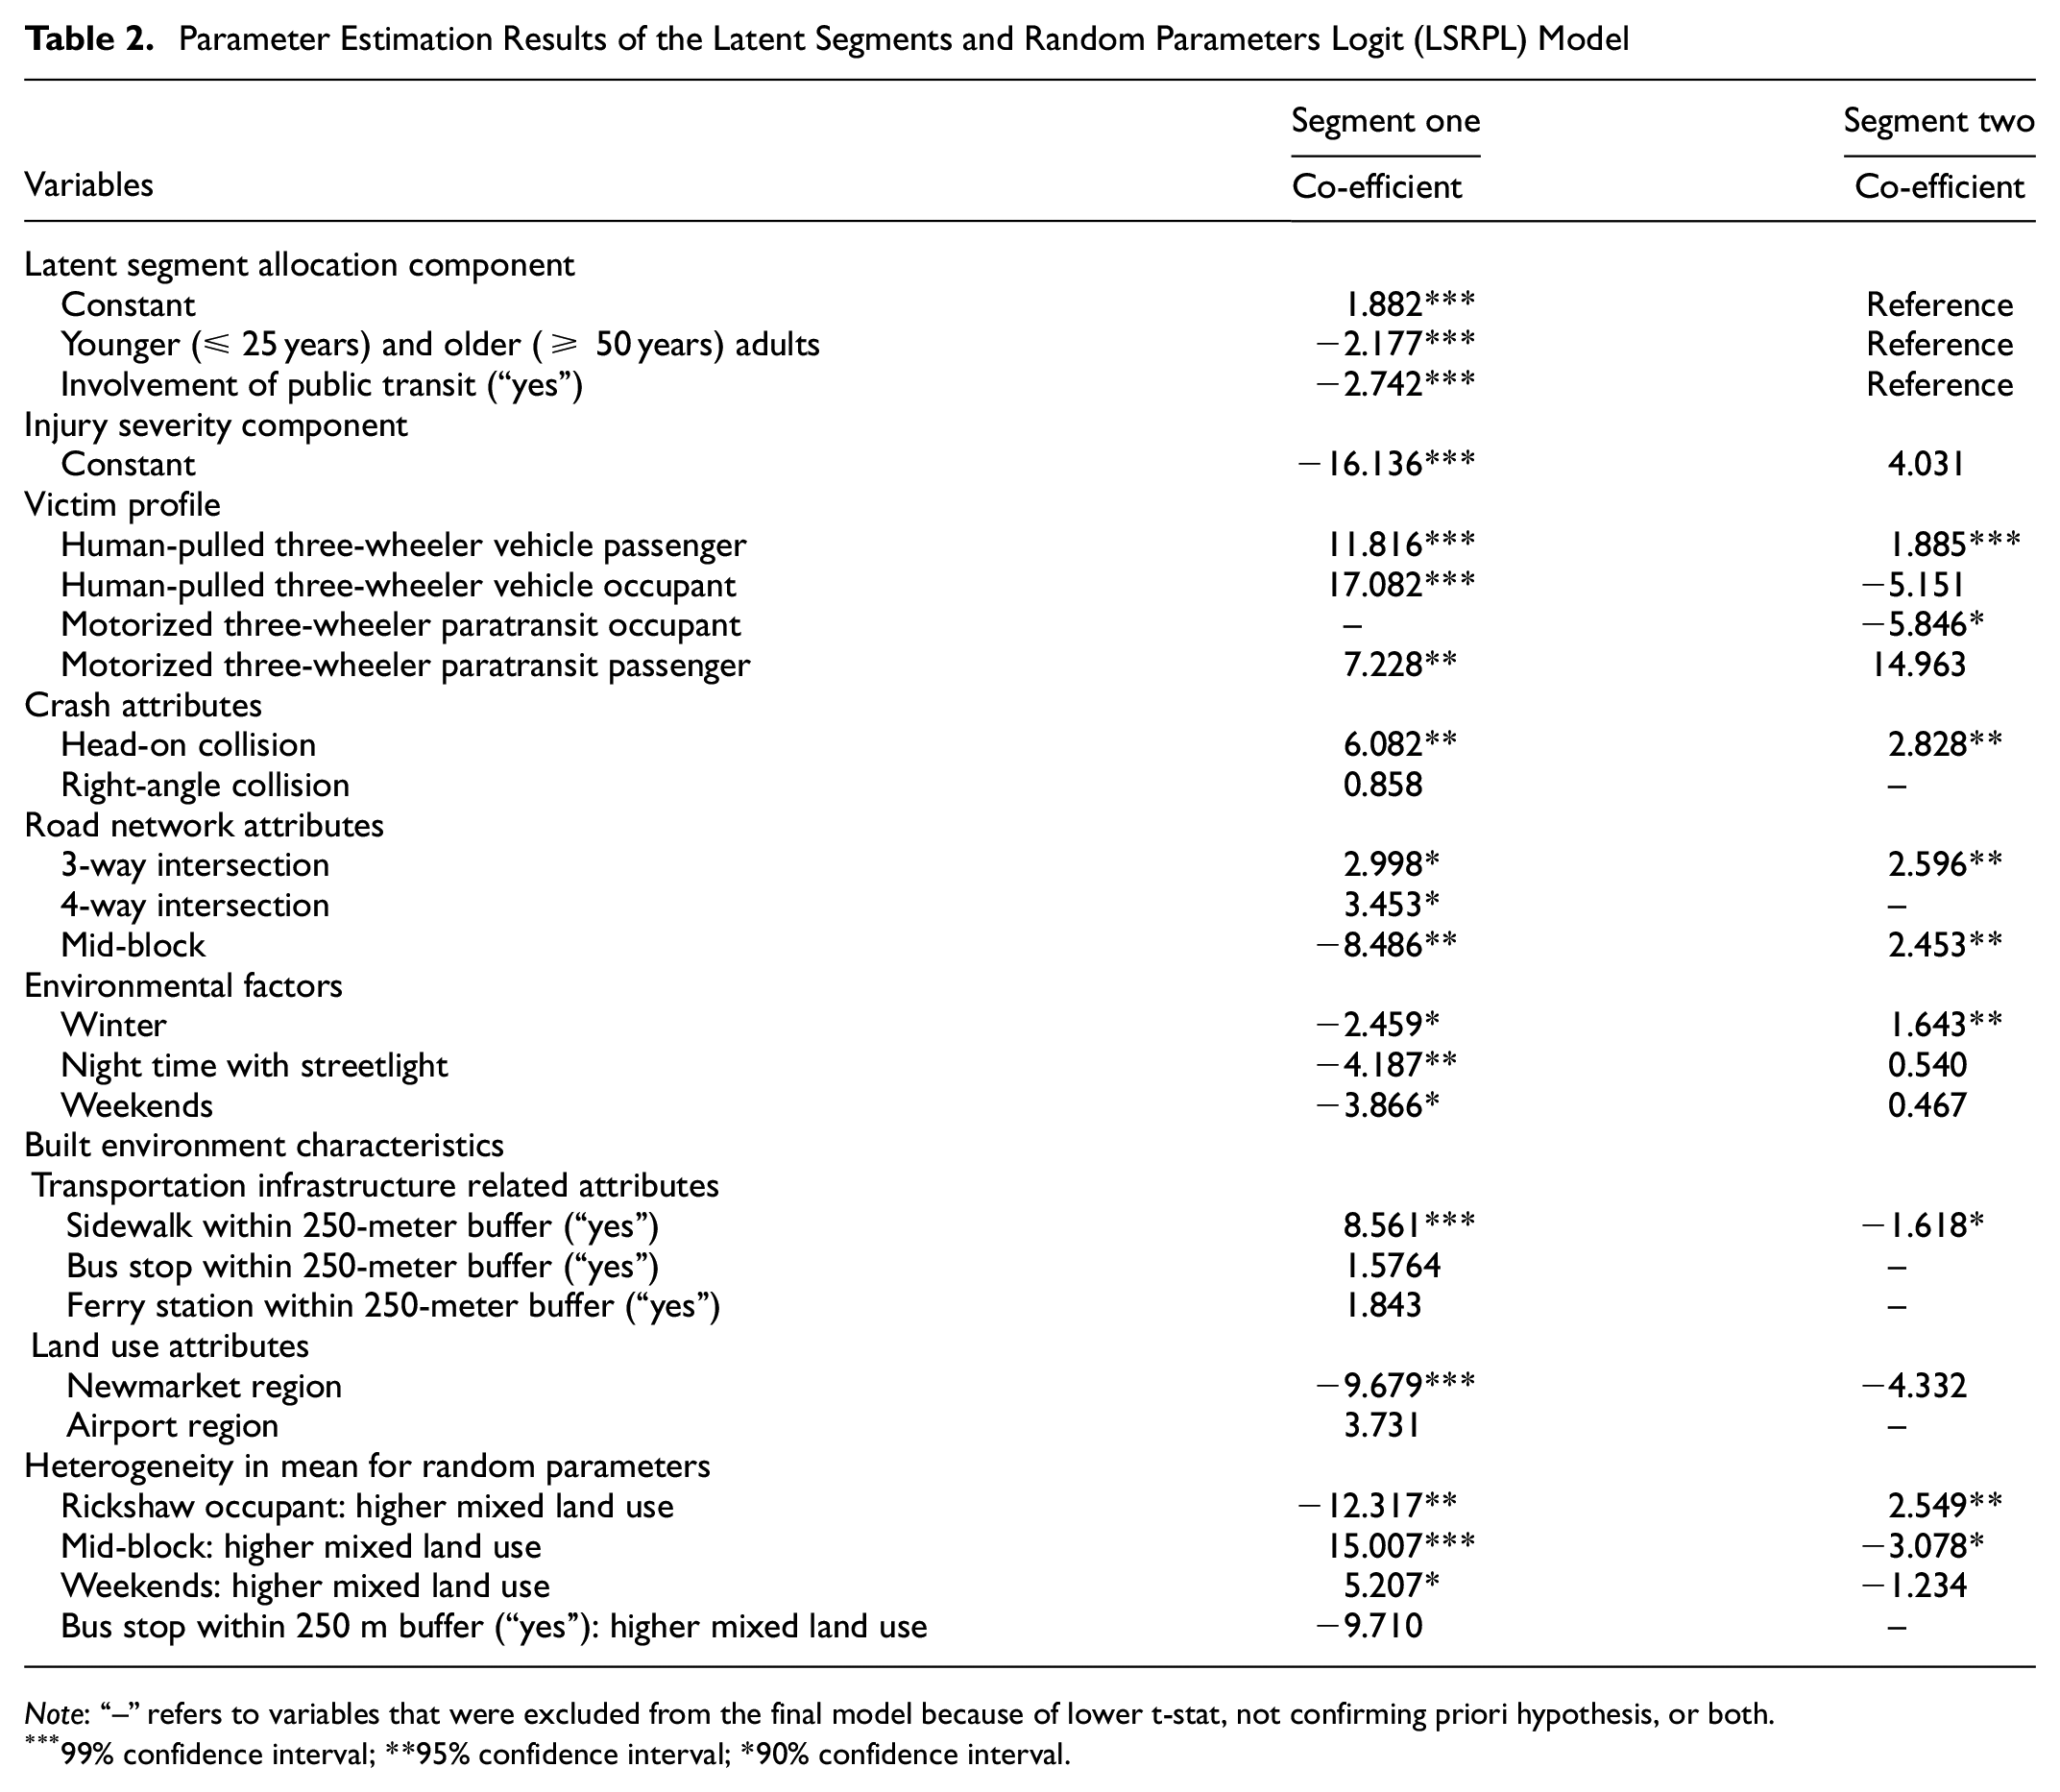
Note: “–” refers to variables that were excluded from the final model because of lower t-stat, not confirming priori hypothesis, or both.
99% confidence interval; **95% confidence interval; *90% confidence interval.
Discussion of Parameter Estimation Results
Table 2 reports the parameter estimation results of the LSRPL model. The model results suggest that types of UVO, crash attributes, environmental factors, road network attributes, and land use and transportation infrastructure attributes significantly influence the injury severity of UVOs. For example, passengers of human-pulled three-wheeler vehicles (or “rickshaw” hereafter) show a positive relationship. This might imply that rickshaw passengers have a higher likelihood of sustaining severe injury as they are exposed and unprotected as there are no seatbelts and nothing to hold on to in a rickshaw. The passengers therefore have a higher risk of being thrown from the vehicle during a crash, potentially leading to head injury. In the case of the variable representing rickshaw occupants that includes both rickshaw pullers and passengers, the model results confirm heterogeneity across the two segments. Rickshaw occupants show a higher likelihood of sustaining severe injury in segment one. On the other hand, a negative relationship is found for segment two, which is identified as higher injury severity risk segment that includes younger and older adults involved in collisions with public transit. Interestingly, the model confirms intra-segment heterogeneity for rickshaw occupants in reference to the variable representing higher mixed land use. This might imply that rickshaw occupants are more likely to experience severe injury in higher mixed land use areas. Higher mixed land use has higher traffic volume and congestion, where public transit might compete with other vehicles such as unconventional vehicles. As a result, rickshaw occupants might be at a higher risk in higher mixed land use areas. The variable representing motorized three-wheeler paratransit (or “tempo” hereafter) occupants that includes drivers and passengers shows a lower likelihood of sustaining severe injury. While only tempo passengers are tested, the model confirms a positive relationship implying that tempo passengers have a higher likelihood of sustaining severe injury. This is expected, as tempo passengers do not face forward—rather they sit sideways, do not have any seat belt or any platform to hold on, and they board and alight the vehicle through an opening in the back that does not have any door.
Among crash attributes, head-on collisions are found to show a positive relationship. Head-on collisions involve vehicles hitting the front-end of each other while approaching from the opposite direction, resulting in significant damage to the front part of the vehicle and intrusion into the occupants’ compartment, aggravating the injury severity of the vehicle occupants ( 40 ). Moreover, head-on crashes often involve vehicles crossing the centerline and drivers losing control of their vehicles; thus increasing severity of the injury ( 41 ). In such crash scenarios, the vehicle occupants might sustain severe injury—specifically the UVOs are more vulnerable as they are not protected by the vehicle body and do not have seatbelts. Another variable, representing right-angle collisions, reveals a positive relationship. Right-angle collisions involve vehicles traveling in perpendicular directions where the front of one vehicle hits the side of another. Such crashes often occur because of one of the vehicles violating the traffic signal or failing to yield the right of way. Therefore, such right-angle crashes might result in higher injury severity.
The model also confirms the impact of road configuration attributes on injury severity. For example, victims have a higher likelihood of sustaining severe injury at three-way intersections. At four-way intersections, victims reveal a similar positive relationship. The variable representing collisions occurring at mid-block section of the roads confirms heterogeneity across the segments and within the segments. For example, mid-block crashes show a higher likelihood of resulting in severe injury in segment two, which is identified as the higher injury severity risk segment involving younger and older victims engaged in crashes with transit. At mid-block, larger vehicles such as transit vehicles may operate at a higher speed and may have a higher impact on the younger and elder victims traveling in relatively slower unconventional vehicles. However, the model confirms intra-segment heterogeneity for higher mixed land use. For mid-block crashes, the variable representing higher mixed land use reveals a lower mean. In the case of higher mixed land use areas, congestion may pose restrictions to accelerating vehicle speed, lowering the likelihood of severe injury in the mid-block road sections. On the other hand, mid-block crashes show a negative relationship in segment one, which is identified as the lower injury severity risk segment.
Several environmental factors are found to influence the injury severity of UVOs. The model confirms significant heterogeneity across and within the segments. Collisions during winter show heterogeneity across the two segments. Higher injury severity risk victims in segment two are found to have a higher likelihood of sustaining severe injury in winter. In contrast, the same variable results in lower probability of severe injury for victims in segment one, which includes lower injury severity risk victims. Similar inter-segment heterogeneity is found for the variable representing collisions occurring during night time with streetlights turned on. Despite the lower visibility in winter and night time, lightweight vehicles may impose lower impact on the less vulnerable UVOs in segment one, which might explain the lower probability of severe injury in segment one in winter and night. Crashes during weekends show a negative relationship in segment one, which includes lower injury severity risk victims. Interestingly, this variable shows significant heterogeneity in mean value. For weekend crashes, higher mixed land use has a higher mean. Traffic is lighter on weekends than on weekdays, specifically in the higher mixed land use areas. With lower traffic volume, vehicles might travel at a higher speed, resulting in more severe injury.
Among the land use attributes, characteristics related to transportation infrastructure, such as presence of sidewalk, show heterogeneity across the two segments. For example, presence of sidewalk shows a negative relationship in segment two. In contrast, a positive relationship is found in segment one. The variable representing presence of bus stop closer to the crash location shows a higher likelihood of resulting in severe injury. This variable shows heterogeneity in mean value for higher mixed land use areas. Locations closer to bus stops in higher mixed land use areas are more likely to have vehicles at a lower speed, which might result in less severe conflict between the comparatively slower moving unconventional vehicles with other vehicles. This study tests the effects of collisions occurring in different regions of Dhaka city. For example, collisions occurring in the Newmarket region have a lower likelihood of severe injury. Traffic congestion is higher in the Newmarket region because of the presence of multiple major shopping centers, which might reduce the probability of severe injury. Furthermore, collisions occurring in the Airport region have a higher likelihood of resulting in severe injury. One of the major arterials connecting the north and south ends of Dhaka passes through the Airport area. This is one of the higher speed roads in Dhaka, where conflicts between higher speed vehicles with lower speed unconventional vehicles might result in severe injury.
Conclusion
This paper develops a hybrid LSRPL model to investigate injury severity of UVOs. The model utilizes five years of police-reported crash data from Dhaka, Bangladesh—a developing country in the South-East Asia. One of unique features of the LSRPL model is to capture multi-dimensional unobserved heterogeneity by assuming a discrete and continuous distribution of the parameters. A segment allocation model is formulated within the LSRPL to capture heterogeneity by allocating victims into discrete latent segments—that is, inter-segment heterogeneity. Further heterogeneity is captured by allowing a continuous distribution of parameters over the victims within the segment—that is, intra-segment heterogeneity. This study focuses on the injury severity of UVOs which include the occupants of human-pulled three-wheeler vehicles, motorized three-wheeler taxis, and motorized three-wheeler paratransit.
The goodness-of-fit measures of the LSRPL model suggest that the two-segment model fits the data best. The segment allocation model is estimated based on the victim profile and the vehicle type involved in the collision with the unconventional vehicles. The model results suggest that younger (i.e., aged 25 years or less) and older victims (i.e., 50 years or more), and collisions involving public transit have a higher likelihood to be allocated to segment two, which is identified as the higher injury severity risk segment. In contrast, segment one is identified as the lower injury severity risk segment. The model results of the injury severity component suggest that unconventional vehicle types, crash attributes, environmental factors, road network attributes, and transportation infrastructure and land use attributes significantly affect injury severity. Among the unconventional vehicle types, human-pulled three-wheeler vehicle and motorized three-wheeler paratransit passengers have a higher likelihood of sustaining severe injury. Crash attributes such as head-on and right-angle collisions, and road network attributes such as three-way and four-way intersections have a positive effect on severe injury. The model confirms significant heterogeneity across the segments. For example, mid-block crashes are more likely to result in severe injury in the higher injury severity risk segment involving younger and older victims. On the other hand, the same variable shows a negative relationship for the lower injury severity risk segment. Similar inter-segment heterogeneity can be found for variables representing collisions occurring during winter, night time, and weekends. Furthermore, the model confirms the existence of intra-segment heterogeneity in relation to the variable representing higher mixed land use. For example, in the case of mid-block crashes, higher mixed land use shows a significantly lower mean, revealing intra-segment heterogeneity. This implies that mid-block crashes occurring in higher mixed land use areas are less likely to yield severe injury in the high-risk segment. Higher mixed land use shows intra-segment heterogeneity for variables representing rickshaw occupants, and crashes occurring during weekends and closer to a bus stop. There are some limitations of this study. In this study, fatal and major injury are included in “severe injury” and minor and no injury are included in “non-severe injury.” However, because of this aggregation, this model is not sufficiently sensitive to distinguish between no injury, minor injury, major injury, and fatal injury. This is identified as a limitation of this study. In the case of model results, some of the variables retained in the final model are not statistically significant, which might be because of the smaller sample size. However, these variables confirmed the priori hypothesis and have important policy implications. As a result, they were included in the model with the assumption that they might be significant while tested using a larger sample size. Built environment attributes have been generated using a 250 m buffer area, however, the sensitivity of different buffer sizes and their impact on injury severity outcomes have not been explored. Distance between two intersections was not tested, which is identified as another limitation of this study. Future research should explore the effect of distance of collision location from the intersection on injury severity. Variables representing sidewalk and its availability for pedestrians to walk were not tested because of the unavailability of such datasets. Therefore, it is recommended to maintain GIS databases for active transportation network for Dhaka, which will enable future studies to test the effects of sidewalk and its availability on injury severity of collision.
The findings of this study will assist road safety engineers and planners to develop effective plans and policies targeting the safety of UVOs. For example, passengers of human-pulled three-wheeler vehicles and motorized three-wheeler paratransit have a higher risk of sustaining severe injury. Generally, in human-pulled three-wheeler vehicles and motorized three-wheeler paratransit, passengers do not have a seatbelt or handlebar to ensure their safety. Moreover, passengers in motorized three-wheeler paratransit use an opening in the back for boarding and alighting which exposes them to greater risk of higher injury severity. This illustrates the need to develop policies and enforce the integration of safety features such as seat belts and handlebars for the passengers of unconventional vehicles. Mid-block crashes are more likely to yield higher injury risk to younger and older populations involved in collisions with public transit, specifically in lower mixed land use areas. This implies the need to develop safety audits or safety reviews of the mid-block sections of the roads in the lower mixed land use areas. It further illustrates the need for the inclusion of safety features in unconventional vehicles and an awareness program for drivers of heavy vehicles such as public transit that might reduce injury severity of UVOs when in conflict with vehicles traveling at higher speeds in mid-block areas. Further, the heterogeneity confirmed in this research provides evidence supporting the need to accommodate such heterogeneity within road safety policies.
Footnotes
Acknowledgements
The authors would like to thank the University of British Columbia for its financial support. The authors would like to thank the Accident Research Institute (ARI) of Bangladesh University of Engineering and Technology for providing police-reported crash data. The authors would also like to thank the Rajdhani Unnayan Kartripakkha for providing the GIS-based built environment and land use information.
Author Contributions
The authors confirm contribution to the paper as follows: study conception and design: B. Saha, M. R. Fatmi; data collection: B. Saha, M. M. Rahman; analysis and interpretation of results: B. Saha, M. R. Fatmi; draft manuscript preparation: B. Saha, M. R. Fatmi. All authors reviewed the results and approved the final version of the manuscript.
Declaration of Conflicting Interests
The author(s) declared no potential conflicts of interest with respect to the research, authorship, and/or publication of this article.
Funding
The author(s) disclosed receipt of the following financial support for the research, authorship, and/or publication of this article: The University of British Columbia.