
Abstract
In complex urban environments, sophisticated analytical techniques are essential to improve the accuracy of transportation modeling and the precision of travel time predictions. This research endeavors to critically examine various multi-zone centroid positioning strategies, with the goal of unveiling the method that most authentically represents the dynamics of urban travel. Anchored by a comprehensive case study of the city of Istanbul in Turkey, the investigation utilizes various analytical tools meticulously tailored to account for the intricate interplay of demographic and geographic variables. This methodical approach enables the identification of optimal centroid locations by evaluating various methods, including a novel approach called kernel density estimation (KDE), as well as five other established other methods. The results are then aligned with real-world travel time data through rigorous statistical analysis to ensure accurate predictions of travel times. The KDE method demonstrated its more acceptable correlation coefficient and lower mean absolute error, root mean square error, and mean absolute percentage error metrics, establishing its superiority in model performance. By highlighting the paramount importance of accurately placed centroids within urban transportation models, this research’s findings contribute significantly to the evolution of transportation planning methodologies and the advancement of urban mobility models through a comparative analysis of optimal methods.
Keywords
Transportation planning is crucial for urban development and sustainability. The urbanization of the early 20th century, characterized by increased population density and vehicle ownership, highlighted the importance of careful transportation planning ( 1 ). Transportation significantly affects quality of life, social mobility, and economic efficiency. Therefore, rigorous and realistic transportation planning is essential for fostering sustainable urban environments ( 2 – 4 ).
The methodologies used in transportation planning require various concepts and assumptions to model urban mobility accurately. Among these concepts, “zones” represent specific geographical or administrative areas, while “centroids” are key points modeled as the origin and destination of journeys. “Connectors” are hypothetical nodes that link centroids to the road network (see Figure 1). Zones are commonly determined by existing administrative boundaries or variants, which are justifiable based on different socio-cultural structures of administrative regions. Connectors link centroids to the road network based on the centroid’s location and the network’s configuration. Centroids represent zones at a singular point ( 5 ). The primary challenge encountered here is the accurate placement of these centroids.
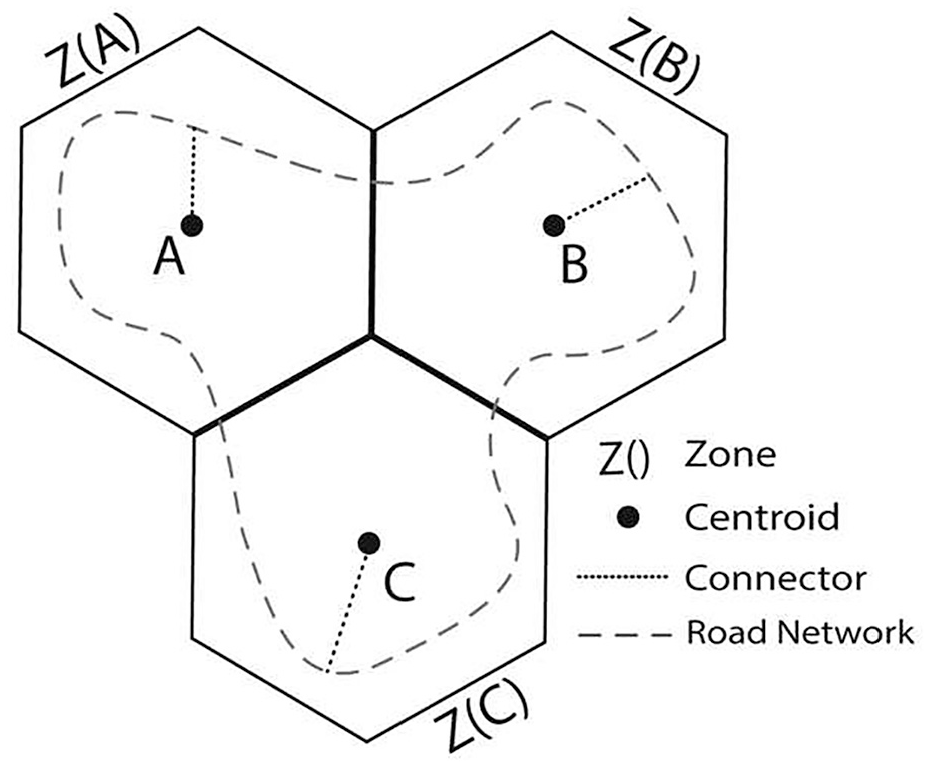
Illustration of the concept of zone, centroid, and connector.
Studies indicate that centroid locations obtained through theoretical approaches or general assumptions may not be suitable for creating realistic mobility models. Determining zone centroids is a complex process influenced by various factors, such as the geographical characteristics of the zone, population density, and transportation infrastructure complexity. This challenge is one of current research’s most critical and under-defined assumptions. Methods for determining zone centroids involve selecting locations based on the polygonal center, gravity center, development center, or the center of the road network. However, these methods often need to be empirically analyzed and are based solely on theory. Consequently, estimated distances between zones, travel times, and journey lengths can deviate significantly from actual values. Even a tiny miscalculation in these estimates can significantly affect transportation planning in a metropolitan area where millions of trips occur. In other words, the concept of centroids, as examined within the realms of transportation planning, transportation engineering, and urban planning, varies significantly across studies and is often predicated on differing assumptions. This divergence highlights a critical research gap, as there is a notable lack of comparative analysis of centroid methods and their respective advantages and disadvantages. Our study seeks to fill this gap by rigorously investigating the optimal location and positioning of centroids.
The challenge is that achieving perfect accuracy in centroid placement is unattainable with both existing and newly proposed methods. Therefore, this research focuses on identifying which methods can minimize errors most effectively. By systematically comparing real-world data, the study aims to offer substantial insights into the methodological variations of centroids and the consequent impacts on travel predictions. Understanding these dynamics is crucial, as it enables transportation planners and engineers to select the most appropriate methods, thereby reducing errors and enhancing the accuracy of their models. This research not only aims to determine the best practices for centroid placement but also seeks to understand the implications of different methods on the overall reliability of transportation models. The contribution to the literature is significant, as it underscores the importance of minimizing errors to achieve more accurate predictive outcomes, ultimately informing better decision-making in transportation planning and policy development. This work aims to reduce uncertainty in transportation planning by determining the optimal location of centroids through empirical analysis. To achieve this, we present an analytical approach that models inter-zone distances, travel times, and trip lengths more accurately. Advanced technology and analytical techniques can significantly enhance the precision of future transportation planning forecasts. A new method for centroid localization using kernel density estimation (KDE) is proposed and compared with other methods in this study.
The flowchart for the study is presented in Figure 2. In addition to the existing data about roads and zones utilized in transportation planning, it is imperative to incorporate information pertaining to buildings. Such building information can be readily obtained from municipal-state open-source data or OpenStreetMap data, as well as through various other approaches ( 6 ). Although more detailed data were employed for the purposes of testing the methodologies presented in this study, it is nevertheless considered that only the building footprints could be used in cases where these detailed data are not available or the workload is excessively high. The data can be used to assign information on road networks and buildings to zones, thus facilitating the straightforward incorporation of zone data alongside that on roads and buildings (via the spatial join attribute function). Furthermore, the generation of a road network dataset from the road data allows for the derivation of origin–destination (OD) matrices between zones based on time and distance scales among all estimated centroids. The centroid locations are estimated using zone-based road and building data, as detailed in the methodology section, and OD matrices are calculated separately. To evaluate the precision of the outcomes yielded by the six distinct methodologies, it is essential to ascertain the mean travel times between zones. To this end, data from prior household surveys were leveraged. These surveys also encompassed inquiries pertaining to travel times by private vehicles, facilitating the acquisition of sufficient sample sizes for the calculation of mean travel times between zones. It was then assumed that these results accurately reflected actual OD times. To assess the centroid methods, all OD times were aggregated, and statistical analyses were conducted to identify the most optimal locations.
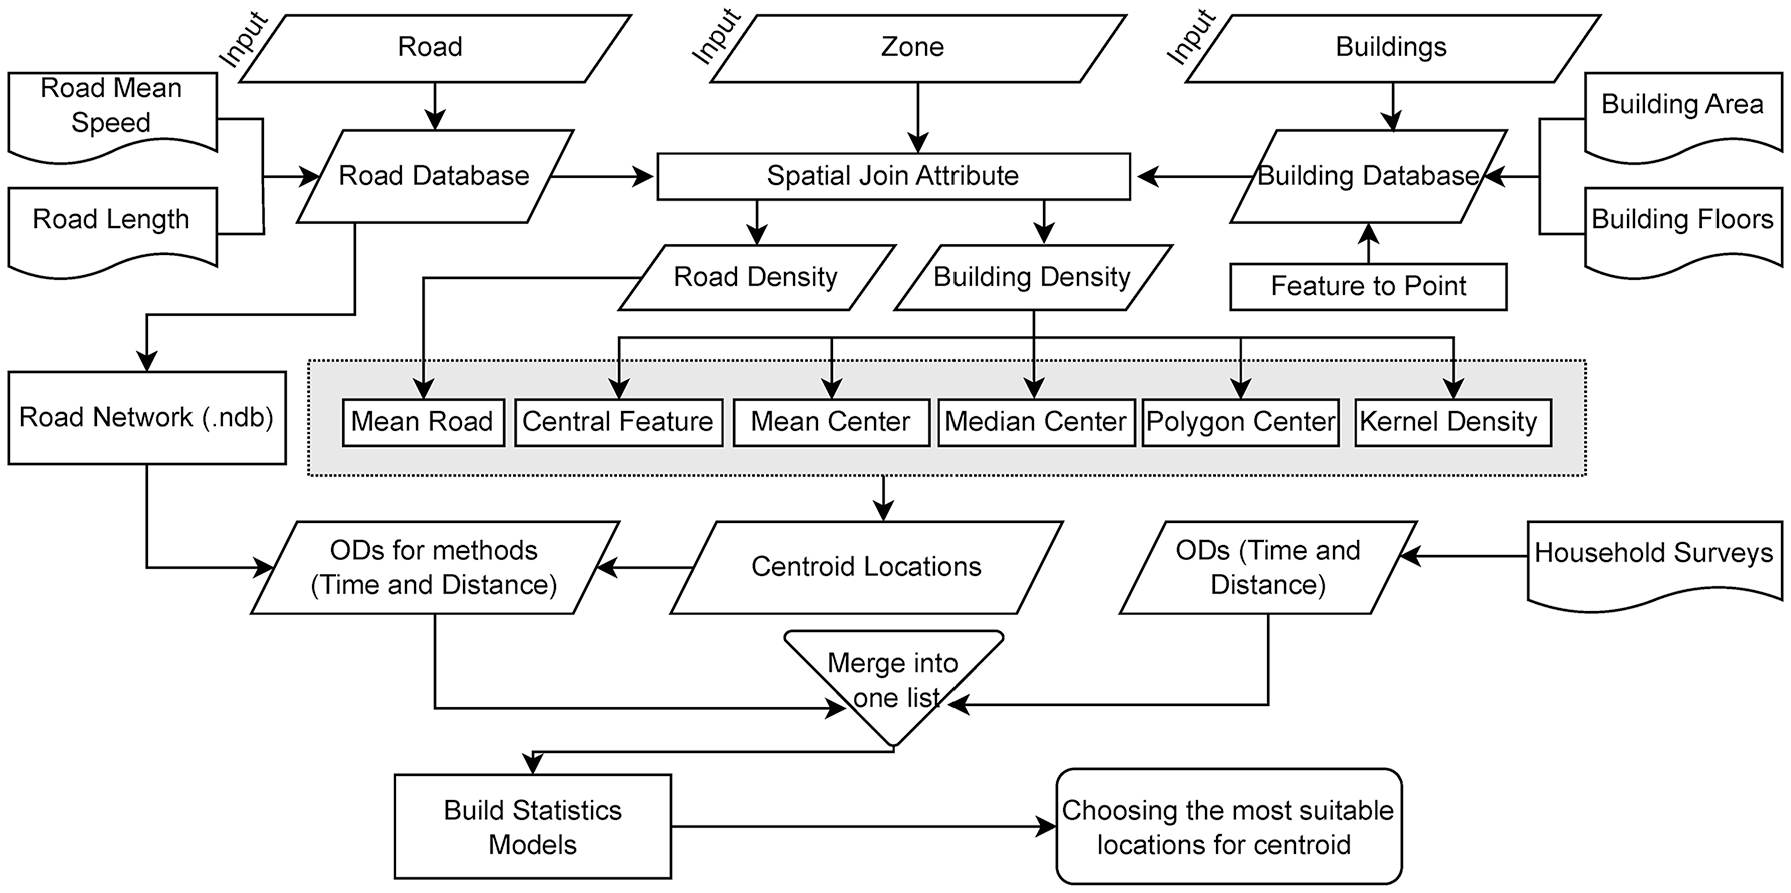
Workflow for selecting the optimal location of the zone centroid.
The concept of a centroid is a strategic element in transport planning. It enables the analysis of travel demands aggregated from geographical regions to a single point. This point also simplifies modeling processes by positioning settlements or population density centers as effective centers of gravity, reducing the complexity of the transportation network. Centroids function as virtual nodes associated with population density and economic activity. They play a critical role in the analysis of travel flows, time calculations, and network demand algorithms ( 7 – 11 ). Centroid positioning methods, introduced by classical transportation theories, have evolved with the increasing complexity of urban structures and technological advances. There has been a significant shift from theoretically grounded assumptions to experimental and numerical techniques ( 12 – 15 ). The expansion of theoretical frameworks and the increasing complexity of applied studies characterize this methodological development. It has also encouraged researchers to delve deeper into urban transport dynamics, resulting in improved accuracy of trip forecasts ( 16 ).
Previous studies have concentrated on improving trip prediction accuracy through various aspects of transportation modeling, specifically focusing on zoning, centroid locations, and centroid connectors. Zoning involves dividing a study area into smaller, more manageable regions to allow for detailed analysis of travel patterns within and between these zones ( 17 – 19 ). Also, more homogeneous zone structures enhance the precision of the results ( 20 , 21 ). In addition to zoning, the configuration of centroid connectors, which are the artificial links connecting centroids to the transportation network, has been a significant area of investigation. Different connector configurations can greatly affect the accuracy of trip assignment models. Researchers have examined the placement and number of centroid connectors, proposing various methods to optimize their configurations for enhanced model accuracy ( 21 – 23 ). These studies have explored methods for generating connectors in transport planning models, highlighting the effects of different configurations on traffic flow predictions. Additionally, the impacts of centroid connectors on transit assignment outcomes and static traffic assignment have been studied, providing insights into how to optimize connector selections to improve model fidelity ( 23 – 25 ). For centroid locations, studies concentrating on centroids often use the “gravity” model, positioning centroids based on activity centers. However, this approach may need to pay more attention to the impact of residential areas, resulting in additional data and workload ( 26 ). Integrating housing weights into the system can be crucial in improving the accuracy of trip forecasts. Studies that use raster data of population densities offer utility at specific scales but face limitations for city-scale applications ( 8 , 27 ). This limitation is a result of the assumption of homogeneity of all areas within a pixel size, which could overlook dense or vacant areas. Several methodological approaches have been proposed in the literature to enhance travel time predictions through ZIP codes ( 28 ). These include centroid finding methods based on polygon centers and density-based positioning studies ( 11 , 15 , 17 , 20 , 21 ). The studies aim to develop or improve methods with accepted accuracy. In a study employing advanced spatial analysis, researchers utilized Kriging analysis, which shares analogous features with kernel density analysis. The study suggests that determining the general centroid location in static zoning structures is unnecessary, except in specific cases such as events in public transport ( 29 ).
Further comparative analysis and numerical validation of different methods are necessary to improve the accuracy of centroid positioning. Most existing research focuses on improving individual techniques, highlighting the absence we aim to address. Our investigation seeks to determine the optimal strategy for centroid location that produces the most advantageous outcomes. This scholarly work aims to reduce the gap by rigorously evaluating and comparing various approaches to centroid determination. This will contribute to improving precision in urban planning and transportation model accuracy. The city of Istanbul in Turkey was chosen as the location for testing and comparing methodologies because of its large sample size (the daily number of trips is nearly 30 million) and availability of open-source data. This accessibility enables the availability of standard-compliant datasets for both analysis preparation and testing.
Methodology
The proposed procedure introduces an analytical framework for determining the optimal locations of centroids in transportation planning. This framework considers zones’ demographic and physical characteristics, including building density and road network features, in a comprehensive and detailed approach. The centroid determination methods, implemented in ArcGIS Pro 3.1, involve meticulous preparation and processing of weighted datasets.
Building density in this study is calculated using a detailed methodology that considers both the number of floors and the total floor area in square meters. Initially, building data, including the number of floors and total floor area, is collected. Each building is then converted into a point representation to facilitate further analysis. This point-based approach allows for a more granular and precise analysis of building density. To achieve this, the buildings are first represented as points within a spatial database. Each point is assigned a weight based on the building’s attributes, specifically its floor count and total floor area. The weight reflects the building’s contribution to the overall density, with taller buildings and those with larger floor areas having higher weights. This weighted point data is then used to perform spatial analyses, allowing for a more nuanced understanding of building density across the study area. By converting buildings into points and applying weights, the analysis becomes more manageable and precise, enabling the identification of density patterns that would be less discernible using traditional polygon-based methods. This approach not only enhances the accuracy of the density calculations but also improves the potential for subsequent spatial analyses and modeling. This methodology enables more accurate and detailed urban transportation network modeling by synthesizing quantitative and qualitative data. Methods for determining centroids include “central feature,”“mean center,”“median center,”“polygon center,”“mean road,” and the newly proposed KDE method. Each method has its advantages and limitations that depend on the intrinsic properties of zones and structural characteristics of the road network. Combining these methods provides a broader perspective by highlighting different aspects of the transportation network.
The Central Feature Method
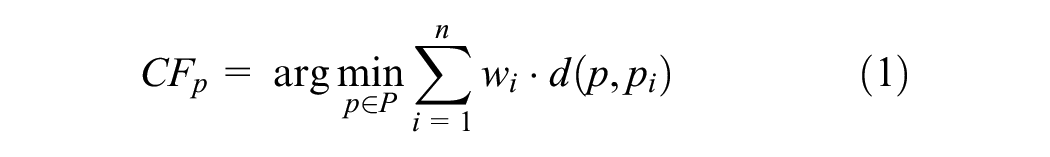
This method is used to identify the central feature and involves defining the centroid for each point and minimizing the weighted average distance. This process determines the central feature. The objective of equation 1 is to minimize the sum of the product of the weight of each point and its distance to the center of the zone:
where
The Mean Center Method
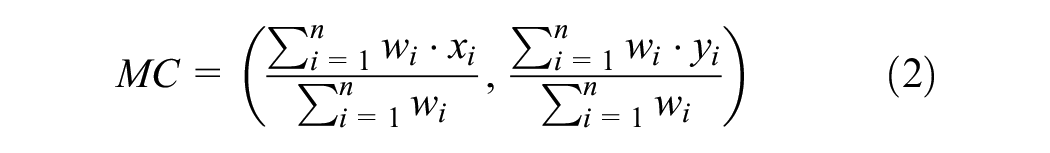
This method calculates the weighted arithmetic mean of point data to determine the zone’s weight center (Equation 2):
where
The Median Center Method
This method finds the median center within a zone by minimizing the total weighted distance (Equation 3). It calculates the Euclidean distance between
The Polygon Center Method
This method, on the other hand, calculates a polygon’s geometric center, often defined as the polygon’s “center of gravity” (Equation 4). This is calculated using the area of the polygon segment and the coordinates of the segment.

where
The Mean Road Method
This method calculates the center of gravity of a road network using road density data (Equation 5). The width and length of each road segment, along with their coordinates, are used in the calculation:
where
Kernel Density Estimation (KDE)
This method is a non-parametric method used to estimate the probability density function of a random variable by overlaying a kernel function, typically a symmetric and smooth function such as the Gaussian distribution, over each data point within a dataset ( 30 – 32 ). The kernel function has a specified width, known as the “bandwidth,” which controls the spread of the kernel around each data point ( 33 ). This process generates a continuous density estimate that can be used to interpret the shape of data distributions and identify areas of high density. The choice of the kernel function and the bandwidth parameter are crucial in KDE. The kernel function determines the shape of the influence each data point has on the density estimate, while the bandwidth parameter significantly affects the smoothness of the estimate ( 34 ). A smaller bandwidth can capture finer details in the data but may introduce noise, whereas a larger bandwidth provides a smoother estimate but may overlook smaller features.
In our study, we have identified a novel application of KDE for determining zone centroids. Traditional centroid determination methods may not fully capture the spatial heterogeneity of an area, especially in urban environments where building densities vary significantly. By applying KDE, we can obtain a more nuanced understanding of density distributions within zones, leading to more accurate and representative centroid placements. By overlaying kernel functions over point data representing buildings, and adjusting the bandwidth to reflect realistic urban densities, we can generate a continuous density surface. This surface can then be analyzed to identify optimal centroid locations that better reflect the actual spatial distribution of urban features, providing a more accurate representation of zones. The enhanced precision achieved through KDE allows for the creation of models that better reflect real-world conditions, thereby improving transportation planning and urban analysis. In our study, the application of KDE for centroid determination represents a significant advancement, offering new insights and improved methodologies for spatial analysis in urban planning and transportation systems.
Additionally, it is imperative to perform KDE separately within each zone. By conducting KDE individually for each zone, we can accurately assess the density distributions specific to each area. This method allows us to identify the peak density values within each zone, which represent the areas with the highest concentration of buildings or activities. The centroid location for each zone is then determined by selecting the point with the highest density value identified through KDE. This approach ensures that the centroid accurately reflects the most densely populated or utilized area within each zone, thereby enhancing the precision and relevance of the spatial analysis. KDE uses point data to analyze density distribution within a zone (Equation 6): .
where
K = the kernel function,
This methodological combination considers the characteristics of buildings and road networks to provide a more accurate representation of zones. Integrating these analyses offers a scope and precision unattainable by a single method. Specifically, examining and comparing methods based on building density and the physical characteristics of road networks enables the creation of models that better reflect real-world conditions for transportation planning. This study section emphasizes the methodology’s strengths in comprehending the intricate interactions between zones and road networks. This approach could improve the efficiency and effectiveness of transportation planning. The KDE method, previously not used for determining zone centroids, can be tested alongside existing centroid finding methods. Figure 3 presents a hypothetical example of data using building density to understand these methods better.

A hypothetical example of finding the centroid location in building density (The colored circles represent the centroids identified using the respective method, while the top-left visual illustrates all centroids.).
This study includes network analyses to test the outcomes derived from various methods. Network analyses and creating OD matrices are fundamental methods for calculating travel times between zones in transportation planning ( 35 ). A detailed transportation network model has been developed using ArcGIS Pro software’s advanced network analysis capabilities. This model calculates travel times between zones by integrating critical parameters such as average road speeds, lengths, one-ways, and vehicle paths. It employs these parameters to compute travel duration for each segment of the transportation network (Equation 7) ( 36 ):

where
This formulation provides a more realistic estimate of travel times by weighting each road segment according to dynamic conditions such as traffic density and speed limits. Additionally, the model includes constraints such as one-way roads and designated vehicle paths in the road network. This enhances the realism of calculated travel times by adding extra time for turning effects at road connections. OD matrices are generated based on these travel times, including the minimum travel time for each pair of zones:

where
To accurately calculate the OD matrices, a full assessment of all possible paths and alternative routes must be considered, along with the dynamics and interactions present within the transportation network. This comprehensive approach guarantees that the OD matrices offer the most precise representation of transportation patterns and behavior within the network. Users are assumed to seek the most significant benefit by selecting routes that allow them to reach their destinations in the shortest possible time.
Data
The case study uses various data types and data collection methods, focusing on Istanbul. Zones were delineated based on household surveys compatible with open-source data. Of the 39 districts in Istanbul, 38 were selected, excluding the Adalar district because it has limited access—it is an archipelago in the Sea of Marmara. Although the number of zones is limited, the evaluation of the accuracy of centroid methods remains meaningful. It is evident that increasing the number of zones would naturally result in smaller areas, which, in turn, would reduce the positional errors across all methods. However, for the purpose of testing the accuracy of the proposed and existing methods, the current 38 zones are sufficient to reveal the predictive trends of these methods. Thus, at this stage, the number of zones is adequate for comparative analysis.
Road networks were developed using average road speeds from various sources, including data from the 2012 Istanbul Transportation Master Plan. Road data played a crucial role in this study, serving dual purposes: firstly, in the methods used for determining centroids based on road density, and, secondly, in calculating the OD matrix travel times between centroids (see Figure 2). The road network dataset utilized encompasses detailed attributes such as road lengths and average travel speeds for each segment, providing a robust foundation for analysis. Furthermore, to enhance the realism and accuracy of the road network analyses, additional time costs were incorporated for turns at intersections. This adjustment acknowledges the delay typically encountered at intersections, thus improving the fidelity of the model. The entire analysis process was conducted using ArcGIS Pro software, which facilitated the integration and manipulation of spatial data. When assigning centroids that were not located directly on roads, a methodology was implemented to ensure they were connected starting from the nearest road, thus maintaining spatial accuracy in the model.
The OD matrix analyses were constructed on the premise that travelers would choose the route with the shortest travel time. This assumption aligns with the principle of cost minimization, where “cost” is quantified as travel time. The incorporation of real-world road network data, along with the adjustments for intersection delays, allowed for a more precise calculation of travel times, thereby improving the reliability of the OD matrices generated. This detailed and methodical approach ensures that the findings of the study are grounded in realistic travel behaviors and network conditions.
In addition, building data up to and including 2012 was matched with survey data, collecting information on completed buildings, their footprint, and number of floors. Advances in open-source data, remote sensing, and artificial intelligence have increased the accessibility and usability of such data in recent years. Figure 4 illustrates the macro-scale zones, building points, and roads of Istanbul derived from these datasets.
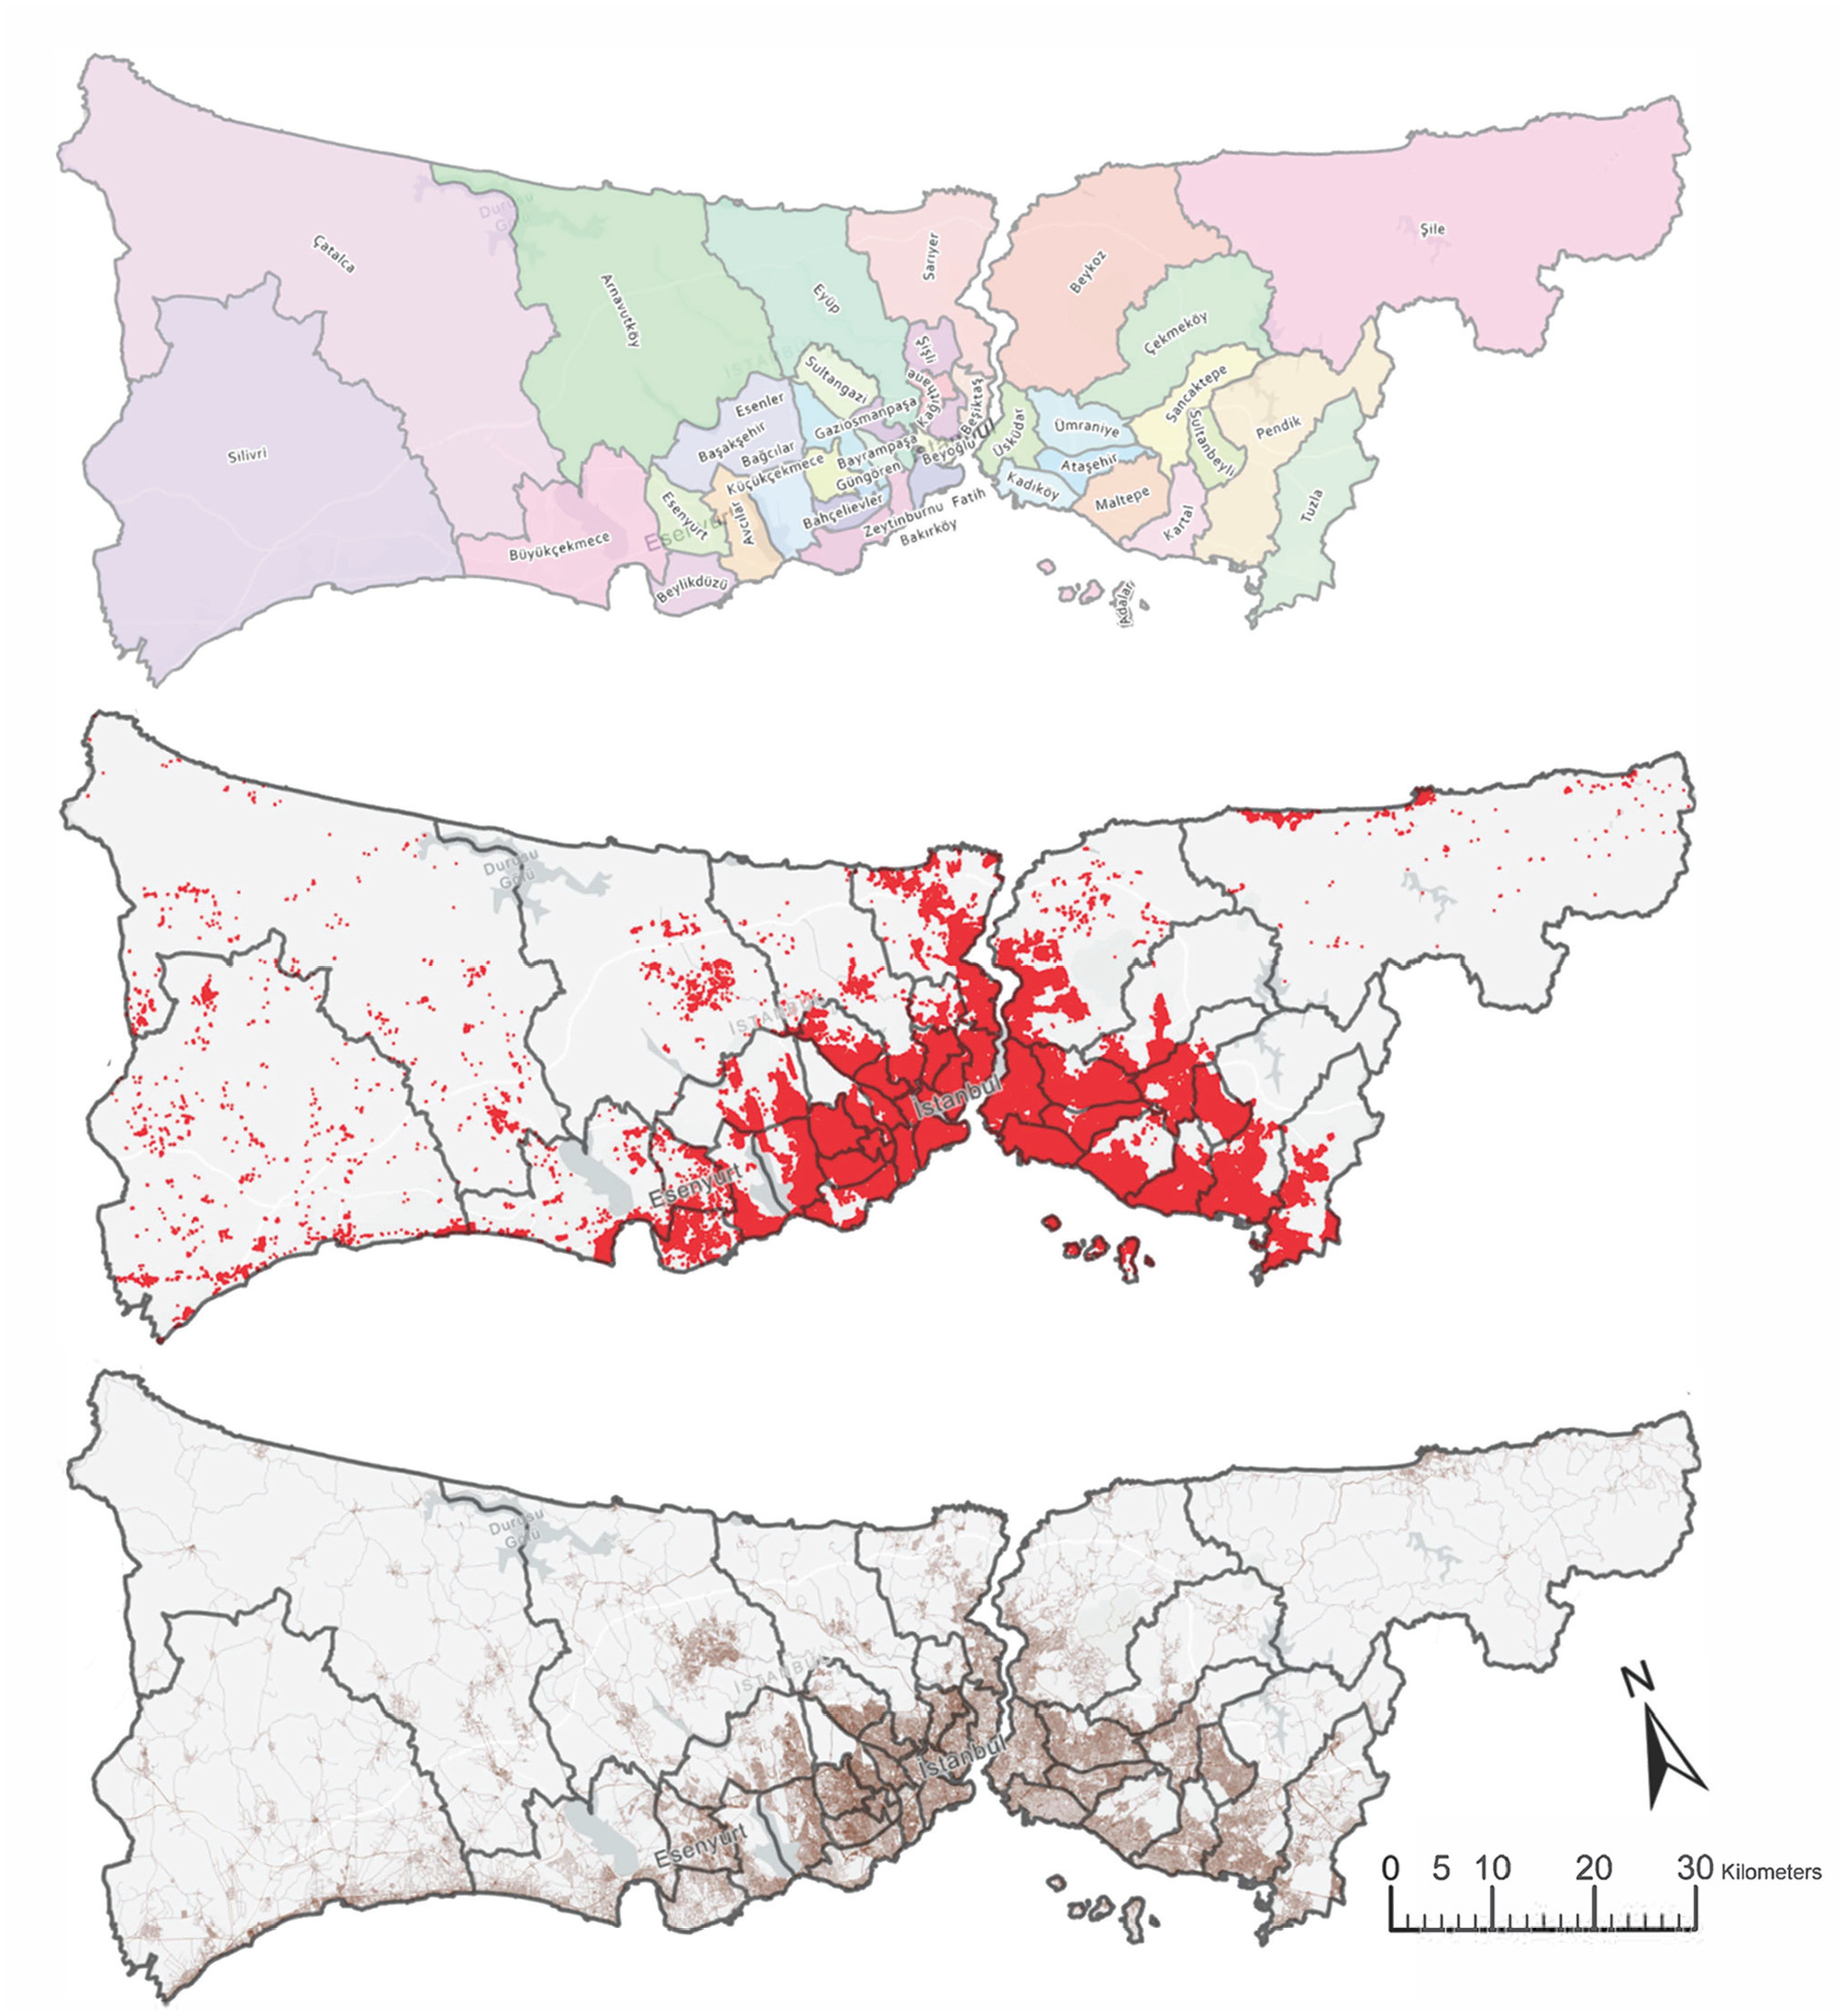
Istanbul study area with zones (top), buildings (middle), and road network (bottom) (2012).
Table 1 provides an overview of the data utilized for Istanbul in 2012. These data were disaggregated by districts within the study area to facilitate the necessary analyses. Examining Istanbul’s urban landscape reveals significant concentrations of development, particularly in the Bosphorus region (see Figure 4). In these densely populated areas, the districts used as zones are relatively small in area but exhibit high building density. Consequently, it is imperative to conduct separate density analyses for each zone and evaluate them individually to ensure accuracy. The analysis indicates that, as the size of the zones increases, the average travel times between OD pairs also rise. While smaller zones enhance the accuracy of OD travel time variables, it is more critical to focus on improving the overall methodology rather than solely adjusting zone sizes. Ensuring methodological robustness across varying zone sizes is essential for reliable outcomes.
Description of the Data
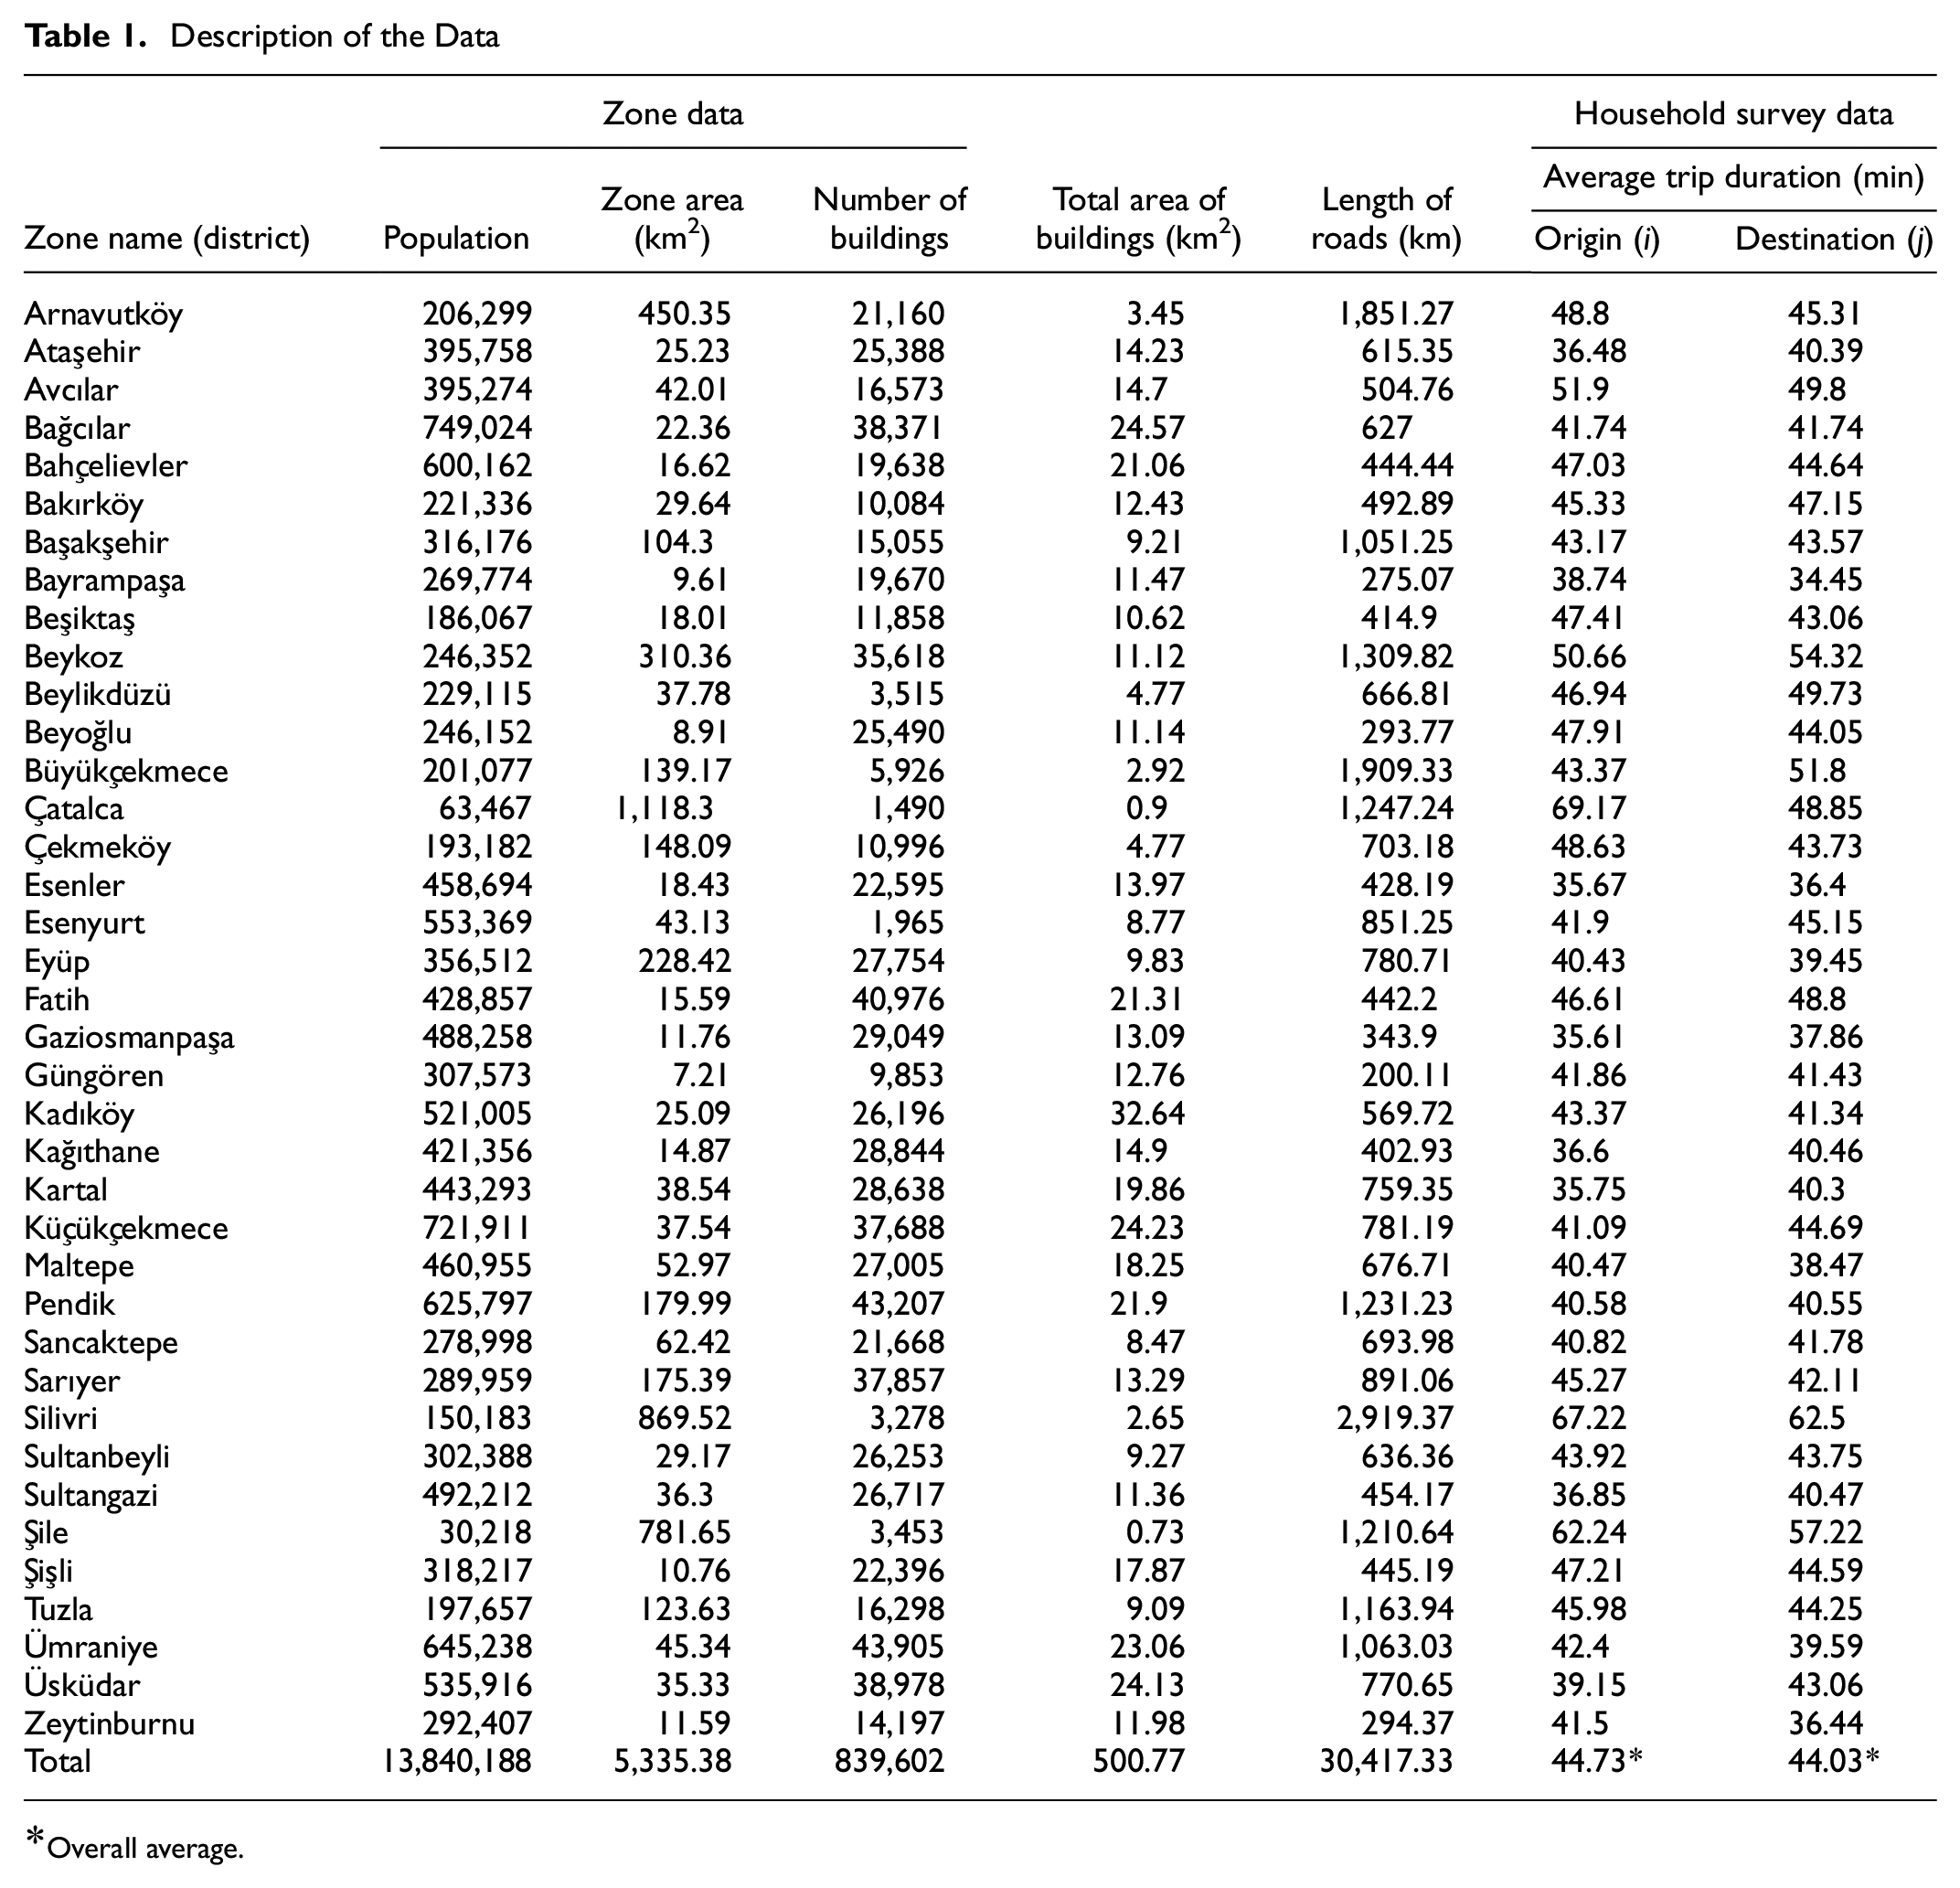
*Overall average.
Despite the substantial volume of data within the study area, recent advances in software and hardware have significantly expedited analytical processes. These analyses were efficiently conducted using a standard processor, such as the AMD Ryzen 7 4800H, without the need for additional processing power. This capability underscores the feasibility of performing complex spatial analyses within a reasonable timeframe, even with large datasets. Ultimately, this study emphasizes the importance of tailored density definitions and robust methodological improvements to enhance the accuracy and reliability of urban and transportation analyses by leveraging advancements in computational capabilities.
In the absence of data, the necessary dataset for these analyses can be obtained from Open Street Map data or through remote sensing and readily available deep learning libraries ( 37 ). Another central dataset used in this study includes household surveys conducted in 2012 as part of the Istanbul Transportation Master Plan, which are available through open sources ( 38 ). These surveys, tailored explicitly to private vehicle trips, were used to test the OD times projected by the new centroid locations using these actual travel data.
Analysis and Discussion
The foundational studies for this research were conducted using ArcGIS Pro 3.1, a comprehensive application with a suite of plugins and functions that can efficiently and reliably conduct advanced spatial analyses. Initially, 38 districts within Istanbul were designated as zones, incorporating buildings (polygons) and roads (lines) based on their locations within these zones (see Figure 4). To enable analysis, buildings were converted to points, and their square footage and number of floors were used to calculate the total building area. Road information, such as distance and number of lanes, was also included, with roads intersecting between zones segmented at the district boundaries. Centroid calculations were performed for each zone using mean center analysis with the road network and central feature, mean center, median center, polygon center, and kernel density analyses based on building densities. The kernel density analysis identified the highest density point within each zone as the centroid, assuming this point, where building density peaks, as the central point of the zone (see Figure 5).
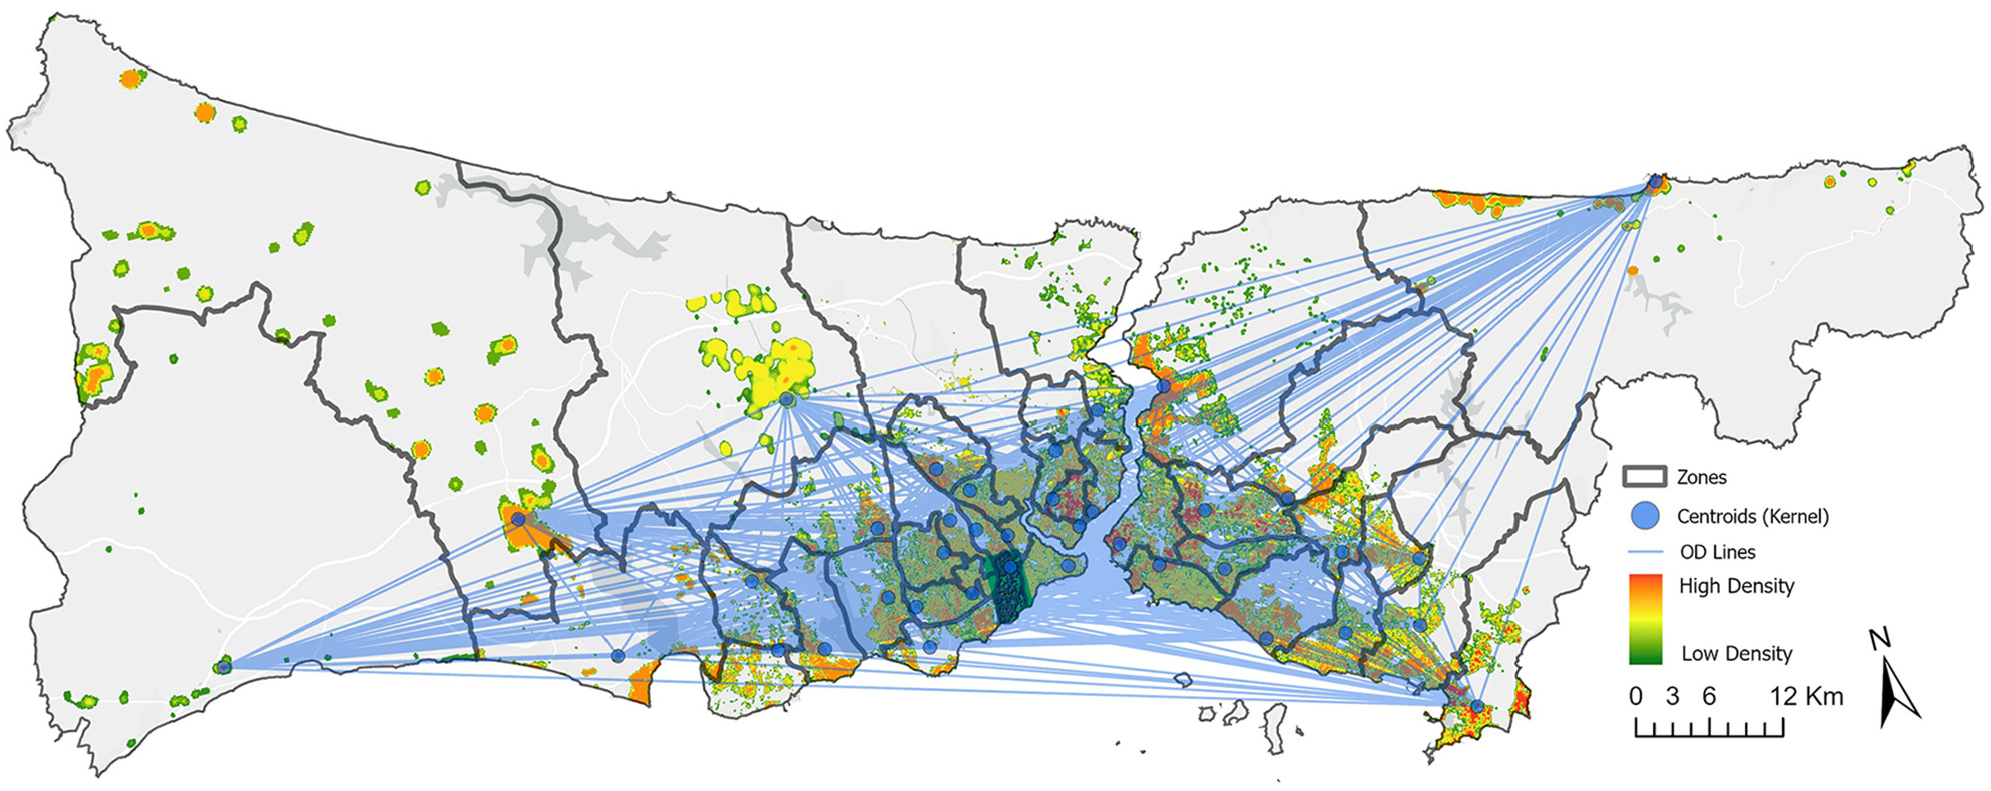
Kernel density centroid estimation and origin destination lines.
As shown in Figure 6, the centroid locations obtained through different methods require OD times for comparison. A comprehensive network database was constructed to accurately calculate OD times among centroids. This database was developed using detailed road network data, which included average road speeds and directions derived from open-source data provided by the 2012 Istanbul Transportation Master Plan. The inclusion of such detailed data ensures that the travel speeds and routes reflect realistic traffic conditions, thereby enhancing the reliability of the OD time calculations. The network database integrated various elements of the transportation infrastructure, such as road segments, intersections, and turn restrictions, to create a robust model of the urban road network. This model accounted for the spatial relationships and connectivity between different parts of the city, which is crucial for precise travel time estimation. Using this comprehensive network model, OD time and distance matrices were generated across all methods employed in the study. These matrices provided detailed information on the travel times and distances between all pairs of centroids within the study area. By considering factors such as road hierarchy, traffic congestion levels, and intersection delays, the matrices offer a nuanced view of the travel dynamics in Istanbul. The methodology involved advanced spatial analysis techniques and algorithms to compute the shortest paths and travel times between centroids. The resulting OD matrices were critical for subsequent analyses, including the evaluation of different centroid determination methods and their impact on travel time accuracy.
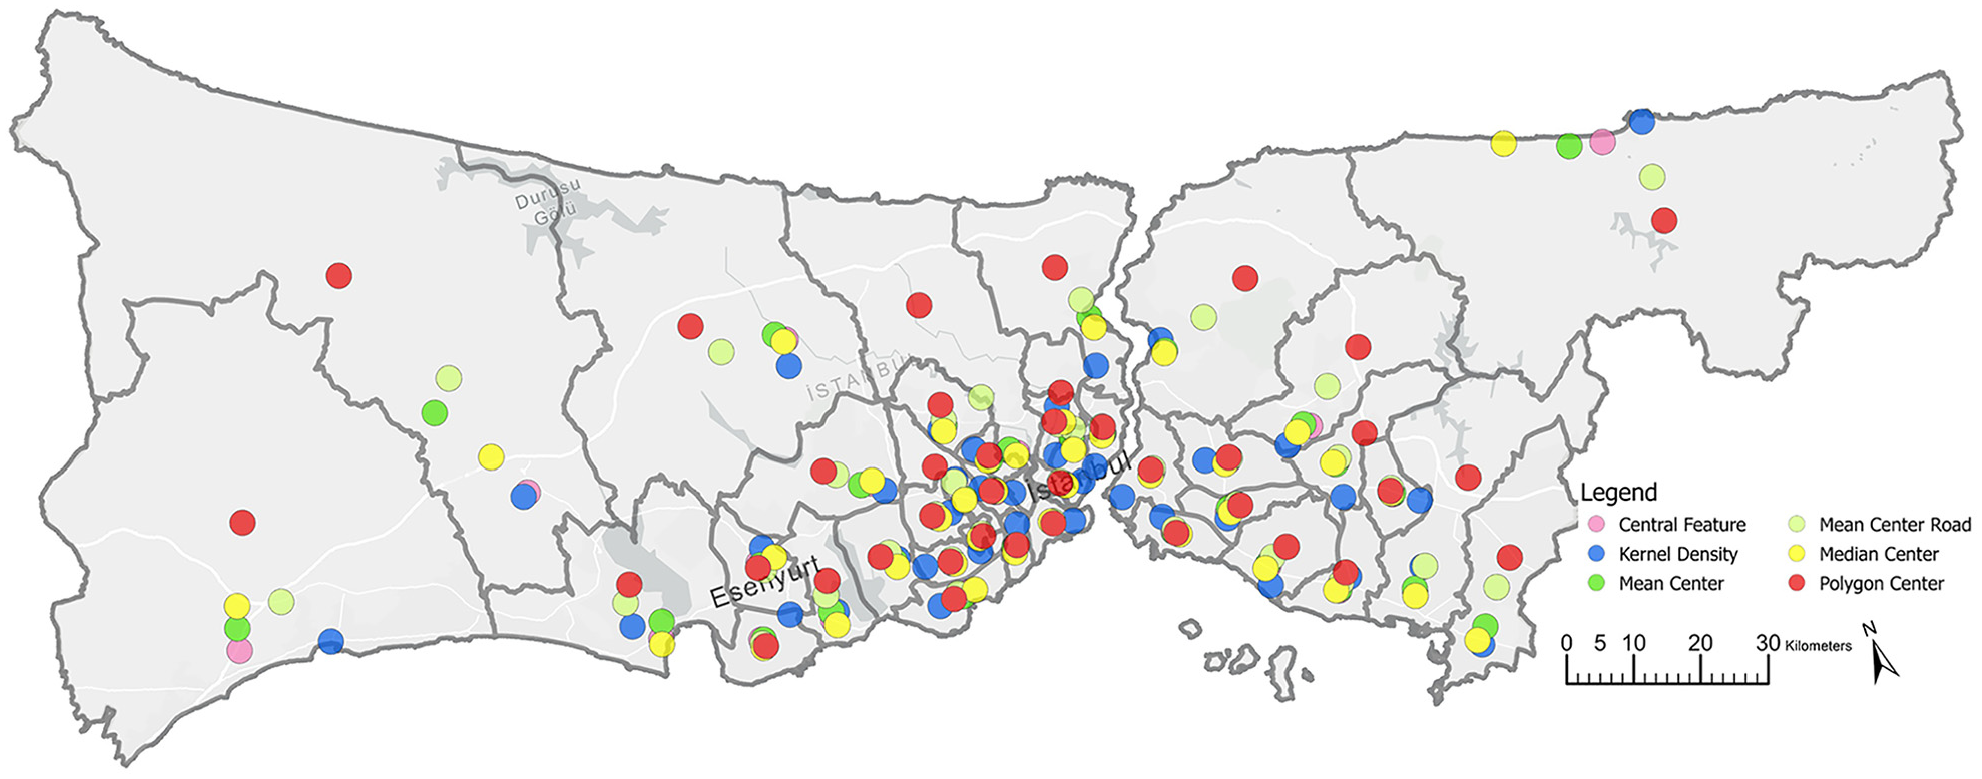
Results of six different centroid-finding methods.
The implemented methods were tested using 2012 Istanbul Household Surveys data. These surveys were conducted to capture intra-city travel behaviors and were utilized in developing a four-stage model for the transportation master plan, employing valid methodologies and sampling procedures. Reports on this data and its access are publicly available (Istanbul Metropolitan Municipality, 2012). The survey data were used exclusively to analyze trips made by private automobiles, resulting in information on 7,125 journeys. We calculated average journey durations to assess the methodology and developed a district-based OD matrix. A total of 836 unique OD pairs were identified. Table 2 presents descriptive statistics for this dataset Table 2.
Descriptive Statistics of the 2012 Istanbul Household Survey Origin–Destination Results
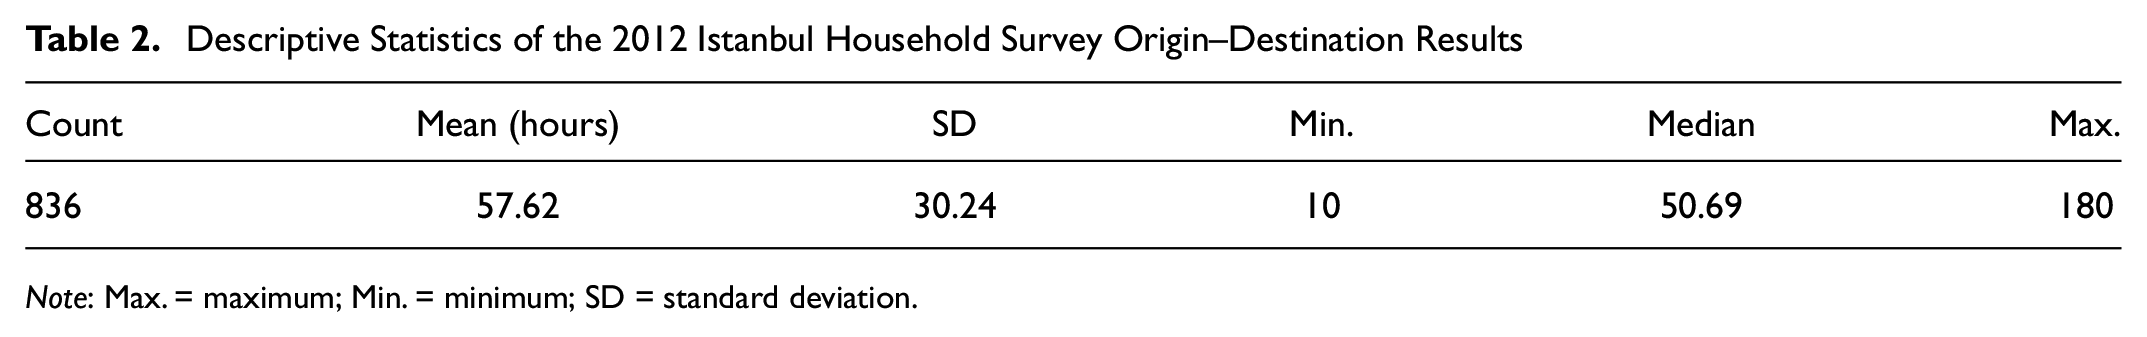
Note: Max. = maximum; Min. = minimum; SD = standard deviation.
Various statistical metrics were utilized to evaluate the accuracy and effectiveness of six centroid location determination methods. The primary metrics considered in this study include mean absolute error (MAE), root mean square error (RMSE), correlation, and mean absolute percentage error (MAPE). MAE measures the average absolute deviation of predictions from actual values, providing insight into the magnitude of a model’s prediction errors. RMSE is a metric that calculates the square root of the average of the squares of the errors, emphasizing the impact of more significant errors on model performance. Both metrics indicate the potential deviation of the model’s predictions from actual values, but RMSE’s greater sensitivity to large errors makes it particularly significant. The correlation coefficient determines the strength and direction of the linear relationship between model predictions and actual values. A high correlation coefficient indicates that the model closely follows the actual values, denoting high accuracy. MAPE measures the proportional magnitude of the model’s prediction errors as a percentage, providing a way to evaluate the model’s performance across datasets of different scales. The study utilized four metrics to assess the model’s predictive success, contributing significantly to model selection and improvement. The results are presented in Table 3.
Statistics Results for Correlation Coefficient, Mean Absolute Error (MAE) (Hours), Root Mean Square Error (RMSE) (Hours), and Mean Absolute Percentage Error (MAPE) (%)
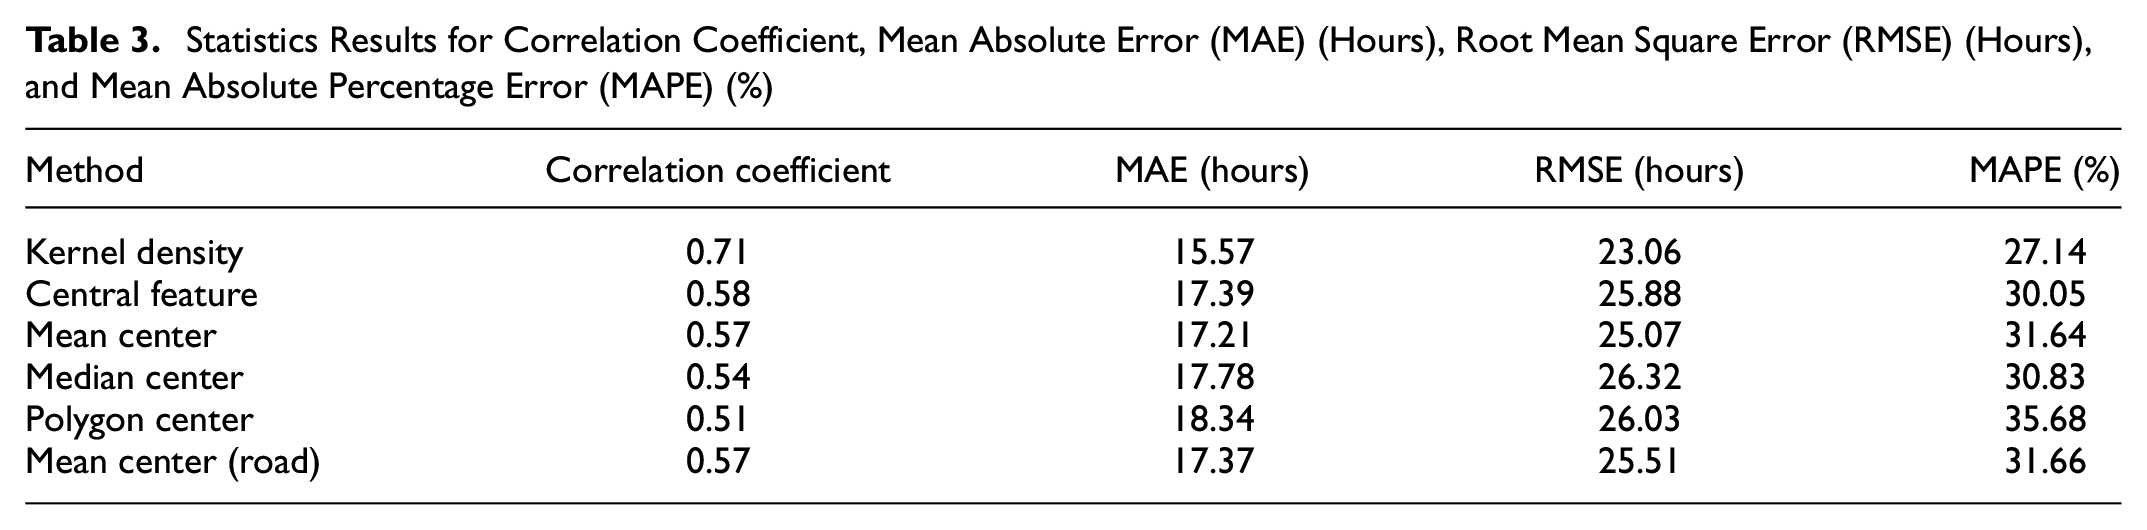
The obtained results comprehensively evaluate the predictive accuracy of different methods and demonstrate their alignment with actual travel times. The correlation analysis shows that the KDE method has a higher correlation coefficient than other methods, indicating a stronger linear relationship with actual values. The analysis indicates that the KDE method outperforms other techniques in prediction accuracy. This is supported by the MAE and RMSE values, demonstrating that the KDE method has the lowest error values and provides the most reliable predictions. Furthermore, the MAPE values indicate the proportional closeness of the model’s predictions to actual values. The KDE method outperforms other methods in overall model performance, as shown in Figure 7. The correlation coefficient for the KDE method indicates a more robust correlation (strong correlation) compared with other methods (moderate correlation) ( 39 ).
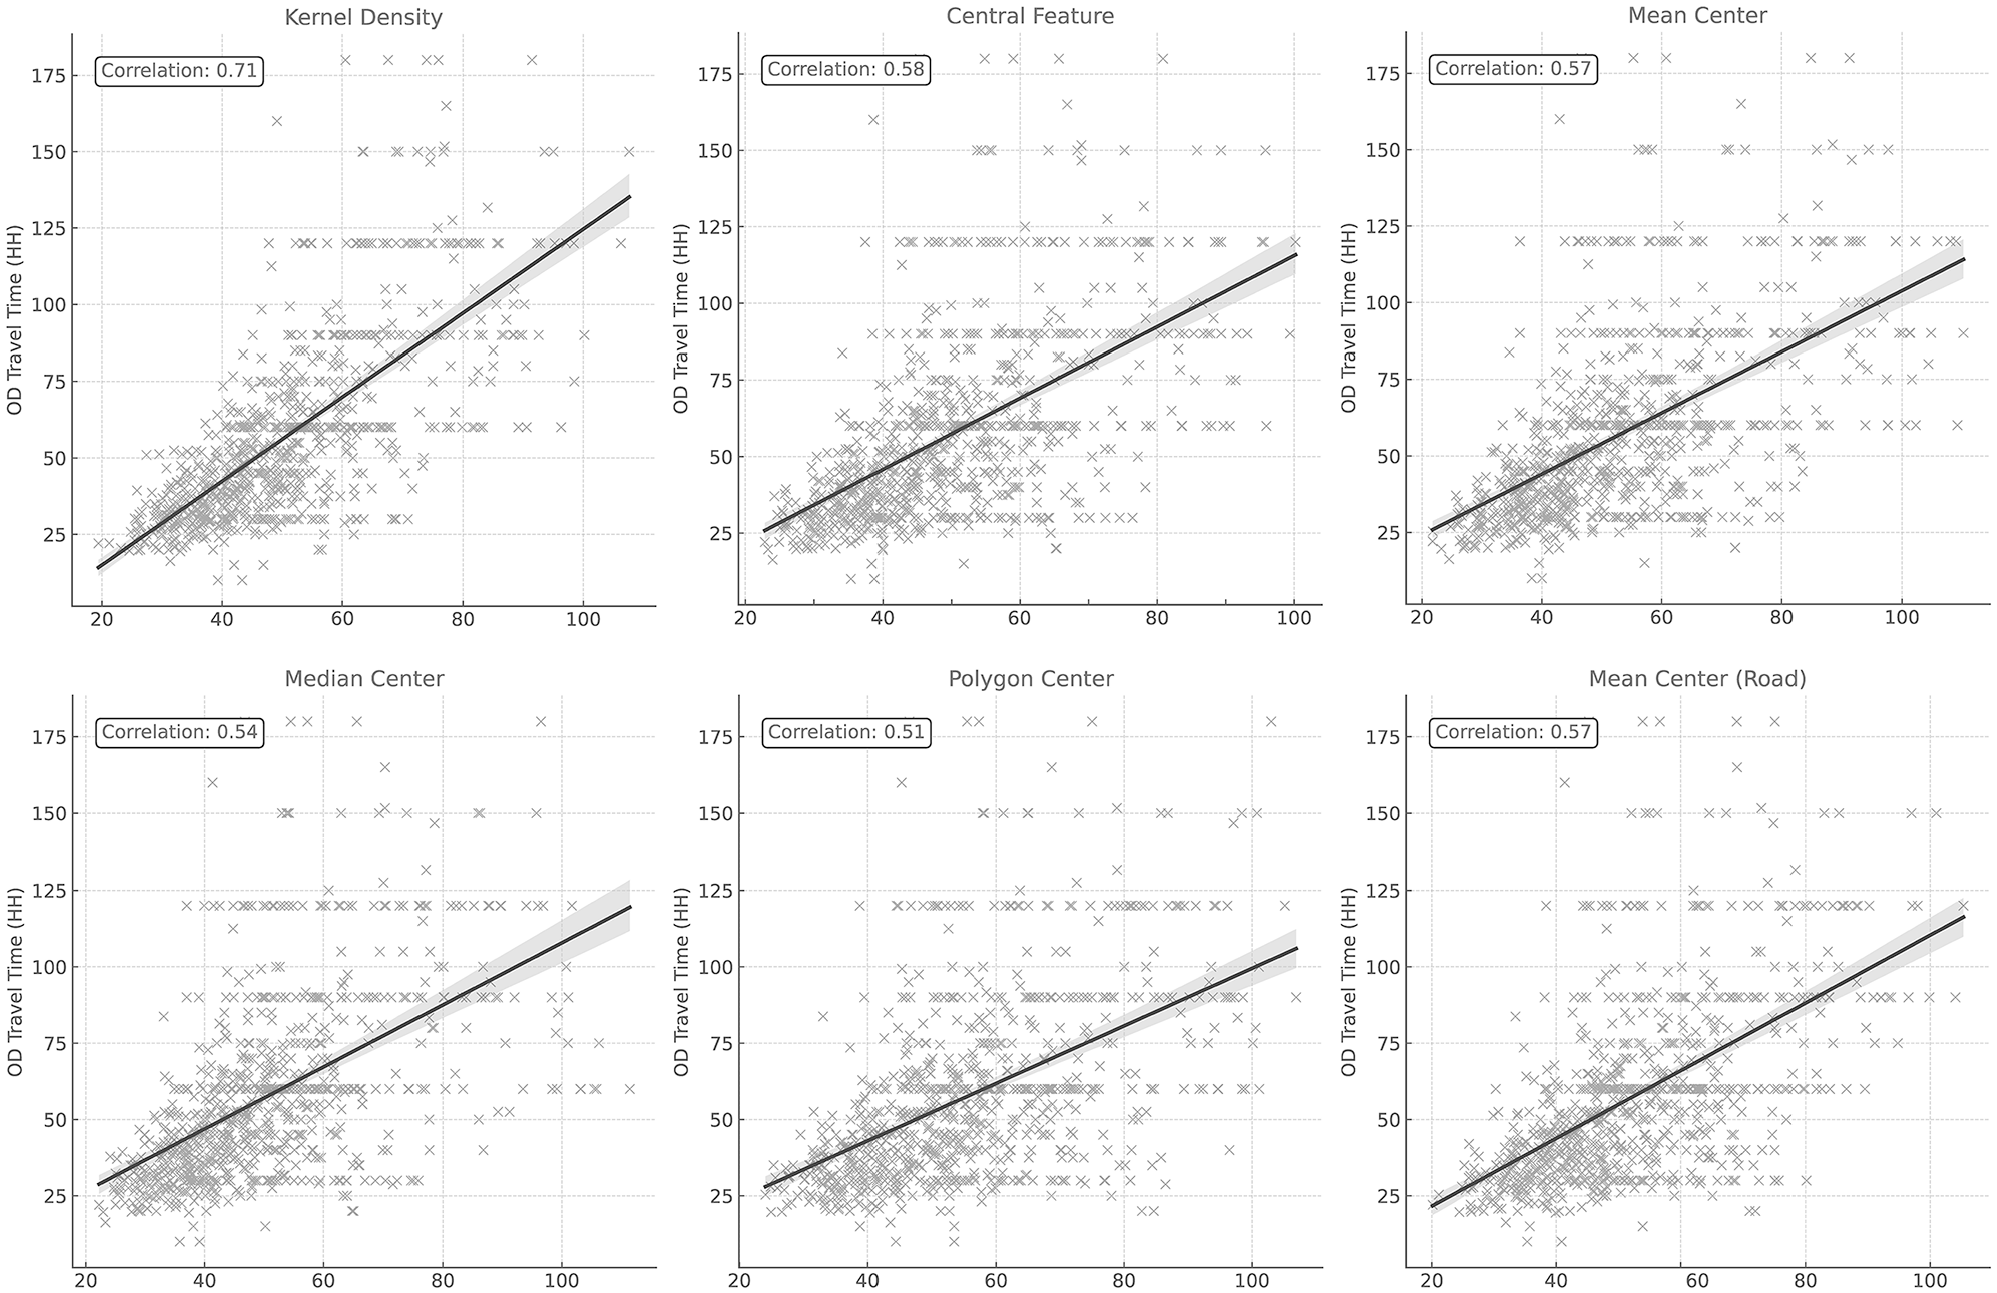
Scatter plots of correlation coefficient results for different methods: Kernel Density (top left), Central Feature (top middle), Mean Center (top right), Median Center (bottom left), Polygon Center (bottom middle), and Mean Center (Road) (bottom right).
Conclusion and Future Research
The presented results comprehensively evaluate the predictive accuracy of various methods and demonstrate their alignment with actual travel times. Correlation analysis indicates that the KDE method exhibits a higher correlation coefficient than other methods, suggesting a stronger linear relationship with the actual values. This finding highlights the method’s prominence in prediction accuracy. The results indicate that the KDE method is the most accurate among the evaluated methods, as confirmed by the MAE analysis and RMSE. Moreover, the MAPE values indicate the proportional accuracy of the model's predictions compared with actual values. The KDE method outperforms other methods as far as overall model performance is concerned.
These findings improve our understanding of the alignment between the employed methods and actual data and their predictive success. In the context of evaluating the accuracy of all centroid positioning methods, it has been observed that methods utilizing building or road density tend to have lower error margins. This suggests that with the expansion of datasets and the advancement of analytical techniques, more accurate predictions can be achieved. Among the methods examined, the KDE method demonstrated superior performance in predicting travel times. These results provide a strong rationale for using the KDE method in future studies on travel time prediction and transportation modeling processes. This underscores the growing importance of relying on analytical and increasingly accessible numerical-spatial methods in future zone-centroid-based studies, rather than on experience-based centroid positioning. Such an approach will enable more accurate analyses and forecasts in fields such as transportation and urban planning. Additionally, the comprehensive examination of centroid positioning methods within a single study offers valuable insights for researchers working in this domain.
In our future work, we plan to focus on adapting centroid positioning methods to advanced remote sensing, machine learning, or artificial intelligence-based analytical techniques, rather than relying solely on a specific dataset. This approach aims to obtain more suitable centroid locations with less effort across different datasets, thereby providing a significant scientific contribution to evolving planning studies. Additionally, refining the zoning methodology or integrating additional data layers, such as demographic or socio-economic factors, may further improve the precision of centroid positioning and the overall reliability of transportation models. By doing so, we hope to inspire researchers to explore this relatively underrepresented area of study.
Footnotes
Author Contributions
The authors confirm contribution to the paper as follows: study conception and design: İsmail Adalıoğlu, Murat Ergün; data collection: İsmail Adalıoğlu; analysis and interpretation of results: İsmail Adalıoğlu; draft manuscript preparation: İsmail Adalıoğlu, Murat Ergün. All authors reviewed the results and approved the final version of the manuscript.
Declaration of Conflicting Interests
The author(s) declared no potential conflicts of interest with respect to the research, authorship, and/or publication of this article.
Funding
The author(s) received no financial support for the research, authorship, and/or publication of this article.