
Abstract
The integration of simulation technology into professional training has transformed learning in various sectors. Although prior research has explored motion cueing in simulators such as aviation training, driver navigation and performance, there is limited investigation into the impact of motion stimuli in VR-based truck driver training. This study investigates the driving performance of truck drivers in two virtual driving tasks, comparing conditions with and without motion cues. Participants wore virtual reality headsets and were situated within an immersive motion simulator. They completed two driving tasks involving truck docking and highway driving. Simulator sickness, stress, and user experience were assessed using the simulator sickness questionnaire, subjective unit of distress scale, and user experience questionnaire, respectively. Our findings suggest that motion cues hold potential to enhance subjective experiences, making driving more engaging, stimulating, and mitigating motion sickness. However, they did not significantly affect overall driving performance, except for steering behavior. Participants exhibited more engaged steering during highway driving when motion cues were present. Our findings suggest that the impact of motion cues is task-dependent, with their absence not showing a significant detrimental effect on driving performance in the simulated environment. Further validation with field-observed data is necessary to confirm these findings. These insights can guide future policies and regulations governing virtual truck driver training, ultimately ensuring improved safety and performance in the industry.
Keywords
Driving simulators have emerged as indispensable tools for driver training and assessment, providing a secure and controlled learning environment. In sectors such as aviation, simulators like flight simulators are not only widely used but also strictly regulated, forming an essential component of pilot training. However, a contentious issue persists about the utility and advantages of incorporating motion cueing into virtual training environments. This complexity has spurred extensive research into the impact of motion cues on training and learning ( 1 – 7 ).
The debate surrounding motion cueing is multifaceted, with some advocating for low-cost, low-fidelity simulators to yield comparable training outcomes to high-cost, high-fidelity, motion-based simulators ( 1 ), while others endorse multi-degree motion simulators, particularly for complex highway scenarios involving speed and lateral acceleration ( 2 ). Notably, significant differences were found for certain performance metrics, indicating that control-related behaviors such as braking and steering were predominantly affected by control differences, whereas lane position, vehicle speed, time to collision, and simulator sickness ratings were primarily influenced by graphical display variations ( 2 ).
While a more realistic simulator does not guarantee better training outcomes, the impact of motion cueing on different training phases remains inconclusive. Previous research on flight tasks has shown that motion cues can lead to unfavorable training patterns, influencing pilots’ control strategies and steering movements ( 8 ). However, in a study focusing on driving and navigation using environmental landmark cues, it was found that motion cues could complement landmark cues during turns, enhancing drivers’ route memory ( 9 ).
The extensive and sometimes conflicting body of literature on virtual driver training highlights the ongoing debate about the significance of motion cues ( 1 – 7 ). This debate underscores the immediate need for additional research, especially in the context of truck driver training, where inadequate training can lead to severe consequences. In response, our study centered on truck driver training, specifically investigating the impact of immersive motion cues generated by a motion simulator with 6 degrees of freedom (6DOF) during active driving, and comparing these effects to conditions lacking such cues. Our study aimed to explore how motion cueing influenced the driving control behavior of truck drivers and their subjective sensory experiences, thus offering valuable contributions to the ongoing debate in this field. Furthermore, our research holds the potential to influence the development of future policies and regulations governing virtual truck driver training, ultimately ensuring the safety and effectiveness of training for professional truck drivers.
Methods
Experimental Setup
The visual stimuli were generated using IRIS software, a dedicated tool designed for truck driving training in Ontario, Canada, created by a virtual truck driving training company named iMVR. IRIS is powered by Unity® software ( 10 ) and has its unique custom physics engine exclusively developed by iMVR. This software is widely employed by truck driving schools, offering a highly effective means of training students for real-world driving experiences in the region with realistic, localized visual simulations of highways and roads found in Ontario. These visual stimuli were presented to participants using a virtual reality HTC Vive Focus 3 headset.
Participants were seated in a bucket car seat, positioned within a fully immersive motion simulator, supported by a Moog Stewart platform with 6DOF (Figure 1). IRIS was modified to stream the forces the driver experiences into the motion cueing algorithm, a combination of high and lowpass filters following the classic motion cueing architecture ( 11 , 12 ). This setup provided participants with a realistic sensation of motion as they navigated through the virtual driving environment. When motion cues were activated, participants received motion feedback based on their interactions with the driving interface, including a truck steering wheel and gas and brake pedals (Figure 1). Inside the simulator pod, two cameras were placed for experimenter monitoring—one providing a front view of the participant and the other offering a bird’s eye view of the interior. An intercom system facilitated communication between the participant and the experimenter. Data from the steering wheel and pedals were continuously recorded at 30 Hz.
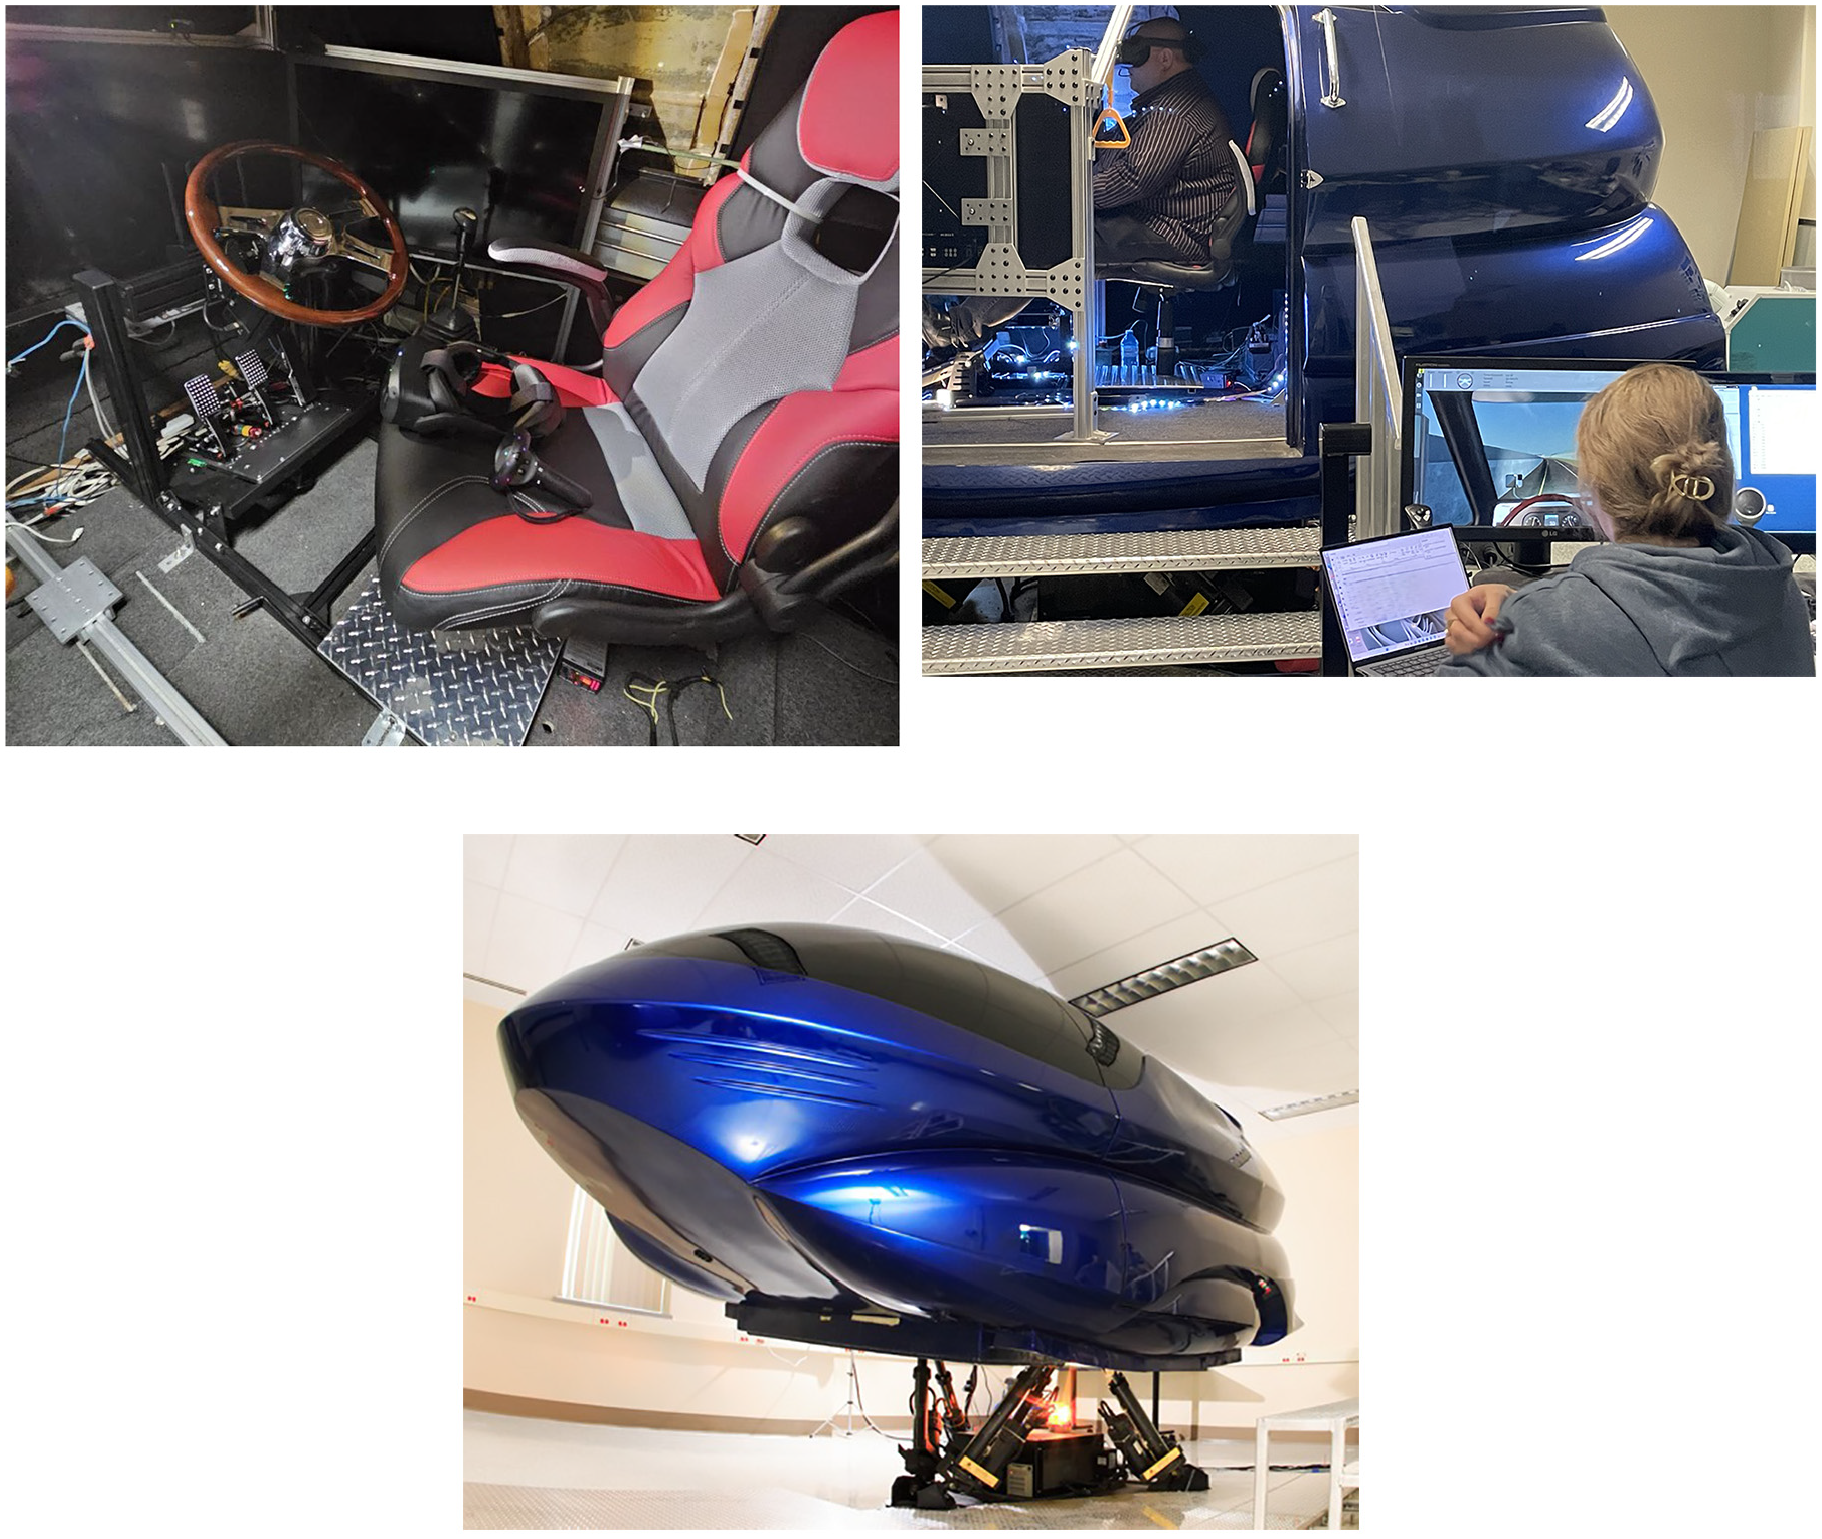
Images of the outside and inside of the motion simulator. Top left: Shows inside the simulator where the truck’s steering wheel and pedals are located. A virtual reality headset is on the seat. Top right: shows a participant wearing the headset in the simulator while doing the highway driving task. Bottom: shows the outside of the motion simulator with 6 degrees of freedom motion platform. The bottom and top left photos were captured by the Simulator Lab research team. The top right photo was taken by an iMVR representative during their visit to the lab, with the consent of both the researcher and the simulator participant. Copyright: Simulator Lab research team and iMVR.
Driving Tasks
Participants were assigned to two distinct driving tasks: Truck Docking and Highway Driving. In the Truck Docking task, participants found themselves in a truck yard with multiple trailers parked at various docks. One of the loading docks was left vacant, and the participants’ objective was to reverse their truck into that specific loading dock (Figure 2). In the Highway Driving task, participants merged onto a highway—an exact replication of a real 4-lane highway located in Hamilton, Ontario—and traveled in the third lane for a 4.3km stretch before exiting. The highway primarily had light traffic, offering ample merging opportunities for drivers. However, there were segments along the route where cautious driving and attentive traffic monitoring were essential, including the need for timely deceleration to prevent potential collisions (Figure 3). Participants needed to complete each driving task twice across two different motion conditions; once with motion cues enabled (Motion condition) and once without motion cues (No Motion condition), resulting in eight trials per participant (four Docking and four Highway). The order of the motion condition and the tasks was counterbalanced (Figure 4).
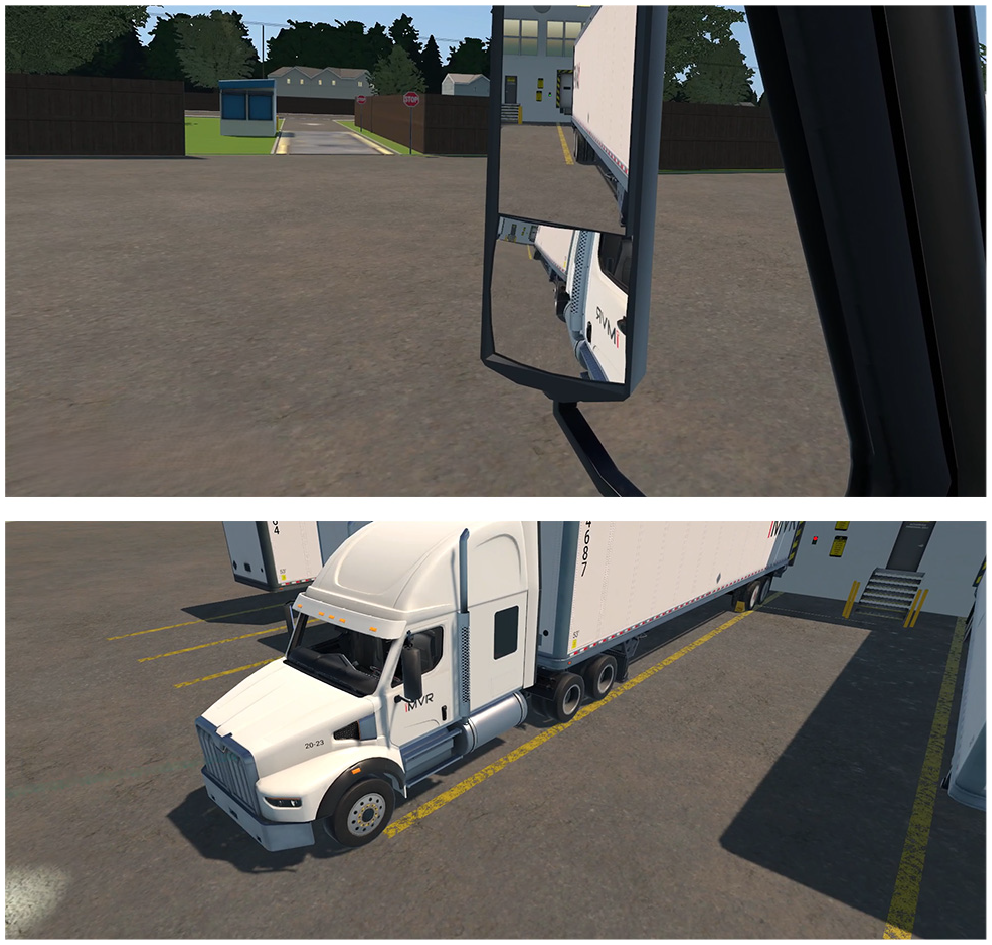
Images of the Truck Docking task in which participants backed up their truck to a loading dock. The top image shows the driver’s point of view, and the bottom image shows the bird’s-eye view of the task.
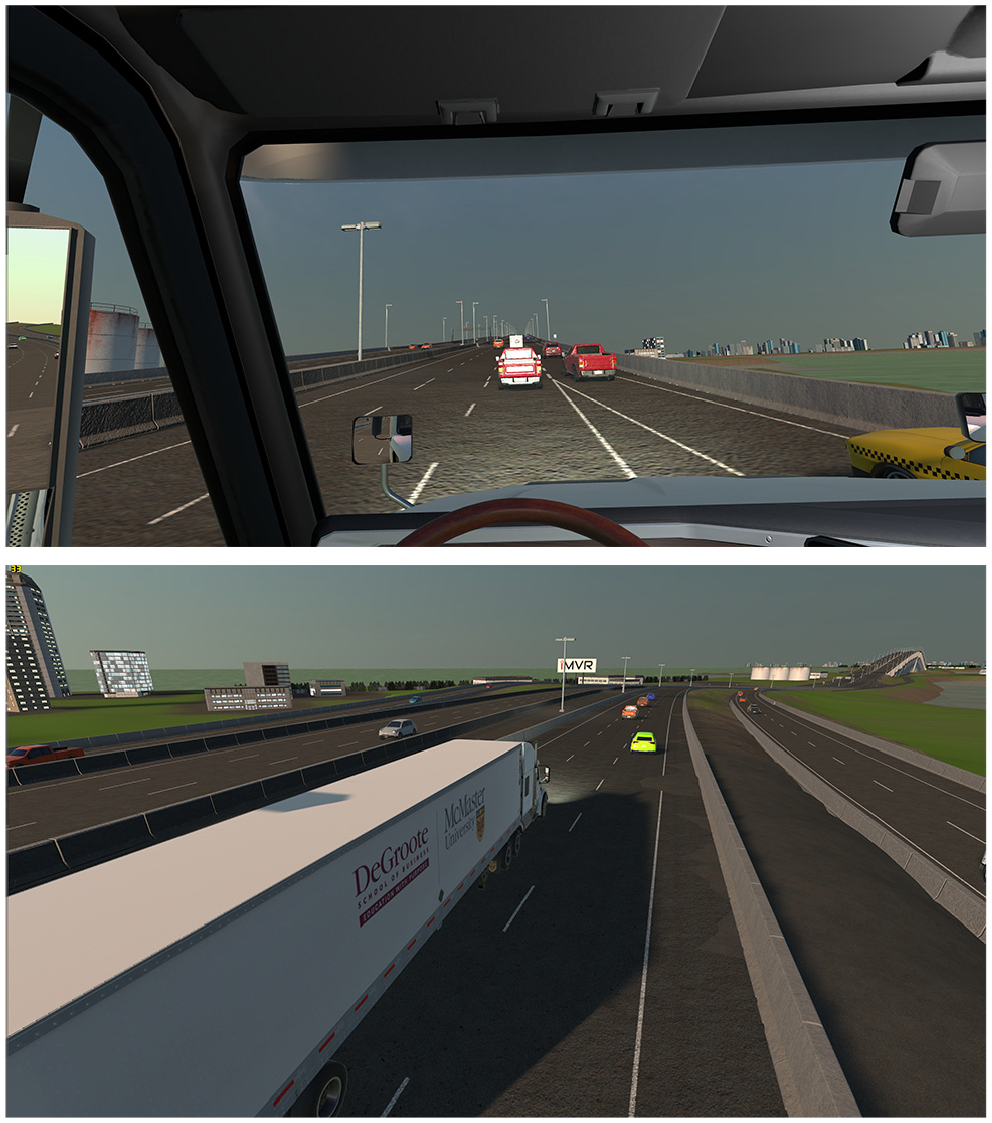
Images of the Highway Driving task where participants merged onto a highway and drove for a certain time until they exited the highway. The top image shows the driver’s point of view, and the bottom image shows the bird’s-eye view of the task.
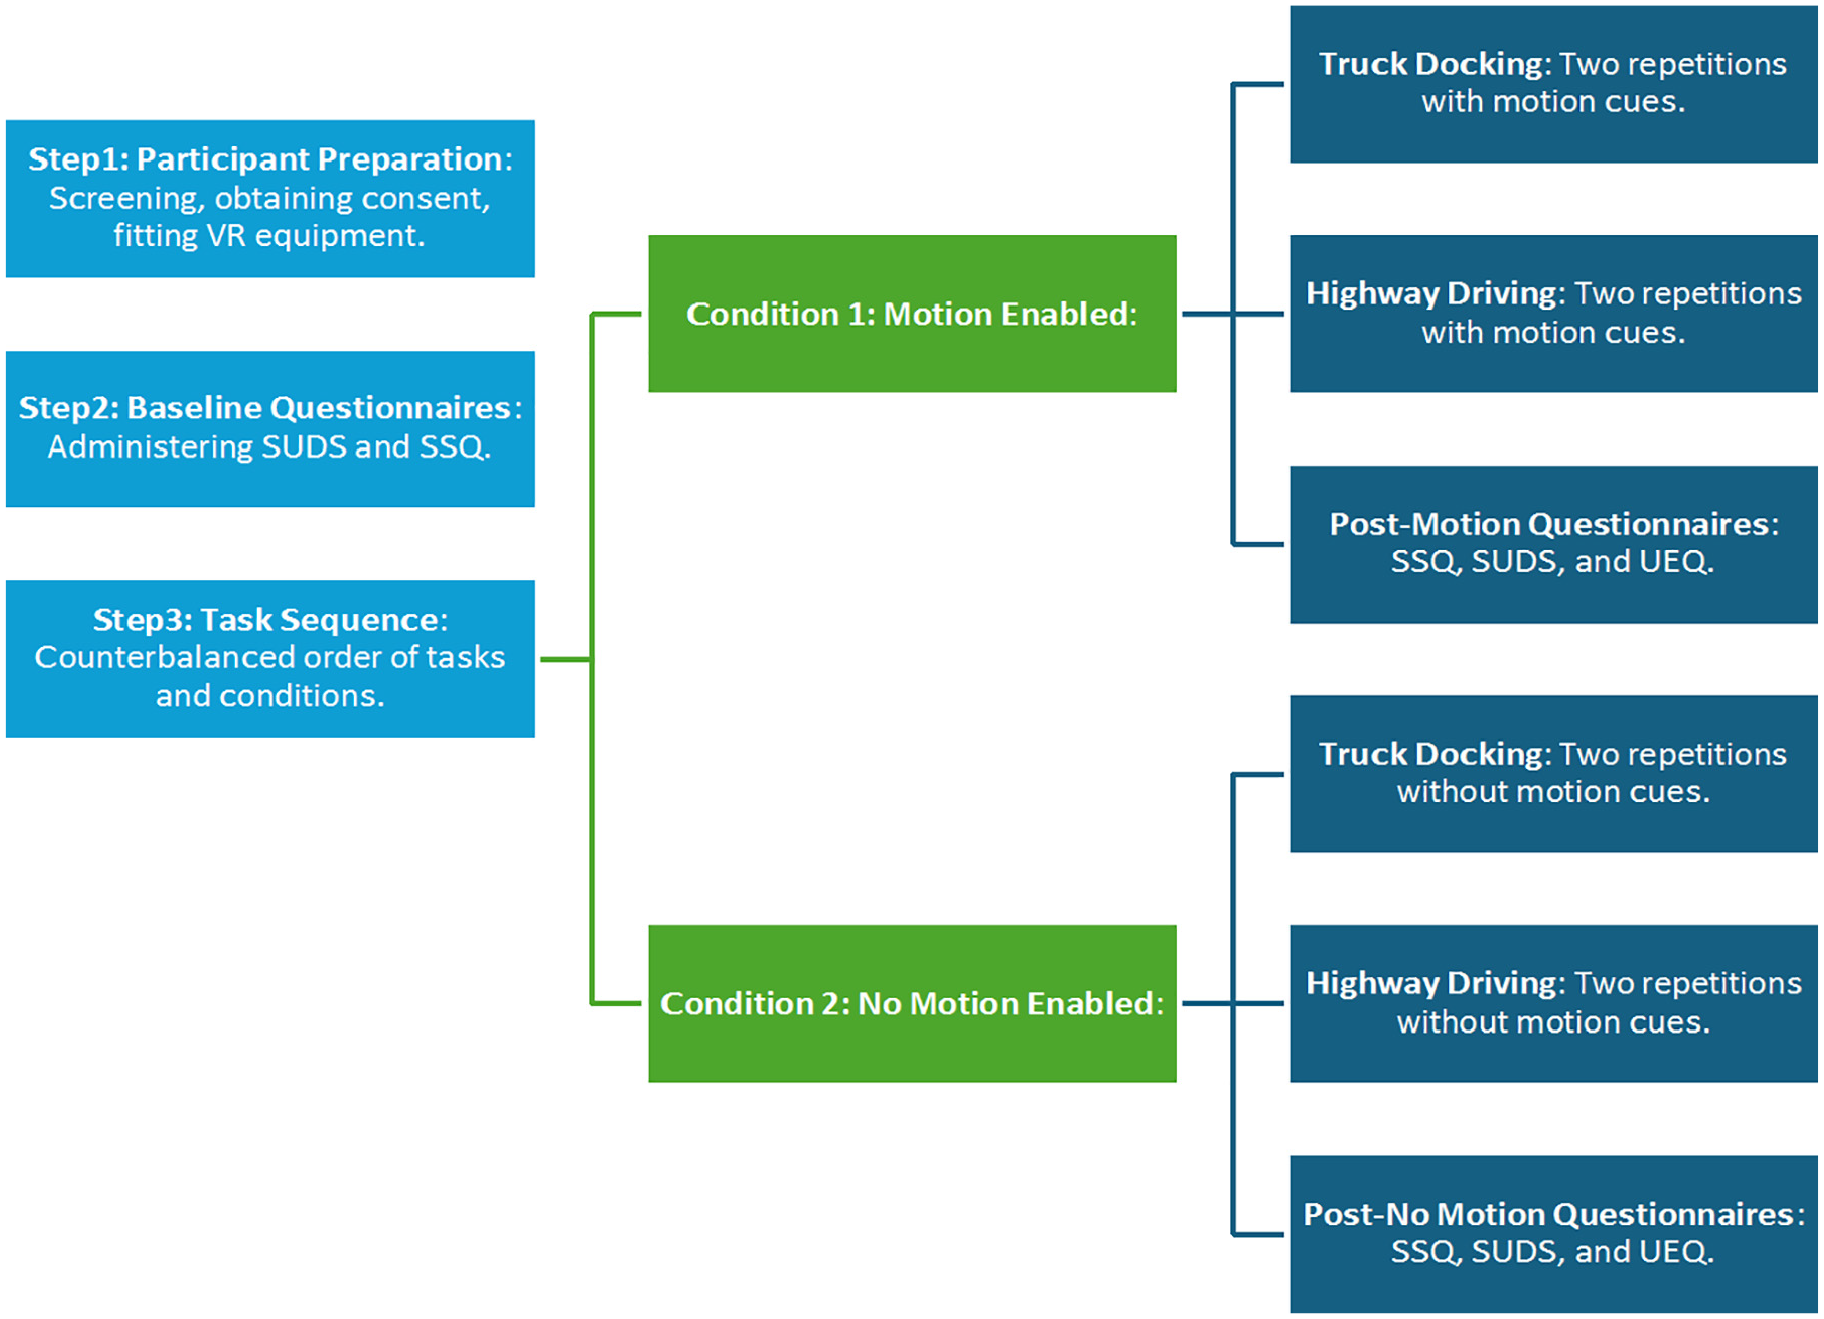
Diagram illustrating the sequence of activities in the experiment, starting from participant preparation and baseline questionnaires, through the counterbalanced driving tasks with and without motion cues, to the post-task questionnaires.
Driving Performance Measures
Driver performance was evaluated through two distinct methods: the IRIS driving score and time series data. The IRIS driving score is calculated using the built-in driving score mechanism, which is determined by specific thresholds. These thresholds include an acceleration limit set at 0.2 m/s2, a brake limit set at 0.6 m/s, and predefined speed limits on the simulated highway. These parameters were employed to assess driving speed, acceleration limit errors, total time spent exceeding speed limits, and total speed limit violations. Furthermore, various driving metrics were tracked, encompassing the total count of lane changes, lane-keeping errors, and instances of signaling errors during lane changes. A comprehensive total score was subsequently calculated, synthesizing these measurements.
Time series data was employed in conjunction with the IRIS-derived score for a comprehensive analysis of driver behavior and performance using time series data collected from control inputs, which included steering, brake, and acceleration data. This approach provided a more detailed assessment of driver performance. We employed various metrics based on the calculation method developed by ( 13 , 14 ).
These metrics encompassed: Mean, computed as the average and represented by the formula (1/N) * Σ(data[n]); Energy (Root Mean Square [RMS]) which was represented as √((1/N) * Σ(data[n]^2)); Zero Crossings, determined by summing instances where data[n] * data[n+1] > 0, indicating changes in polarity; Reversal Rate, computed as the average number of times the value changed from one local minimum to the next local maximum. Stationary points, defined as points with |data[n]-data[n-1]| < epsilon, were initially identified as candidates, and then a threshold-based analysis (a threshold of 1 degree) was performed to determine the reversals ( 15 , 16 ); Entropy, calculated using a linear FIR filter, expressed by the formula: y[n] = data[n] + (5 * data[n-1]/2) + (2 * data[n-2]) + (data[n-3]/2). This filter approximates the first two terms of the Taylor series expansion of data[n]. The prediction errors based on y[n] were computed, offering an estimation of jerk (the rate of change of acceleration). These prediction errors were binned, and entropy was subsequently calculated. The entropy measure is zero when data[n] represents a smooth curve with zero third derivative and increases as the jerk in the data signal rises.
Questionnaires
Three questionnaires were administered to participants at various stages of the experiment:
Simulator Sickness Questionnaire (SSQ): This self-report questionnaire assessed motion sickness and related symptoms experienced during simulator or virtual reality use. It consisted of 16 questions that gauged symptoms related to nausea, oculomotor discomfort, and disorientation. Participants rated the severity of their symptoms on a scale ranging from 0, indicating “not at all,” to 3, indicating “severe” ( 17 ). The SSQ has been widely used and validated in various studies to assess simulator sickness in virtual reality and simulated contexts ( 18 – 22 )
Subjective Units of Distress Scale (SUDS): This self-report measure served as a stress thermometer, evaluating the intensity of emotional distress or anxiety experienced by individuals in specific situations on a scale of 0-100. It utilized an 11-point Likert-type subjective anxiety scale, where 0 indicated a state of no distress (completely relaxed), 10 indicated (Alert and awake, concentrating well), and 100 indicated extreme distress (highest level of anxiety) ( 23 ). The SUDS is commonly used in psychological research and clinical settings to measure subjective distress or anxiety. Its validity is evidenced by correlations with other anxiety and distress measures and its application in evaluating virtual reality (VR)-based stress management programs ( 22 , 24–26). Participants completed the SSQ and SUDS at the beginning of the experiment, base condition, and after both the Motion and No Motion conditions.
User Experience Questionnaire (UEQ): This questionnaire provided an effective and reliable assessment of the user experience of interactive systems. It comprised 26 items distributed across six scales measuring factors such as attractiveness, efficiency, satisfaction, dependability, and novelty. Responses were recorded on a seven-stage scale, with items scaled from −3 (most negative) to +3 (most positive) ( 27 ). The UEQ has been validated through various studies, demonstrating strong psychometric properties ( 22 , 28 ). Participants filled out the UEQ after completing both the Motion and No Motion conditions.
Participants
We recruited a total of 18 participants (1 female, 17 male) from various truck driving schools across Ontario, including Hamilton, Niagara, Brantford, and Stoney Creek. Participants received training for the tasks they performed virtually in the lab by practicing on an actual truck in the driving school. However, they had no prior experience with VR headsets or virtual driving training. To ensure the safety and well-being of participants during the experiment, we screened them for health-related issues, such as epilepsy, seizure, sensitivity to simulator sickness, and claustrophobia. Four participants withdrew from the study at the outset and two discontinued their involvement midway as a result of simulator sickness. Ethical approval for the experiment was obtained from the McMaster Research Ethics Board, and our research procedures complied with the Canadian Tri-Council policy on ethics.
Data Analysis
Ninety-three trials were analyzed, consisting of 48 trials for the highway driving task (23 Motion trials and 25 No Motion trials) and 45 trials for the docking task (23 Motion trials and 22 No Motion trials). The independent variables included the driving tasks (highway and docking) and motion condition (Motion and No Motion). The dependent variables included IRIS driving scores and time series data for steering, brake, and accelerator pedals, including mean, energy, reversal rate, and entropy.
We employed a linear mixed model (LMM) ( 29 ) to analyze the data. To account for potential learning effects resulting from additional trials completed by each participant, we included “trial number” as both a fixed effect and a random slope per participant. This approach enabled us to assess the overall impact of additional trials on response variables while capturing individual variations in learning rates among participants. In Wilkinson notation ( 30 ), the LMM model can be expressed as follows:
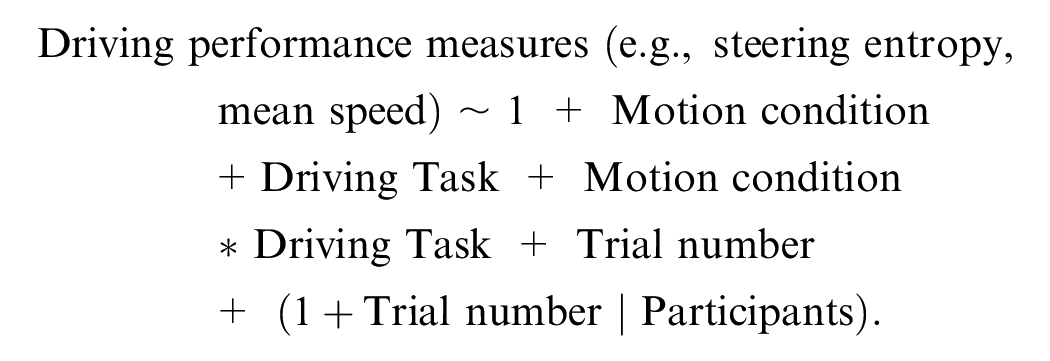
One-way ANOVA tests were used to analyze the differences in SSQ and SUDS scores among the Base, Motion, and No Motion conditions. Paired-sample t-tests were employed to compare participants’ responses in the UEQ based on Motion and No Motion conditions.
Results
Driving Performance
Our analysis showed that motion cues had a limited impact on driving performance. The only significant effect observed for motion cues was in the reversal rate of steering. Omnibus tests revealed there was a significant difference between Motion and No Motion in the reversal rate of steering (F (1, 88) = 8.173, p = .005) and a significant interaction between motion condition (Motion and No Motion) and driving task (docking and highway) (F (1, 88) = 4.535, p = .036). Post-hoc tests with Bonferroni correction revealed that the Motion condition had a higher reversal rate (M = 0.057, SD = .005) than the No Motion condition (M = 0.050, SD = .008) in the Highway driving task (t (51.4) = 3.480, p = .006). Trial numbers completed by participants did not significantly affect the response variable (F (1, 88) = 0.135, p = .707). There was a significant and expected difference in the reversal rate of steering between the two driving tasks (F (1, 88) = 369.27, p < .001). To access the descriptive statistics of all other statistically insignificant assessed variables, please refer to Table A1 in the Appendix.
Questionnaires
Simulator Sickness Questionnaire (SSQ)
Our findings suggested that motion cues may have a mitigating effect for simulator sickness. The SSQ showed significant differences in nausea symptoms (F (2, 41) = 7.99, p = .001), oculomotor symptoms (F (2, 41) = 11.84, p < .001) and disorientation symptoms (F (2, 41) = 8.91, p < .001) between Base, Motion and No Motion conditions. Tukey post hoc analysis revealed that in the No Motion condition, participants consistently reported higher levels of nausea symptoms (t (41) = 3.99, p < .001), oculomotor symptoms (t (41) = 4.84, p < .001), and disorientation symptoms (t (41) = 4.20, p = .009) compared with the Base condition. Furthermore, in comparison to the Motion condition, participants reported higher levels of oculomotor symptoms (t (41) = 2.92, p = .015), and disorientation symptoms (t (41) = 2.48, p = .045) in the No Motion condition (Table 1).
Descriptive Statistics: Mean and Standard Error of Nausea, Oculomotor, and Disorientation Symptoms Measured by Simulator Sickness Questionnaire (SSQ) for the Initial (Base) and Two Motion Conditions (Motion and No Motion)
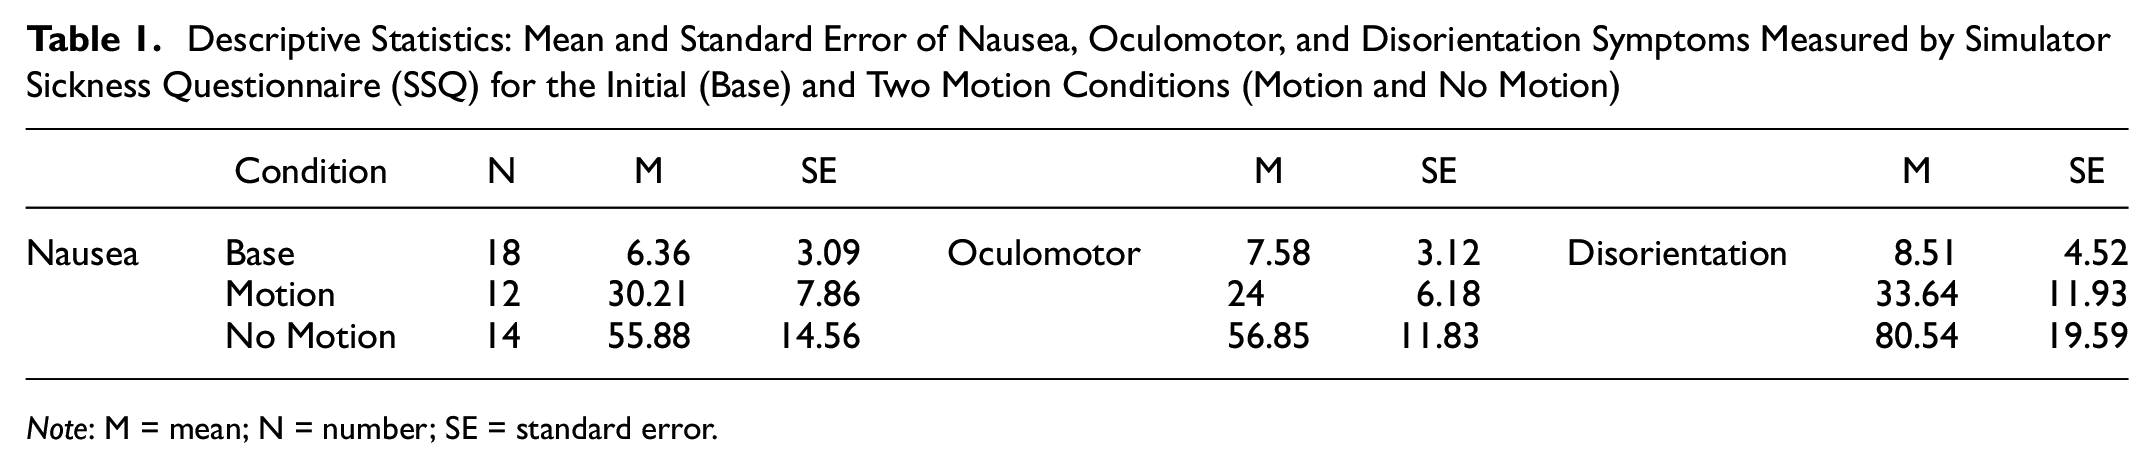
Note: M = mean; N = number; SE = standard error.
Subjective Units of Distress Scale (SUDS)
SUD scores significantly differed between the Base (M = 6.11, SE = 1.64), the No Motion (M = 24.29, SE = 5.90), and the Motion (M = 14.17, SE = 3.79) conditions, F (2, 41) = 5.88, p = .006. Post-hoc comparisons revealed that the No Motion condition had a significantly higher SUD score than the Base condition (t (41) = 3.43, p = .004).
User Experience Questionnaire (UEQ)
Participants’ subjective experiences favored Motion condition. They rated Motion condition as more attractive (t (11) = 2.389, p = 0.036), dependable (t (11) = 2.547, p = 0.027), efficient (t (11) = 3.957, p = 0.002), and stimulating (t (11) = 2.449, p = 0.032) compared with No Motion condition. No significant differences were observed in perspicuity (t (11) = 1.785, p = 0.102) and novelty (t (11) = 0.105, p = 0.918) ratings (Table 2).
Descriptive Statistics: Scale Mean and Standard Error of the User Experience Questionnaire (UEQ) Measures Across Two Motion Conditions (Motion and No Motion)
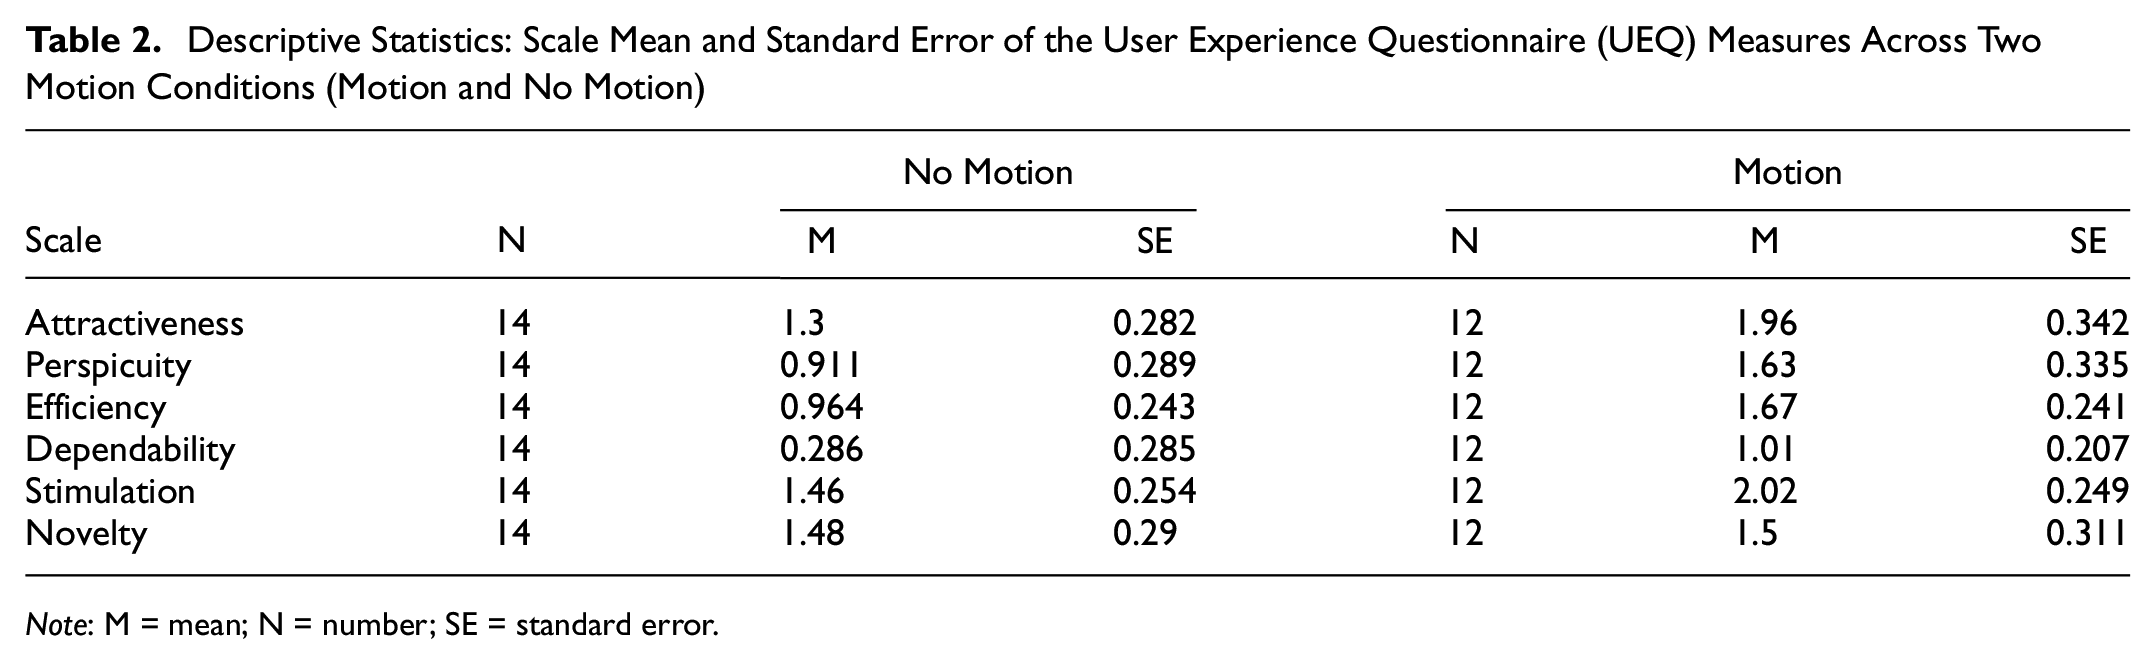
Note: M = mean; N = number; SE = standard error.
Discussion
Our study provides valuable and innovative insights into the influence of motion cues on the virtual training of truck drivers, specifically focusing on driving performance and the subjective experience of drivers when interacting with these cues. Our findings revealed intriguing results about the benefits of motion cues in enhancing the realism and engagement of training while also reducing virtual reality sickness. However, it is noteworthy that the absence of these cues did not appear to have a detrimental effect on the simulated driving performance of the truck drivers based on the measures used in this study. Further validation with field-observed data is necessary to confirm this finding.
We observed that the absence of motion cues was associated with a higher self-report of simulator sickness symptoms. This finding aligns with previous research, indicating that the absence of motion cues leads to a discrepancy between visual inputs and physical motion, heightening conflicts within the vestibular system and consequently increasing the possibility of experiencing sickness, including nausea symptoms ( 31 – 36 ). Similarly, the increased reports of oculomotor strain and disorientation symptoms in the absence of motion cues may be attributed to the elevated effort required to reconcile visual information with the absence of corresponding physical movement. These results underscore the crucial role of motion cues in preserving spatial orientation and balance in virtual settings. The heightened reported distress in the no-motion condition, compared with the initial distress levels of the drivers, may suggest that in this specific condition, the absence of motion cues imposes increased cognitive and sensory demands required to navigate the virtual environment. The absence of this trend when motion cues are available may indicate that the presence of motion cues plays a different role in mitigating distress in the context of this study.
These observations are consistent with the participants’ subjective experiences, as evaluated through the User Experience Questionnaire, which further underscores the preference for the inclusion of motion cues. Participants rated this condition more favorably across several dimensions, including attractiveness, efficiency, dependability, and stimulation. Participants found simulator driving training perspicuous and engaging, regardless of the presence of motion cues. Overall, our findings underscore the significance of motion cues in virtual training environments. They not only play a critical role in mitigating simulator sickness but also enhance the overall user experience. These insights hold particular relevance for the design of virtual training systems, especially those involving prolonged exposure to virtual environments. The incorporation of motion cues could be a pivotal factor in enhancing the effectiveness and user acceptance of such systems.
However, the analysis of objective driving performance measures revealed an intriguing paradox. Despite the improved user experiences and the reduction in simulator sickness symptoms, there were no significant changes in actual driving performance. The only notable difference was a higher rate of steering reversals observed in the presence of motion cues during the highway driving tasks, a result that can be contextualized within existing literature. This suggests that multi-degree motion simulators have an impact on control-related behaviors, such as braking and steering, which are particularly influenced by the presence and quality of motion cues ( 4 ). In high-speed highway scenarios, these cues assume critical importance.
The increased rate of steering reversals when motion cues were available may reflect a more realistic and challenging driving environment, where drivers respond more actively to the dynamic elements of high-speed driving. Realistic motion cues can enhance the driver’s sense of speed and acceleration, resulting in more frequent steering adjustments similar to real-world highway driving. This suggests that motion cues effectively create a challenging and immersive environment that prompts drivers to respond as they would under actual driving conditions.
The contrast in the usefulness of motion cues in docking and highway driving tasks was not surprising. Docking tasks, typically involving precise, low-speed maneuvers, appear to be less influenced by motion cues. This might be because of the reliance on visual and spatial precision over vestibular feedback in such tasks. Accordingly, the absence of motion cues might not significantly affect performance. In contrast, in highway scenarios where speed and rapid lane changes introduce more dynamic and pronounced vestibular feedback, the presence of motion cues might have contributed to an increased steering reversal rate. The heightened sensory feedback in the Motion condition may lead drivers to react more actively to perceived changes in speed and direction, resulting in more frequent steering adjustments.
Our research, supported by existing studies, highlights a nuanced interplay between motion cues and graphical fidelity in driving simulators. Motion cues significantly enhance the realism of high-speed driving simulations, making the experience more immersive and engaging. However, this increased realism introduces complexities in steering control, as shown by elevated steering reversal rates. Such challenges, while potentially demanding on steering proficiency, are crucial for accurately simulating real-world driving conditions and preparing drivers effectively. This underscores the need to carefully calibrate the level and fidelity of motion cues in high-fidelity simulators, aiming to strike an optimal balance between immersive realism and the practicalities of driver training outcomes.
Limitation, Implications and Future Research:
Our study highlights the complexities of virtual training for truck drivers, despite facing challenges such as a limited sample size because of recruitment difficulties and participant engagement issues caused by motion sickness. To address potential risks to the validity and generalizability of our findings because of the small sample size, we used the bootstrap method. This technique estimates confidence intervals by resampling the data, providing an empirical distribution of the estimates to assess the stability and reliability of our results. Despite these limitations, the insights gained pave the way for advancing this field.
Future research must address these challenges by broadening the participant pool, thereby improving the generalizability of the results. Additionally, strategies to mitigate motion sickness need to be explored to reduce dropout rates and enhance participant engagement, ultimately improving the ecological validity and effectiveness of the training. It is crucial to explore the balance between providing realistic motion cues and ensuring participant comfort to not only improve the training experience but also to maximize learning outcomes. Understanding these dynamics can lead to the development of tailored virtual training solutions that optimize skill acquisition and performance improvement for truck drivers.
Further research should include demographic details such as age and variability in driving experience to improve the robustness of the analysis. Additionally, controlled real-world comparisons should be conducted to validate simulation results with field-observed data, addressing the challenges inherent in replicating real-world driving conditions in a simulated environment. By aligning technological advancements with educational needs, future studies can contribute to more effective and realistic training programs that enhance safety and performance in the trucking industry.
Conclusion
In conclusion, our study sheds light on the intricate relationship between motion cues and virtual training for truck drivers. While motion cues prove invaluable in reducing simulator sickness and enhancing the overall user experience, their impact on practical driving skills warrants further investigation. It is conceivable that the advantages of motion cues in training may be more nuanced or specific to certain tasks.
Supplemental Material
sj-docx-1-trr-10.1177_03611981241283457 – Supplemental material for Evaluating the Effects of Motion Cues in Virtual Truck Driver Training
Supplemental material, sj-docx-1-trr-10.1177_03611981241283457 for Evaluating the Effects of Motion Cues in Virtual Truck Driver Training by Yasaman Jabbari and Martin von Mohrenschildt in Transportation Research Record
Footnotes
Acknowledgements
We wish to express our sincere gratitude to iMVR Company for their pivotal expertise and insights that greatly influenced our research. Our appreciation also extends to Ontario Truck Driving School (Niagara-on-the-Lake Campus) for their cooperation in facilitating driver recruitment efforts. Their contributions were invaluable to the execution and success of this study.
Author Contributions
The authors confirm contribution to the paper as follows: study conception and design: Y. Jabbari, M. von Mohrenschildt; data collection: Y. Jabbari; analysis and interpretation of results: Y. Jabbari, M. von Mohrenschildt; draft manuscript preparation: Y. Jabbari, M. von Mohrenschildt. All authors reviewed the results and approved the final version of the manuscript.
Declaration of Conflicting Interests
The author(s) declared no potential conflicts of interest with respect to the research, authorship, and/or publication of this article.
Funding
The author(s) disclosed receipt of the following financial support for the research, authorship, and/or publication of this article: This work was supported by the Mathematics of Information Technology and Complex Systems (MITACS), under grant number IT36521.
Ethics Approval
Ethical considerations and protocols were rigorously followed, with approval granted by the McMaster Research Ethics Board (MREB#: 6525), ensuring the integrity and ethical compliance of our research methodologies.
Supplemental Material
Supplemental material for this article is available online.
References
Supplementary Material
Please find the following supplemental material available below.
For Open Access articles published under a Creative Commons License, all supplemental material carries the same license as the article it is associated with.
For non-Open Access articles published, all supplemental material carries a non-exclusive license, and permission requests for re-use of supplemental material or any part of supplemental material shall be sent directly to the copyright owner as specified in the copyright notice associated with the article.