
Abstract
Trucks are disproportionately involved in fatal traffic accidents and contribute significantly to CO2 emissions. Gathering data from trucks presents a unique opportunity for estimating driver-specific costs associated with truck operation. Although research has been published on the predictive validity of driver data, such as in the contexts of pay-how-you-drive insurance and naturalistic driving studies, the investigation into how telematics data relate to the negative consequences of truck driving remains limited. In the present study, driving data from 180 truck drivers, collected over a 2-year period, were examined to predict damage incidents, traffic fines, and fuel consumption. Correlation analysis revealed that the number of fines and damage incidents could be predicted based on the number of harsh braking events per hour of driving, whereas fuel consumption was predicted by engine torque exceedances. Our analysis also sheds light on the impact of covariates, including the engine capacity of the truck operated and time of day, among others. We conclude that the damage incidents and fines incurred by truck drivers can be predicted not only from their number of harsh decelerations but also through driving demands that extend beyond the driver’s immediate control. It is recommended that transportation companies adopt a systemic approach to mitigating truck-driving-related expenses.
Keywords
In 2019, heavy goods vehicles, henceforth denoted as “trucks,” were implicated in 14% of all traffic fatalities within the European Union ( 1 ). Casualties in truck collisions predominantly involve the opposing party. Specifically, in 2019, 26 truck occupants succumbed to collisions with cars, whereas 1,557 car occupants died in accidents involving trucks ( 2 ). Apart from the road safety implications, truck operations significantly affect the environment, contributing approximately 21% of the European Union’s road transport CO2 emissions ( 3 ). These environmental impacts are also evident in the operational expenditures of trucking companies; an examination of truck driving expenses in the United States revealed that 22% was allocated to fuel, 9% to damage repairs and maintenance, and 4% to insurance premiums ( 4 ). Consequently, identifying the determinants of accidents, damage incidents, and fuel consumption would be beneficial for society and transportation companies.
The increasing accessibility of in-vehicle data recordings has allowed novel approaches to investigating the determinants of accidents. Among passenger vehicles, pay-as-you-drive (PAYD) insurance incorporating in-vehicle data recording has gained traction ( 5 – 7 ). Using data from 1,600 vehicles participating in PAYD programs, Paefgen et al. demonstrated that urban driving posed a relatively elevated accident risk, whereas highway driving presented the lowest risk per kilometer driven ( 7 ). Moreover, Verbelen et al., in their analysis of 10,406 policyholders, discovered that although males are typically considered higher-risk drivers than females, gender was no longer a significant factor when telematics data, such as mileage, were incorporated as accident involvement predictors ( 8 ).
Tselentis et al. distinguished between PAYD and pay-how-you-drive (PHYD) insurance, in which the former involves exposure-related variables (e.g., driving amount, driving time, road type), whereas the latter also encompasses behavioral measurements, such as speeding and accelerations ( 9 ). Ayuso et al. analyzed PHYD insurance data usage and showed that a younger driver’s age, higher vehicle power, increased mileage, and a greater number of speed limit violations were correlated with a shorter duration to the driver’s first accident, based on a dataset of 15,940 novice drivers ( 10 ). More recently, Ma et al. analyzed over 130,000 trips from 503 drivers and found that distance traveled, exceeding the local speed limit, the frequency of harsh braking events per distance traveled, and driving speed relative to other vehicles traversing the same road segment were predictive of drivers’ accident rates ( 11 ). Naturalistic driving studies featuring researcher-instrumented vehicles offer another avenue to investigate the correlation between driving behavior and accident involvement. In the SHRP-2 project, kinematic events (i.e., hard decelerations, -accelerations, and -turning) were associated with accident and near-accident occurrences ( 12 ).
In the domain of truck driving, several studies have used actuarial statistics, such as age, gender, and previous accidents or violations, to predict accident involvement or severity ( 13 – 15 ). However, investigations into the relationship between truck driver behavior and accident involvement remain relatively scarce. A noteworthy exception is a study by Cai et al., which discovered that, in a substantial sample of truck drivers (n = 31,828), the number of safety-critical events per mile was associated with accident involvement ( 16 ). The findings were deemed robust across various business units and driver types. Hickman and Hanowski’s analysis of a large naturalistic truck driving dataset demonstrated that certain cell phone tasks substantially increased the likelihood of involvement in safety-critical events ( 17 ). However, this case-control study provided insights only into the immediate precursors of truck accidents without establishing correlations with driving styles.
A common limitation of studies exploring predictors of adverse outcomes in driving (both car and truck driving) is the incomplete nature of the variables recorded. For instance, PAYD data may encompass information on mileage and accident rates but lack data on driver behavior ( 8 , 18–21). Other studies report associations between driver behavior and accidents without considering other costly outcomes such as traffic fines or fuel consumption ( 22 , 23 ). Goldenbeld et al. analyzed a large national dataset to study the relationship between traffic offenses and accident involvement ( 24 ). However, information on mileage and whether a specific vehicle was driven by its owner at the time of the traffic fine was unavailable. Figueredo et al. ( 25 ) and Zhou and Zhang ( 26 ) investigated risky truck driving behavior and used this to classify drivers into different risk profiles; nevertheless, they did not establish a direct association with accident involvement. A prevalent issue in truck driving behavior analysis is that drivers often switch trucks, as Li et al. acknowledged in their truck driver profiling study ( 27 ).
In the current study, a dataset encompassing truck driver behavior, driving exposure, and fuel consumption measures was merged with data on drivers’ damage incidents and traffic fines. This information was used to examine the relationships between truck driving behavior and driving exposure and fuel consumption, vehicle damage incidents, and fines. The present analysis accounted for both the driver and the specific vehicle being driven. The objective was to gain a more nuanced understanding of the determinants of adverse driver outcomes, including high fuel consumption, damage incidents, and fines.
Methods
Ethics Statement
In the present research, data were procured from two sources: a company specializing in collecting fleet data for driver coaching purposes and a transportation logistics company based in the Netherlands. The data were acquired following Data Transfer Agreements, and safeguards such as data minimization and anonymization were used to ensure the protection of data subjects. Data processing adhered to Article 89 of the General Data Protection Regulation, that is, data were processed for statistical purposes and presented in an aggregated format. The research proposal was reviewed by the TU Delft data privacy officer and received approval from the TU Delft Human Research Ethics Committee (approval number 1820). Owing to the retrospective and observational nature of this study, informed consent was not required.
Driving Behavior Data
This study uses truck driving data from a Dutch transportation company operating a fleet of 70 trucks. The drivers’ primary responsibilities included shop distribution (approximately 55% of drivers), nationwide distribution (approximately 16% of drivers), and fine-meshed distribution (approximately 10% of drivers). The remaining drivers delivered to distribution centers or engaged in more flexible work arrangements.
The data were obtained through a fleet management system (FMS), which has become increasingly common in the transportation and logistics industry. FMSs enable drivers and management to monitor vehicle locations, record driving statistics, and schedule trips. The FMS data for this study were obtained from NEXTdriver (https://www.nextdriver.nl), a Dutch company that provides posttrip driving-style feedback and coaching for truck drivers. Drivers received weekly performance scores via an app and could communicate with driving-style coaches through a text messaging interface.
FMS data were collected between March 19, 2020 and March 31, 2022. Cumulative event data (“samples”) of driver actions (e.g., speeding, harsh braking) were acquired at varying intervals (median sampling interval = 53.1 min). Odometer data and fuel consumption were sampled more frequently (median sampling interval = 4.47 min). On inspection of the odometer data, approximately 28% of the samples did not yield data, resulting in a constant value even when the vehicle was in motion. These data were linearly interpolated based on the date and time of the event recording. Through this interpolation of the odometer values, we were able to provide a more precise estimate of the total distance driven per driver, which turned out to be 2% higher with interpolation than without. Note that this interpolation had minimal impact on the driver performance measures, which are described below, as they were calculated per unit of time rather than per kilometer driven.
The data for each driver were divided into sessions, with a session being defined by automatically detecting when a new driver entered the vehicle. If drivers operated the same vehicle across multiple days, this was identified as a single session. Sessions were retained if they met specific criteria, such as physical plausibility and a nonzero driving duration (i.e., at least two sample points were required for a session to calculate the duration based on the difference in the time stamp variable), as detailed in the Supplemental Material.
Driver Performance Measures
A total of 12 driving measures were computed per driver from the aforementioned FMS data samples:
Total driving time (hours).
Total driving distance (km).
Number of days with driving data recorded (days). Any driving data were considered when counting the number of days, regardless of session demarcation.
Engine capacity (cc), computed as a driving-time-weighted average of the engine capacity of the truck driven. The engine capacity score provides an overall approximation of the size of all trucks used by the driver. This information was obtained by examining the license plate number in the Dutch vehicle registration database ( 28 ).
Number of vehicle switches per hour of driving (#/h). This variable may indicate the type of work being performed, that is, whether the driver was assigned to strict delivery schedules (such as shop distribution), which involves switching trucks.
Percentage of night shift driving (%), calculated based on the number of event samples recorded after 20:00 or before 04:00. This measure was computed for each session and subsequently averaged across all sessions for a given driver. The interval between 20:00 and 04:00 was chosen as it appeared to correspond with the working hours of night shift drivers based on inspection of the distribution of working hours in the data.
Mean speed (km/h), calculated from the first two measures.
Number of harsh brakes per hour of driving (#/h). The manufacturer of the event data recorder had established a threshold for what constitutes a harsh brake. It was defined as any vehicle deceleration that exceeds 1.5 m/s2, a measurement that applies regardless of the driving speed at the time.
Speeding duration per hour of driving (s/h), with speeding defined as driving at a speed greater than 84 km/h. The threshold of 84 km/h for recording the duration of speeding was established by the manufacturer of the event data recorder, taking into account the typical 80 km/h speed limit on highways, plus an additional 4 km/h margin. Although a variable threshold that considers the local speed limit might be more desirable, our research was constrained to this fixed parameter.
Duration of engine torque exceedance per hour of driving (s/h). The torque threshold was set at 90% of a factory-established engine-specific reference torque value.
Duration of cruise control active per hour of driving (s/h).
Fuel consumption per kilometer of driving (L/km).
Note that Measures 5 and 7 to 11 were computed per hour of driving (Measure 1), whereas Measure 12 was computed per kilometer of driving (Measure 2).
Damage Incidents and Fines
The transportation company maintained a detailed record of all damage incidents and traffic fines, including those not claimed from the insurance provider. Solely relying on insurance data could potentially result in underreporting, an issue that has been identified within the accident analysis literature ( 29 ). Dorn et al. noted that underreporting is less concerning for transportation companies that maintain their own records ( 30 ).
Only damage incidents and fines that occurred within the study period, from March 19, 2020 to March 31, 2022, were considered. Our collaboration with the transportation company, granting us access to extensive damage data, influenced our decision to retain a broad spectrum of damage incidents in our study, not just collisions. More specifically, a total of 420 damage incidents were documented, which the transportation company had informally categorized. Specifically, 97 were identified as “reversing incidents,” 108 as “maneuvering incidents,” and 49 as damage incidents resulting from the truck “swinging out.” The damage incidents primarily involved bumpers, lamps, fences, poles, doors, or other (parked) vehicles. Furthermore, four damage incidents were classified as rear-end collisions, three as injuries (not related to driving but occurring during loading and unloading), eight as resulting from slipperiness, four as theft of goods, four as lane changes, one as a right-of-way incident, and one as an avoidance maneuver. Lastly, 131 damage incidents were categorized as “other” and encompassed a diverse range of types, including damage incidents that occurred during loading/unloading and damage to cargo. The remaining 10 damage incidents were not classified.
In relation to damage incidents and fines, the following scores were computed for each driver:
(13) Total damage incidents (total in the dataset: 420). Even though many damage incidents were not directly associated with driving, this category was retained to obtain an estimate of all costs incurred.
(14) Number of damage incidents claimed from the insurance company (total in the dataset: 200).
(15) Number of damage incidents handled by the transportation company itself (i.e., not claimed from the insurance company, total in the dataset: 220).
(16) Number of damage incidents for which the costs were recovered from another road user (total in the dataset: 32). This category offers a formal classification of damage incidents for which the truck driver was not at fault.
(17) Number of damage incidents for which the costs were not recovered from another party, typically because the truck driver was at fault (total in the dataset: 388).
(18) Number of damage incidents related to driving (total in the dataset: 303). This category was obtained by using all damage incidents (Measure 13), excluding incidents that were recovered from another party (Measure 16) and incidents that were manually labeled by the authors. Specifically, not included were damage incidents that did not occur while the truck was either driving or parking (such as damage during loading and unloading), incidents caused by others, incidents for which, according to the transportation company’s records, no culpable party was identified, and incidents not evidently caused by human error (such as a flat tire). The first two authors independently classified all accidents using the above definitions and resolved disagreements through mutual discussion.
(19) Number of traffic fines (total in the dataset: 266). The reasons for most of the fines were unavailable, but out of the 99 fines with descriptions, 77 were for speeding.
Statistical Analysis
Means, standard deviations, and intercorrelations of the driver measures and damage variables were calculated. In addition, graphs were constructed to clarify the effects of truck size and time of day.
One issue is that the correlation coefficients were influenced by driving exposure and thus required statistical correction. The total driving time and distance (Measures 1 and 2) do not precisely represent the actual amount of driving, as sessions shorter than the minimum requirement of two sample points were excluded. Since the number of distinct days that drivers appeared in the FMS dataset seemed to be the most accurate index of exposure, and because transportation companies are likely to be interested in damage incurred per employee-day (rather than per hour or kilometer driving), the number of days with data (Measure 3) was used as an index of exposure in the regression analyses.
Linear regression analyses were performed with the drivers’ exposure (Measure 3), session characteristics (Measures 4, 5, 6, and 7), and one of the behavioral measures (Measure 8 or 10) as predictor variables. The selected dependent variables included the drivers’ total number of damage incidents (Measure 13), the number of fines per driver (Measure 19), and the fuel consumption per kilometer of driving (Measure 12).
Results
A total of 27,543 sessions involving 180 drivers were used in the study. The average number of sessions per driver was 153.0 (SD = 141.7), and the mean number of vehicles driven per driver was 15.37 (SD = 10.92).
Table 1 presents the means, standard deviations, and higher moments of the measures used in the analysis. As can be observed, approximately 1,000 h of driving were available per driver on average (Measure 1). Nevertheless, there were considerable individual differences in exposure, as evidenced by the standard deviations of Measures 1 to 3. Drivers changed trucks approximately once every seven hours of driving (Measure 5). The majority of drivers switched trucks at least once, with only six drivers never making a switch. Harsh braking events were relatively infrequent, occurring about once per hour (Measure 8). Drivers exceeded the established speed limit (84 km/h) 18% of the time (Measure 9), experienced high engine torque approximately 3% of the time (Measure 10), and used cruise control 35% of the time (Measure 11). The average fuel consumption was 0.28 L/km (Measure 12). On average, drivers incurred 2.33 damage incidents and received 1.48 fines.
Descriptive Statistics of the Driving Measures, Damage Incidents, and Fines
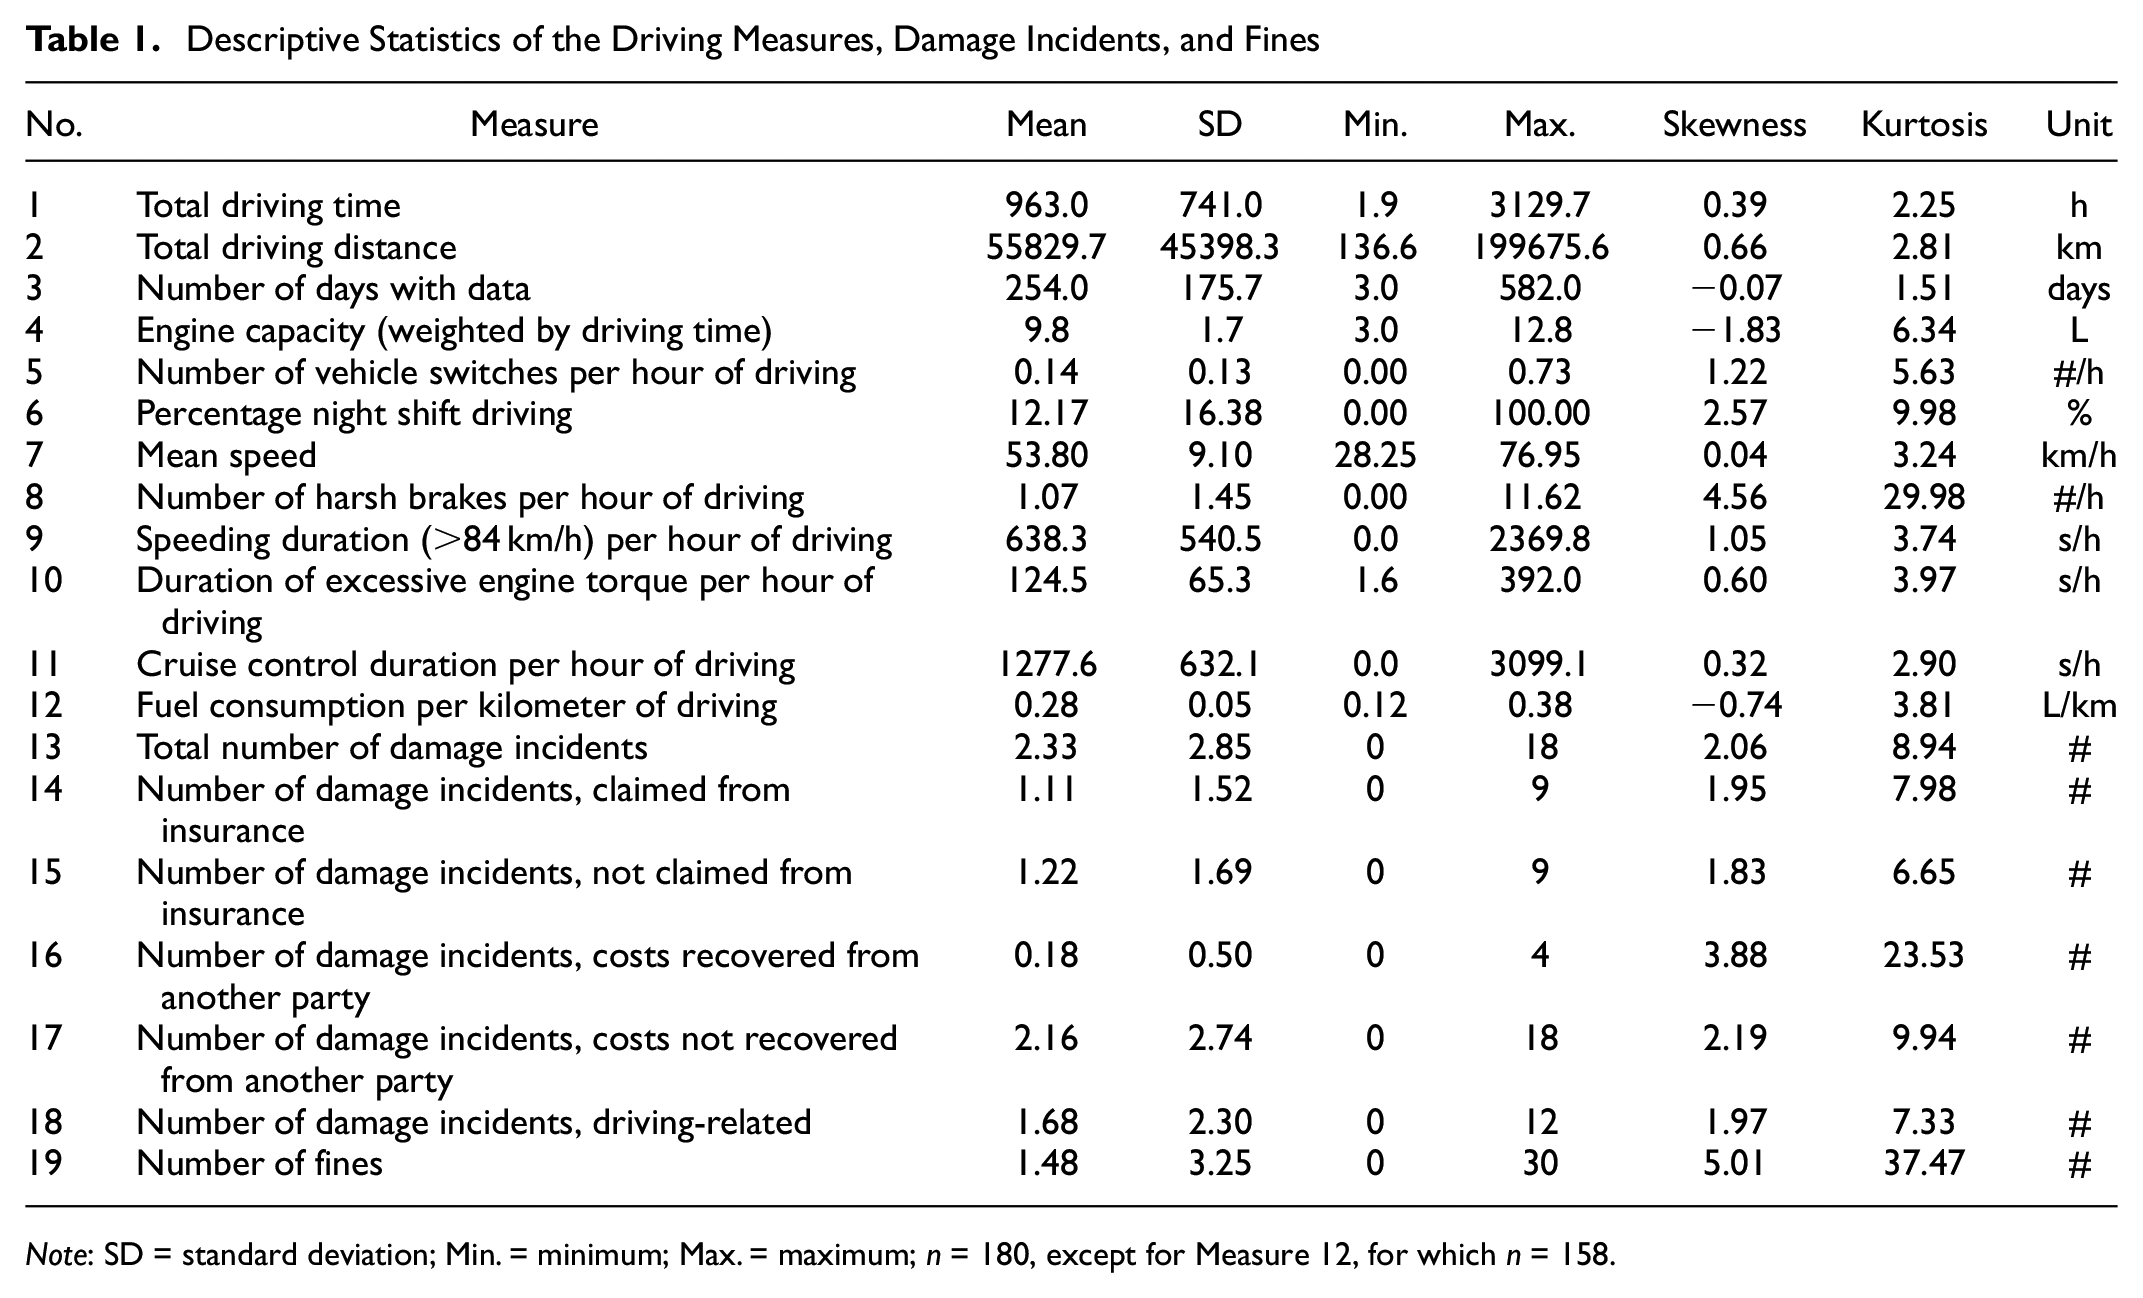
Note: SD = standard deviation; Min. = minimum; Max. = maximum; n = 180, except for Measure 12, for which n = 158.
Table 2 presents the Pearson correlation matrix among the various measures, from which several patterns can be discerned. Firstly, the number of damage incidents and the number of fines per driver can be predicted based on the number of harsh braking events per hour (highlighted in green). Interestingly, the number of damage incidents for which the costs were recovered from another party (and thus not attributable to the driver) showed a near-zero correlation with harsh braking. It is also worth noting that other behavioral measures did not strongly predict damage incidents and fines. For instance, contrary to expectations, speeding was not a significant predictor of fines, even though the majority of fines were issued for speeding.
Pearson Correlation Coefficients among the Driving Measures, Damage Incidents, and Fines
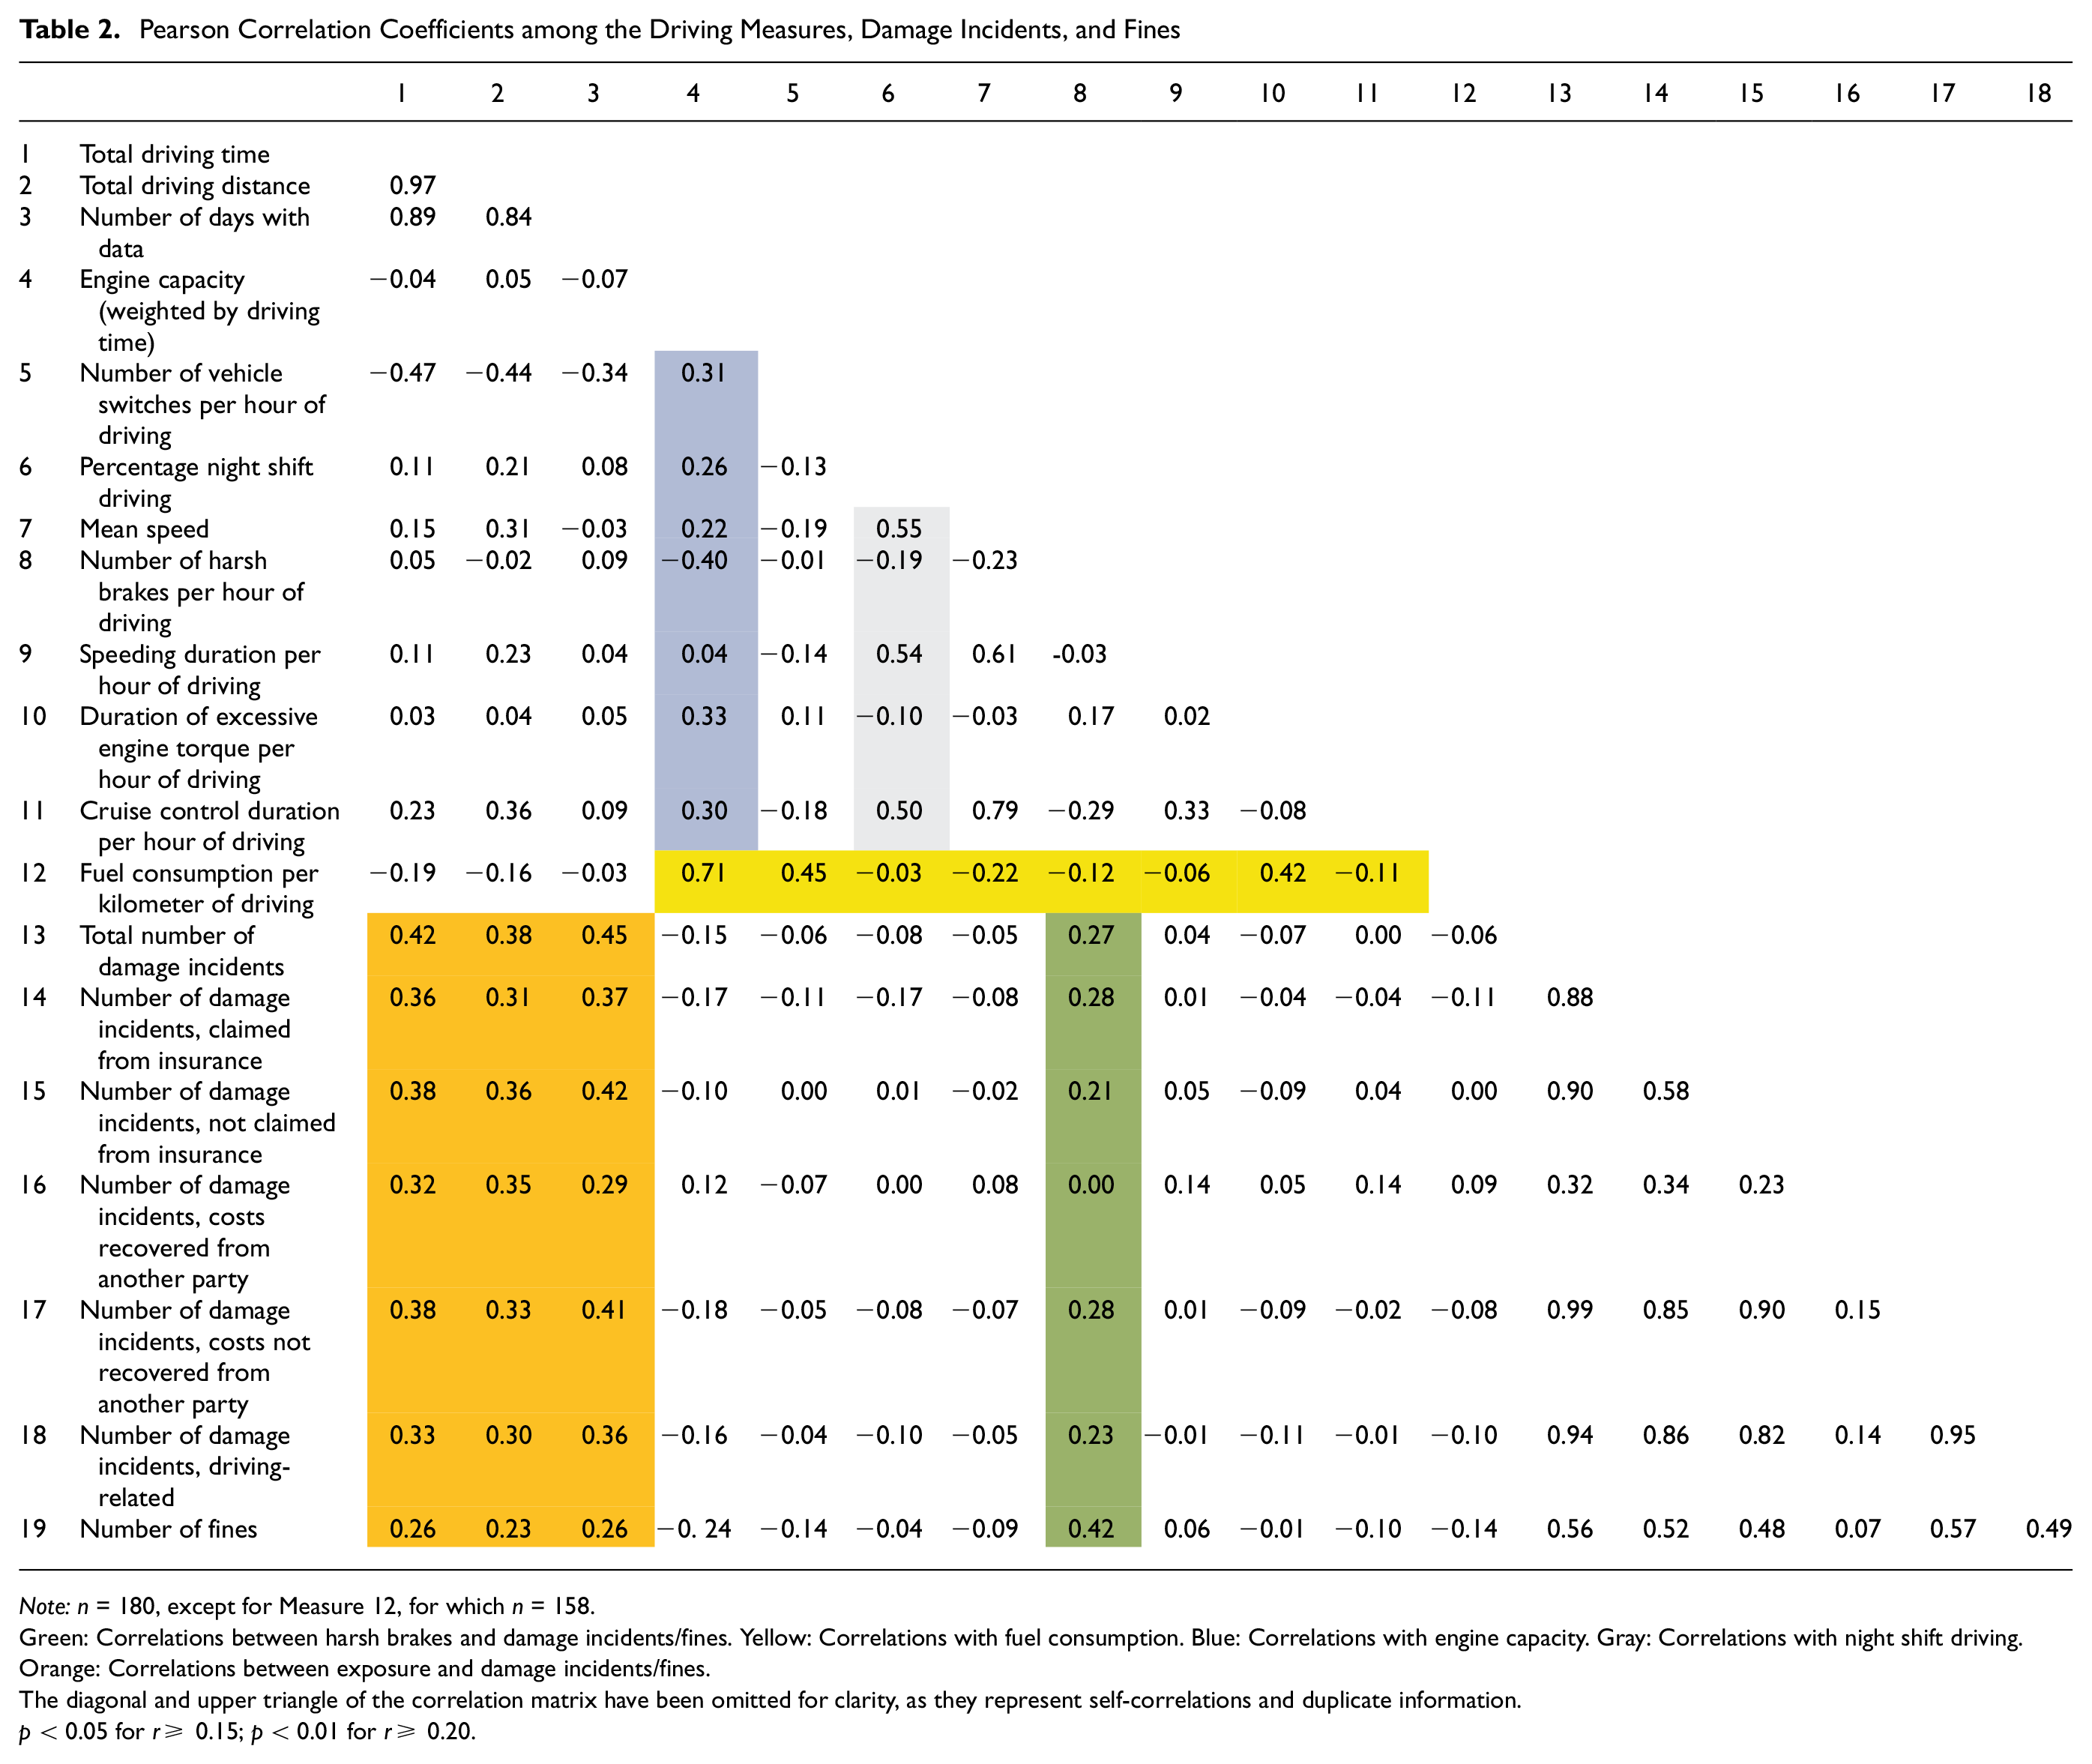
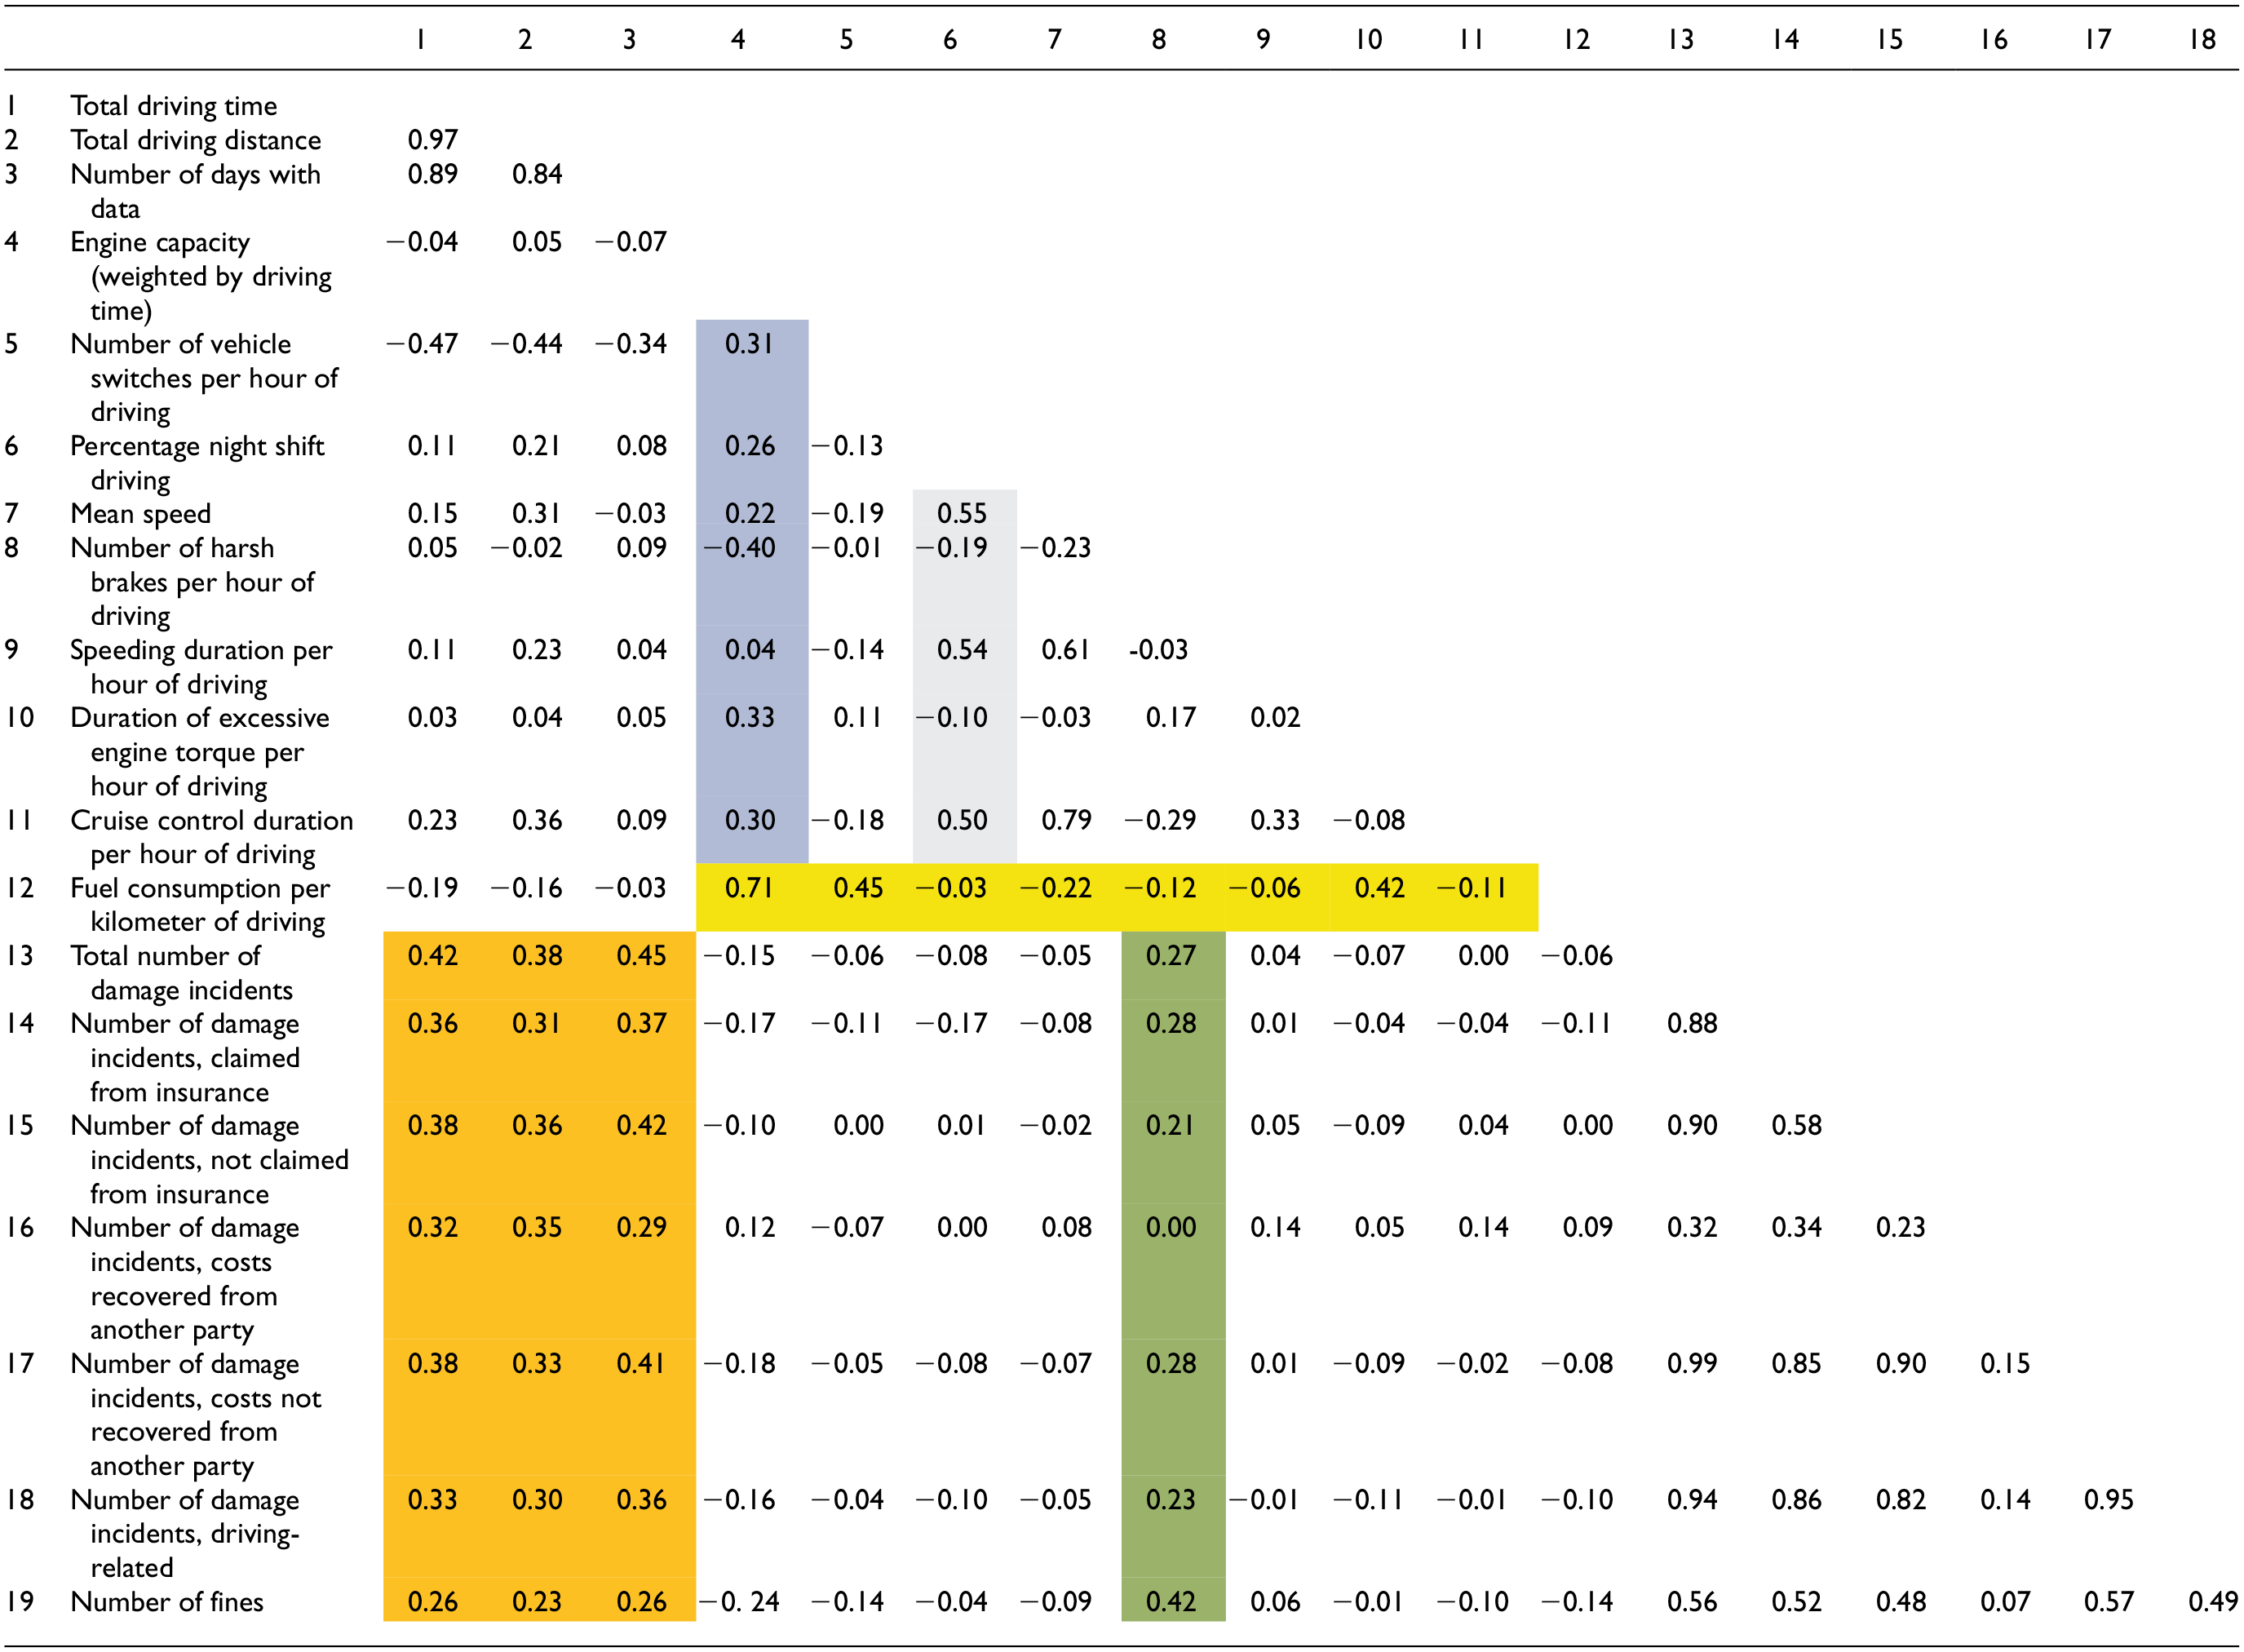
Note: n = 180, except for Measure 12, for which n = 158.
Green: Correlations between harsh brakes and damage incidents/fines. Yellow: Correlations with fuel consumption. Blue: Correlations with engine capacity. Gray: Correlations with night shift driving. Orange: Correlations between exposure and damage incidents/fines.
The diagonal and upper triangle of the correlation matrix have been omitted for clarity, as they represent self-correlations and duplicate information.
p < 0.05 for r≥ 0.15; p < 0.01 for r≥ 0.20.
Furthermore, the correlations with fuel consumption (Table 2; highlighted in yellow) demonstrated that fuel consumption per kilometer could be predicted based on the engine torque exceedance per hour. It is also evident that, apart from driver behavior, both session and vehicle characteristics contributed to the prediction of fuel consumption. In particular, drivers operating trucks with larger engine capacities exhibited higher fuel consumption, maintained greater mean speeds, and changed vehicles more frequently.
The characteristics of driving sessions were found to be correlated with various driver performance measures. Specifically, drivers operating trucks with larger engines (as shown in Table 2, highlighted in blue) tended to switch vehicles more frequently, drive with higher engine torque, experience fewer harsh braking events, and exhibit a higher mean speed and cruise control usage. Furthermore, drivers who were on the road more frequently during night shift generally drove at faster speeds and were more prone to speeding (as demonstrated by the correlation coefficients highlighted in gray). Lastly, the total driving time, distance covered, and the number of days with available data were found to be predictive of the number of damage incidents and fines (Table 2, highlighted in orange). These findings suggest that the impact of exposure should be taken into consideration in subsequent analyses.
Figures 1 and 2 depict the variations in driving behavior influenced by the time of day and the type of truck, respectively. Figure 1 (top left) demonstrates the differences in exposure (total driving time) throughout the day, with the majority of driving taking place between 05:00 and 17:00. Instances of speeding (Figure 1, bottom right) and cruise control activation (Figure 1, top right) were more common during night shift compared to day shift, while harsh braking events occurred more frequently during the day (Figure 1, bottom left). A noticeable shift in activity can be observed around 22:00, which may be attributed to the start of the night shift for drivers operating during night shift.
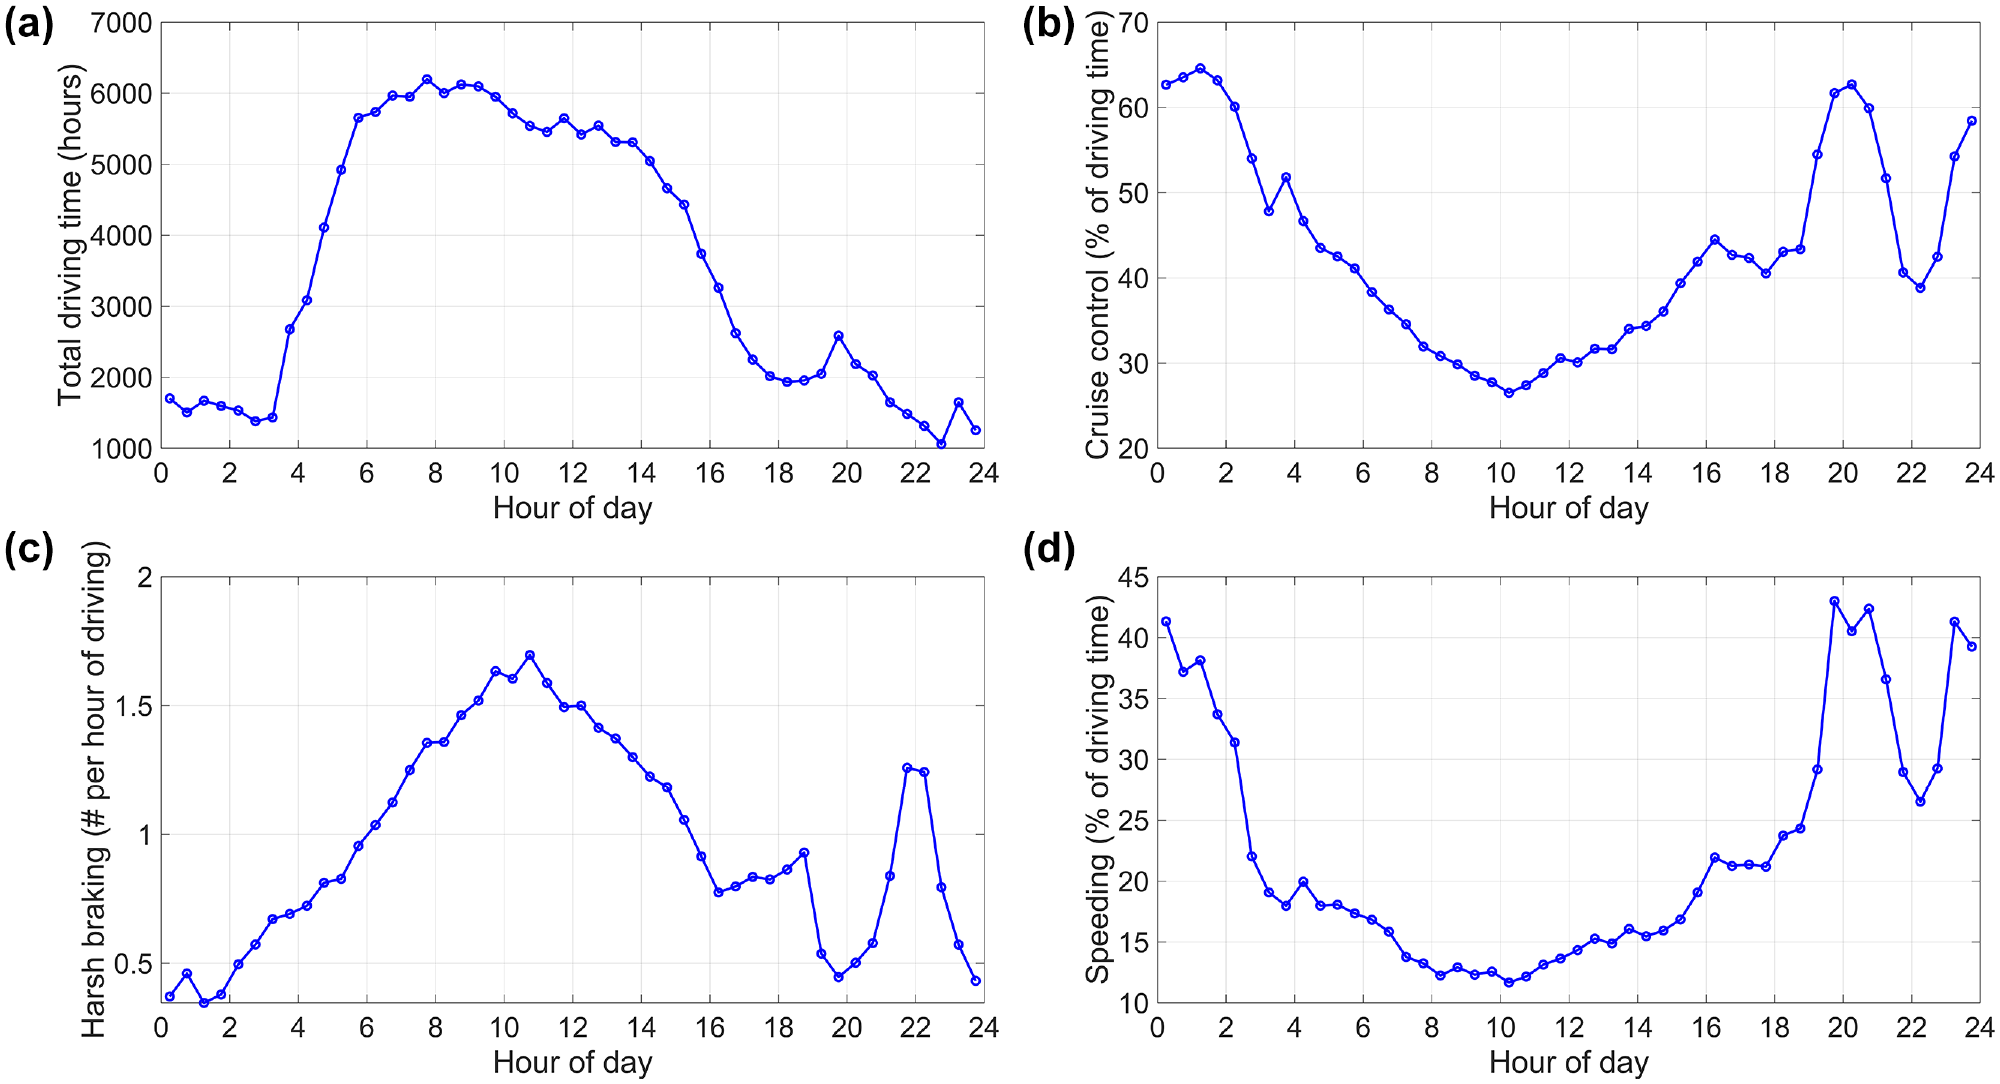
(a) Total driving time (hours), (b) percentage of driving time with cruise control activated, (c) number of harsh braking events per hour of driving, and (d) percentage of driving time where the driver was speeding, calculated from all recorded data samples (n = 533,577).
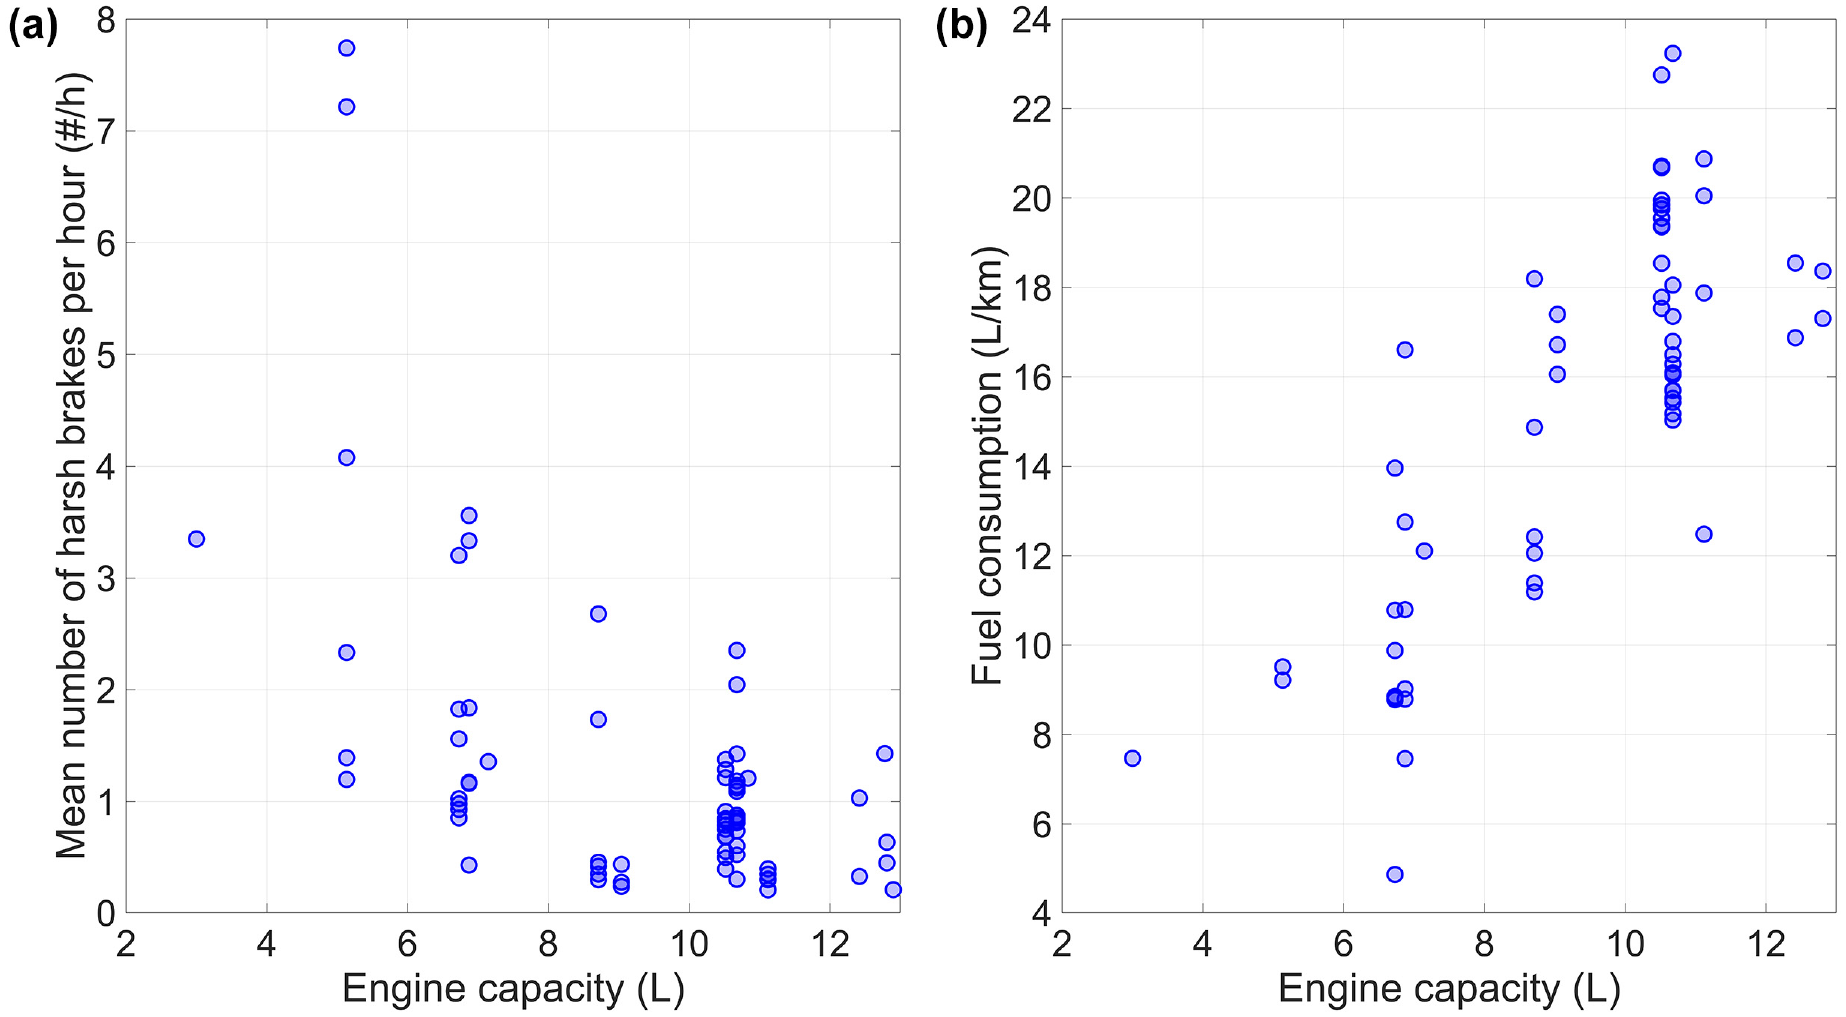
(a) Mean number of harsh braking events per hour of driving versus engine capacity (n = 70), and (b) fuel consumption per kilometer of driving (n = 62). Each marker represents a truck (fuel consumption was not recorded in eight trucks).
Figure 2 presents an analysis of the trucks within the fleet. Generally, trucks with smaller engine capacities exhibited a higher frequency of harsh braking events per hour. This relationship (r = −0.57) is consistent with the correlations observed at the driver level (r = −0.40, indicated in blue; Table 2), suggesting that in addition to the driver, the vehicle being operated should be considered in driver evaluations. Furthermore, it was evident that trucks with larger engine capacities consumed more fuel per kilometer (r = 0.78), a trend also observed at the driver level (r = 0.71).
Linear regression analyses were performed to predict the total number of damage incidents, the number of fines, and fuel consumption per kilometer of driving (Table 3). As observed in Table 3, exposure (i.e., the number of days with data) was a strong predictor of damage incidents. The harsh braking rate also served as a significant predictor, whereas the other variables did not exhibit significant predictions. Similarly, exposure and harsh braking were found to be predictive of fines. Lastly, fuel consumption was effectively predicted (overall r = 0.84) based on mean speed, the occurrence of high engine torque, engine capacity, and the number of vehicle switches per hour of driving.
Results of Three Linear Regression Analyses for Predicting (1) Total Number of Damage Incidents (n = 180, Overall Predictive r = 0.52), (2) Number of Fines (n = 180, Overall Predictive r = 0.48), and (3) Fuel Consumption per Kilometer Of Driving (n = 158, Overall Predictive r = 0.84)
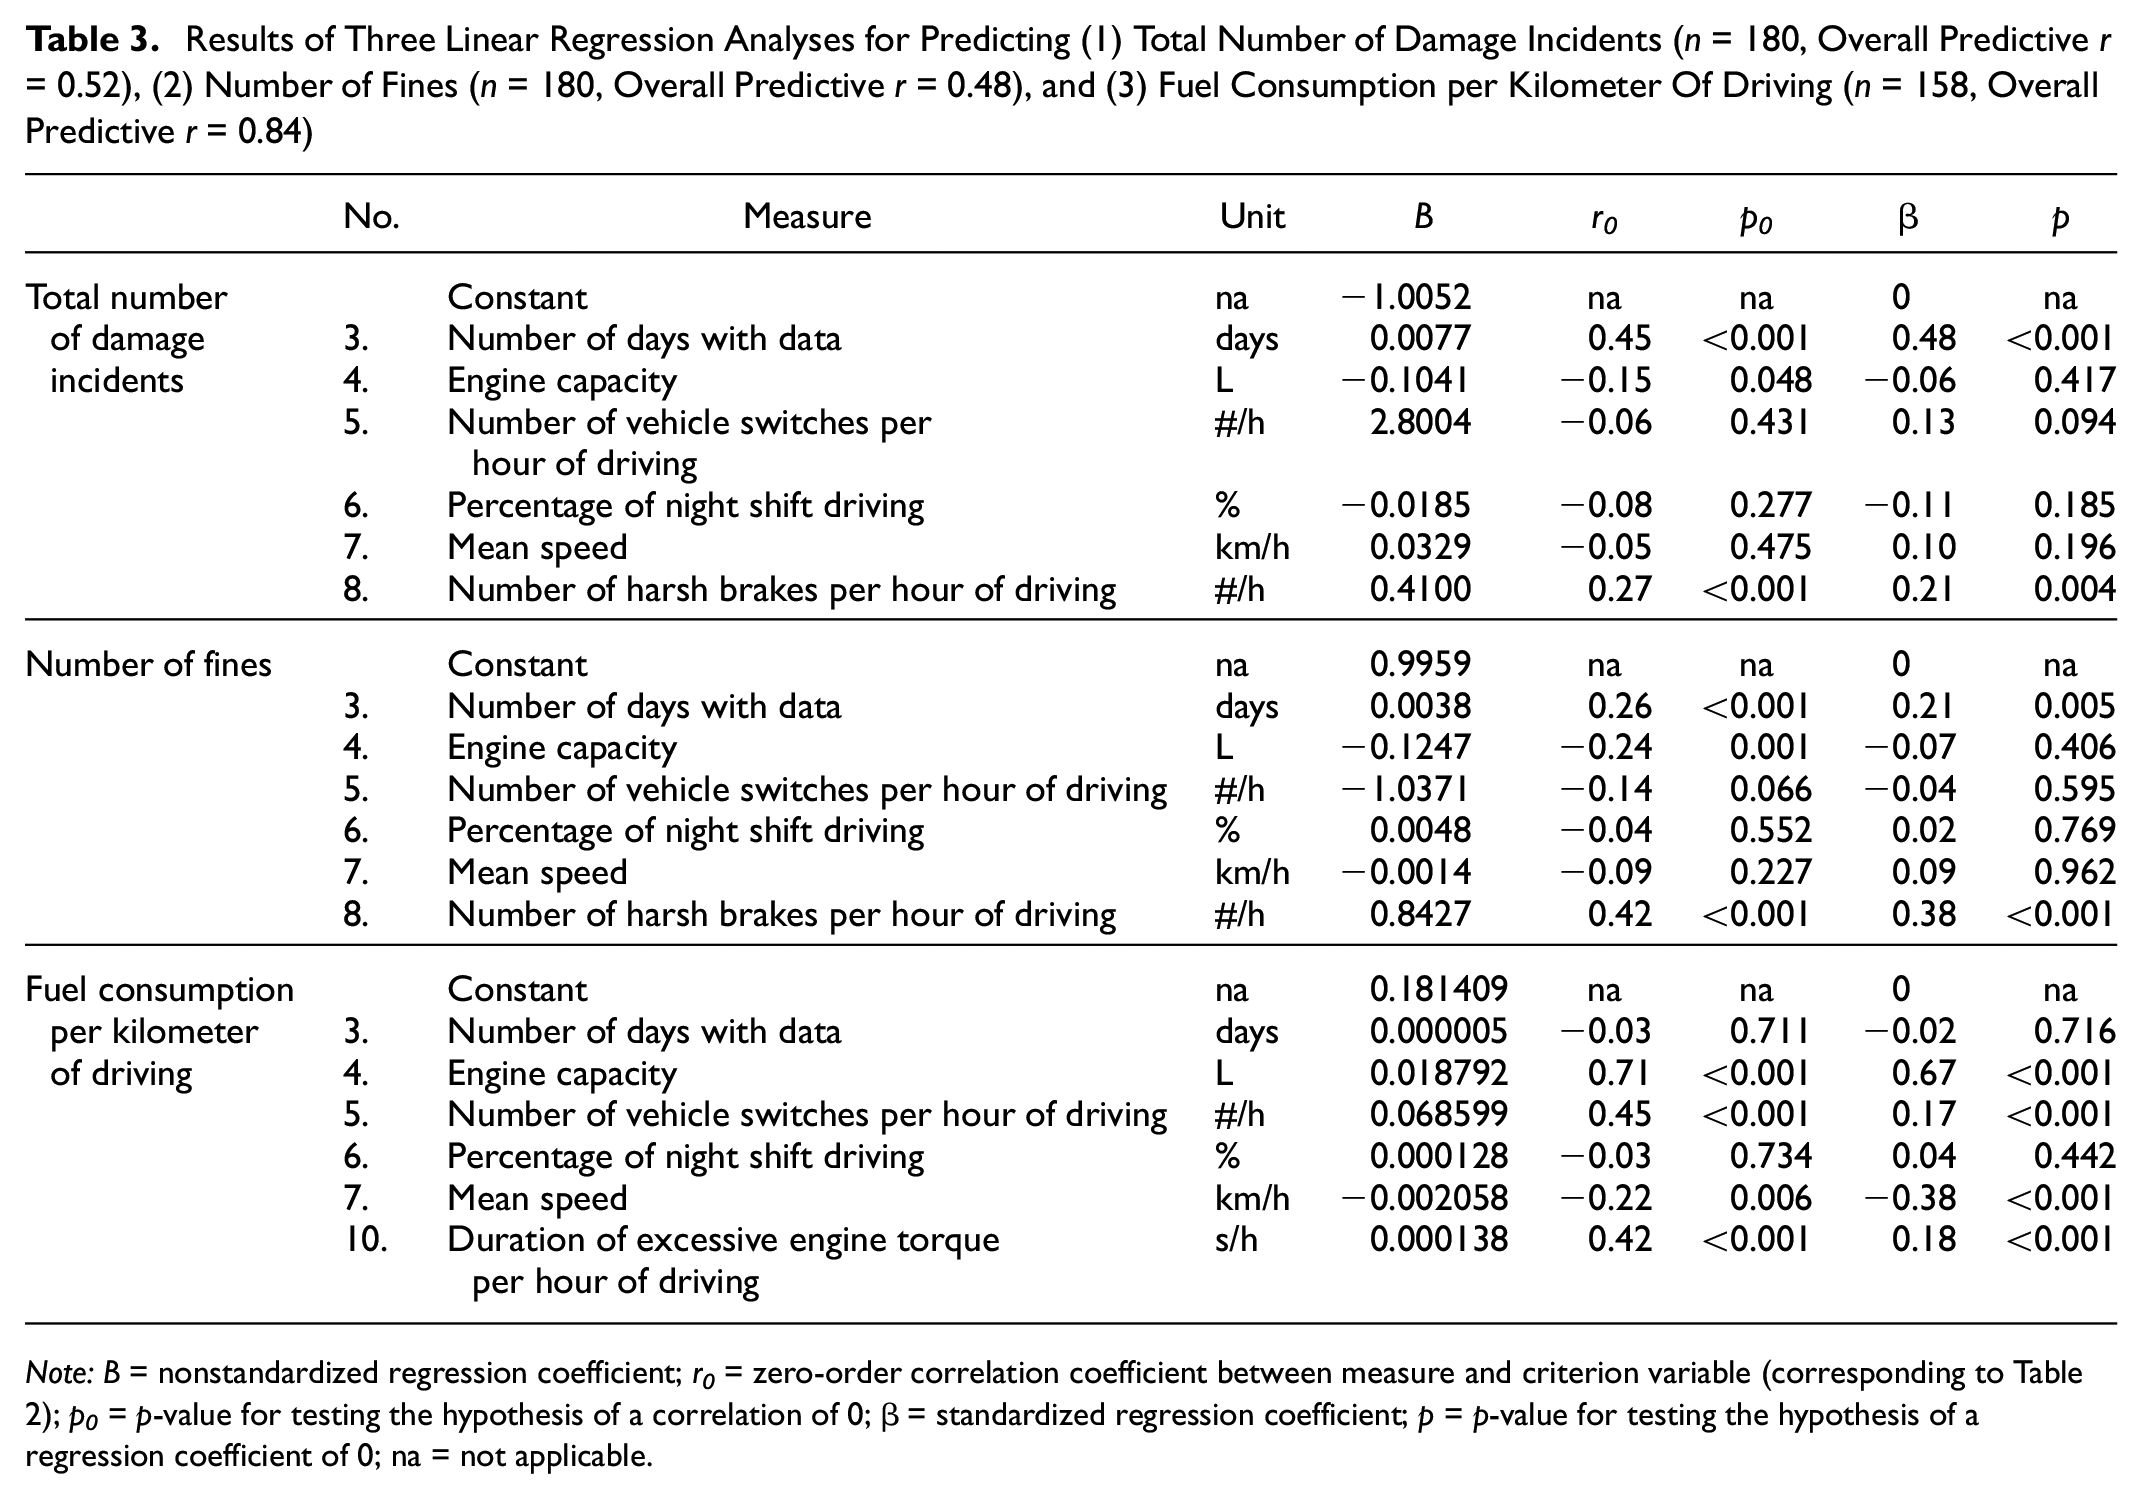
Note: B = nonstandardized regression coefficient; r0 = zero-order correlation coefficient between measure and criterion variable (corresponding to Table 2); p0 = p-value for testing the hypothesis of a correlation of 0; β = standardized regression coefficient; p = p-value for testing the hypothesis of a regression coefficient of 0; na = not applicable.
A limitation of the correlation coefficients shown in Table 2, as well as the regression analyses displayed in Table 3, is that several of the variables have a tailed distribution, as indicated by the skewness and kurtosis values in Table 1. With respect to the number of traffic fines, for example, the average among the 180 drivers was 1.48, but there was one driver who had as many as 30 fines (see Table 1).
These outliers do not necessarily invalidate our analyses, but they do imply that the analyses are less robust compared with a hypothetical situation in which the data would follow a nontailed distribution. To investigate the robustness of our findings, we repeated all analyses after applying a rank transformation ( 31 ). This transformation ordered all 180 values (or 158 values in the case of fuel consumption), corresponding to the individual drivers, from 1 (lowest value) to 180 (highest value), taking the average rank in the case of ties. This procedure, in the context of correlation coefficients, is equivalent to the use of the Spearman rank-order correlation coefficient ( 31 ).
Table 4 displays the same regression analyses as in Table 3, but after having performed a rank transformation on all predictor- and criterion variables. It can be seen that the statistically significant zero-order correlations for the behavioral variables (mean speed, harsh braking) were still statistically significant after performing the rank transformation, although they were somewhat weaker (compare Table 4 with Table 3). As for the regression coefficients (β r ), it is noticeable that harsh braking was still significantly predictive of fines, and that mean speed and excessive engine torque were also significantly predictive of fuel consumption. However, the number of harsh braking events was no longer statistically significantly predictive of the total number of damage incidents, with a regression coefficient of 0.10 compared with 0.21 without rank transformation (Table 3).
Results of Three Linear Regression Analyses for Predicting (1) Total Number of Damage Incidents (n = 180, Overall Predictive r = 0.55), (2) Number of Fines (n = 180, Overall Predictive r = 0.45), and (3) Fuel Consumption per Kilometer of Driving (n = 158, Overall Predictive r = 0.73), after Applying a Rank Transformation of the Individual Predictor Variables and Criterion Variable
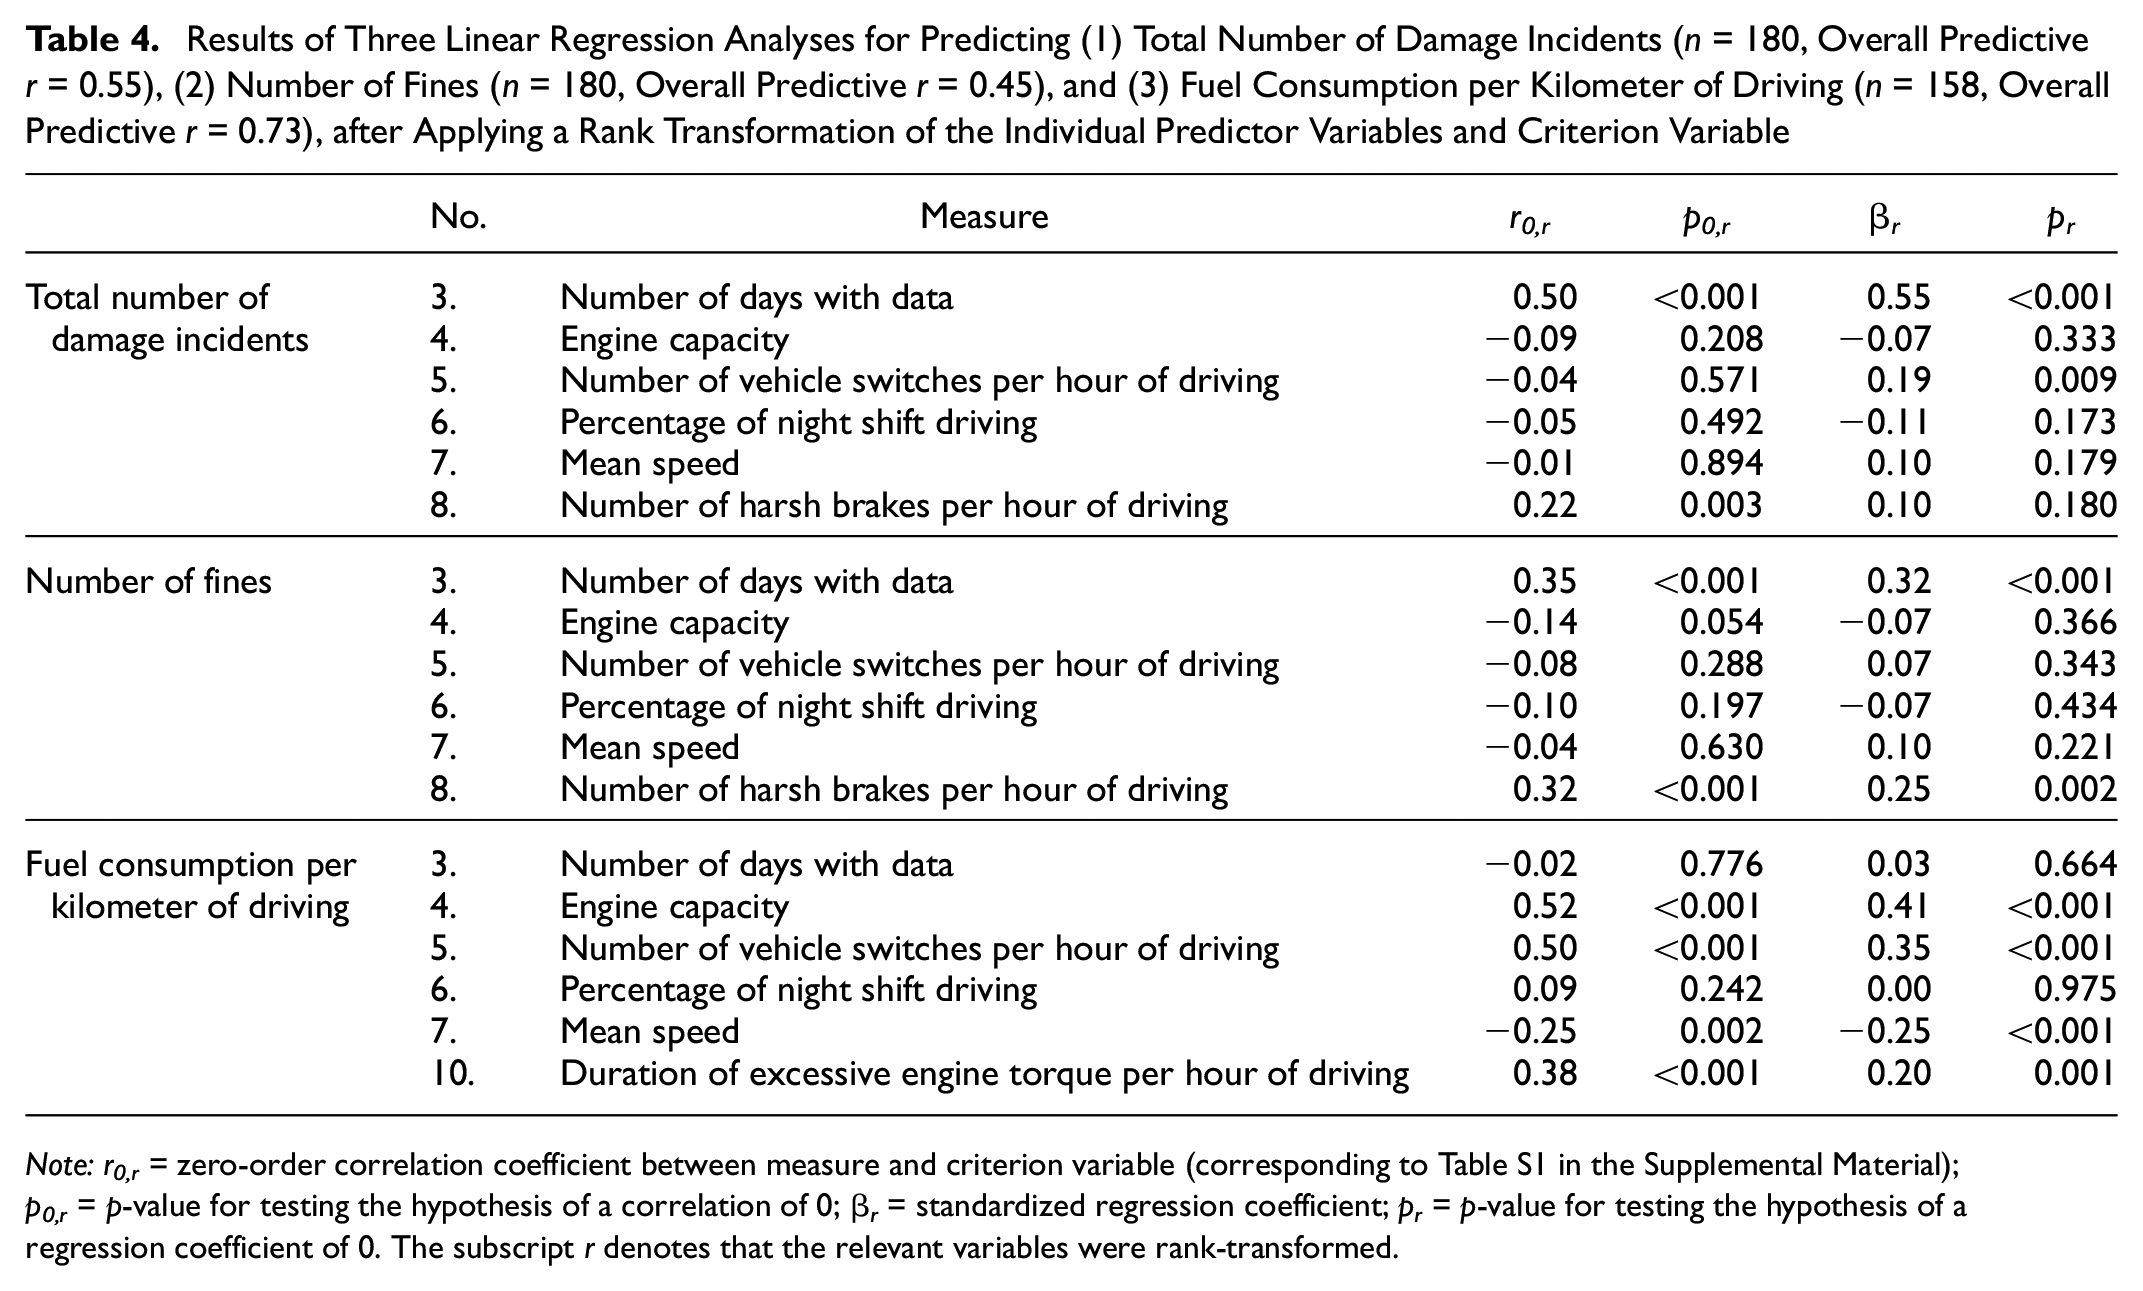
Note: r0,r = zero-order correlation coefficient between measure and criterion variable (corresponding to Table S1 in the Supplemental Material); p0,r = p-value for testing the hypothesis of a correlation of 0; β r = standardized regression coefficient; pr = p-value for testing the hypothesis of a regression coefficient of 0. The subscript r denotes that the relevant variables were rank-transformed.
Discussion
Damage Incidents and Fines
This study investigated the associations between driver behavior measures and the extent of damage incidents, fines, and fuel consumption at a Dutch transportation company over a 2-year period. A key finding was that the frequency of harsh braking events per hour of driving served as a predictor for damage incidents and fines. This relationship was initially identified through zero-order correlations and persisted even after accounting for factors such as the number of driving days, engine capacity, vehicle switches, the proportion of night shift driving, and average speed. That driver behavior remained a predictor of damage incidents and fines in the regression analysis, beyond just the zero-order correlations, indicates that drivers themselves, rather than solely the road environment or truck, served as an explanatory factor.
It must, however, be noted that a small number of drivers with an excessive number of fines and damage incidents, and corresponding frequent harsh braking, are likely to have made a substantial contribution to the observed correlation coefficients. When we compressed the scores by ranking all drivers, the correlations and regression coefficients became weaker, with the regression coefficient between harsh braking and damage incidents not even being statistically significant anymore. The rank transformation that we performed probably yielded statistically more robust results, but it has the drawback that the effects of the highly deviant drivers received less weight in the analysis.
The finding that severe braking events, or harsh longitudinal or lateral accelerations in general, can predict damage incidents is in line with findings from other studies (e.g., for bus drivers [ 32 ], for truck drivers [ 16 ], for passenger car drivers [ 12 ]). On a psychobehavioral level, harsh braking may contribute to accidents through various mechanisms. One possibility is that sudden braking indicates a causative relationship with an accident. For example, a driver might need to apply the brakes forcefully when confronted with a stationary object or road user ahead. Harsh braking could additionally signify inadequate hazard perception skills, as proficient drivers can detect hazards earlier and consequently apply the brakes more gently ( 33 , 34 ). Furthermore, harsh braking might result from distracted driving, occurring when the driver refocuses their attention on the road ( 35 , 36 ).
At the same time, our analysis demonstrated that the rate of harsh braking events was influenced by the type of work or truck assigned to the driver. For example, we discovered that a larger engine capacity correlated with fewer harsh brakes. Although heavier trucks can achieve a steady-state deceleration in an emergency stop nearly as high as that of lighter trucks or passenger cars, it takes longer to build up this deceleration ( 37 ). Moreover, heavier trucks possess greater inertia, and are probably driven more cautiously to prevent damage to the payload and to avoid jackknifing or a trailer swing. Another possible explanation for the association between engine capacity and harsh braking is that the drivers themselves are the cause, with less experienced or poorly skilled drivers being more likely to be assigned to smaller trucks, as also reflected in the different driving licenses that exist (e.g., C versus CE in Europe). Along the same lines, it has been proposed that one of the reasons long-combination vehicles are safer is that they are operated by better-trained drivers ( 38 , 39 ). In summary, our results suggest that truck damage incidents are caused by both the driver and the environment in which the driver operates. These findings are in line with Reason’s model of organizational accidents, which posits that adverse events (damage incidents) are the fault of the workers themselves as well as the “error and violation producing” conditions in which they must work ( 40 ).
Damage incurred in which the driver was not at fault (Measure 16) demonstrated an almost negligible correlation with harsh braking, consistent with Af Wåhlberg’s criterion for at-fault accidents: “Non-culpable accidents are not possible to predict with any variable when exposure has been controlled for” ( 41 ; Chapter 4). We additionally computed a correlation coefficient between the number of at-fault damage incidents (Measure 16) and the number of not-at-fault damage incidents (Measure 17), with the number of driving days (Measure 3) accounted for. The partial correlation was 0.04, indicating that at-fault and not-at-fault damage incidents were uncorrelated once exposure was adjusted for. This near-zero correlation can also be interpreted as a form of discriminant validity of the harsh braking measure, that is, harsh braking does not correlate with outcomes it should not be associated with. However, it is important to note that the mean (0.18) and standard deviation (0.50) of the number of at-fault damage incidents per driver were small, which indicates that correlations were attenuated ( 42 ; for a computer simulation, see De Winter et al. [ 43 ]).
One puzzling finding from our study is that the majority of truck damage incidents resulted from collisions during reversing, maneuvering, or swinging out, typically causing minor damage to bumpers, lights, or mirrors. A mere 1% of damage incidents involved rear-end collisions, where harsh braking might be expected as a causal antecedent, whereas numerous damage incidents were entirely unrelated to driving. This pattern of collisions warrants an inquiry into the causal relationship between harsh braking and damage incidents. It is conceivable that a common cause exists, potentially rooted in drivers’ personality traits, age, or experience, or in traffic conditions (e.g., harsh braking is more likely for drivers who frequently navigate hazardous environments such as cities). The personality psychology literature suggests that accident involvement correlates with low conscientiousness ( 44 ). This aligns with anecdotal evidence gathered from our conversations with managers at an insurance and transportation company, who indicated that accident-free drivers can be identified based on various nondriving behaviors and attitudes. Examples of such behaviors and attitudes include inspecting the truck for technical defects, ensuring safety before reversing, maintaining a clean cabin, and demonstrating a strong work ethic. These comments correspond with a study among Colombian truck drivers, which discovered that self-reported positive behaviors not directly related to driving (e.g., “I use my safety gear [hard hat, boots, and gloves] according to the safety requirements”) exhibited a negative association with harsh braking events ( 45 ).
Fuel Consumption
With respect to fuel consumption, our findings indicate that high engine torque (i.e., fully depressing the throttle) serves as a predictive factor, suggesting an influence of driving style. However, this behavior may also be determined by the truck’s interaction with the road environment. To illustrate, the correlation matrix revealed that trucks with larger engine capacities were more frequently driven at full throttle. This can be attributed to such trucks typically possessing greater mass and payload, which may—despite their increased engine power—necessitate full-throttle depression under certain conditions. To illustrate, focus group and interview research involving truck drivers demonstrated that during highway-merging tasks, acceleration is a critical subtask, as the driver must attain sufficient speed to merge safely ( 46 , 47 ). Consequently, depending on the situation, high engine torques can be considered a requisite rather than aberrant driver behavior. Several other studies have reached conclusions similar to ours ( 48 , 49 ). For example, Walnum and Simonsen examined the fuel consumption of heavy-duty trucks in Norway using FMS data ( 49 ). They determined that factors such as engine torque exceedance, running idle, driving in high gear, horsepower, truck type, and trip characteristics significantly influenced fuel consumption. Furthermore, they argued that road conditions (e.g., mountainous or not) and vehicle properties exert a more substantial impact than driver-behavior variables. The present study builds on previous research findings by demonstrating that these results are replicable in a fleet of trucks in the Netherlands. We have additionally shown that fuel consumption can be accurately predicted using a small set of variables.
Limitations
The present study offers insights into the factors influencing the expenses (fines, damage incidents, fuel consumption) associated with truck driving. However, as frequently observed in on-road driving studies, the results are subject to certain limitations. One such limitation is the data collection period, which spanned from 2020 to 2022, coinciding with the enforcement of COVID-19-related lockdowns. These restrictions have been documented to cause an increase in speeding, presumably a result of the decrease in traffic density ( 50 , 51 ). In addition to COVID-19 having an impact on the level of traffic on the roads, thereby influencing speed and possibly hard braking, it also had an effect on the truck companies themselves ( 52 – 54 ). The pandemic caused a disruption in supply gains, forcing companies to modify their business models in some cases, and in others to transport different types of cargo. There was also variability in volume, with some companies experiencing an increase and others a decrease in their clientele. Truckers also had to contend with possible closures of rest areas or limited access to restaurants, which may have had an indirect effect on their shifts ( 54 , 55 ). These factors may limit the generalizability of the current findings. We anticipate that COVID-19 could have had some influence on the absolute values, but we expect that the relative relationships, that is, the correlation coefficients obtained, are robust to effects of COVID-19.
Another limitation is that drivers were able to access summary scores and personalized text-based feedback through a mobile app. Moreover, the transportation company maintained records of driver accidents and employed a company coach (a certified driving instructor) to improve the safety-related behaviors of its employees. Moreover, traffic fines, such as those for speeding, were deducted from employees’ salaries. These complex feedback mechanisms are likely to have influenced driving behavior. In fact, it is conceivable that simply being aware of being monitored can lead to improved behavior and adherence to rules ( 56 ), a phenomenon that extends beyond the realm of driving (e.g., Kohli et al., [ 57 ], which examined hand hygiene compliance in hospital settings).
A technical limitation of this study is the relatively low frequency of driving event data sampling, which occurred approximately once per hour. To compute difference scores of accumulated events, at least two sample points per session were required, rendering short sessions with only one sample point unsuitable for the calculation of driver behavior scores. For future research, it is recommended to obtain data at a higher measurement frequency. Furthermore, we recognize that our analysis, based on FMS data, captured merely a small aspect of driving. Information on looking behavior, lateral maneuvers, advanced driver-assistance system warning events or activations, GPS data, and local speed limits, as well as measurements of the truck’s momentary mass and payload, were not available.
Further investigation may be required to ascertain the ideal thresholds for predicting accidents. In our study, the threshold for harsh braking was set at a relatively low value of 1.5 m/s2. Increasing this threshold would result in a reduction of braking events, placing greater emphasis on deceleration events closely associated with actual accidents. For instance, Cai et al. discovered that the number of forward-collision mitigation system activations was a more robust predictor of accidents than the number of harsh braking events, potentially owing to the former being a more likely precursor to actual accidents ( 16 ). Similarly, Perez et al. recommended a high deceleration threshold of 7.5 m/s2 for identifying accidents (which were labeled by trained coding staff) within a naturalistic car-driving dataset ( 58 ). In a study evaluating various deceleration thresholds among bus drivers in Iran ( 32 ), it was found that for deceleration thresholds of 2, 3, 4, 5, and 6 m/s2, the mean number of threshold exceedance events was 0.909, 0.172, 0.041, 0.011, and 0.002 per kilometer driven, respectively. The corresponding correlation coefficients with the number of crashes involving these bus drivers appeared to decrease with increasing thresholds: 0.208, 0.244, 0.209, 0.163, and 0.081, respectively. Furthermore, Khorram et al. demonstrated that the correlation with the mean absolute variation of speed ( 32 ) (referred to as “celeration”; see also Af Wåhlberg [ 59 ]) was stronger when the deceleration threshold was lower. In summary, the literature suggests that a lower threshold implies that the event count becomes more equivalent to the dynamics of the driver’s driving style. Exceedances of high thresholds will occur infrequently, and thereby exhibit relatively little statistical power, and when they do occur, they may be a precursor to an accident or near-accident, rather than a definitive indicator of the general driving style of the driver. In our study, the threshold was 1.5 m/s2, which is relatively low, and thus an indicator of driving style rather than emergency stops. Despite our low threshold, the number of exceedances was quite low—on average, once per hour—which can possibly be attributed to trucks frequently traveling on the highway where hard braking is rare.
A statistical limitation of this study is the high kurtosis and skewness exhibited by the data on damage incidents, fines, and certain driver behavior measures (see Table 1). This implies that the correlation and regression coefficients obtained are primarily attributable to a small number of drivers with extreme scores. One possible explanation for the outliers in the number of fines could be the presence of an undetected speed camera on a section a driver traversed for several consecutive days. Although the sample size was adequate for obtaining statistically significant effects, replicating this study with a larger number of drivers is recommended.
Another limitation of our research is the lack of data related to the characteristics of the drivers, including, but not limited to, age and years of driving experience. The literature demonstrates that in the context of passenger vehicles, young and inexperienced drivers display a greater propensity for engaging in risky behavior on the road, and they are disproportionately involved in accidents ( 43 , 60 ). In the case of truck drivers, the manifestation of risky behavior may be less pronounced, owing to their anticipated adherence to professional norms. Nonetheless, existing studies still reveal that young drivers of heavy goods vehicles are overrepresented in accidents ( 61 ). As indicated above, it is plausible that age, inexperience, or both, are underlying causes of harsh braking and accidents. Future research should document the personal characteristics of truck drivers to gain a broader understanding of the factors influencing the costs of truck driving.
Conclusions
The current study offers insights into the factors related to the expenses incurred in truck transportation. Our investigation, using a combination of datasets, revealed a connection between harsh braking and fines as well as damage incidents. Furthermore, the analysis suggested that a behavioral aspect underlies this association, implying that harsh braking incidents may be indicative of the driver’s unfavorable skills and attitudes (e.g., inadequate foresight and planning). Simultaneously, we demonstrated that harsh braking is not exclusively attributable to the driver. Factors such as route type (as represented by the variable “night shift driving”), the average speed of the session, and the truck itself were found to influence driving scores, damage incidents, and fines. In relation to fuel consumption, it appears that the truck, rather than the driver, served as the primary determinant.
Recommendations and Outlook
This study investigated the predictors of damage incidents and other costs associated with truck driving, with the aim of identifying potential avenues for cost reduction. Based on the findings that harsh braking events were predictive of damage incidents and fines, organizations could develop training and coaching programs to help drivers improve their driving behavior. This could include providing feedback on harsh braking events ( 62 ) and offering training on hazard perception ( 63 ) and defensive driving techniques ( 64 ). Training and coaching could be delivered through simulators ( 65 – 67 ), in-person sessions ( 68 , 69 ), online modules ( 70 ), or mobile apps ( 71 ). A review by Michelaraki et al. concluded that implementing gamification and reward schemes appears to effectively improve safety across various modes of transportation, including truck driving ( 72 ). Previous research has reported positive effects of the combination of monitoring and coaching on safe driving behavior ( 62 , 68 ). Advancements in driving safety may be closely linked to improvements in eco-driving. This is because safety indicators, such as reduced instances of harsh braking or maintaining lower speeds, are considered effective strategies for conserving fuel.
However, it must simultaneously be recognized that harsh braking does not necessarily have to be the direct cause of damage incidents or fines; it may be an epiphenomenon of other underlying issues. Indeed, although our work demonstrated predictive correlations between driving behavior and costs, we indicated that these correlations could emanate from multiple causes. These encompass aspects of the truck and its payload, the conditions under which a driver might operate, and the personality of the driver—concerns that go beyond mere harsh braking. Such an understanding compels us to adopt a broader approach to cost reduction. In developing this systemic approach, it is imperative to address the challenges known to both the transportation organization and the drivers. Transportation companies face various hurdles, including labor market shortages and strong competition. Concurrently, drivers often experience minimal face-to-face interaction with their employers, receiving their assignments through an app. The task of truck driving can be strenuous, especially when it involves navigating a large vehicle through congested urban areas. Zohar et al. highlighted a “psychosocial disparity, due to the fact that dispatchers in trucking companies are often more educated than drivers, yet have no truck-driving experience” ( 73 ; p. 19). They further found that leadership and work ownership indicators correlated with the frequency of harsh braking. These points signify that, in addition to coaching and evaluating drivers, the overarching safety culture is integral to truck driving safety (see also Huang et al. [ 74 ] and Mooren et al. [ 75 ]). An effective safety culture highlights safe driving practices and motivates drivers to take responsibility for their actions on the road.
Our study also elucidated associations between truck characteristics and driver behavior. This information may prove useful for organizations to refine their fleet management strategies. For example, when the payload permits, it may be advantageous to allocate drivers to trucks with smaller engine capacities. Such trucks have been observed to exhibit fewer instances of harsh braking and demonstrate decreased fuel consumption. In addition, organizations could benefit from a thorough analysis of their existing routes and schedules. Specifically, we recognize the potential of software that allocates drivers to trucks according to the necessary trip duration and payload. These recommendations align with last-mile delivery logistics (for optimization models, refer to Giuffrida et al. [ 76 ]), a topic that may necessitate additional investigation in the context of heavy goods vehicles.
Our analysis demonstrated that, although risky driver behavior can be reliably identified, it is also influenced by external factors such as the size of the truck and the time of day. Consequently, it is advisable to gather more data on these external variables. Using GPS technology could improve the validity of driver behavior scores by allowing them to be standardized in relation to other drivers on the same stretch of road (for a similar approach among car drivers, see Ma et al. [ 11 ]). The availability of GPS data would also contribute to the identification of accident-prone areas (for related methods, see Desai et al. [ 77 ], Kamla et al. [ 78 ], and Stipancic et al. [ 79 ]). In addition, incorporating other types of sensors, such as radar and cameras, might improve risk assessments associated with driver behavior.
Supplemental Material
sj-docx-1-trr-10.1177_03611981231211897 – Supplemental material for Predicting Damage Incidents, Fines, and Fuel Consumption from Truck Driver Data: A Study from the Netherlands
Supplemental material, sj-docx-1-trr-10.1177_03611981231211897 for Predicting Damage Incidents, Fines, and Fuel Consumption from Truck Driver Data: A Study from the Netherlands by Tom Driessen, Dimitra Dodou, Dick de Waard and Joost de Winter in Transportation Research Record
Footnotes
Author Contributions
The authors confirm contribution to the paper as follows: study conception and design: T. Driessen, J. C. F. de Winter; data collection: T. Driessen; analysis and interpretation of results: T. Driessen, J. C. F. de Winter, D. Dodou, D. de Waard; draft manuscript preparation: T. Driessen, J. C. F. de Winter. All authors reviewed the results and approved the final version of the manuscript.
Declaration of Conflicting Interests
The authors declared no potential conflicts of interest with respect to the research, authorship, and/or publication of this article.
Funding
The authors disclosed receipt of the following financial support for the research, authorship, and/or publication of this article: This research is funded by Transitions and Behaviour (grant no. 403.19.243; “Towards Safe Mobility for All: A Data-Driven Approach”), provided by the Netherlands Organization for Scientific Research (NWO).
Data Accessibility Statement
The datasets examined in the present study are not accessible to the public because of privacy considerations.
Supplemental Material
Supplemental material for this article is available online.
References
Supplementary Material
Please find the following supplemental material available below.
For Open Access articles published under a Creative Commons License, all supplemental material carries the same license as the article it is associated with.
For non-Open Access articles published, all supplemental material carries a non-exclusive license, and permission requests for re-use of supplemental material or any part of supplemental material shall be sent directly to the copyright owner as specified in the copyright notice associated with the article.