
Abstract
We present Vertiport-informed Surrogate-Based Optimization with Machine Learning Surrogates (VinS), a novel framework for solving the vertiport location problem for urban air mobility operations. The primary focus of this work is on the optimization of vertiport locations to facilitate efficient urban air transportation. Our framework helps choose not only the optimal vertiport locations but also the optimal number of vertiports. We develop a simulation model to analyze the impacts of various vertiport location configurations on the efficiency of the transportation network. To expedite the simulation process, a surrogate model is trained using machine learning algorithms, effectively reducing the computational time for evaluating a given vertiport location configuration. With the machine learning surrogate models, we apply a genetic algorithm to find the optimal set of vertiport locations. An empirical study was performed in the San Francisco Bay Area, from which we found that given the optimal set of vertiport locations, we further reduced the total travel time in the entire transportation system in the Bay Area compared with the sampled sets by 0.05% (400 h) on average. We release our framework at: https://github.com/Xuan-1998/LPSim.
Keywords
Evolving urban dynamics and the emergence of cutting-edge technologies have underscored the need for a transformative change in urban transportation systems. Urban air mobility (UAM), a paradigm that is gaining traction, involves the incorporation of the aerial mode into existing transport infrastructures, with the two-fold objective of reducing travel duration and mitigating road congestion. An in-depth exploration of the theories and challenges inherent to this nascent network is provided by Rajendran and Srinivas ( 1 ). The integration of ground-based and aerial transportation networks introduces a complex array of research challenges that warrant rigorous examination. A central focus of recent academic discourse has been the investigation of the interplay between these two modes and the strategic adaptation of existing infrastructures to serve UAM.
A critical element of the UAM infrastructure is the concept of “vertiports” ( 2 ), which are airports designed for electric vertical takeoff and landing (eVTOL) aircraft, much like heliports but for a broader range of air vehicles including drones and air taxis. Over time, the concept of vertiports has evolved with advancements in eVTOL technology, UAM, and the increased interest in sustainable and efficient transportation systems. They are seen as a part of the future urban infrastructure that can alleviate ground traffic congestion and provide rapid transit options. The task of designing these vertiports and, more importantly, determining their optimal locations for placement, presents a multifaceted challenge.
This paper seeks to address the vertiport placement problem using simulation, which can be used to assess numerous configurations. However, the complexity of urban mobility simulations, which requires the accurate representation of millions of entities, such as cars, networks, and air taxis, renders them both complex and computationally expensive. In light of this, our work aims to mitigate the execution time of these simulations by employing machine learning models as surrogate approximations. Specifically, we aim to pinpoint the optimal number of vertiports and their placements to minimize the overall travel time in the existing transportation network.
The remainder of this paper unfolds as follows. In the section “Literature Review” we investigate previous work and identify the main research gap. In the “Methodology” section we discuss the framework of the simulator, the construction of the machine learning surrogate model, and the genetic algorithm that is used to find the optimal set of vertiports. In the “Case Study” section we showcase the application of our framework in the Bay Area. In the section “Results” we discuss the performance comparison with state-of-the-art models and optimal vertiports locations. The paper concludes with the section “Conclusion,” where we encapsulate our conclusions and delineate potential avenues for future exploration.
Literature Review
In recent years, vertiport placements in urban air transportation systems have attracted considerable attention because of their complexity ( 3 ). Scholars have framed this problem as a spatial–temporal decision task, employing various domain-specific simulation-based optimization methods and machine learning models ( 4 – 7 ). Current methodologies used for the selection of vertiport location can be broadly categorized into three types: (1) Simulation-based models (SMs) that capture the complexities of urban mobility ( 8 , 9 ), (2) Surrogate models (SuMs) that serve as approximations for computationally expensive simulation models ( 10 , 11 ), and (3) optimization algorithms (OAs), such as genetic algorithms that find close-to-optimal sets of vertiport locations ( 12 ).SMs use a variety of factors, including traffic flow and travel demand, to simulate the impact of different location configurations. However, these models are computationally expensive, prompting the use of SuMs. SuMs, developed through machine learning algorithms such as Extreme Gradient Boosting (XGBoost), random forest (RF), and deep neural network (DNN), streamline the optimization process ( 11 , 13–16). Despite this, they pose their own challenges in capturing complex relationships between vertiport locations and objective function values. OAs are used to overcome these challenges and find optimal solutions ( 12 ). These methodologies have successfully addressed various aspects of vertiport location selection, providing valuable insights for urban air transport systems. However, as the complexity of urban air transport networks continues to increase, along with the need to handle more complex urban mobility conditions, several fundamental challenges persist.
The first major challenge in urban air transportation systems is the selection of optimal locations for vertiports. The complexity of this issue stems from the need to balance various factors such as traffic flow, travel demand, and infrastructure constraints ( 3 – 7 ). Simulation-based optimization has emerged as a valuable tool to address this, allowing decision makers to analyze different scenarios and configurations ( 8 ). However, as highlighted in a study by Rajendran ( 9 ), the interplay between ground-based and aerial transportation networks, as well as the strategic adaptation of existing infrastructures to accommodate UAM, introduces additional complexities and challenges in a large-scale context.
The second challenge lies in the resource-intensive nature of simulation-based optimization. To accelerate the optimization process and reduce computational resources, researchers have turned to surrogate models developed through machine learning methodologies ( 10 ). These models, such as XGBoost, RF, and DNN, serve as approximations or proxies for simulation models ( 11 , 13–16). He’s work focuses on developing surrogate-based optimization methods for transportation planning and operations, emphasizing the efficiency of surrogate models in large-scale transportation network research. By employing regressing Kriging and exploring models suitable for heteroscedastic data, the study advances the field by improving prediction accuracy and optimization efficiency in transportation system management ( 11 ). Hak Lee et al. investigate the preference of passengers between local and express trains using the XGBoost model ( 13 ). Guo et al. present a hybrid model combining RF Regression and Maximal Information Coefficient (RFR-MIC) to predict flight departure delays. The study shows that RFR-MIC outperforms other methods like linear regression and artificial neural networks, highlighting the benefit of incorporating flight information from multiple air routes for improved prediction accuracy ( 14 ). Blinova explores the use of neural networks to forecast the expansion of the air transport network in Russia, addressing the significant impact of accurate demand forecasting on investment efficiency in air transport ( 15 ). However, the application of the surrogate models on vertiport location selection problems comes with its own complexities, which require the tuning of machine learning algorithms and capturing the complex relationships between vertiport locations and objective function values, such as total travel time (TTT). And it requires the consideration of vertiport-related characteristics such as vertiport network configuration, distance between vertiports, road network, highway lengths near vertiports, and vertiport demand matrix, and so forth. Furthermore, Vertiport location simulation is related to both the global network travel time and local congestion, which is different from problems like bus location selections which are only related to small regional traffic conditions ( 17 ).
The final challenge arises from the need for efficient OAs to identify an optimal number of vertiport locations. Genetic algorithms, which simulate the process of natural evolution to find close-to-optimal sets of vertiport locations, have been employed to solve this problem ( 12 ). But optimization of urban air transport is an ever-evolving field, with future research potentially focusing on the refinement of machine learning models, considering additional factors influencing optimal location selection of vertiports, and expanding the application of these methodologies to other urban contexts ( 18 ). The continued evolution of these techniques and methodologies is crucial to overcoming the challenges of urban air transportation, and ultimately shaping the future of UAM.
To address the aforementioned challenges, it is essential to delve into the underlying complexities of vertiport location selection and identify significant factors that contribute to the effectiveness of urban air transportation systems. These factors can then be integrated into the design of SMs and SuMs as informative priors. In general, the nodes in the transportation network or the vertiport locations are considered as units of the UAM network. The field of transportation planning has identified three levels of influence between these units: intra-unit interaction (within a vertiport), inter-unit interaction (influence of nearby vertiports), and network-level propagation ( 3 , 8 , 9 ). An effective vertiport location selection model should be capable of capturing interactions at all three scales. Intra-unit interactions involve considerations within the network near a single port, such as capacity, speed limitations, and demand. Inter-unit interactions involve the influence of nearby vertiports, considering aspects like shared demand and overlapping service areas, and the demand between vertiports. Network-level propagation involves the broader impact of a vertiport on the overall UAM network, such as changes in travel times. Integration of these interactions into the model design can provide a more comprehensive and accurate understanding of the optimal location of the vertiport ( 10 – 12 ).
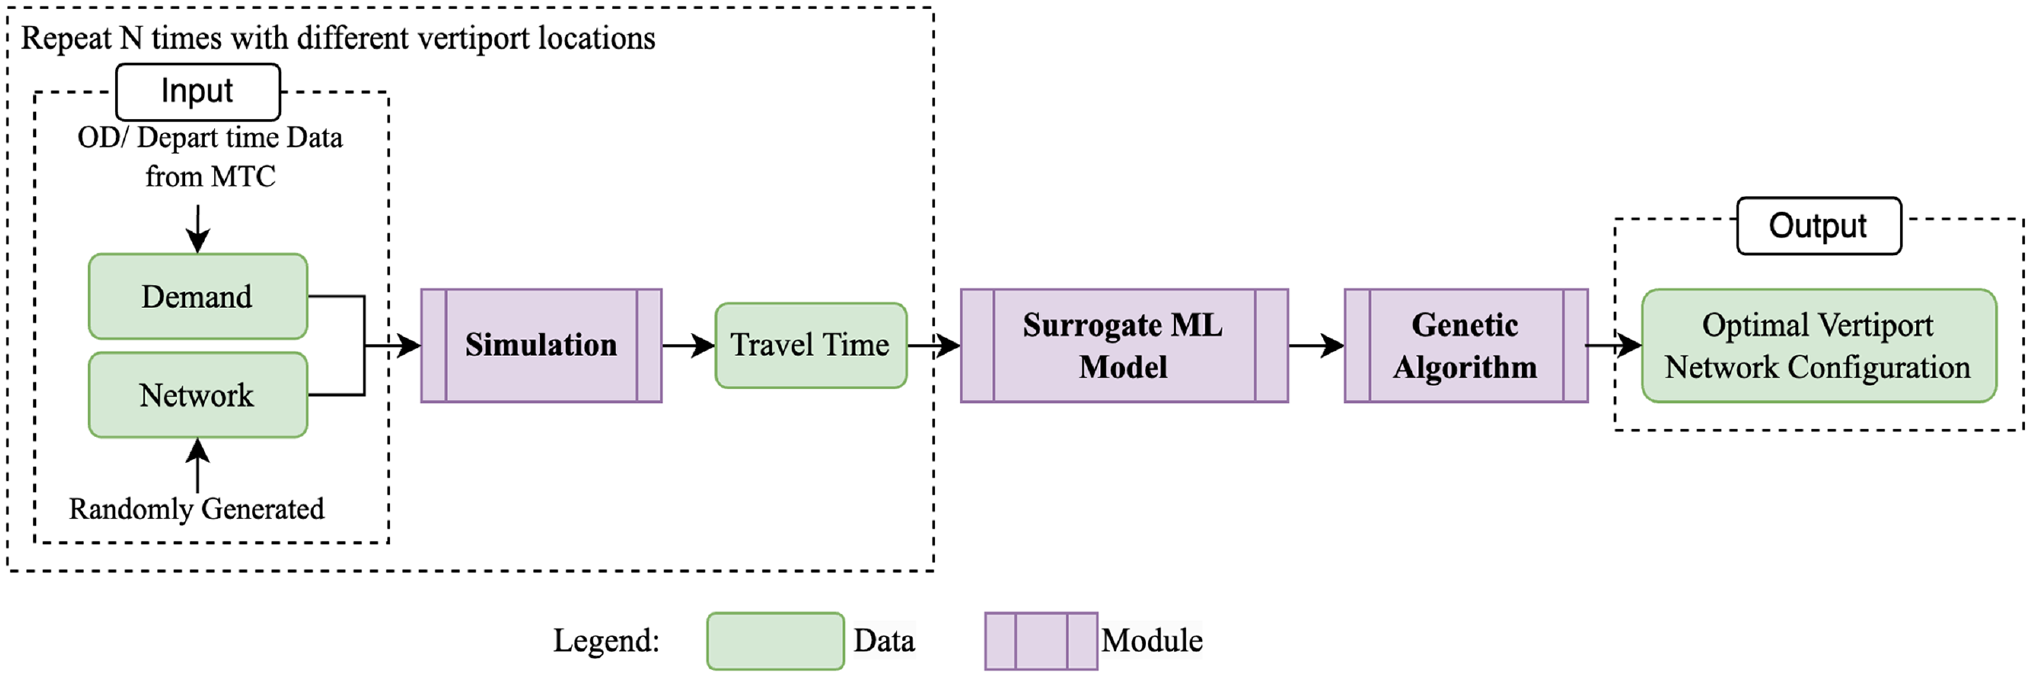
With these domain priors injected, we propose a novel machine learning architecture, named Vertiport-informed Surrogate-Based Optimization (VinS). We trained the VinS on the network of the San Francisco Bay Area and a representative day demand based on the data provided by the Metropolitan Transportation Commission. The VinS architecture is shown in Figure 1. Through rigorous evaluations, the VinS is able to find the optimal number of vertiports and their corresponding locations. And the performance of VinS improves significantly with built-in prior knowledge. In summary, our simulation-based optimization (SBO) contributions include the following:
To achieve improved performance for regional-wide vertiport location selection, we have customized the state-of-the-art SBO architecture incorporating a GPU-based regional traffic simulator.
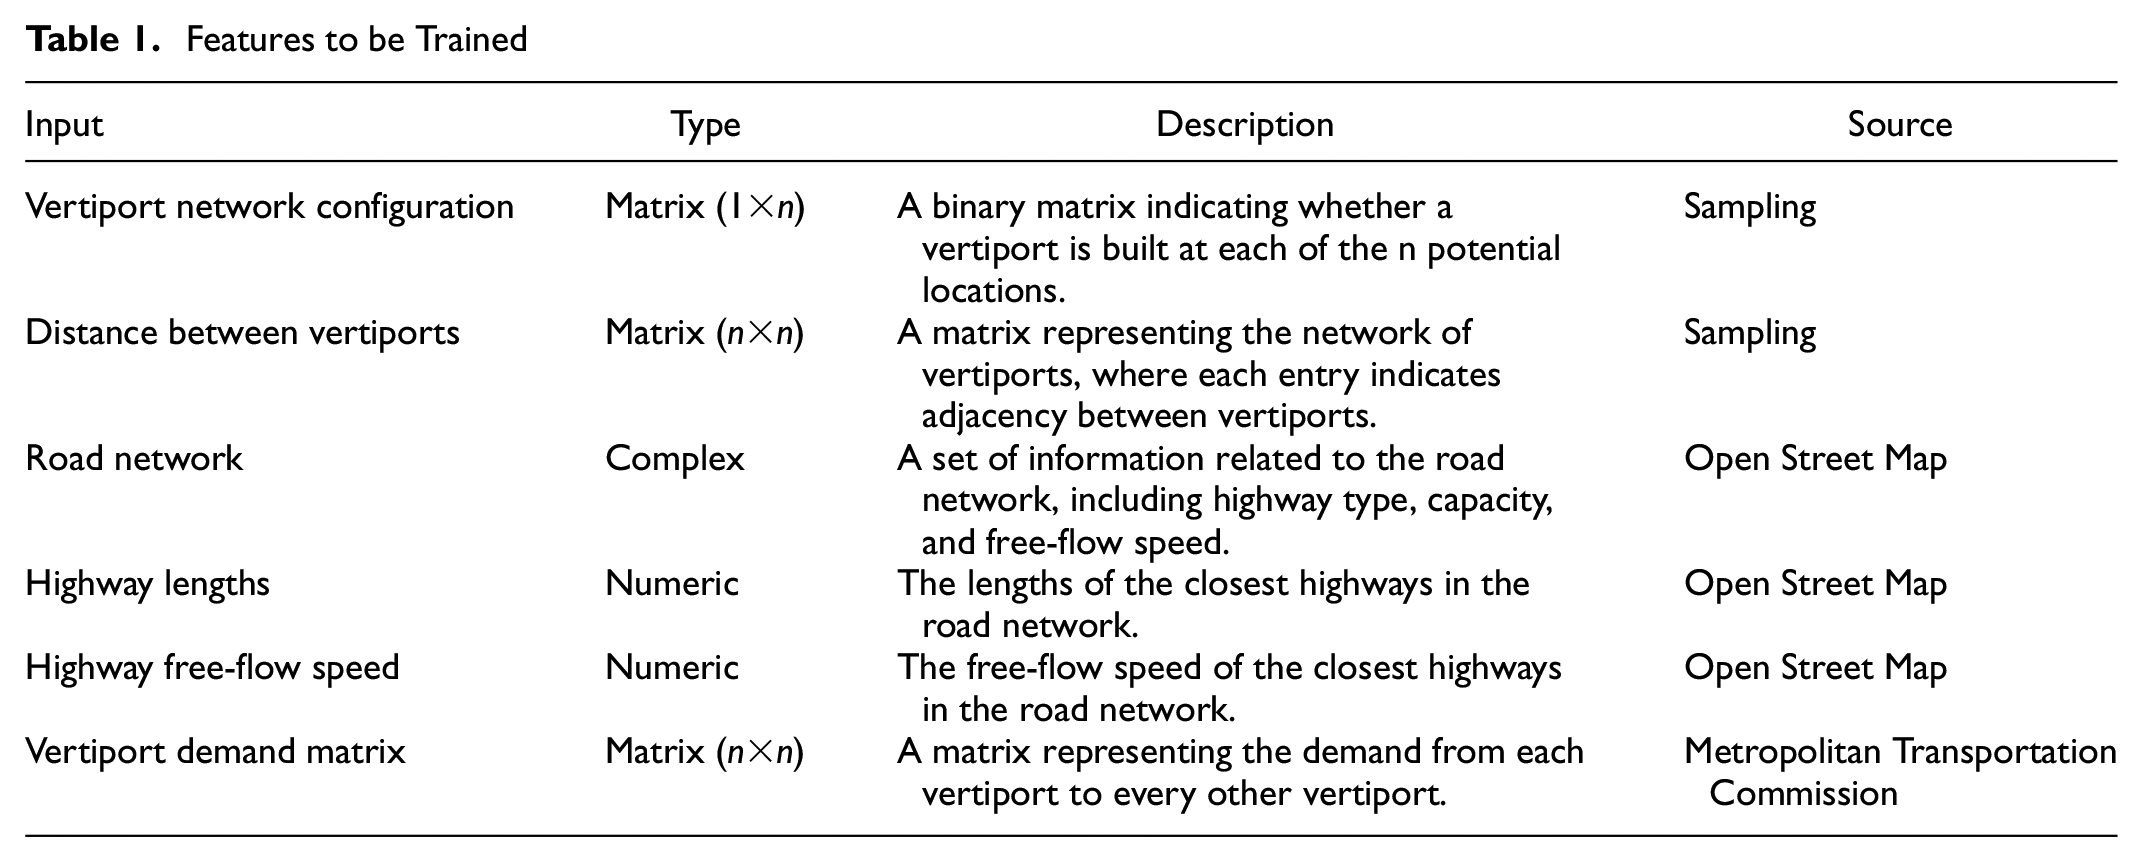
To overcome the limitations of current models, namely weak generalization to heterogeneous networks and limited modeling of location selection, we have incorporated prior structures from the transportation system. We have designed interdisciplinary components, such as the binary vertiport selection matrix, the adjacent vertiport distance network matrix, the vertiport demand matrix, and road network information, such as highway lengths and capacity. These structures have been integrated into the surrogate model as primitives of the UAM domain.
With extensive and rigorous evaluations of real-world datasets, the proposed model can not only find the optimal number of vertiports but also the optimal vertiport locations consistently. To the best of the authors’ knowledge, this is also the first region-wide vertiport location selection scheme that can effectively handle a vertiport selection for a large-scale area like the San Francisco Bay Area.
Analytical framework.
Methodology
The proposed SBO framework is depicted in Figure 1. We begin with a set of all candidate locations for vertiport placement and randomly generate vertiport network configurations. We then use the simulator to evaluate the effects of these randomly generated vertiport network configurations on the entire transportation network. Next, we construct a machine learning surrogate model that maps vertiport network configurations to the measure of interest that the simulator computes. We use the constructed machine learning surrogate model to assist in a genetic algorithm to find the optimal vertiport network configurations.
We aim to solve the optimization problem as follows: Let
The optimization problem can be formulated as follows:

subject to:
Sampling
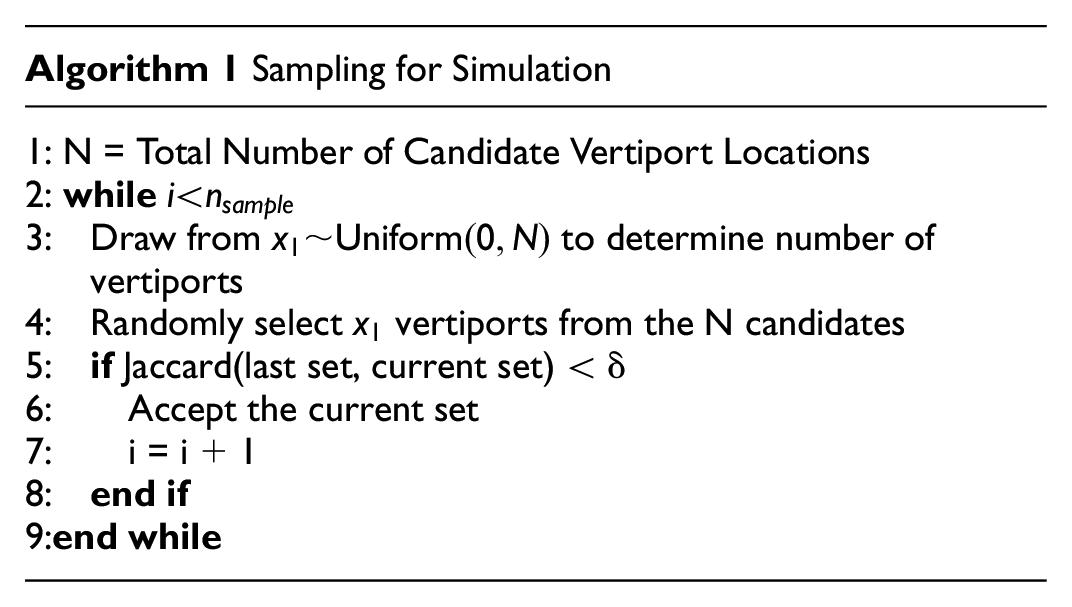
Algorithm 1 details the process of generating vertiport network configurations for evaluation. Given the computational expense, we want maximize the representation of a limited set of network configuration samples so that the machine learning surrogate models can better learn the underlying patterns between the vertiport network and the TTT of the system. For each new sample we generate, we measure the Jacard index ( 19 ) between the the new sample and the last sample and set a threshold under which we will accept the new sample. The Jacard index is defined as:

where
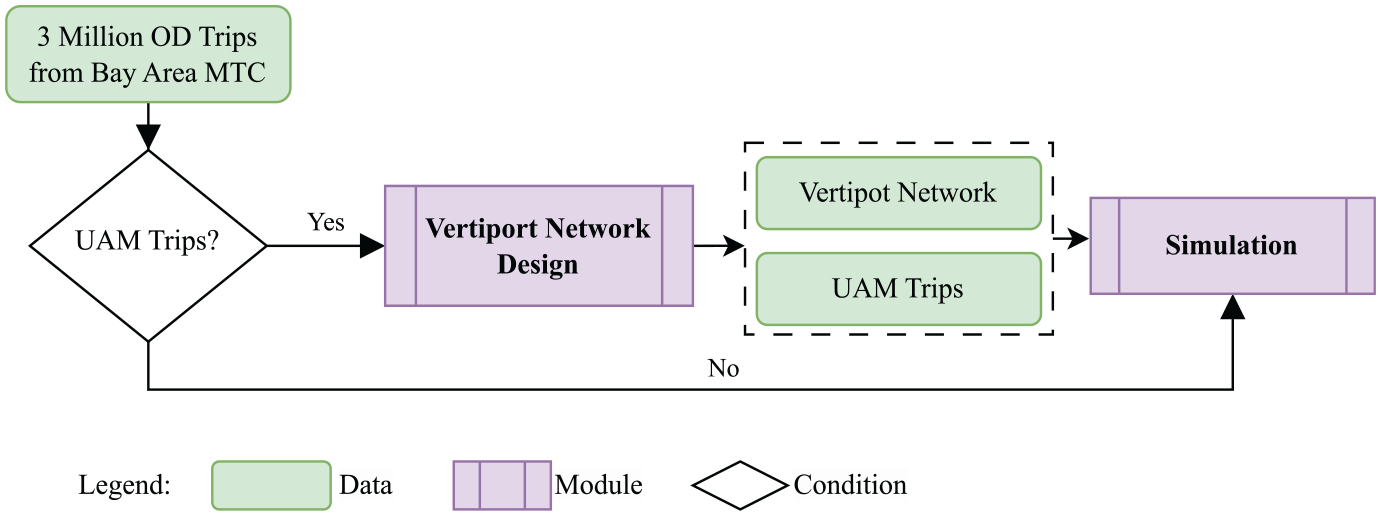
Driving and Multi-Modal UAM Simulation
The MANTA simulator is designed for ground-based traffic simulations and uses the intelligent driver model (IDM) to simulate car speed and acceleration ( 20 ). To assess the best placement of the vertiports, we extended MANTA from a single modal simulator to a bimodal simulator—LPSim ( 21 )—to simulate regional traffic, incorporating both driving and UAM modes, as shown in Figure 2. Initially designed for road traffic simulation, the MANTA model inputs traffic network data from the Open Street Map (OSM) and origin–destination (OD) pairs. These data form a graph of traffic intersections (nodes) and roads (edges).
Simulation process.
The IDM, a continuous-time car-follower model, simulates vehicle velocity and acceleration (
20
). A vehicle’s acceleration is determined by its dynamics and that of the leading vehicle, from the equation:
The IDM parameters are calibrated with link-based speed data from the Uber Movement ( 22 ) open access project in the Bay Area, and the simulator also includes a probabilistic lane change model and a gap acceptance algorithm ( 23 , 24 ). LPSim uses a parallelized Dijkstra priority queue single-source shortest-travel-time path algorithm for routing, and the simulator has been validated using California Household Travel Survey (CHTS) data for the Bay Area and the Uber Movement project’s observed data ( 22 ). The results indicate that the simulator is capable of capturing the dynamics of real-world traffic conditions and produces comparable results, with the mean distance traveled, median values, and 75th percentile distances similar to those observed in the CHTS data. The simulated travel speeds of LPSim have been compared with Uber Movement data for 95,510 edges, which represent around 17% of the total edges in the San Francisco Bay Area network, and the results suggest that the simulator is capable of capturing real-world traffic conditions ( 22 ).
To incorporate the UAM travel mode into MANTA, a UAM analogy model is introduced. This model, LPSim, comprises a set of air links that connect vertiports with the haversine distance, which is integrated into the traffic street network and used as input for LPSim, as shown in Figure 3
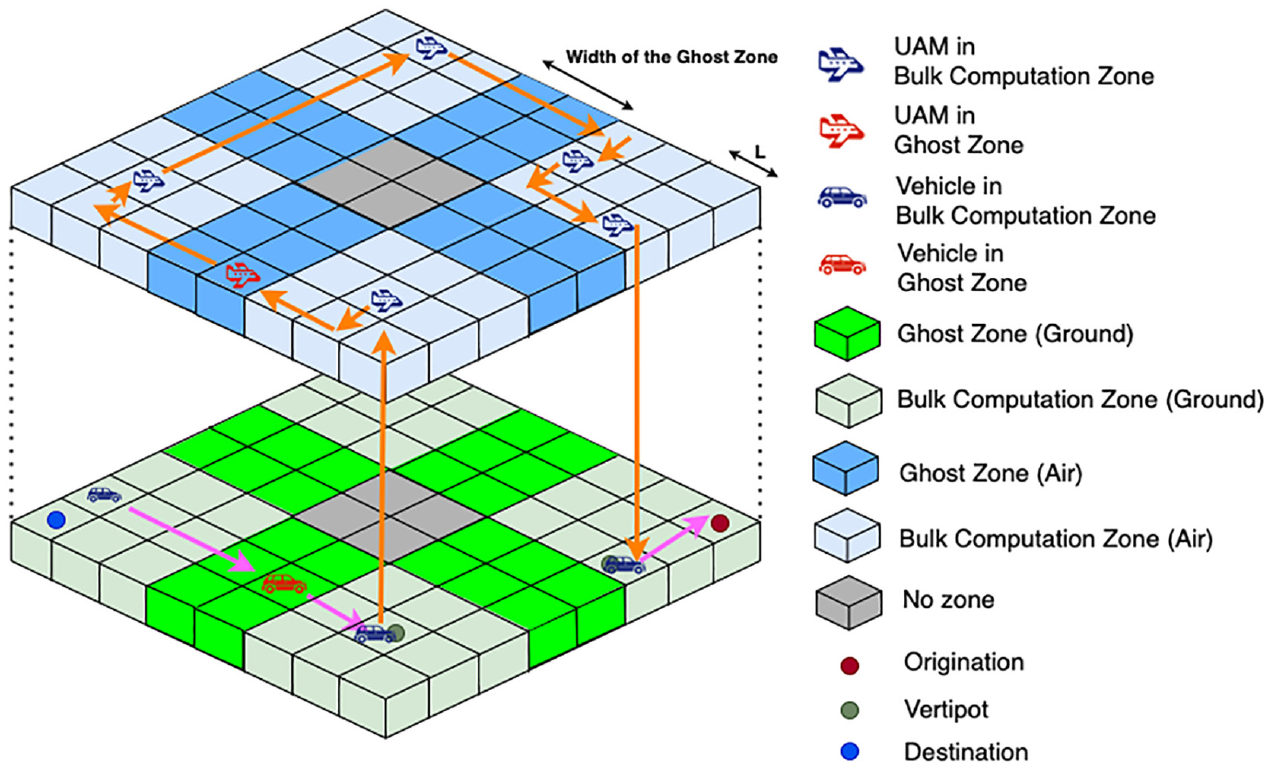
Ground and urban air mobility (UAM) simulation.
The desired speed for each road is a critical parameter in IDM, and the UAM cruise speed of 137 mph is set as the desired speed for air links. To avoid possible delays resulting from vehicle interaction, each air link has many lanes, typically around 100. UAM passengers can use ground speed for their access and exit legs and high UAM cruise speed for air link travel. Although individual vehicle speeds may vary, the average travel speed is expected to be close to the speed limit, with an average air travel speed of 137 mph ( 25 ) based on LPSim simulation data. For UAM trips, an additional 5-minute travel time is expected for the ascent and descent of the UAM aircraft.
During the simulation, routes for both UAM and non-UAM users are predefined to prevent non-UAM users from utilizing air links. The shortest travel time path from origin to destination is computed for non-UAM users, whereas the routes for UAM users consist of access and exit paths on the ground traffic system and the corresponding air link. We use a UAM allocator module that conducts a comparative analysis of UAM users’ travel times with those who opted to drive. In cases where UAM travel times are not significantly beneficial, non-benefited UAM users are reallocated to the ground mode. In this paper, we assume that the vertiports are sufficiently large such that they can accomodate all the demand for UAM.
Machine Learning Surrogates
Model Features
Table 1 describes the key features that are used in the machine learning model. The feature, Vertiport Network Configuration, is a
Features to be Trained
Model Setup
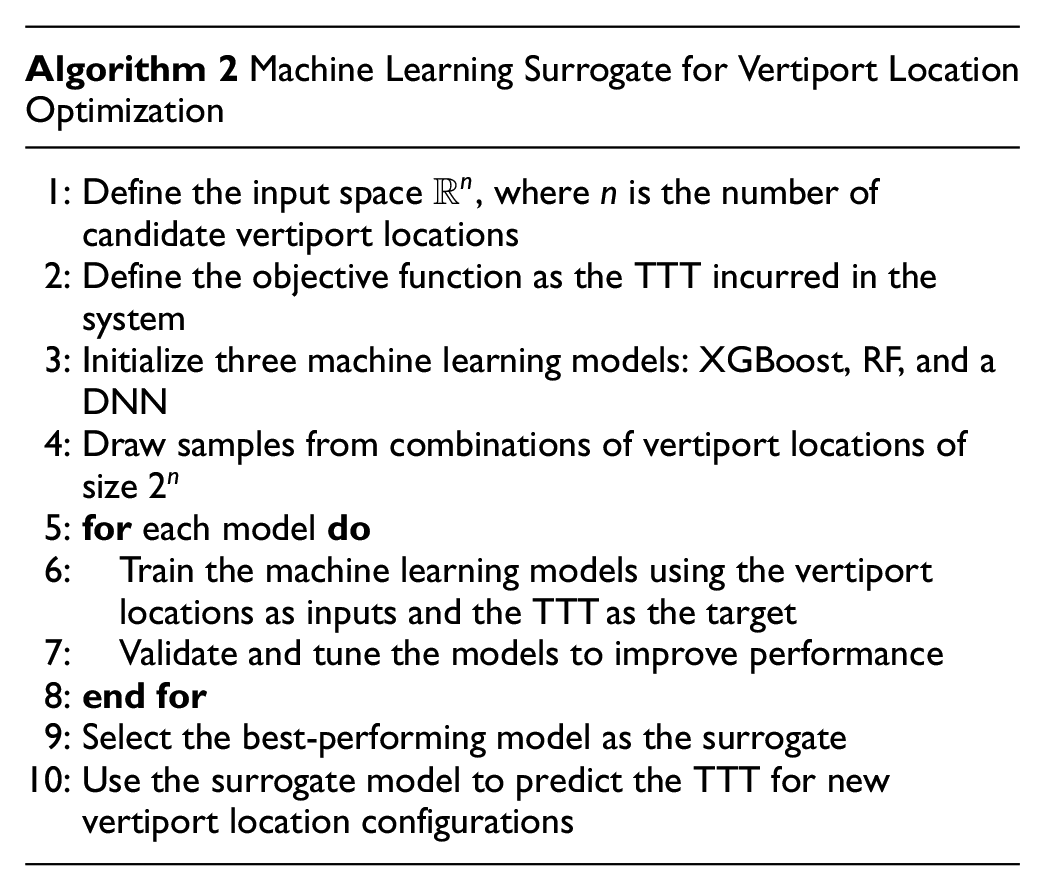
Because of the computational complexity of simulations, we construct several machine learning models to serve as surrogates between vertiport network configurations and their corresponding objective function value, which in our case is the TTT incurred in the entire system. The input space for the model is
Training Approaches
The training dataset contains 750 samples and the testing dataset has 182 samples. We apply a three-fold cross-validation for hyperparameter tuning. We run the simulations on Google Cloud n1-standard-8 machine with 4 × NVIDIA T4 Virtual Workstation. We test our configurations with state-of-the-art (SOTA) machine learning baseline models: RF ( 27 ), XGBoost ( 28 ), and DNN ( 29 ). We choose three evaluation metrics, including the Mean Absolute Error (MAE), the Root Mean Square Error (RMSE), and the Mean Absolute Percentage Error (MAPE), to evaluate the performance of the models. For each model, the training process is conducted in two stages. In the first stage, we focus on feature selection to minimize the MAE between the model’s predicted objective function value and the actual objective function value.
For example, in XGBoost, the loss function can be represented as:

where
In the second stage, we perform hyperparameter tuning with three-fold cross-validation based on the features selected from the first stage. For example, in XGBoost, the fine-tuning stage can be represented as:

Again, similar equations can be written for the RF and the DNN. In the context of model configuration, for the XGBoost and RF models, we experiment with different numbers of estimators and depths of trees. For the DNN, we vary the number of layers and the number of neurons in each layer to find the most effective architecture. Our aim is to capture the complex relationships between vertiport locations and the corresponding TTT.
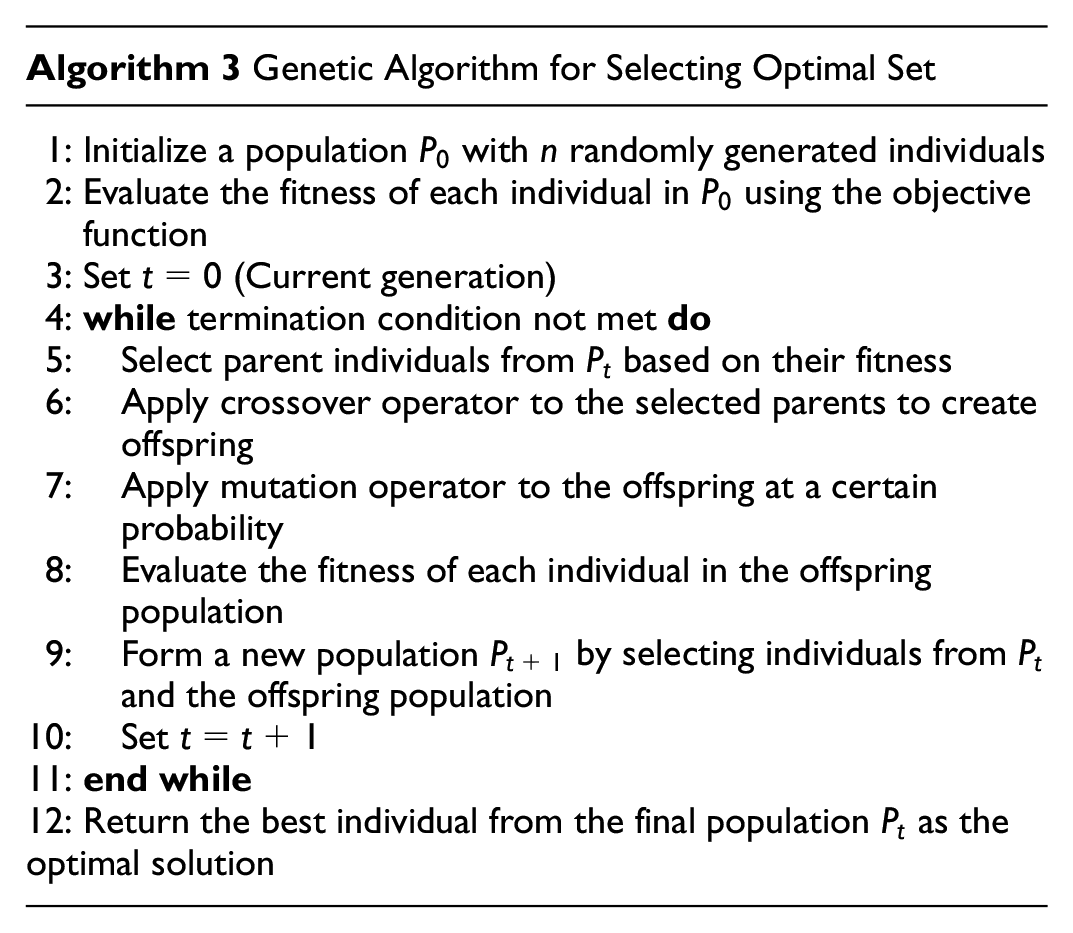
Genetic Algorithm
We employ a simple genetic algorithm that uses
Case Study
Data Acquisition
Our research benefits from data acquired from the MTC about driving trips departing between 5 a.m. and 12 noon on a representative weekday from Bay Area ( 30 ), comprising 3.44 million distinct trips recorded within the Bay Area. This rich dataset enables an in-depth exploration of travel patterns and mobility characteristics in the region. Each trip’s geographical coordinates, expressed as latitude and longitude, are mapped from the Open Street Map Identification Number (OSMID), ensuring an accurate representation of real-world locations.
Subsequently, we calculated the Great Circle Map Distance between the origin and the destination of each trip. This metric provides us with the actual distance covered during a trip, which is crucial in understanding the spatial characteristics of urban mobility. Guided by the proposal of Yedavalli and Mooberry ( 3 ), we classify trips exceeding 6 miles as suitable for UAM. This classification comes from the consideration that the phases of climbing and descending on a UAM trip typically encompass at least 6 miles, making shorter trips less efficient.
Finally, we treat the origins and destinations as individual data points, integrating them into a unified data frame to facilitate clustering. This approach allowed us to group similar travel patterns together and examine the underlying structure in the data, providing us with valuable insights into potential vertiport locations.
Candidate Locations and Clustering
We use Density-Based Spatial Clustering of Applications with Noise (DBSCAN) to identify clusters of UAM demand in the Bay Area. We chose DBSCAN for its robustness in the management of spatial data and its ability to identify clusters of varying shapes and sizes ( 31 ). Our initial attempt to cluster the entire dataset proved computationally intensive beyond a reasonable time frame, necessitating a more efficient approach. The general process is shown in Figure 4.
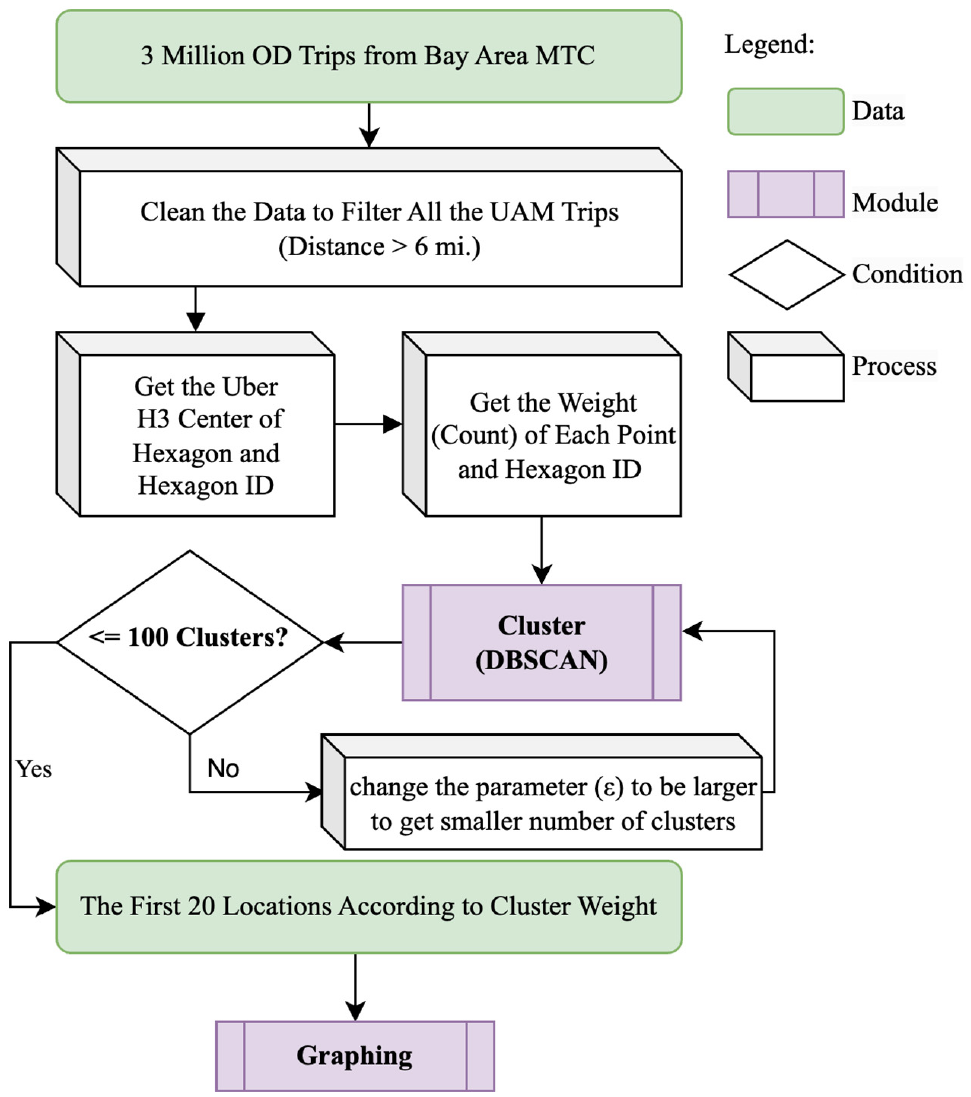
Clustering process.
To manage the geographical data, we employ the hexagonal H3 grid system, an effective geospatial indexing system that provides a precise and flexible geolocation data representation ( 32 ). Using the H3 library, we assign a unique hexagon ID to each data point. The coordinate of the centroid of each hexagon is used as the relative coordinate of all nodes that exist within the hexagon. We further assign each hexagon a weight, which is the sum of all origin and destination demand within each hexagon.
We perform DBSCAN clustering on the weighted hexagons using a weighted Euclidean distance. The resulting cluster labels are appended to the original data, and the total number of clusters is computed. We identified 136 distinct clusters scattered across the Bay Area. The plotted clusters are visually represented in distinct colors, with each color border demarcating a different cluster, as shown in Figure 5. We selected the centroid of the top twenty largest clusters, which have the largest weights, as candidate locations. We decreased the value of parameter
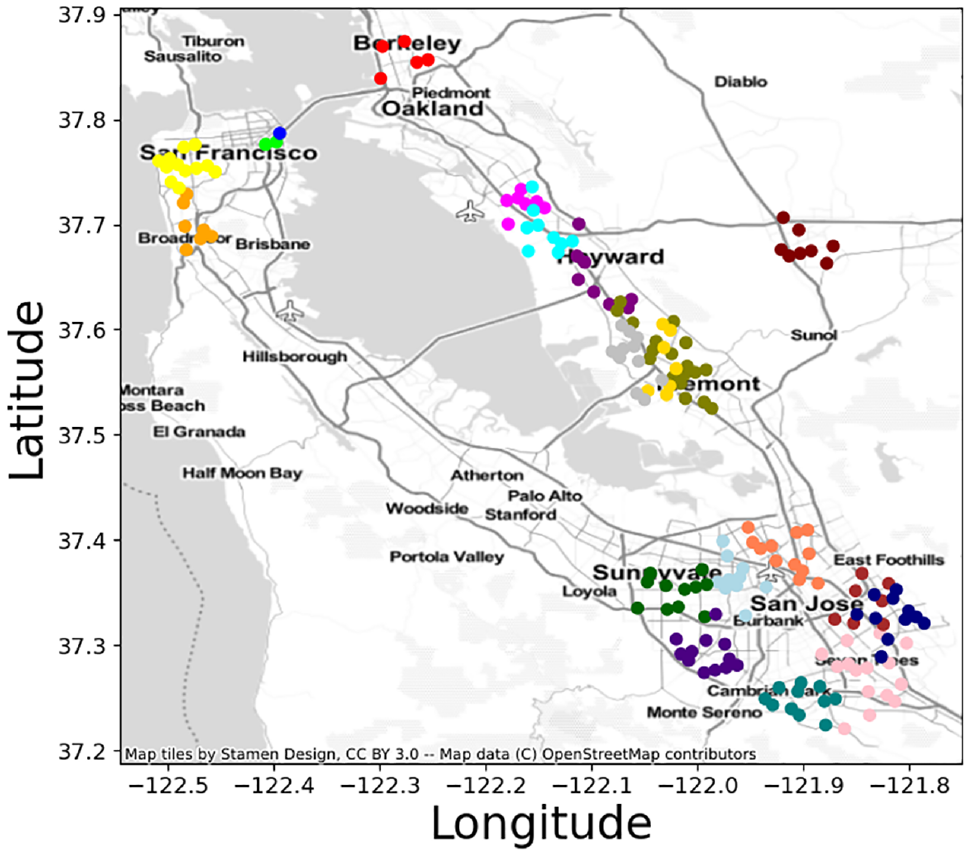
Weighted DBSCAN clustering.
Results
Hyperparameter Tuning
The performance of a model is significantly based on the selection of appropriate hyperparameters. To achieve this, we employed Optuna, a hyperparameter optimization framework. Leveraging this library allowed us to efficiently enhance the models’ performance by automating the optimization and testing of various hyperparameter configurations. In this study, we meticulously optimized distinct hyperparameters for an array of machine learning models, namely RF, XGBoost, and DNN. For the RF model, we targeted hyperparameters that included the number of trees, the maximum depth of the tree, the minimum number of samples required to split an internal node, and the number of features considered for splitting at each leaf node. Optimization of the XGBoost model involved tuning the maximum depth of the tree, the learning rate, the number of gradient-boosted trees, and the minimum sum of the instance weight. For the DNN model, the hyperparameters selected for optimization were the number of layers, the number of neurons in each layer, the activation function per layer, and the learning rate. The ultimate objective of this precise hyperparameter optimization was to improve the predictive capacity and efficiency of each model. Table 2 reflects our findings after using Optuna.
Testing Error Result Comparison
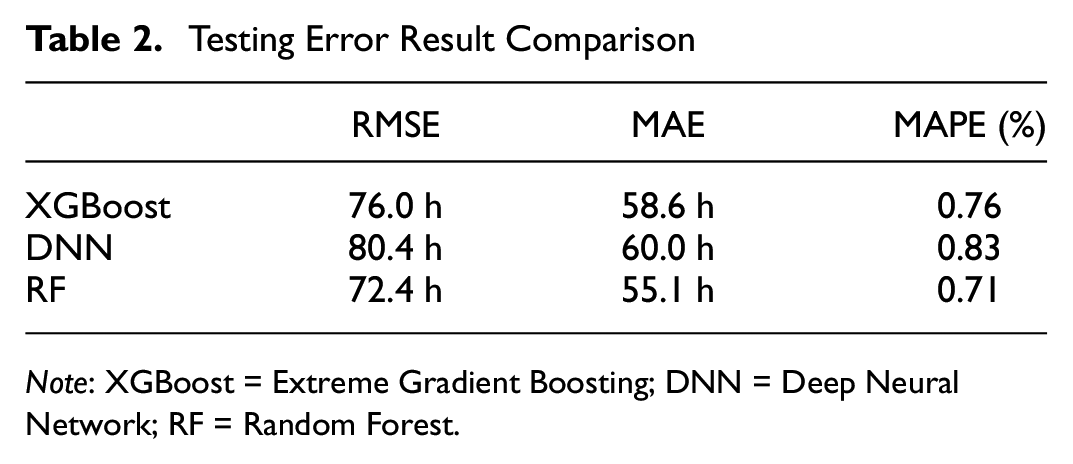
Note: XGBoost = Extreme Gradient Boosting; DNN = Deep Neural Network; RF = Random Forest.
As is shown in Figure 6, the training error and testing error all converge within a reasonable region. Therefore, we choose 250 as training size and the testing size is 182. In our findings, we found that although RF has smaller prediction errors, DNN has the ability to find better results during the genetic algorithm stage. This is because although RF often remains preferable for classification tasks, especially when interpretability and robustness against overfitting are prioritized, DNN might outperform RF in complex prediction tasks because of its ability to model high-level abstractions in data.
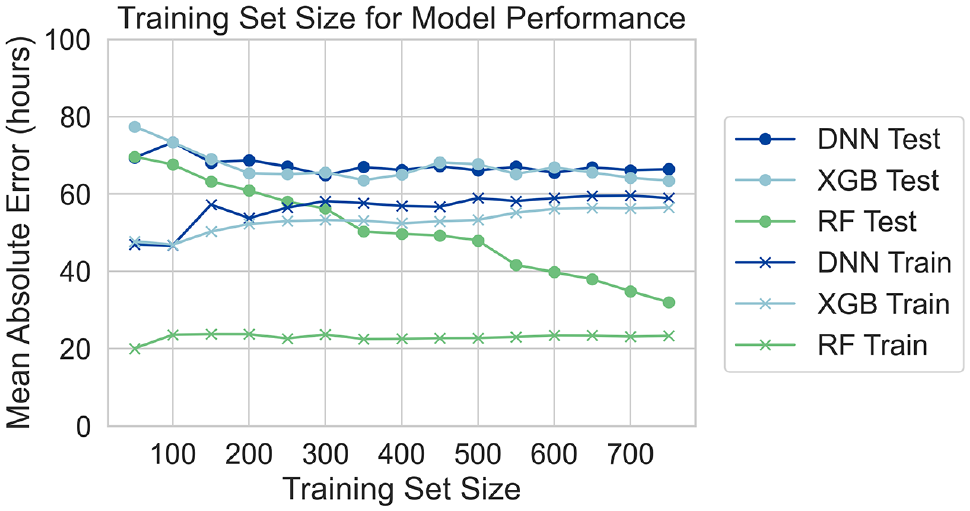
Effect of training sample size on model performance.
Performance Comparison with SOTA Models
As illustrated in Table 2, the proposed framework performs best with RF. These results corroborate VinS’s ability to efficiently handle the complexities associated with vertiport location selection on a regional scale. Specifically, VinS demonstrates superior performance by accurately capturing the nuances of heterogeneous networks and effectively modeling location selection. This success is largely attributed to the incorporation of domain primitives derived from the transportation system, including the vertiport selection binary matrix, adjacent vertiport distance network matrix, vertiport demand matrix, and detailed road network information.
Furthermore, the VinS model overcomes several limitations associated with existing SOTA models, including weak generalization to heterogeneous networks and limited modeling of location selection. We attribute the outstanding performance of the VinS model to its innovative design, which includes a blend of a GPU-based regional traffic simulator and a SOTA fine-tuned SuM.
Also, the VinS model performs well in computational savings. For each set, with traditional methods, the simulation time is 5 min and there are a total number of
In the context of real-world applicability, extensive and rigorous evaluations have confirmed the VinS’s effectiveness in finding not only the optimal number of vertiports but also their optimal locations consistently. This marks a significant advancement in city-wide vertiport location selection, especially for large-scale areas like the San Francisco Bay Area.
Optimal Locations of Vertiports
With prior knowledge-informed RF and the genetic algorithm, we find an approximate solution to our original optimization problem, which is to minimize the TTT. Figure 7 shows the solution we obtain from the genetic algorithm. As we can see, it chose to put vertiports in the areas with higher demand.
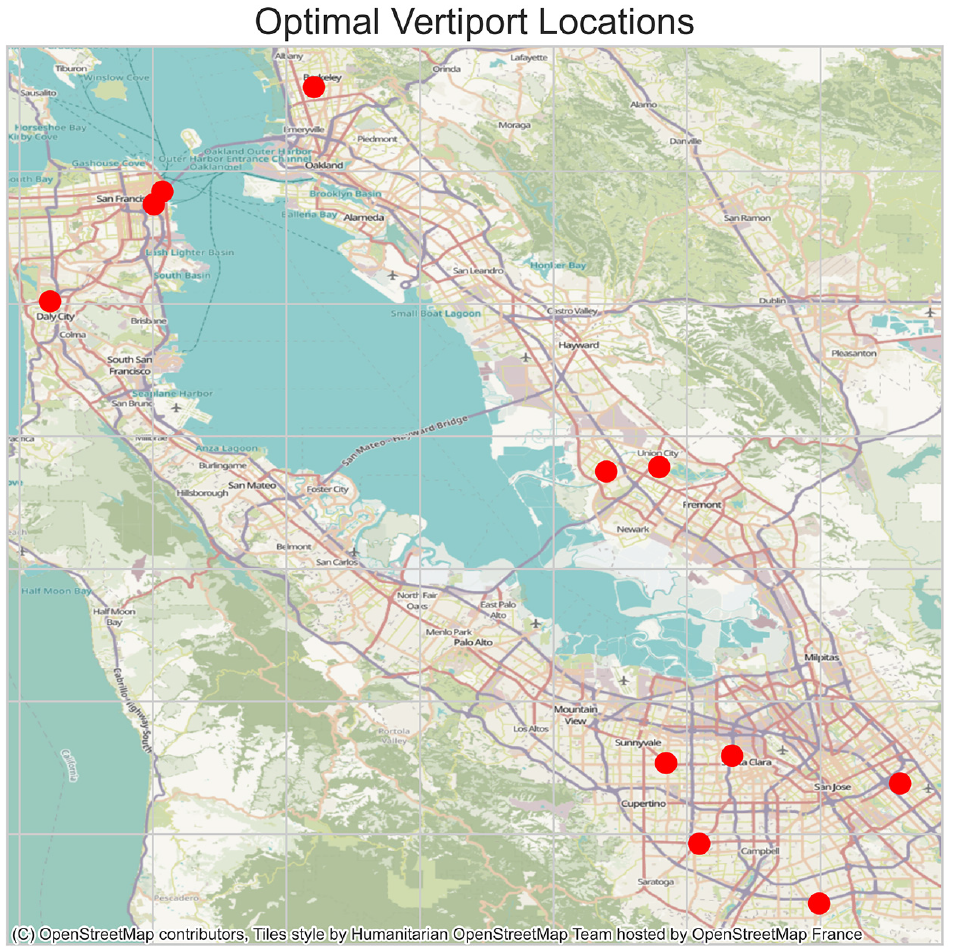
Locations of optimal set.
Figure 8 shows the distribution of savings in TTT with the optimal set compared with the sets sampled from the origin. Our proposed VinS model produced the most trip-time saving compared with all the samples we generated with clustering and sampling. We also compared with a baseline method, selecting the largest eleven clusters centroid points as the vertiport locations, and we can see its results have both negative gains and positive gains; in contrast, our proposed model can obtain time savings of as much as 600 h.
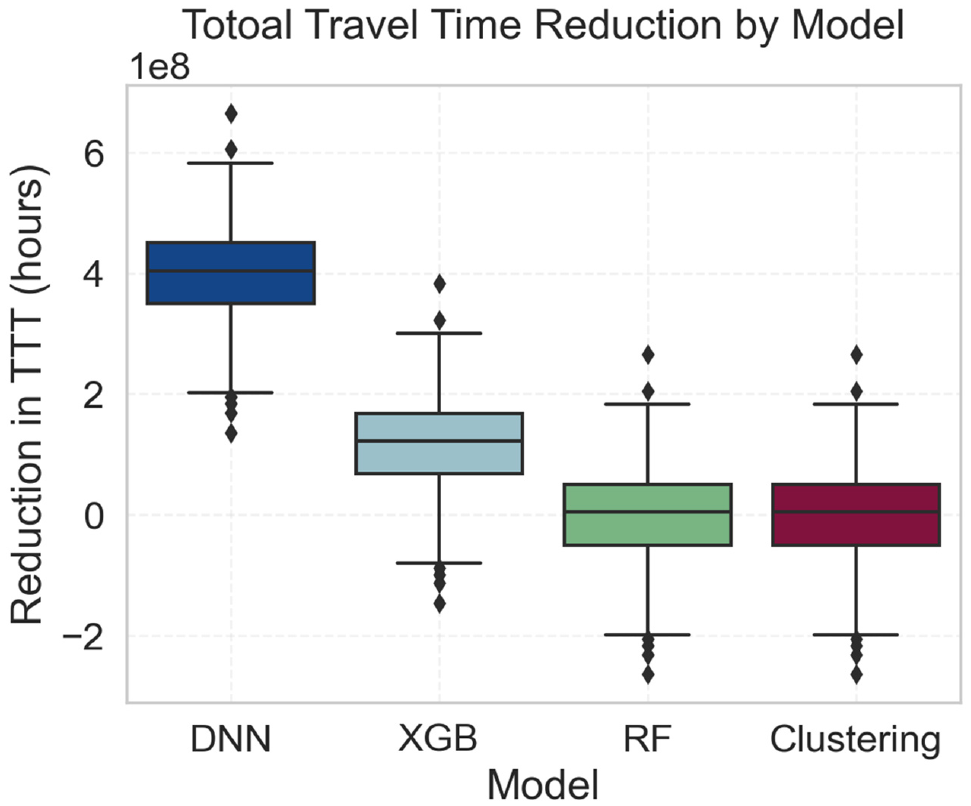
Saving compared with the sampled set.
Conclusion
In conclusion, this study has made a significant contribution to the discourse on urban air transportation by proposing an innovative SBO technique for vertiport location selection. Using machine learning as a surrogate model, this research opens a new path to address the mounting challenges of the computational power of simulation.
Our methodological approach uniquely integrated a comprehensive dataset of 3.44 million different trips from the MTC with a rigorous clustering framework to process the vast volume of data effectively. This facilitated the location of a vertical port network and a pool of potential UAM trips.
These findings underscore the power of SBO and machine learning models to revolutionize urban transportation. They provide an empirically robust foundation on which future research can build, particularly with regard to the refinement of machine learning models, exploration of additional factors influencing the optimal location of the vertiport, and potential application to other urban contexts because of the large sets of possible solutions.
This research ultimately aims to provide a versatile and effective framework for the construction of vertiports, which will significantly contribute to the evolution of urban mobility and the development of sustainable and efficient transportation networks. It can be extended to other location choice problems such as charging station choosing problems and dedicated bus lane placements.
However, this study faced certain constraints that may have affected the final results. The principal limitation arises from the potential for overfitting, engendered by the condition where the number of features exceeds the number of data points. This disproportionate feature-to-data point ratio may have resulted in a model that is excessively tailored to the training data, compromising its generalization capabilities on unseen data. Therefore, more extensive exploration is required to unravel the precise relationship between the input variables and the resulting outcomes. Future research efforts are anticipated to delve into this aspect, enabling a more robust and reliable understanding of the underpinnings of the model.
Footnotes
Author Contributions
The authors confirm contribution to the paper as follows: study conception and design: Xuan Jiang, Shangqing Cao, Baichuan Mo, Junzhe Cao, Mark Hansen, Raja Sengupta, Jinhua Zhao; data collection: Junzhe Cao, Xuan Jiang; analysis and interpretation of results: Xuan Jiang, Shangqing Cao, Baichuan Mo, Junzhe Cao, Yuhan Tang; draft manuscript preparation: Xuan Jiang, Shangqing Cao, Baichuan Mo, Hao (Frank) Yang, Yuhan Tang. All authors reviewed the results and approved the final version of the manuscript.
Declaration of Conflicting Interests
The author(s) declared no potential conflicts of interest with respect to the research, authorship, and/or publication of this article.
Funding
The author received no financial support for the research, authorship, and/or publication of this article.