
Abstract
Real-time urban traffic monitoring is crucial for effective smart city management. Despite the increasing number of sensors collecting large-scale datasets in real time, challenges such as privacy concerns, high capital and maintenance costs, and limited coverage persist, impeding precise network traffic monitoring. General Transit Feed Specification (GTFS) Realtime data, an emerging real-time data source generated by public transit, exhibits high potential to monitor traffic given its public accessibility, low cost, and lack of privacy concerns. This study developed a new methodology leveraging GTFS Realtime data for citywide network sensing. Specifically, the proposed methodology uncovers the typical travel patterns of buses by isolating their operational events, involving boarding and alighting passengers at bus stops. Two algorithms, the segment-trip extraction algorithm and the segment speed estimation algorithm, were developed to implement the proposed methodology. The validation process used Bluetooth data collected in Gainesville, Florida, as the ground truth, while Google Traffic data served as a benchmark for comparison. Results indicate that the space mean speed estimated from GTFS Realtime data can better capture link speed trends and variations, similar to those observed in Bluetooth data. Furthermore, bus travel times derived from GTFS Realtime data demonstrated relatively high correlations with Bluetooth data and low prediction errors compared with estimates based on Google Traffic data. The proposed methodology and findings of this study can be directly used to complement and improve existing real-time traffic monitoring technologies.
Keywords
Real-time network monitoring plays a critical role in the development of smart cities. It encompasses the continuous monitoring of various types of traffic information, including speed, travel time, flow, and density. Real-time traffic information provides fundamental inputs for various intelligent transportation systems (ITS) applications, including route planning, traffic control, and incident detection and management. For instance, accurate real-time speed and travel time information can help commuters make informed decisions, such as optimizing their travel routes and minimizing travel time ( 1 ). Moreover, precise real-time traffic flow information enables transportation councils to dynamically optimize traffic signals, thus reducing total travel times and enhancing urban mobility ( 2 ). Additionally, real-time traffic information is invaluable to transportation councils, facilitating the detection of recurrent and non-recurrent incidents, evaluating the severity of traffic impacts ( 3 ), and enabling the timely activation of suitable traffic management strategies ( 4 ).
With the recent advances in sensors and communications technology, an enormous amount of traffic data is continuously captured from various devices each second, paving the way for a promising future in real-time network monitoring. Traffic data can generally be collected from two groups of devices: on-road fixed detectors and mobile data sources. On-road fixed detectors, such as loop detectors, Bluetooth, and video cameras, provide accurate and comprehensive traffic information at specific fixed locations over time. However, their high capital and maintenance costs restrict their deployment to only a subset of links within a network, thereby limiting the spatial coverage of network monitoring ( 5 ). On the other hand, mobile data sources, such as floating car data, connected vehicle (CV) data, and location-based service (LBS) data, offer full network coverage but suffer from some major limitations, such as high cost, privacy concerns, and potential corporate confidentiality issues. While certain traffic councils may have access to certain mobile data sources, these limitations remain key obstacles that hinder the full market penetration and real-time accessibility of these data sources ( 6 ). Moreover, the challenges of appropriate data fusion and handling multi-source data with varying resolutions persist. As a result, precise real-time traffic monitoring remains a challenging and complex task.
Recently, Google has introduced General Transit Feed Specification (GTFS) Realtime data, which are a feed specification that allow public transit councils to provide real-time updates about their fleets to application developers ( 7 ). The dynamic GTFS Realtime data offers frequent and standardized updates ( 8 ), including the real-time locations, travel speed, and stop times of buses. Similar to CV, these buses circulate with other normal traffic within the network, effectively functioning as floating vehicles with trajectories reflecting real-time traffic conditions. Unlike CV, buses usually follow fixed routes, which may result in incomplete spatial coverage. However, the strategic planning of their routes typically aims to maximize passenger catchments, resulting in a relatively extensive and representative spatial coverage of the network. Most importantly, GTFS Realtime data are publicly available in real time at no with no cost, privacy concerns, or confidentiality issues. Therefore, we hypothesize that the GTFS Realtime data can be a complementary dataset for real-time urban traffic monitoring.
Nevertheless, using GTFS Realtime data for urban real-time traffic monitoring still faces several challenges. Firstly, the unique operational events of buses, including boarding/alighting with the potential acceleration/deceleration behavior adjacent to bus stops, introduce multiple observations near bus stops that differ from the conditions of normal traffic. Thus, it is necessary to filter out these irrelevant operational events of buses. Secondly, buses typically operate at lower speed compared with regular traffic, reflecting a distinct speed pattern in their movement. Therefore, it is critical to establish the connection between the travel patterns of buses and normal traffic.
This study aims to assess the potential of GTFS Realtime data and develop a new methodology by leveraging GTFS Realtime data for real-time network sensing. We propose a method to monitor real-time urban traffic by estimating bus speed, which can be capable of automatically identifying bus-specific operational patterns by analyzing and tracking variations in speed. Particularly, buffer zones are set up around bus stops to distinguish between bus stopping (for passenger boarding and alighting) and bus skipping (i.e., bus drivers skip bus stops). For the detected bus stopping, the travel speeds within the bus stop buffer zone were imputed to uncover the general traffic patterns.
Data were extracted and processed to validate the proposed method from various sources including GTFS Realtime, Bluetooth, and Google Traffic. This analysis focused on different road hierarchies in Gainesville, Florida, spanning two weeks in October 2023. While Bluetooth data served as on-road fixed detectors and provided accurate travel speed measurements, their spatial coverage was limited. Therefore, a subset of segments with installed Bluetooth devices was chosen for validation purposes. The results show that GTFS Realtime data can effectively capture link speed variations, exhibiting similarities to the distributions of the observations made using Bluetooth data. The contributions of this work are threefold. Firstly, to the best of our knowledge, this is the first instance of using GTFS Realtime data for real-time urban traffic. Secondly, we proposed a novel methodology to estimate real-time traffic speed by combining GTFS Realtime, GTFS Static, and road network data. We explicitly addressed inaccuracies in traffic state estimation caused by bus passenger boarding and alighting activities. Thirdly, we demonstrated GTFS Realtime data’s capability to accurately capture link speed variations, offering a comparative analysis with Bluetooth detection devices. The proposed methodology and findings of this work can complement existing approaches and enhance real-time traffic monitoring across a broader network.
The remainder of the paper is structured as follows. First, we present a literature review of previous studies and available data sources on real-time urban traffic condition monitoring. Next, we describe the data, including GTFS Static and GTFS Realtime data. We then present the proposed method for bus speed estimation and provide the corresponding algorithm. Afterward, we describe a case study using the GTFS Realtime data in the city of Gainesville, Florida, followed by the validation. Finally, we conclude the paper by summarizing findings, identifying limitations, and suggesting future work.
Literature Review
Real-time urban traffic monitoring denotes the continuous collection and analysis of traffic data for obtaining real-time road condition information on urban roads to optimize the safety of urban traffic ( 9 ). As discussed in the introduction, the traffic monitoring datasets may be categorized into two major categories: on-road fixed detector data and mobile data sources. Typically, on-road fixed detector data sources include the data collected from devices such as inductive loop detectors, traffic cameras, Bluetooth sensors, microwave radars, ultrasonic sensors, and acoustic sensors. While the mobile data sources include floating car data, CV data, LBS data, public transit data, and data from other sources.
On-Road Fixed Detectors
Traditional traffic monitoring relies on on-road fixed detectors, which are devices capable of sensing changes in movement, weight, pressure, and other variables in the surrounding environment ( 10 – 12 ). Real-time urban traffic information is summarized as common macroscopic traffic quantities, including traffic flow, speed, density, and vehicular count by types.
Inductive Loop Detectors: An inductive loop detector operates by installing a wire coil under the road surface to detect electromagnetic changes when vehicles pass over it. This allows the system to analyze traffic flow, defined as the number of vehicles passing per unit of time, and occupancy, representing the fraction of total time that a vehicle occupies a loop ( 13 , 14 ). Inductive loop detectors can stably and continuously acquire traffic data when operating normally, without raising privacy concerns related to travelers. However, inductive loop detectors come with certain drawbacks. First, the large deployment and maintenance costs limit their spatial coverage. For example, ( 15 ) reported that the cost of a single-loop detector ranges between $900 and $2,000, depending on its type. Second, missing data as a result of aging facilities or extreme weather conditions could compromise the continuity of data collection for real-time traffic monitoring ( 16 ). Thus, more advanced algorithms are needed for data imputation. Third, during congestion with frequent stop-and-go traffic, when the same vehicles remain stationary over loop detectors for an extended period, the detected traffic data can be erroneous, making it unsuitable for direct estimation of real-time traffic metrics ( 17 ). Furthermore, certain traffic parameters, such as real-time speed and vehicle classification data, cannot be directly measured by single-loop detectors. Addressing this limitation would require upgrading to dual-loop detectors ( 18 ), incurring a substantial cost.
Traffic Cameras: Traffic cameras have become one of the most widely used devices for stationary traffic data collection, capturing videos with rich traffic information. However, processing these videos for analysis poses challenges, including the removal of background interference ( 19 ). Various vehicle identification methods, such as cascade classifiers and convolutional neural networks, are applied to enhance detection accuracy. Despite providing accurate results at fixed points, this traditional method has limitations in coverage. However, expanding coverage areas incurs a high total cost. Additionally, privacy concerns arise as vehicle information is often obtained by matching license plates ( 10 ). Furthermore, processing real-time traffic information from imagery data is relatively complex ( 20 ).
Bluetooth Sensors: Bluetooth sensors detect anonymous Bluetooth signals from passing vehicles between two intersections where the devices are placed. These sensors can identify the unique 48-bit Bluetooth Mac addresses of enabled devices, such as vehicle navigation systems, mobile phones, and headsets, within the traffic stream. Real-time traffic information, including segment travel time, speed, and vehicle counts, is obtained by matching subsequent detections from Bluetooth devices along the road through rigorous filtering processes ( 21 ). Despite serving as a valuable data source for traffic monitoring, the data collected by Bluetooth devices may exhibit biases. For example, simultaneous recording of multiple Bluetooth devices can result in numerous similar paired data counts, making it difficult to determine the accuracy of the recorded data. In addition, given the high maintenance and deployment costs, Bluetooth devices have low spatial coverage.
Microwave Radars: Microwave radars for traffic applications commonly operate on X-band (10 GHz) or K-band (24 GHz), with fixed antennas ( 22 ). These off-road detectors are employed for collecting traffic information, such as traffic flow, speed, and occupancy ( 30 ). However, microwave radars cannot operate continuously, resulting in the data collected having a low temporal continuity. Additionally, false alarms generated by the device itself can lead to interruptions in data collection ( 22 , 23 , 30 ).
Ultrasonic/Acoustic Sensors: Similar to microwave radars, ultrasonic sensors collect traffic data by emitting sound waves toward the target vehicles from the road shoulder and calculating the interval between the sending and receiving time ( 24 ). However, these sensors are susceptible to interference from ice or other debris ( 30 ). Acoustic sensors, which capture the acoustic features of vehicles approaching or moving away, face limited adoption because of the challenge of distinguishing vehicle acoustic signals from background noise ( 30 ). This difficulty often results in a significant amount of missing data.
Mobile Data Sources
Mobile data sources encompass transportation data collected through mobile devices and technologies, primarily relying on GPS, to acquire real-time information. These data are processed to comprehend traffic patterns, forecast congestion, and monitor urban traffic conditions. Common data sources include floating car data, CV data, LBS data, data from other councils, and public transit data generated through probes.
Floating Car Data: The prevalence of GPS receivers in vehicles and cell phones has made floating cars a common and widely used source for traffic data collection. This approach captures various types of traffic information, including vehicle position, speed, travel direction, and travel time ( 25 , 26 ). Floating cars, in contrast to on-road fixed detectors, can traverse most road segments in a city ( 6 ), providing extensive spatial coverage and measuring travel speed and time of each road to derive the full traffic map. In addition, collecting traffic data using floating cars is often more cost-effective than deploying on-road fixed detectors. However, the data accuracy remarkably depends on the penetration rate of floating cars ( 27 , 28 ) and the signal quality ( 29 ). Since floating cars represent discrete points in the traffic flow, insufficient data points can make it challenging to estimate traffic flow information like traffic flow density ( 30 ). Additionally, floating car data may collect travelers’ personal information, such as IDs, which can raise privacy concerns ( 31 ).
Connected Vehicle (CV) Data: The integration of CVs as a source of probe vehicle data has emerged as a new research trend, primarily because of their relatively low cost compared with on-road fixed sensing infrastructures ( 32 ) and their broader scope and temporal coverage compared with floating car data ( 33 ). Existing literature has demonstrated that CV-based probe vehicle data can be used effectively to estimate travel speed, travel time ( 34 – 37 ), traffic volumes ( 38 , 39 ), queue lengths ( 40 , 41 ), and other traffic information ( 33 , 42 ). CV data provide a higher resolution compared with floating car data ( 33 ), allowing for more precise monitoring and evaluation of traffic flow conditions ( 43 ). They enable the characterization of each sampled vehicle directly with higher accuracy, eliminating the need to divide road segments into grids ( 44 , 45 ) when monitoring real-time traffic. However, the use of CV data raises privacy concerns among travelers and relevant authorities.
Location-Based Service (LBS) data: LBS data, obtained from third-party apps on smartphones using GPS technology or location sensing capabilities, provides valuable real-time traffic-related information. This includes traffic flow analysis ( 46 ), congestion and incident detection ( 47 ), route optimization ( 48 ), and traffic management ( 47 ). With the widespread adoption of GPS, LBS data becomes easily accessible and is a valuable source for real-time traffic monitoring. However, the collection of LBS data, which involves tracking and recording individuals’ movements, raises significant privacy concerns. Moreover, not all users have access to location-based services, which can lead to the uneven temporospatial distribution of data accuracy.
Public Transit as Probes: In previous studies related to using transit buses as probes, some research used bus cellular data or GPS data to monitor urban traffic conditions in real time. For instance, ( 49 ) employed bus cellular data to develop an intelligent traffic management system capable of real-time monitoring and predicting urban traffic conditions. ( 50 ) concentrated on forecasting real-time passenger travel demand for the enhancement of urban mobility by leveraging bus cellular data. ( 51 ) identified urban traffic real-time congestion points based on bus cellular data. ( 52 ) leveraged cellular data from public transport passengers’ smartphones to monitor real-time urban traffic conditions. Despite the benefits of using bus cellular data for monitoring urban traffic, challenges related to privacy protection and data processing persist. First, if the collected location information is not properly anonymized, it could lead to potential privacy issues. Second, the noise and inaccuracies in the data necessitate sophisticated data processing methods, increasing the complexity and cost of research.
In recent years, GTFS is an emerging dataset characterized by a standardized format for public transportation schedules and associated geographic information, comprising Static and Realtime parts. GTFS Static data provide scheduled information about transit services, such as schedules, stops, and routes, which are useful for planning services. GTFS Realtime data offer live updates as transit buses traverse routes, offering information such as vehicle positions, speed, and service alerts, which are crucial for day-to-day operations and real-time monitoring of traffic conditions. Therefore, GTFS data empowers developers to create comprehensive transit applications that provide both planned and real-time information to road users. Notably, GTFS data are easily accessible and completely open to the public without any privacy concerns. Researchers have used GTFS data to understand real-time bus operations. For example, GTFS Realtime data have been used to predict systemic and stochastic bus delays on road segments ( 8 ), and to assess on-time performance and route speed metrics for a public transit system ( 53 ).
Additionally, the traditional methods that use buses to monitor real-time urban traffic mainly use average speed to monitor real-time urban traffic without considering the impact of bus skipping or passenger boarding and alighting activities. For instance, ( 54 , 55 ) updated historical speed by calculating the average bus speed within an estimation interval to predict and monitor urban traffic speed; ( 56 ) evaluated real-time traffic conditions by leveraging vehicle-based sensor data, with mean speed as the performance metric; ( 26 ) measured real-time traffic speed and vehicle travel time by using floating car data based on the cellular phone. However, given the potential for passenger boarding and alighting activities during bus operations, which can lead to a significant number of zero-speed data points, it is not appropriate to merely calculate the average speed of these points. Such issues necessitate the application of data imputation techniques for resolution.
Google Traffic data: Google Traffic data serve as a valuable dataset provided by Google, capturing real-time urban traffic conditions through crowd-sourced road congestion data collected from smartphones with the Google Maps Application. This Application returns the traffic time metric (i.e., “duration_in_traffic”) of any given road section by using a dedicated application programming interface (API) ( 53 ). Despite its utility, the underlying model powering the Google Traffic system remains undisclosed in detail, making it still a black box ( 53 ). Moreover, there is a limit on the number of free API requests allowed during a 24-h period.
Summary
In summary, Table 1 provides a comprehensive comparison of the strengths and weaknesses of various urban real-time traffic monitoring datasets, considering key quality metrics such as cost effectiveness, accuracy, temporal contiguity, preprocessing simplicity, spatial coverage, accessibility, privacy protection, and penetration rate. The number of “*” in Table 1 indicates the performance level of each grading variable. For example, intrusive detectors exhibit a high cost with minimal privacy concerns. Note that the classification levels in the table are qualitative analyses, offering insights into the strengths and weaknesses of various datasets from different perspectives.
Comparison of the Pros and Cons for DataSets Used for Urban Traffic Monitoring
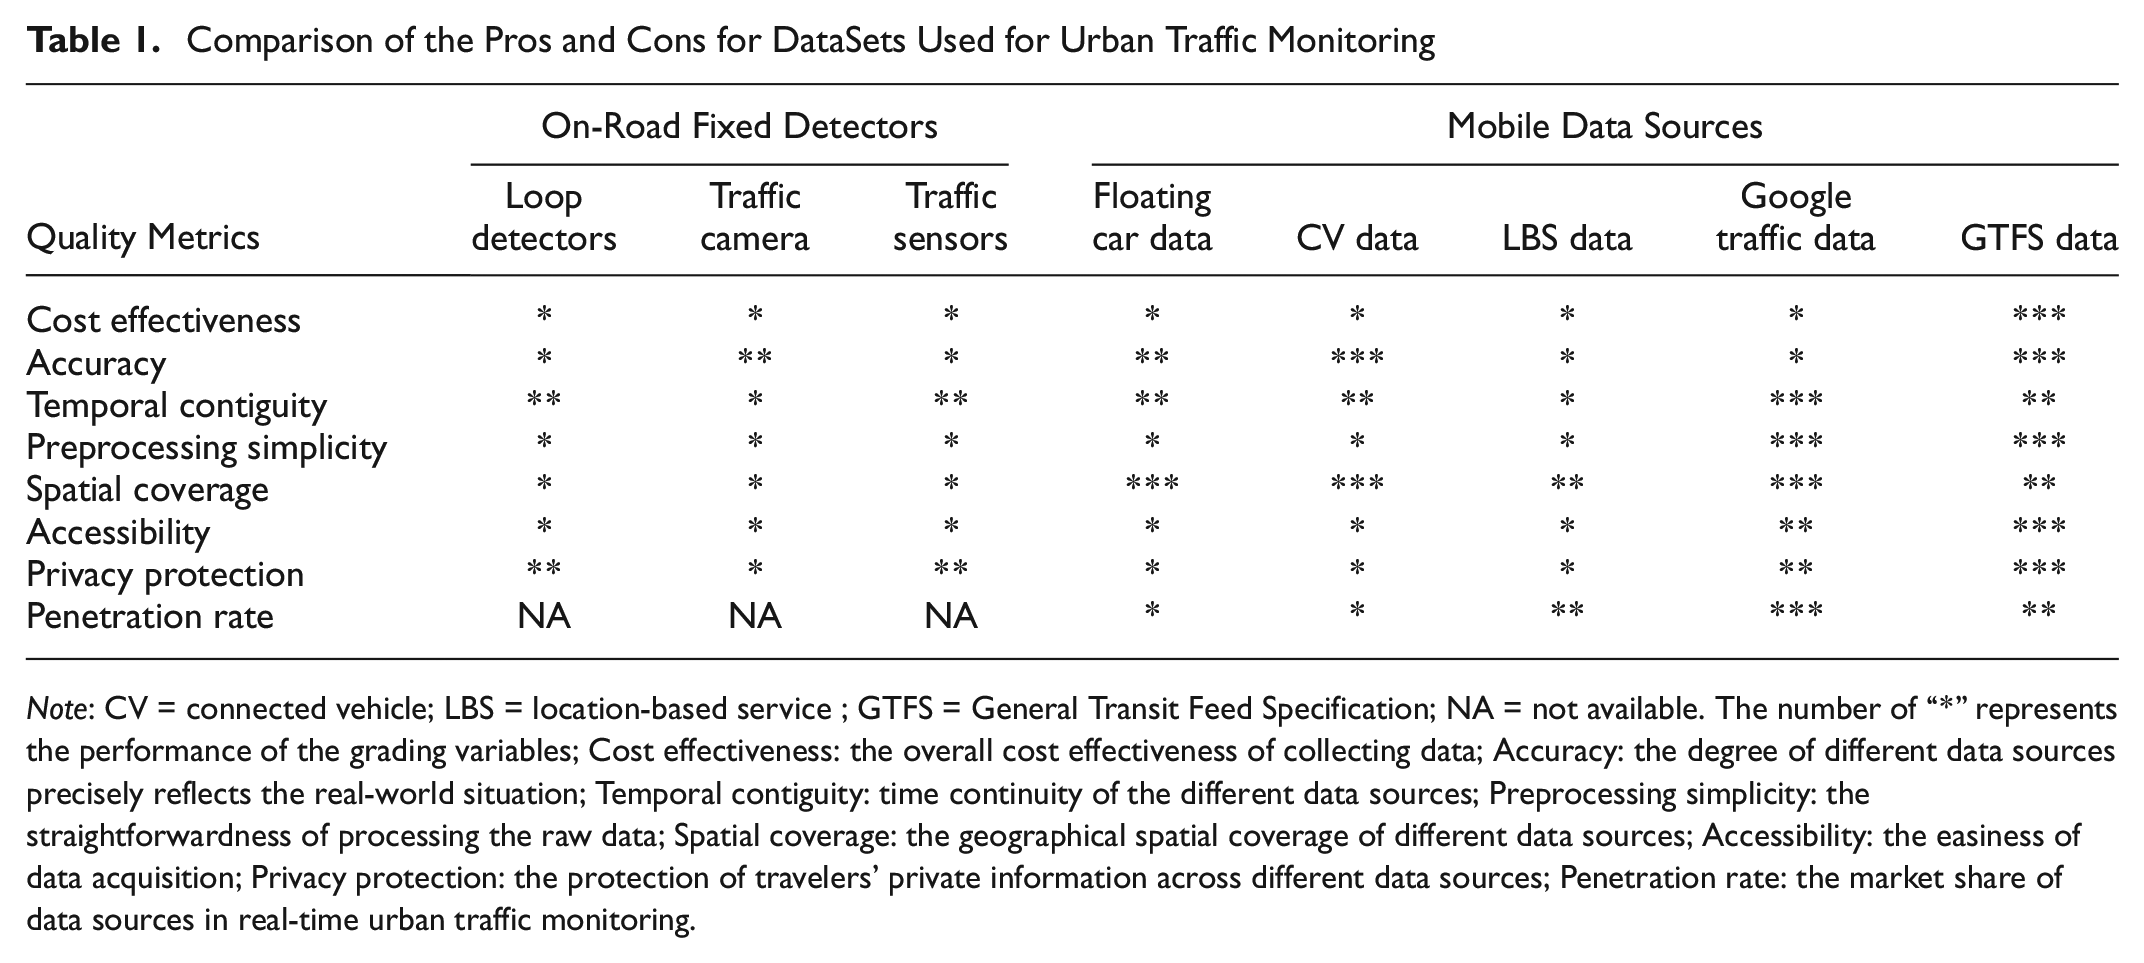
Note: CV = connected vehicle; LBS = location-based service ; GTFS = General Transit Feed Specification; NA = not available. The number of “*” represents the performance of the grading variables; Cost effectiveness: the overall cost effectiveness of collecting data; Accuracy: the degree of different data sources precisely reflects the real-world situation; Temporal contiguity: time continuity of the different data sources; Preprocessing simplicity: the straightforwardness of processing the raw data; Spatial coverage: the geographical spatial coverage of different data sources; Accessibility: the easiness of data acquisition; Privacy protection: the protection of travelers’ private information across different data sources; Penetration rate: the market share of data sources in real-time urban traffic monitoring.
Data
GTFS data encompass two main formats: GTFS Static and GTFS Realtime. The architecture of GTFS data is illustrated in Figure 1. The GTFS Static format defines fixed schedules and geographic information for public transport services, while GTFS Realtime data provide dynamic updates, including real-time information on vehicle locations, and instantaneous speed at different timestamps.
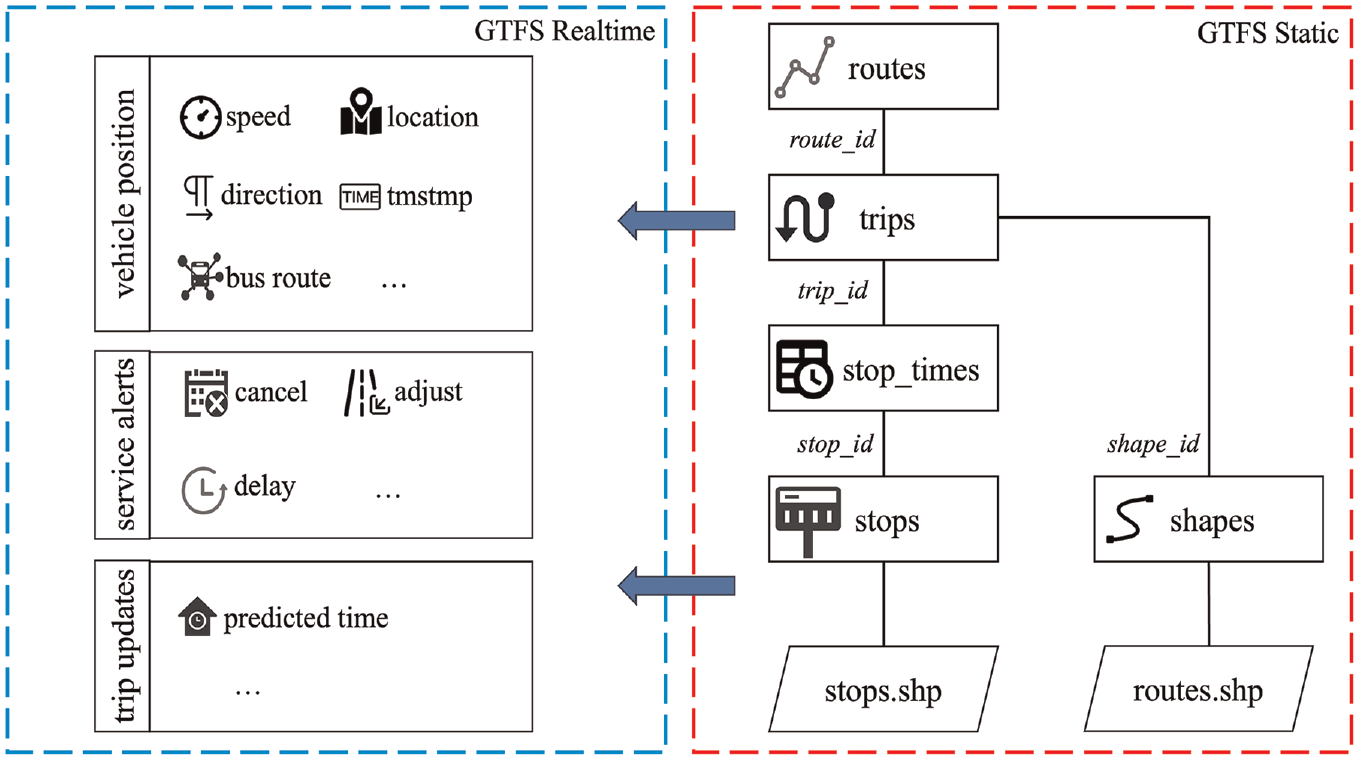
Comprehensive overview of General Transit Feed Specification (GTFS) data architecture.
GTFS Static Data
The GTFS Static dataset is organized into required and optional files. The core dataset includes six requisite text files: “agency.txt,”“routes.txt,”“trips.txt,”“stop_times.txt,”“stops.txt,” and “calendar.txt” which encompass critical details on public transit services. Supplemental files, such as “shapes.txt” and “calendar_dates.txt,” exist to broaden the scope of GTFS Static information. Analyzing these GTFS Static feed files reveals comprehensive insights into the bus networks, including stops and timetables. This dataset is crucial in complementing GTFS Realtime data to facilitate the observation and analysis of traffic conditions in real time.
GTFS Realtime Data
GTFS Realtime data, an extension of the GTFS Static data, serve as a valuable feed specification that enables public transportation councils to provide real-time updates to application developers. The GTFS Realtime specification requires vendors to publish certain data feeds as JSON or XML files, typically accessible through public APIs provided by each vendor. GTFS Realtime primarily comprises three essential components: 1) trip update, which delivers real-time updates for specific trips, including estimated arrival and departure times at stops, enabling passengers to understand the real-time operational status of specific vehicles, such as their punctuality and any potential delays; 2) service alert, which provides information on changes to public transit services, including route adjustments, delays, cancellations, and emergency situations, helping passengers with timely notifications and information about alterations to services; and 3) vehicle position, which it offers real-time information in relation to the current positions of buses, including their geographic coordinates (latitude and longitude), direction, and current status (e.g., in transit, at a stop).
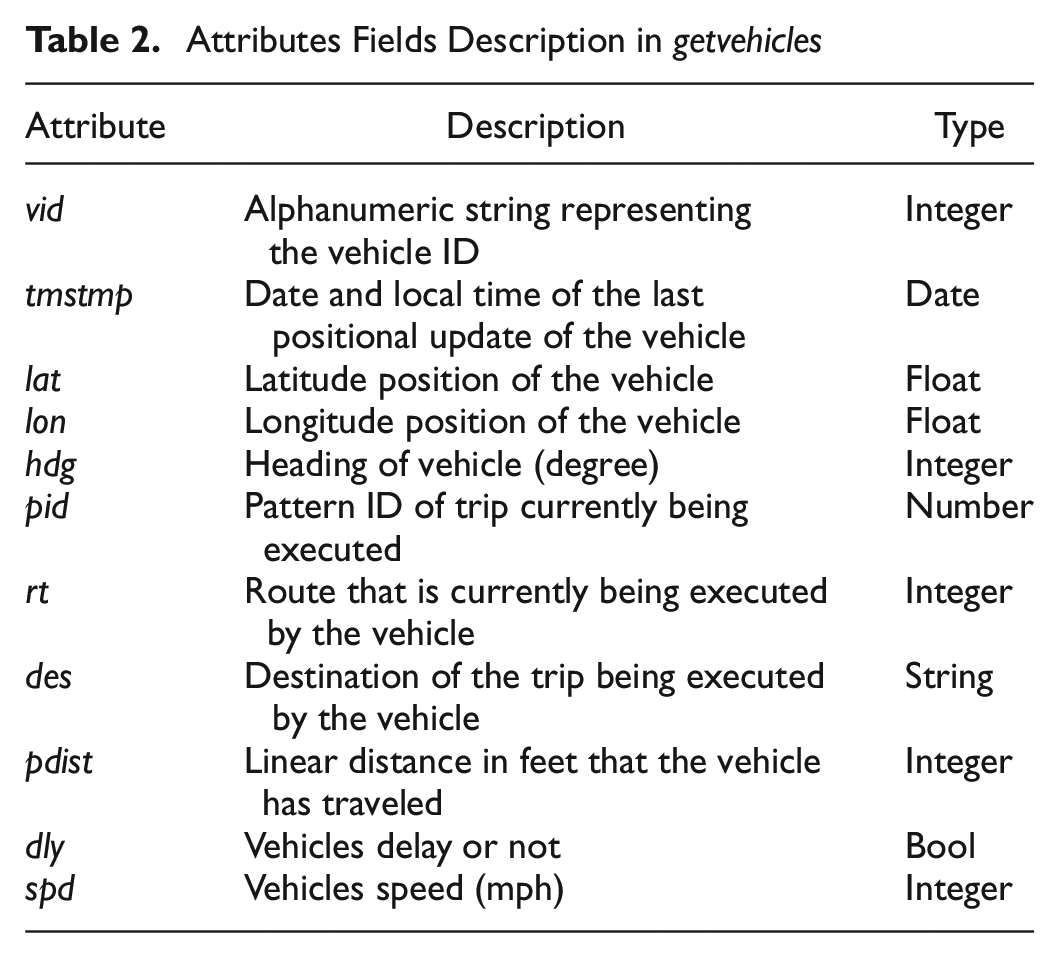
Despite there being slight variations from different providers in GTFS Realtime data feeds, vehicle position updates are usually consistent. These updates are often recorded in the getvehicles fields, providing speed and location information of all real-time available transit vehicles in the system. The attributes of getvehicles are listed in Table 2. GTFS Realtime trip update data were collected from the BusTime Developer application programming interface (API) at intervals of 15 s, which is a common update frequency for US transit systems ( 57 ). A data sample is as follows:
{
}
]
}
}
Attributes Fields Description in getvehicles
Methodology
GTFS Realtime data present significant advantages as a promising data source for real-time urban traffic monitoring. Firstly, buses enabled with GTFS Realtime data function, circulate with normal traffic within the network, offering trajectories that can capture real-time normal traffic information. Secondly, the strategic planning of bus routes ensures extensive and representative spatial coverage. Most importantly, the public and free accessibility of GTFS Realtime data make them highly suitable for real-time urban traffic sensing.
The proposed method, outlined in Figure 2, aims to monitor real-time urban traffic by estimating bus speed using the GTFS Realtime data. The data preprocessing involves three key steps: 1) data collection, which gathers GTFS Static and Realtime data, along with road information data; 2) static data processing, mapping bus routes and stops based on the GTFS Static data, establishing route buffers, projecting all bus stops onto bus routes, and defining stop buffers for detecting bus operational events; and 3) GTFS Realtime data processing, removing the data points outside the road segment buffers, filtering data within stop buffers to identify boarding/alighting events.
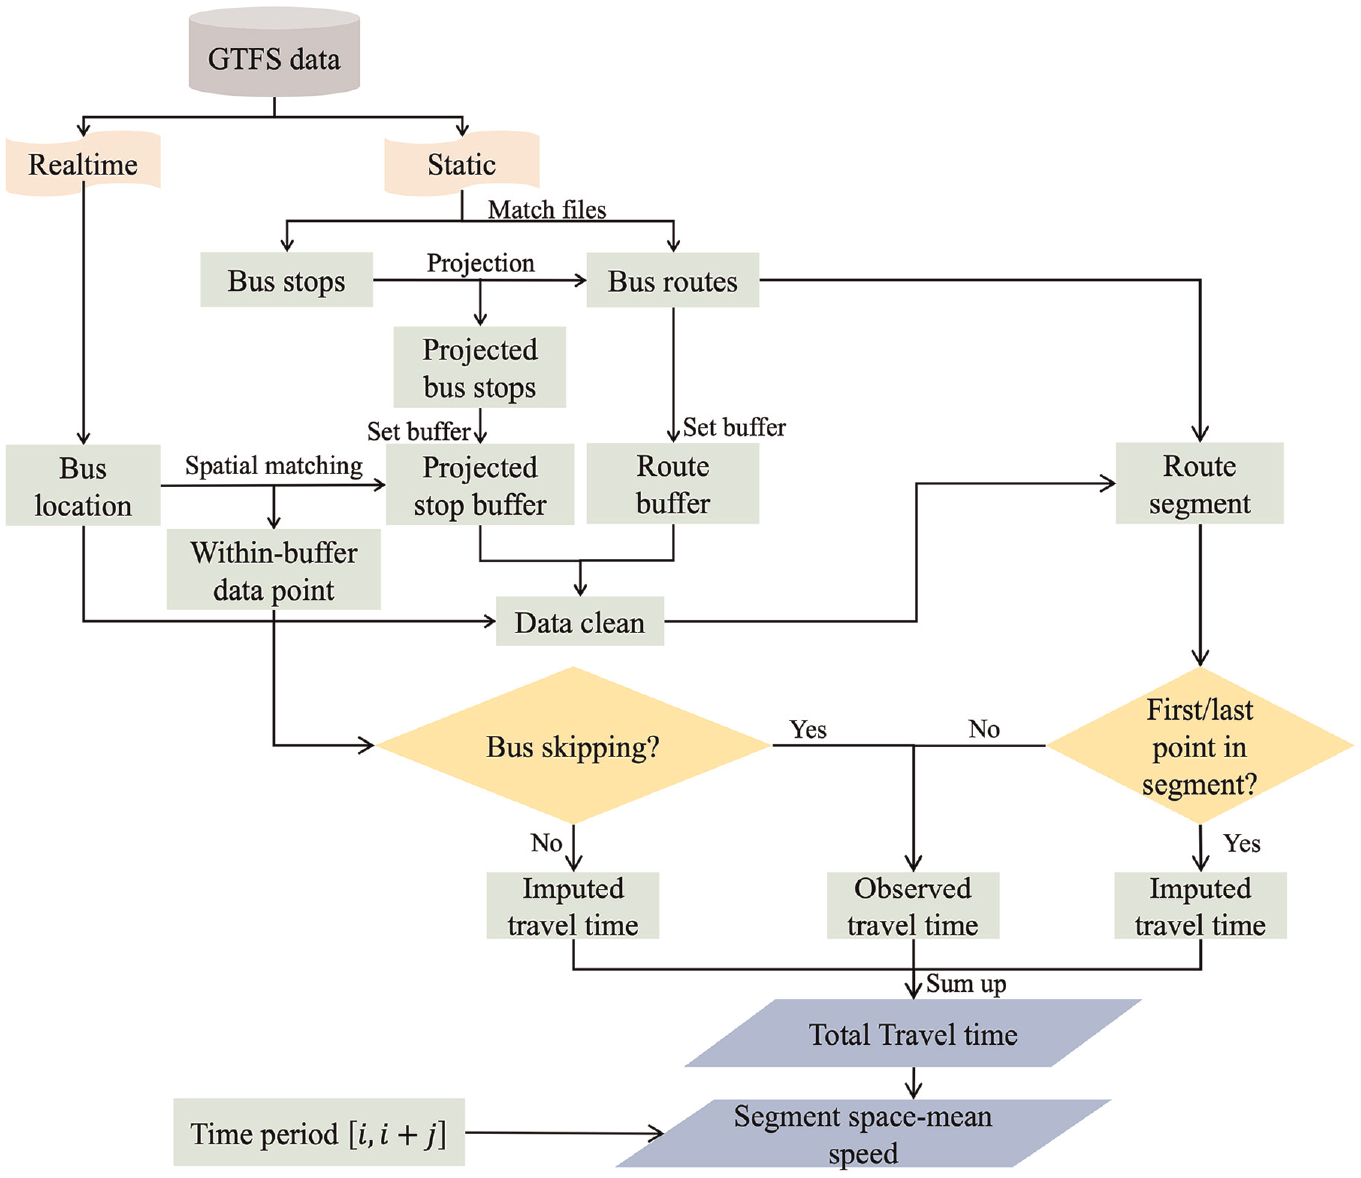
Conceptual diagram of the proposed methodology.
On completing the data preprocessing, single bus trips on each road segment are identified based on the method presented in the Segment-Trip Extraction subsection. The bus travel time for each trip on the specific segment k during time interval
A List of Symbols and Notations
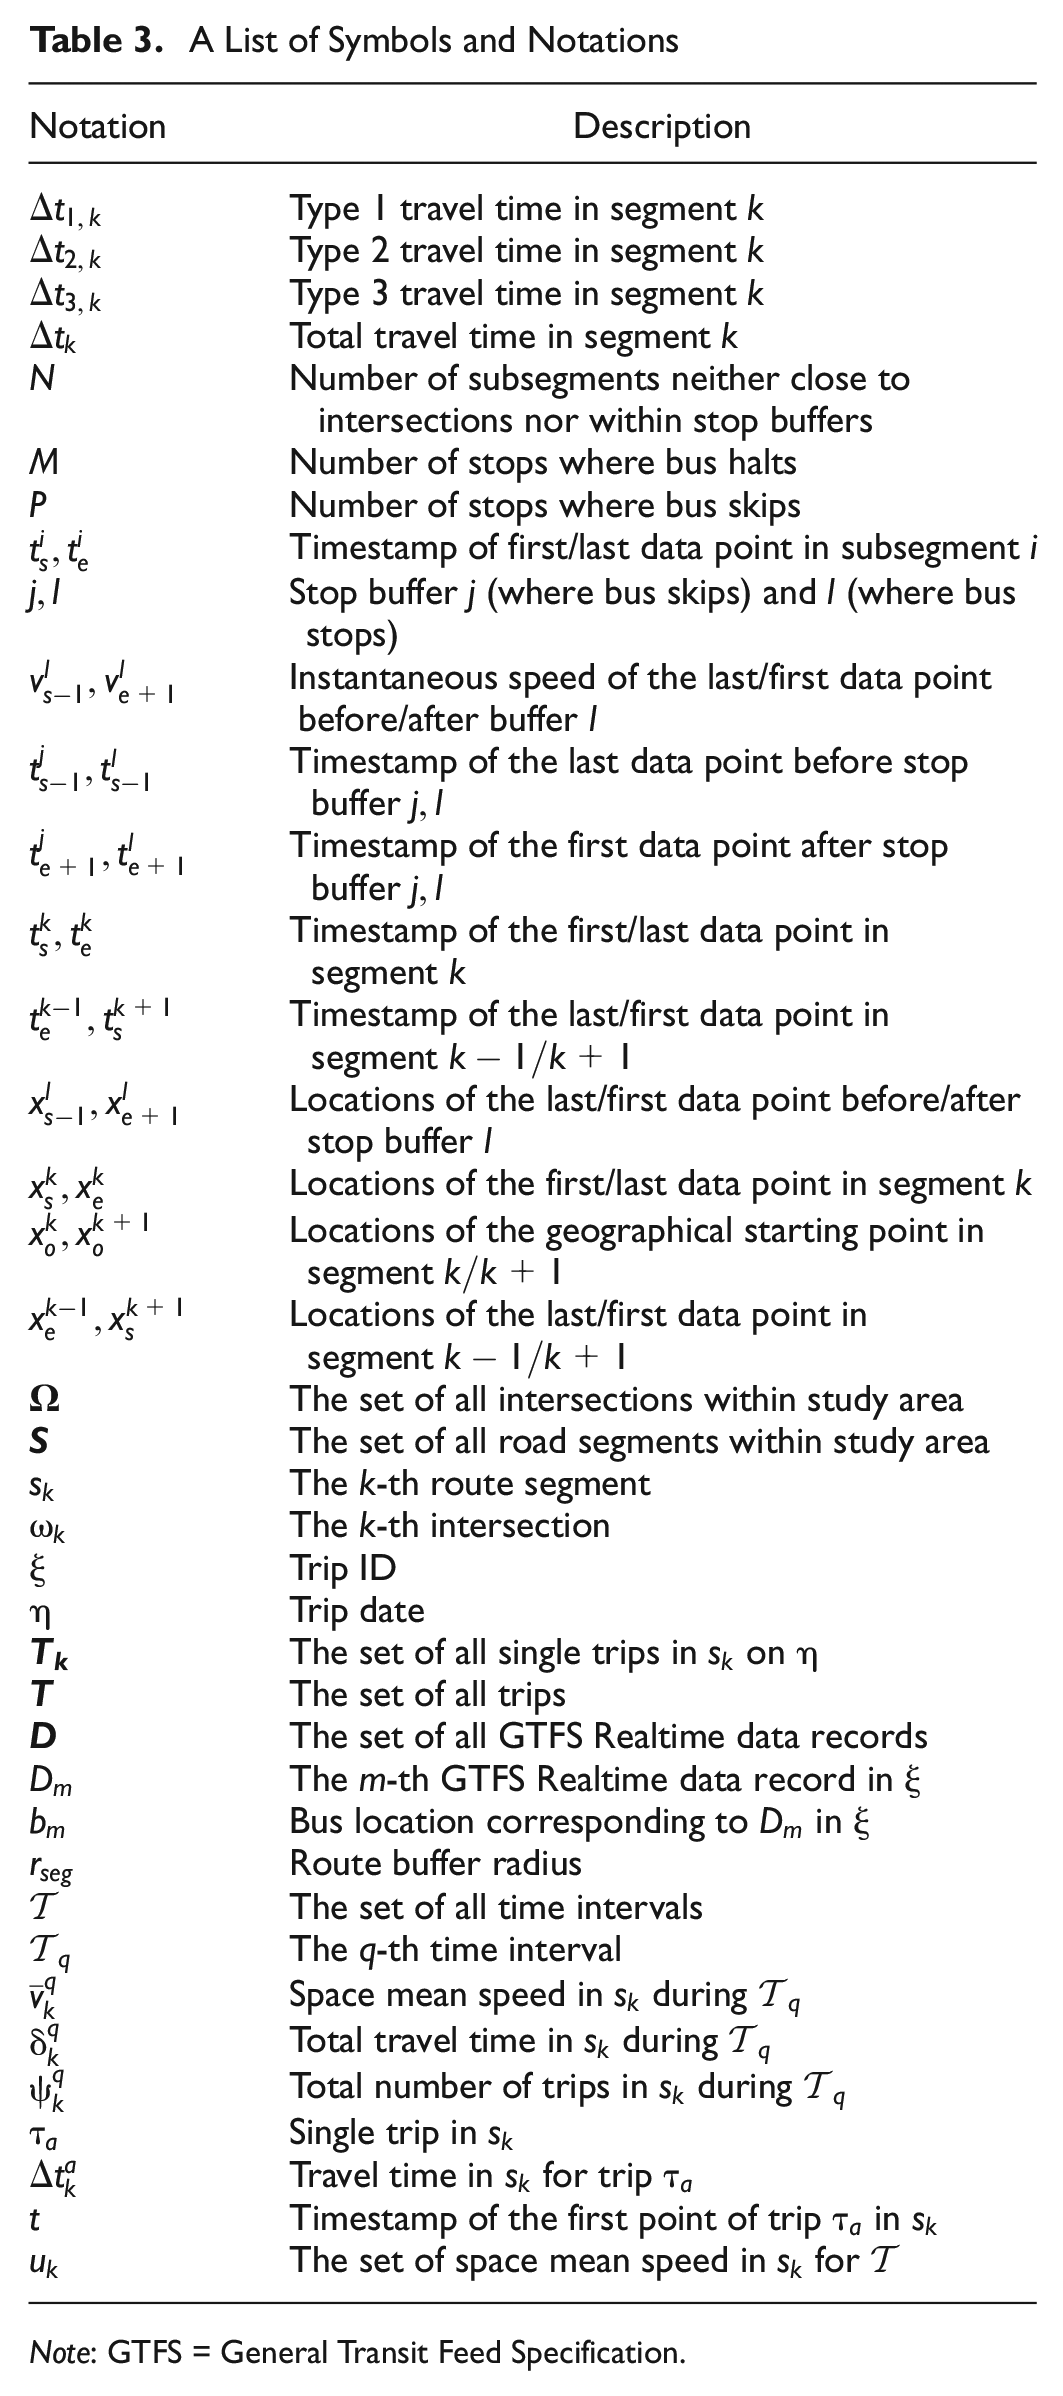
Note: GTFS = General Transit Feed Specification.
Segment-Trip Extraction
Since the space mean speed for a road segment is taken as the state variable for real-time urban traffic monitoring, it is crucial to extract single trips within each road segment and time interval. Algorithm 1 is the segment-trip extraction algorithm. The complete set of all of the road segments within the study area, denoted by
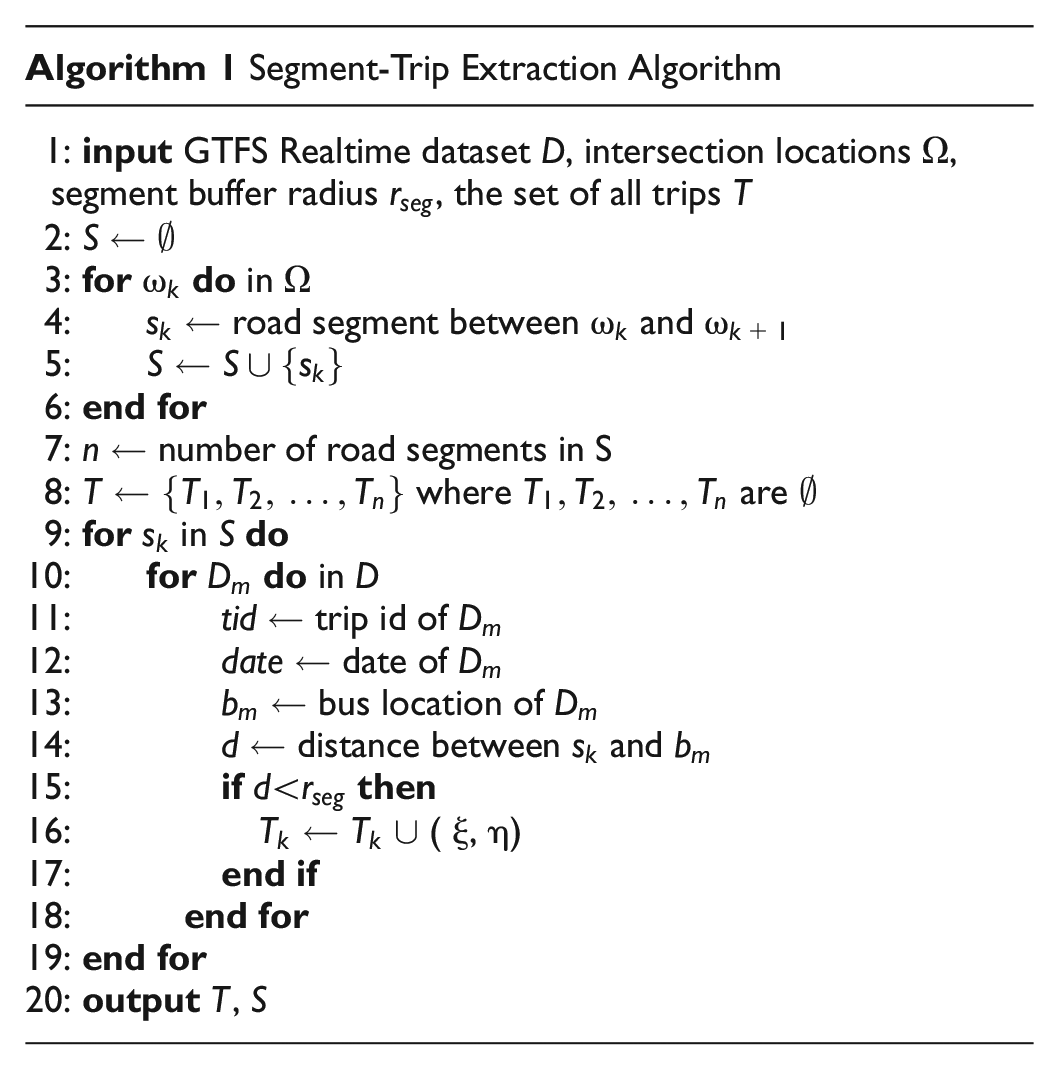
Once the road segment set
Travel Time Estimation
The estimation of space mean speed along a specific road segment k is performed by dividing the total distance traveled by the total travel time spent. This total travel time spent within the segment k involves three distinct types of travel time, as depicted in Figure 3: 1) travel time type 1,
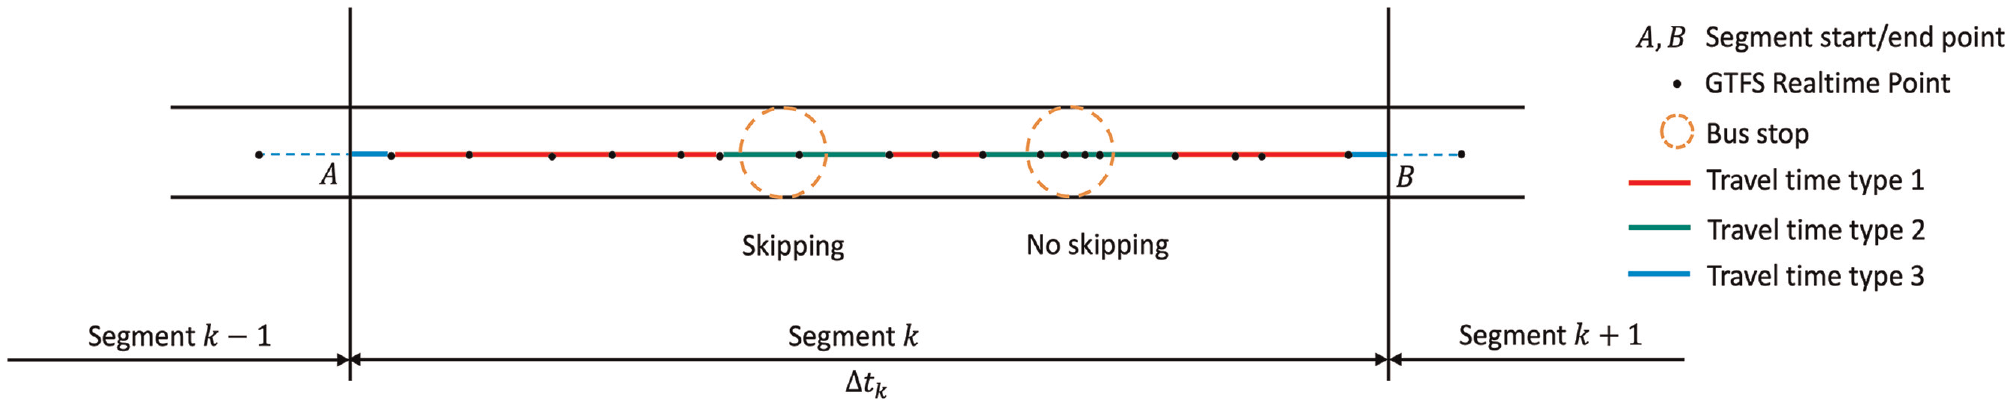
Segment travel time estimation.
Three types of travel times can be obtained using Equations 1 to 3. The total travel time of a trip on a segment is determined by Equation 4. For Type 1 travel time, when a bus traverses subsegments that are neither near intersections nor within stop buffers, it typically does not exhibit abnormal speed patterns because of operational events. Therefore, Type 1 travel time does not need imputation, which can be obtained directly as the sum of the time differences between the first and last data points in each subsegment.
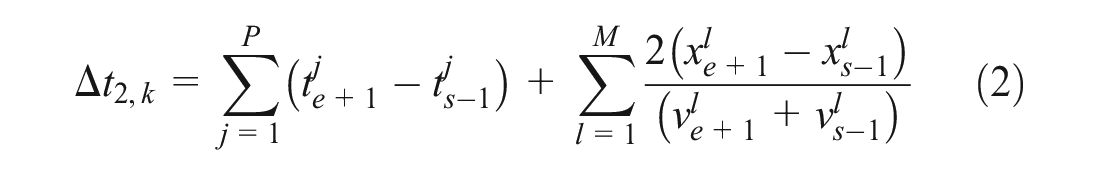
For Type 2 travel time, when a bus approaches a bus stop, it either skips the stop or halts for passengers boarding/alighting. In the latter cases, bus speed are influenced by these operational events, including the necessary acceleration and deceleration for stopping. Consequently, a method is proposed to automatically identify bus-stopping actions and mitigate the impact of these operational events. Firstly, a buffer zone with a 20-m radius is set around each bus stop within the segment. This specific radius is determined by taking into account several factors, including the distances required for bus acceleration and deceleration, the space needed for safely merging into regular traffic flows, and the length of the bus ( 58 ). Subsequently, for each stop buffer within the road segment, timestamps and instantaneous speed are collected from GTFS Realtime data at two specific points: one immediately before entering the buffer zone and the other immediately on exiting. Then, two time durations are computed: the first duration represents the actual time taken by the bus to traverse the buffer, obtained directly as the difference between the two aforementioned timestamps; the second duration is the imputed time required to cross the stop buffer, derived by dividing the distance between these two points by the average speed of the instantaneous speed recorded at these points. The process of passengers boarding and alighting the bus is assumed to require 15 s to complete ( 59 ). Therefore, if the imputed duration is at least 15 s less than the actual time difference between these two points, the bus is inferred to have dwelled at the stop. In such instances, the imputed time duration is added to Type 2 travel time. Otherwise, the bus is considered to have skipped the stop, and the actual time difference is added to Type 2 travel time.
To obtain Type 3 travel time, additional points encompassing the last point of the preceding segment

where
where
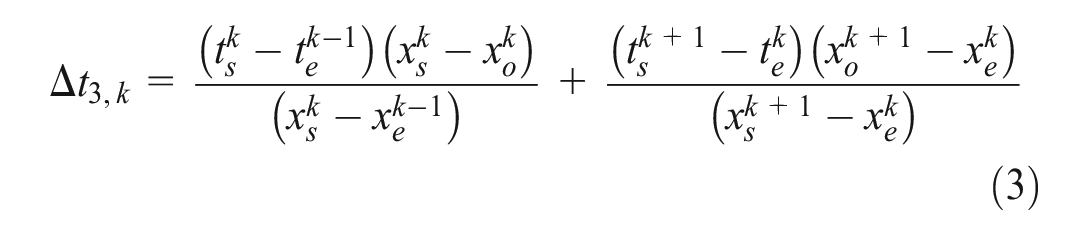
where

where
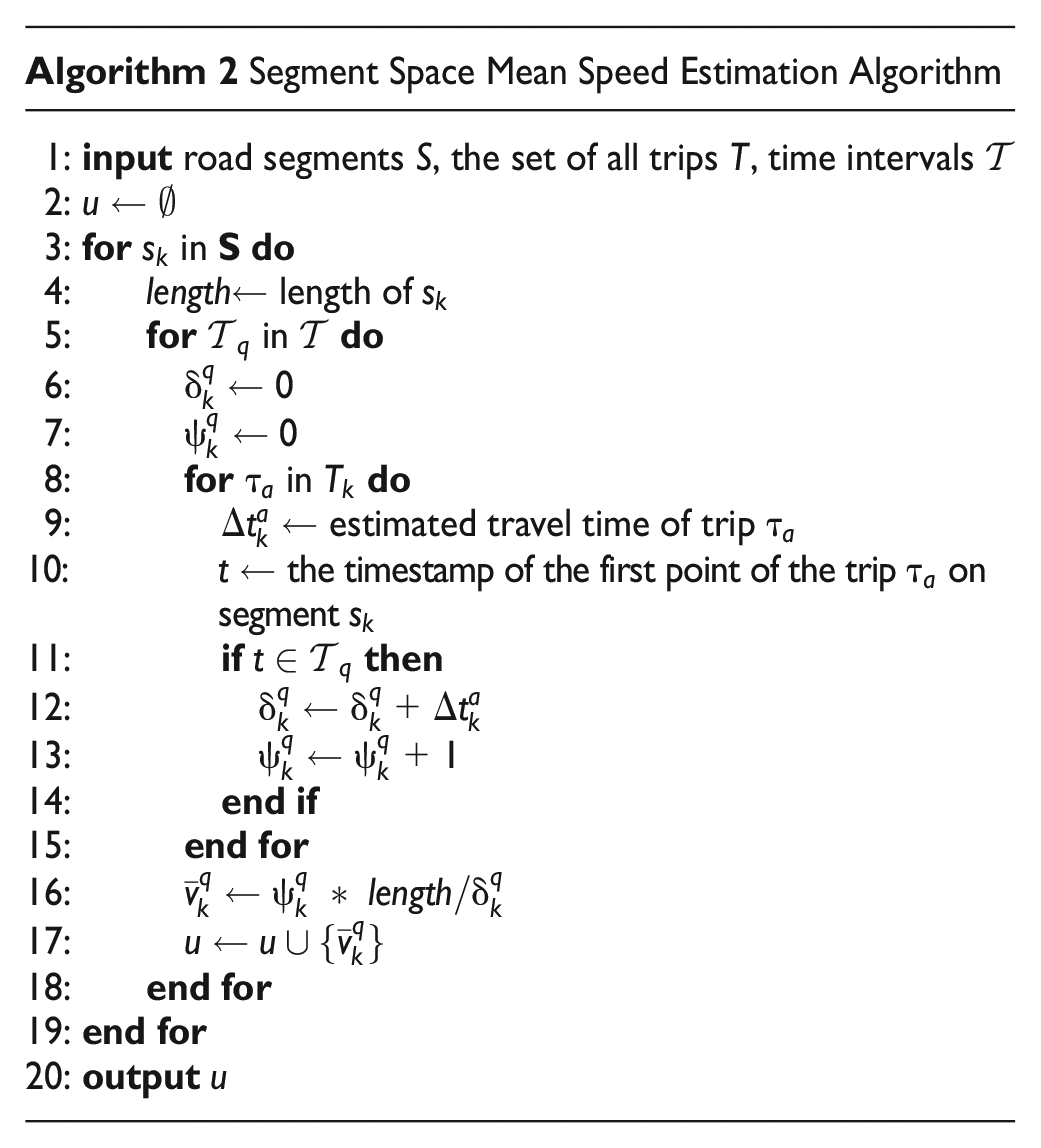
Space Mean Speed Estimation
After estimating the travel time for each trip across every road segment, the subsequent step involves estimating the space mean speed for each segment in different time intervals. The segment speed estimation algorithm is outlined in Algorithm 2. For each specified time interval
Case Study
Study Area
The city of Gainesville, a midsize city with a populations of about 140,000, was chosen to assess the potential of GTFS Realtime data in the context of real-time urban traffic monitoring. As depicted in Figure 4, the city has a well-established public transportation system with 38 bus routes with two directions in operation. These bus routes are strategically planned with roughly uniform coverage across the important links of the city’s network, making it a suitable case study. Python 3.11.4 and GeoPandas library 0.12.2 were employed to analyze and visualize GTFS Realtime data.
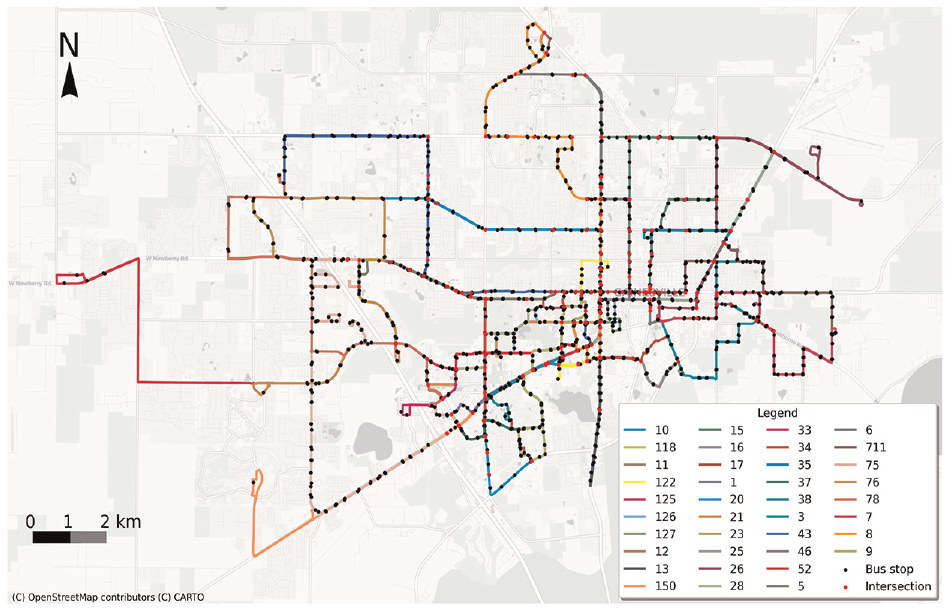
Bus spatial coverage in research area.
Data Acquisition
GTFS data were used as the primary data source for the analysis and traffic conditions monitoring in this paper. The GTFS Static data, containing the bus schedule data for the fall of 2023, were obtained directly from the Gainesville Department of Transportation. Additionally, GTFS Realtime data for all bus routes depicted in Figure 4 were collected from BusTime Developer API at 15-s intervals. The dataset used for validation covered various road hierarchies over a two-week period in October 2023. The GTFS Realtime dataset encompassed extensive observation hours, ranging from 6 a.m. to 11 p.m., capturing the full range of traffic states throughout the day. Initially, the raw dataset comprised 39 bus routes, each with two directions, totaling 1,193,613 data points. Following the preprocessing step (described in the Methodology section.), 1,061,207 data points remained, accounting for 88.9% of the original dataset.
The other two data sources used in this paper were Bluetooth data and Google Traffic data. The city of Gainesville deployed over 100 Bluetooth devices at the entry and exit points of road segments. These devices used Bluetooth technology to measure travel time and estimate vehicle speed by tracking signal propagation time between devices at different locations. Additionally, they collected comprehensive traffic data such as vehicle counts, types, travel time, and estimated speed, which were crucial for traffic flow analysis and management decision making. This data source effectively captured vehicle movement along specific road segments and provided a means to validate the accuracy of GTFS Realtime data in estimating space mean speed. However, it is worth noting that approximately one-third of the Bluetooth devices were inactive. This situation underscores the robustness of GTFS Realtime data, which can serve as a complementary data source to address the limitations of Bluetooth data availability.
Google Traffic data is derived from the Google Traffic model, which collected data through the Google Maps Directions API. The model used crowd-sourced road congestion data collected from smartphones installed with the Google Maps App ( 53 ). Through this approach, real-time information on specific road segments traversed by smartphones was provided, enabling analysis of urban traffic patterns and facilitating route optimization. Although the details of the underlying model powering the service were not fully disclosed, the API documentation specified that “the returned duration_in_traffic should be the best estimate of travel time given what was known about both historical traffic conditions and live traffic” and “live traffic becomes more important the closer the departure_time is to now.” Therefore, the parameter of departure_time was set to “now,” and the results of duration_in_traffic were recorded and used to estimate the space mean speed in road segments.
It should be noted that the Bluetooth and Google Traffic datasets provided the operating speed and travel times for regular traffic, while GTFS Realtime data described the traffic information of buses. Given the typical speed difference between regular traffic and buses, the space mean speed derived from GTFS Realtime data needed to be scaled to align with those derived from the Bluetooth data and Google Traffic data. This adjustment enables a standardized comparison between the space mean speed of buses and that of general traffic, thereby enabling a coherent analysis of urban transit dynamics. Additionally, it is essential to ensure consistency in the validation time periods and road segments across the three data sources.
Hypothesis Testing for Speed Variation Pattern
This section presents the results of hypothesis testing for speed variation patterns to validate the accuracy of the space mean speed derived from GTFS Realtime data. Bluetooth data, being direct travel time measurements of randomly sampled vehicles, were considered as ground truth. In contrast, Google Traffic data were outputs of an unknown black-box algorithm ( 53 ), and the space mean speed derived from it were used as a benchmark for comparison. Given the high capital and maintenance cost, Bluetooth devices are typically installed only on a limited number of links within the network. For the purposes of validation, the analysis specifically focused on those road segments for which data were concurrently available from all three aforementioned sources.
As illustrated in Figure 5, five road segments positioned at different locations within the research area were selected as validation segments. These road segments exhibited different road hierarchies and speed limits, as outlined in Table 4, thereby enabling thorough validation of the applicability of the proposed method.
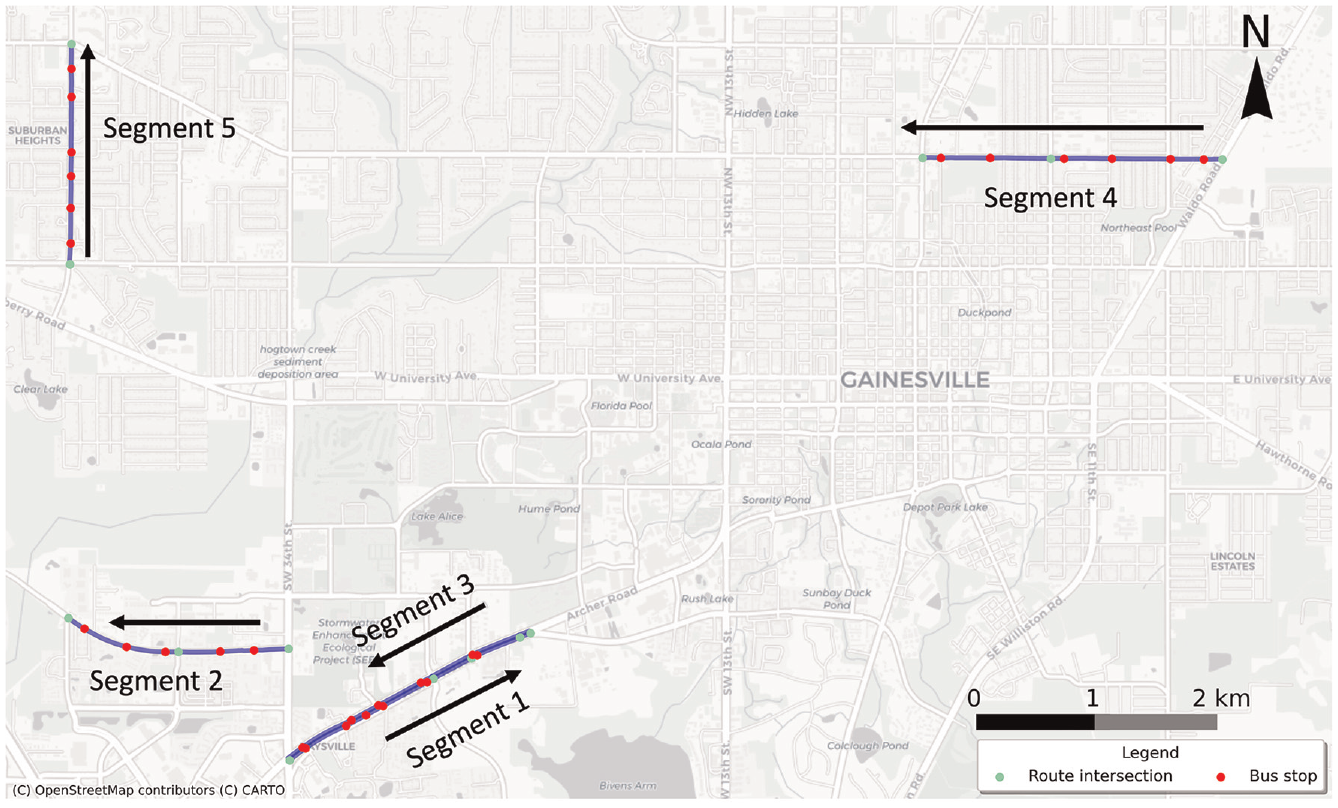
Selected validation segments in the research area.
Characteristics of Road Segments in Validation Area
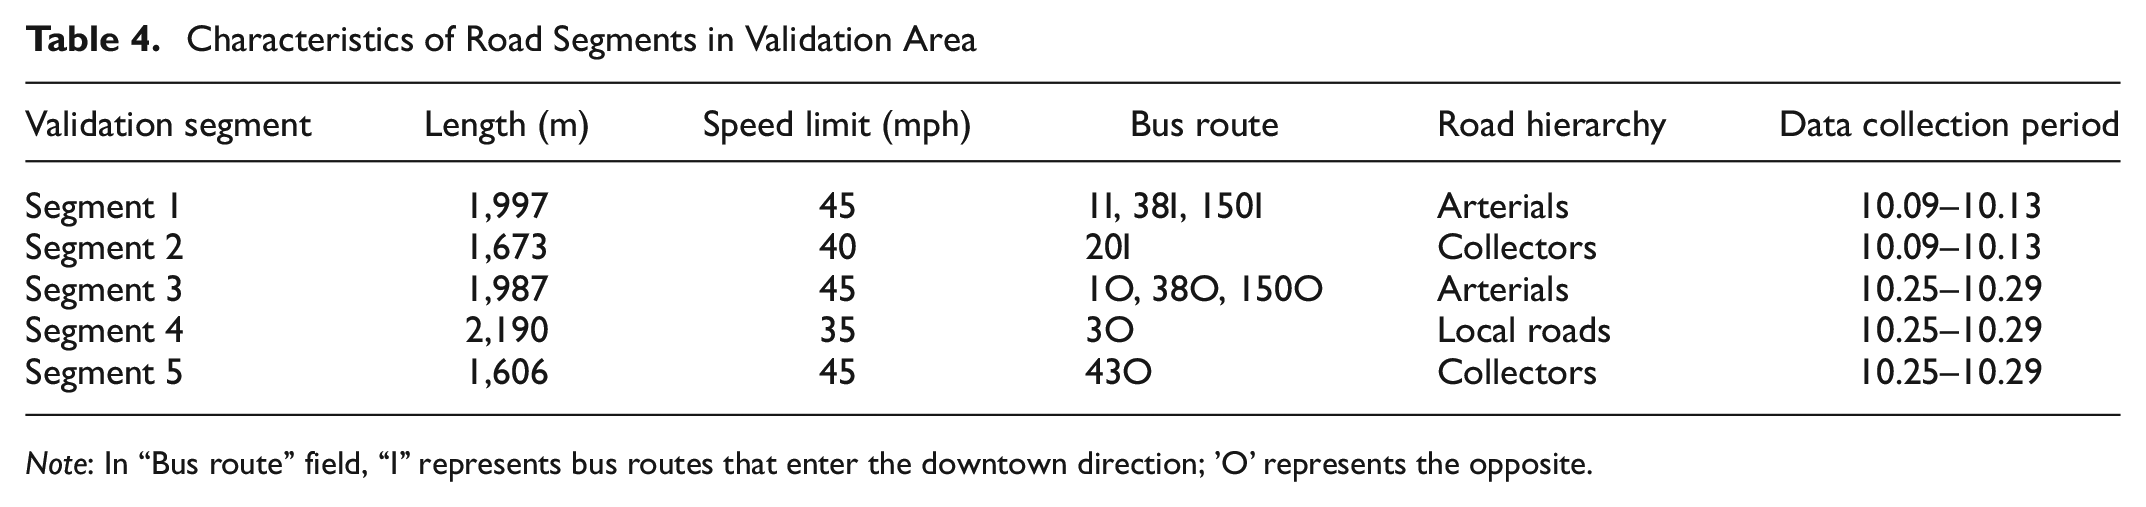
Note: In “Bus route” field, “I” represents bus routes that enter the downtown direction; ’O’ represents the opposite.
To ensure the coherence of the analysis, the space mean speed for each road segment was estimated based on the Bluetooth data and Google Traffic data extracted from the same time period as the GTFS Realtime data. The space mean speed was estimated by setting different time intervals, primarily based on the amount of available data and the level of accuracy required. Specifically, in validation segments 1 to 3, where there were more high-frequency bus lines, a 30-min time interval was selected. Conversely, for segments 4 to 5, with fewer bus lines, a 1-h time interval was chosen.
The space mean speed variations based on the three data sources across time for the five road segments are illustrated in Figure 6. It is shown that the variation patterns of GTFS Realtime data closely resembled that of the Bluetooth data. However, it is crucial to acknowledge that Bluetooth and Google Traffic data primarily captured travel patterns from regular traffic, while GTFS Realtime data recorded travel information from buses. As a result, a speed gap between these data types was evident.
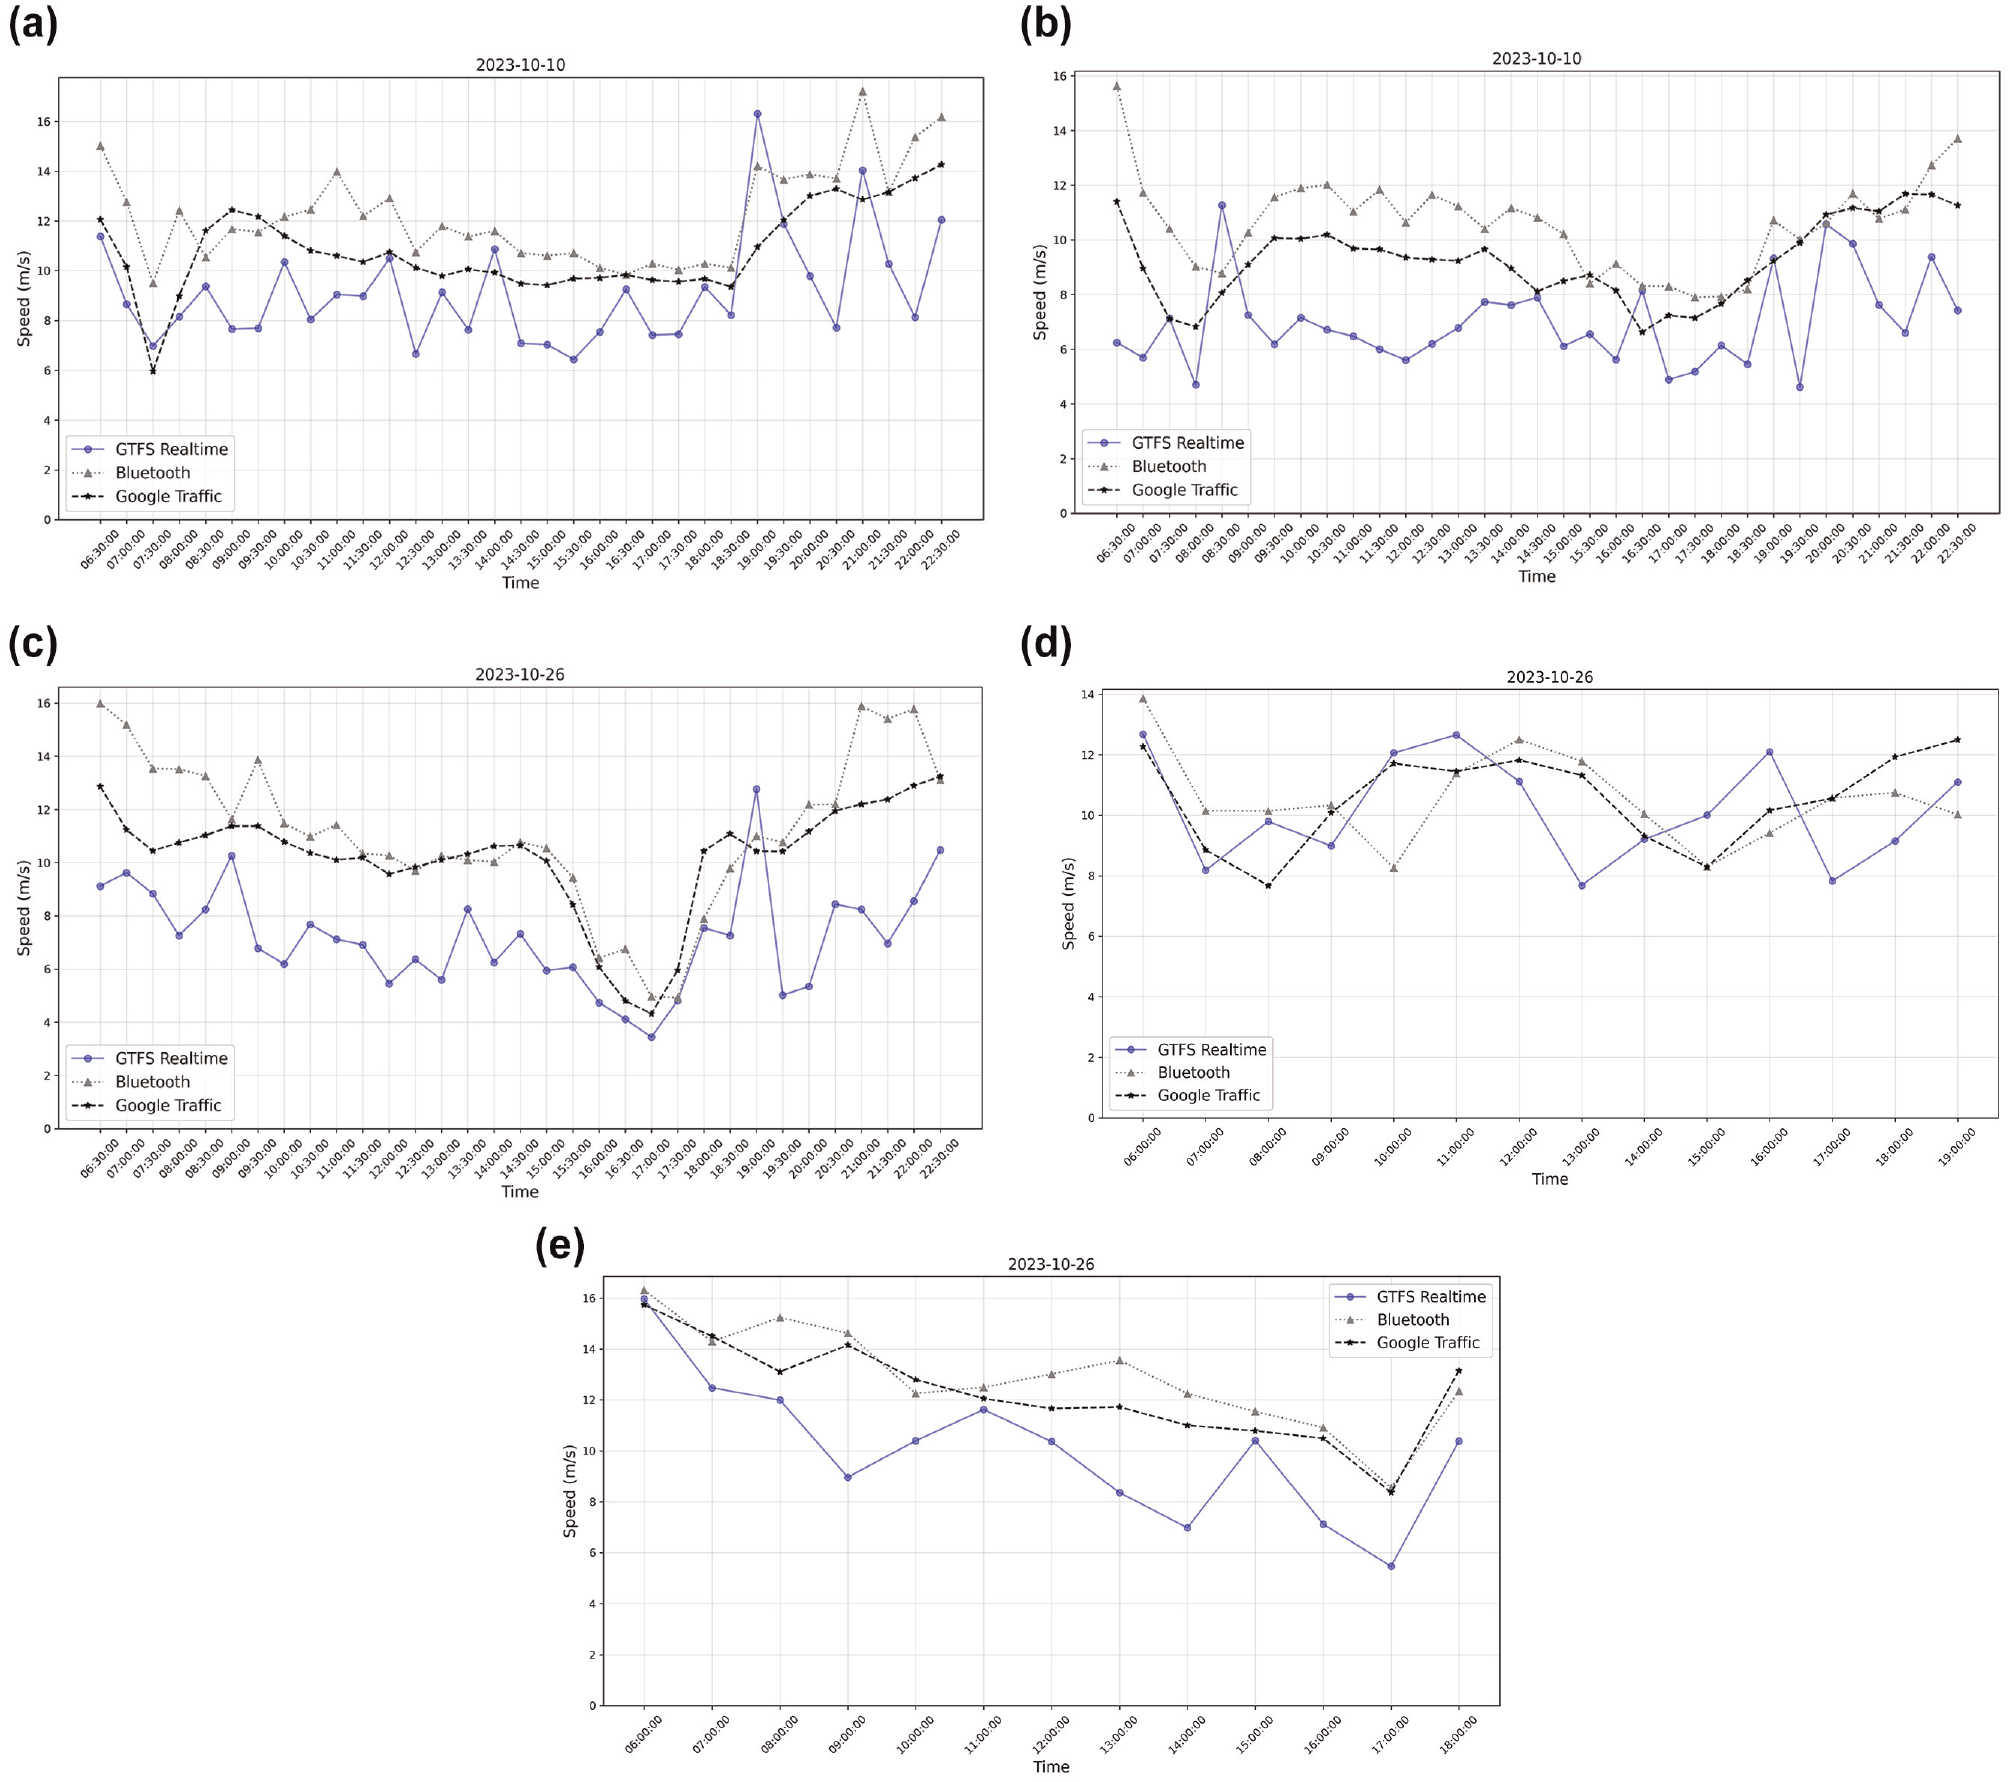
Space mean speed validation compared with Bluetooth data and Google Traffic.
To assess whether the speed variations of buses and regular traffic were significantly different from each other, Kolmogorov–Smirnov (KS) tests were conducted. Given the inherent speed differences between buses and regular traffic, the speed value of each data point was divided by the sum of speed to obtain a normalized space mean speed

where
The null and alternative hypotheses for the KS tests were defined as follows:
Table 5 presents the values of test statistics of the KS tests, followed by the p-value in parentheses. With a significance level of α = 0.05, the majority of the results for BL–GTFS were not statistically significant, indicating that the space mean speed estimated from GTFS Realtime data exhibits similar temporal variation patterns to those derived from Bluetooth data. Nevertheless, results from multiple cases in the BL–GT comparison showed statistical significance, indicating disparities in the temporal distribution patterns between the two datasets. These findings suggest that GTFS Realtime data are more proficient in capturing real-time speed variations compared with Google Traffic data.
Kolmogorov–Smirnov Test Results For All Validation Segments
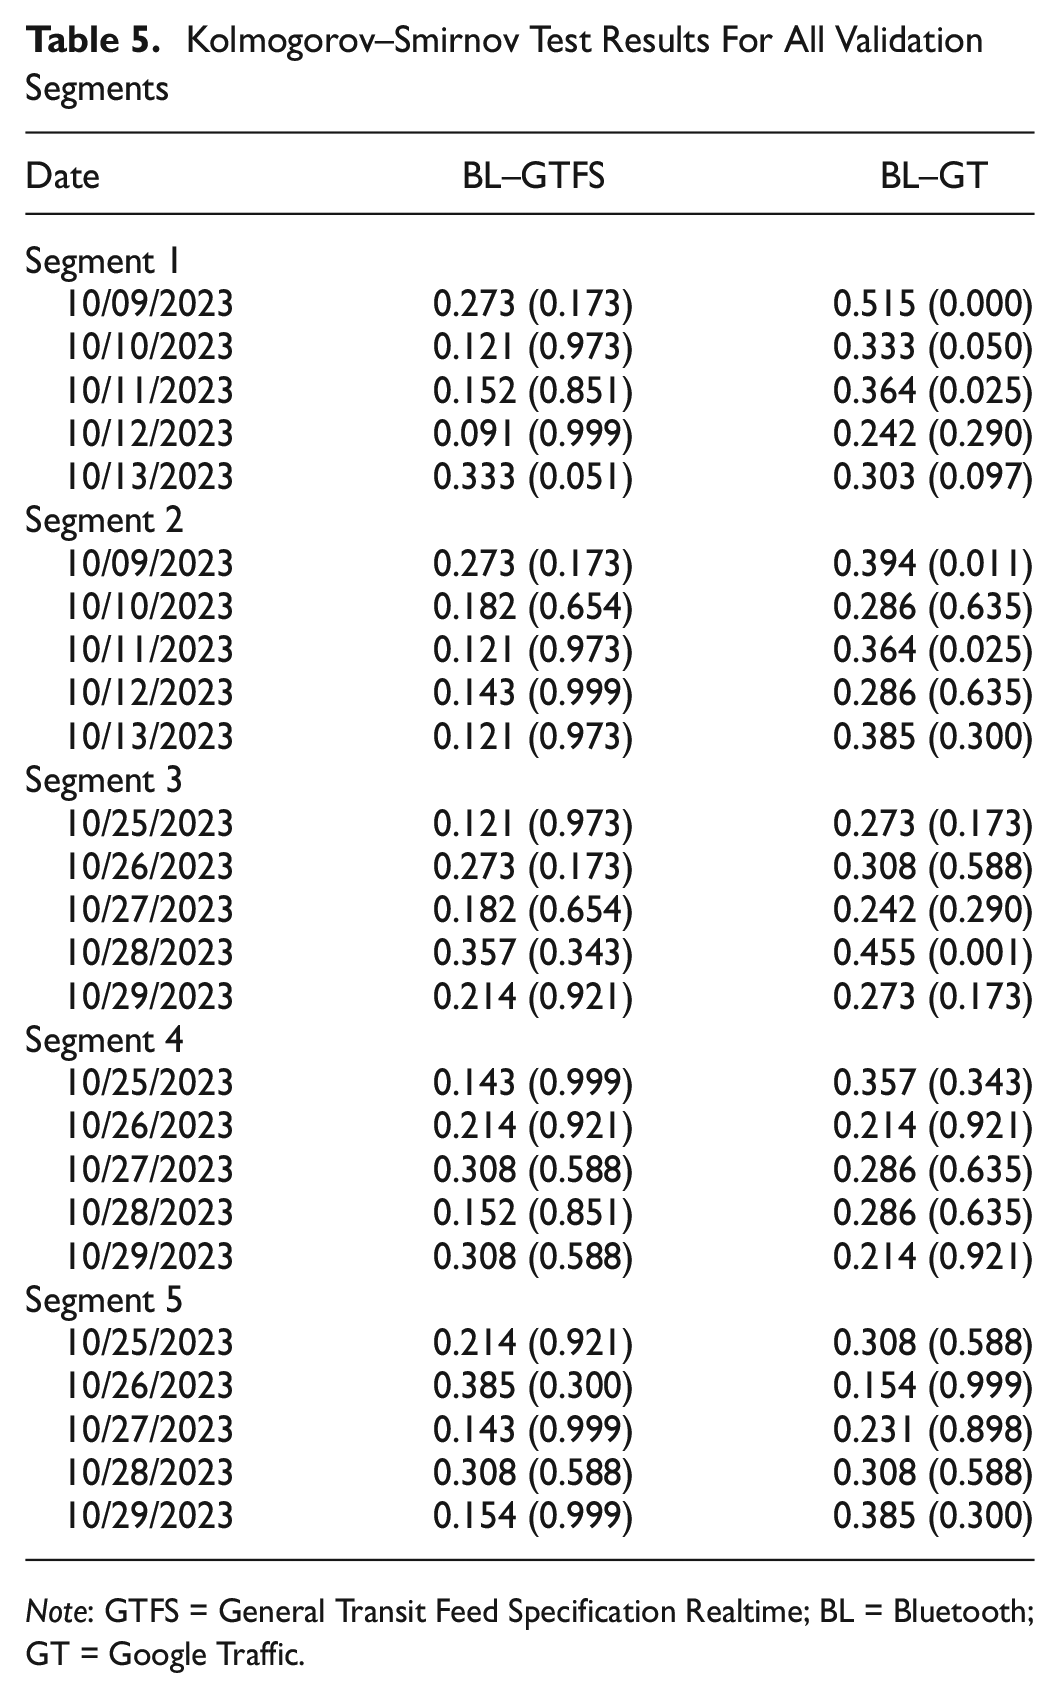
Note: GTFS = General Transit Feed Specification Realtime; BL = Bluetooth; GT = Google Traffic.
Correlation and Error Analysis
Previous studies demonstrated a linear relationship between the average travel time of the automobile (ATT) and the average travel time of bus (BTT) ( 53 , 60 ). The linear model, expressed in Equation 6, can be used to estimate ATT based on BTT.

where
To further validate the effectiveness of GTFS Realtime data in real-time urban traffic monitoring, 80% of the data were used as the training dataset to calibrate the Bluetooth-based travel time against GTFS Realtime–based travel time relationship (i.e., BL–GTFS), as well as the Bluetooth-based travel time against Google Traffic–based travel time relationship (i.e., BL–GT). Following model fitting, the remaining 20% of the data were employed for validation purposes. Root mean squared error (RMSE) and mean absolute percentage error (MAPE), defined in Equations 7 and 8, were the two chosen metrics measuring the accuracy of the models by comparing the predictions to the actual observations.


where
Table 6 shows the calibration and validation results. In general, linear relationships were observed with acceptable levels of correlation coefficient, with all values falling within a reasonable range from 0.384 to 0.658. By comparing the MAPE and RMSE metrics for BL–GTFS and BL–GT, it is evident that the errors for BL–GT were consistently greater than those for BL–GTFS in most cases, indicating the superiority of the GTFS Realtime-based method over the Google Traffic–based method. This comparison underscores the robust capability of GTFS Realtime data in capturing temporal variation, affirming its suitability as the dataset for real-time urban traffic network monitoring.
Results of Model Calibration and Validation
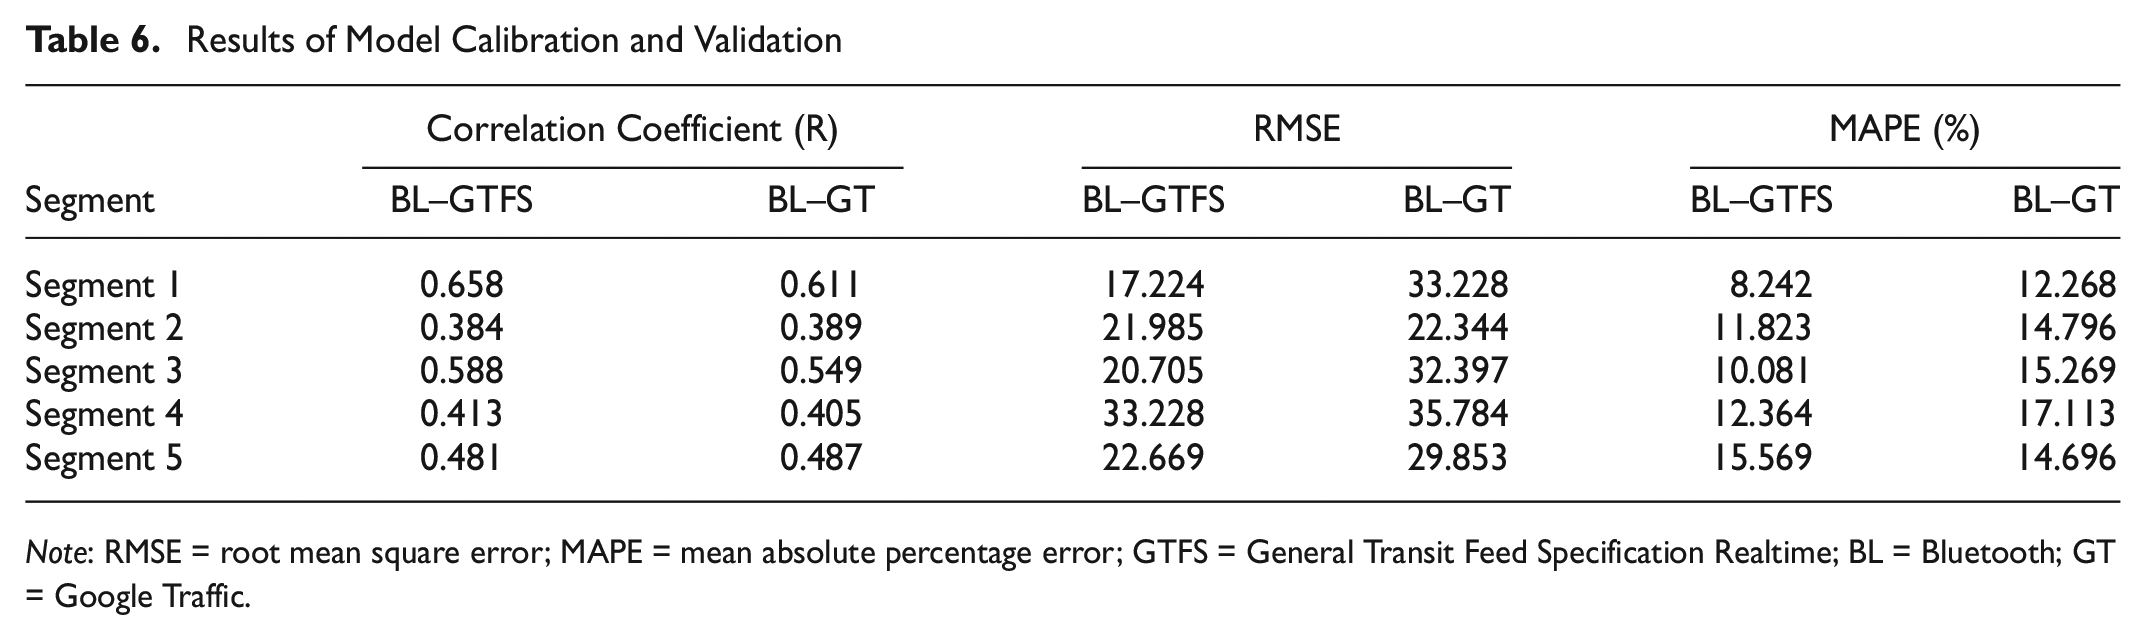
Note: RMSE = root mean square error; MAPE = mean absolute percentage error; GTFS = General Transit Feed Specification Realtime; BL = Bluetooth; GT = Google Traffic.
Discussion and Conclusion
Large-scale deployment of sensors across transportation networks for real-time network traffic monitoring poses significant challenges, such as privacy concerns, high capital and maintenance costs, and limited coverage. In this study, a novel methodology based on GTFS Realtime data, an emerging real-time data source generated by public transit, for citywide network sensing to monitor real-time urban traffic conditions is introduced. Specifically, the proposed method uncovered the typical travel patterns of buses by isolating their operational events, such as boarding and alighting passengers at bus stops. Subsequently, two algorithms, the segment-trip extraction algorithm and the space mean speed estimation algorithm, were developed to implement the proposed methodology for space mean speed estimation.
A case study was conducted to assess the potential and effectiveness of GTFS Realtime data in capturing variations in link speed. Validation was carried out using Bluetooth data as the ground truth to verify the accuracy of the GTFS Realtime data in urban traffic network sensing, while Google Traffic data served as the benchmark for comparison. KS tests were employed to assess whether the speed variations of buses and regular traffic significantly differed from each other. Results indicated that GTFS Realtime data exhibited an overall similar variation pattern and consistent differences compared with Bluetooth data. Additionally, GTFS Realtime outputs were validated through regression analysis, correlation computation, and the validation set approach. The findings consistently demonstrated that GTFS Realtime data closely aligned with Bluetooth data, establishing them as a more reliable and practical traffic data source compared with Google Traffic.
GTFS stands out as a crucial asset in the evolving landscape of public transportation datasets. Its widespread adoption and standardization make it an invaluable resource for various stakeholders including departments of transportation (DOTs) and city councils. For entities such as DOTs and city councils, leveraging GTFS data offers extensive benefits in enhancing operational efficiency, service planning, and public engagement. By democratizing access to transit data, these organizations can embrace a more data-driven approach to decision making, directly affecting urban mobility and sustainability initiatives. Another notable advantage of GTFS Realtime data is their compatibility with other data sources. For example, combining GTFS with GPS data can offer real-time transit tracking, enriching passenger information systems ( 61 ). Additionally, integration with various transportation-related datasets empowers more streamlined route planning and service adjustments ( 62 ). Thus, GTFS Realtime data are a promising data source with great potential for research and practical applications.
While this study has demonstrated the potential of GTFS Realtime data for urban traffic monitoring, it is essential to acknowledge several limitations. First, the temporal resolution of GTFS Realtime data can result in data gaps during periods when buses are not in operation on specific routes. For instance, if no buses are operating on a particular road during a certain time period, the GTFS Realtime data for that period will be missing. This limitation may affect the accuracy and continuity of traffic monitoring. Second, in addition to the Bluetooth and Google Traffic data, other emerging data sources, such as CV data, should be used to provide additional validation for the proposed approach. Third, other important urban macroscopic traffic quantities, such as traffic flow and travel density, should be estimated to comprehensively assess the suitability and feasibility of GTFS Realtime data for traffic monitoring applications.
Footnotes
Author Contributions
The authors confirm contribution to the paper as follows: study conception and design: Shangkun Jiang, Yuran Sun, Wai Wong, Xilei Zhao; data collection: Shangkun Jiang; analysis and interpretation of results: Shangkun Jiang, Wai Wong, Yiming Xu; draft manuscript preparation: Shangkun Jiang, Yuran Sun, Wai Wong, Yiming Xu, Xilei Zhao. All authors reviewed the results and approved the final version of the manuscript.
Declaration of Conflicting Interests
The author(s) declared no potential conflicts of interest with respect to the research, authorship, and/or publication of this article.
Funding
The author(s) disclosed receipt of the following financial support for the research, authorship, and/or publication of this article: This research was supported by the U.S. Department of Transportation (U.S. DOT) through the Tier 1 University Transportation Center, the Center for Equitable Transit-Oriented Communities (CETOC), under Grant 69A3552348337.
Any opinions, findings, conclusions, or recommendations expressed in this material are those of the authors and do not necessarily reflect the views of U.S. DOT.