
Abstract
The introduction and subsequent growth of ride-sourcing services have been found to affect the use of existing modes of travel. Although prior studies have explored the impacts of these services as a whole, relatively little work has been done to explore the relationship between shared ride-sourcing and existing modes of travel. Given the potential for shared ride-sourcing to help mitigate the negative externalities associated with ride-sourcing, understanding the factors influencing the use of these services and their relationship with existing modes can inform efforts to help ensure that this potential is realized. This study uses data from a web-based survey of Metro Vancouver residents to estimate a joint revealed preference–stated preference (RP–SP) model of mode choices for non-commuting trips. The model is then applied to explore the potential impacts of shared ride-sourcing on the demand for existing modes. To the authors’ knowledge, this is the first study to use a joint RP–SP model to explore the potential impacts of shared ride-sourcing on the demand for existing modes. The results suggest these services can affect the demand for exclusive ride-sourcing and attract demand from more sustainable modes such as public transit and active modes. This information can be used to help inform policies that help ensure that the benefits of shared ride-sourcing are realized. Shared ride-sourcing use can be encouraged by increasing the difference between the cost of exclusive and shared services; however, limiting the impacts of these services on the demand for more sustainable modes is also important.
The availability of ride-sourcing services has the potential to influence activity-travel behavior, which can have important implications for the transportation system. Consequently, significant effort has been dedicated to studying the factors influencing the utilization of these services, their relationship with existing modes, and their potential impacts. At the individual level, ride-sourcing adoption can influence activity scheduling and location choice decisions, affect the utilization of existing modes of travel, and induce additional travel demand ( 1 – 3 ). Additionally, the availability of ride-sourcing has been found to affect the demand for more sustainable modes of travel and increase vehicle-miles traveled (VMT), congestion, and emissions ( 4 – 6 ). In light of these impacts, shared ride-sourcing has been presented as a potential means of mitigating the negative externalities associated with ride-sourcing. These services, which are also referred to as pooled ride-sourcing, ridesharing, and ride-splitting, offer customers a discounted fare in exchange for the potential to be matched with another customer making a similar trip ( 7 ). By increasing vehicle occupancies, shared ride-sourcing has the potential to reduce the VMT associated with ride-sourcing, which can improve air quality, and reduce congestion ( 8 – 11 ).
However, the potential for shared ride-sourcing to mitigate the negative externalities associated with ride-sourcing can be influenced by several factors. In particular, research suggests that the potential for shared services to influence reductions in VMT is influenced by the willingness to use these services and their market penetration ( 12 – 14 ). For example, de Ruijter et al. ( 9 ) found that significant reductions in VMT were observed in scenarios in which users were offered a 50% discount for using shared ride-sourcing. Similarly, using an existing travel demand model, Rodier et al. ( 15 ) found that the VMT reductions associated with dynamic ridesharing services increased as participation rates increased in San Francisco. Additionally, the extent to which shared ride-sourcing can mitigate the negative externalities associated with ride-sourcing depends on its relationship with existing modes of travel. Specifically, shared ride-sourcing can contribute to VMT reductions if it is used instead of private vehicles and taxis. However, the relatively lower fares create the potential that these services are used in place of public transit and active modes ( 16 – 18 ). Besides, the impacts of shared ride-sourcing on VMT are also influenced by the distance traveled by ride-sourcing vehicles while deadheading ( 9 , 19 ).
Given the potential for shared ride-sourcing to help mitigate the negative externalities associated with ride-sourcing, additional work is needed to understand the factors influencing the use of these services and their relationship with existing modes of travel. This study uses both revealed preference (RP) and stated preference (SP) data to estimate a joint RP–SP model of mode choice decisions for non-commuting trips and explore the potential impacts of shared ride-sourcing on demand for existing modes in Metro Vancouver. The decision to focus on non-commuting trips was informed by the tendency for ride-sourcing services to be used for social, recreational, and leisure trips ( 1 ). To the authors’ knowledge, this is the first study to use a joint RP–SP model to explore the potential impacts of shared ride-sourcing on the demand for existing modes. This study aims to offer insights into the factors influencing the decision to use shared ride-sourcing and identify the modes whose utilization is most impacted by the introduction of these services. The findings of this study can help inform policies that aim to encourage the use of shared ride-sourcing while limiting their impacts on the use of more sustainable modes.
The remainder of this paper is structured as follows: first, a review of studies on the relationship between ride-sourcing and existing modes and the determinants of shared ride-sourcing use is presented. Next, information about the data and methodology used in this study is provided. Finally, the results of the study are presented, and their implications are discussed.
Literature Review
Amid the increasing popularity and utilization of ride-sourcing, a growing body of literature has aimed to explore how these services have influenced the demand for existing modes. One approach taken by studies of this nature has been to ask respondents to provide information about their most recent ride-sourcing trip, including the mode they would have used if these services were unavailable. Studies that utilize these counterfactual questions typically find that ride-sourcing tends to be a replacement for driving, public transit, and taxis ( 2 , 8 , 20–22). However, the extent to which ride-sourcing replaces these modes tends to differ from location to location ( 1 ). Additionally, trips made using shared ride-sourcing services are more likely to have replaced transit ( 20 , 22 , 23 ).
Besides, ridership data have also been used by studies exploring the impacts of ride-sourcing on public transit demand. The findings of studies that have taken this approach highlight the potential for ride-sourcing to both complement and act as a substitute for public transit. For example, Hall et al. ( 24 ) found that the entry of Uber was associated with a decline in bus ridership and an increase in rail ridership in metropolitan statistical areas with above-median transit ridership in the United States. Similar findings were reported by Babar and Burtch ( 25 ) in their study on the impacts of ride-sourcing on transit ridership in urbanized areas (UZAs) in the United States. Interestingly, Nelson and Sadowsky ( 26 ) found that the first entry of a transportation network company (TNC) was associated with greater transit ridership in a UZA. In contrast, the entry of a second TNC was found to have the opposite effect. However, despite the potential for ride-sourcing to complement and substitute for public transit, the substitution effects appear to be stronger than the complementary effects ( 27 , 28 ). Although these studies offer important insights into the relationship between ride-sourcing and existing modes, they typically do not distinguish between exclusive and shared ride-sourcing.
Given the potential benefits of shared ride-sourcing, there have also been several studies that have investigated the factors influencing the use of these services. To explore these factors, studies typically use data collected through surveys to estimate econometric and statistical models. Studies that have used this approach have consistently found that younger individuals are more likely to have experience using shared ride-sourcing ( 14 ). Moreover, gender, employment, education, vehicle ownership, travel habits, and residential location have been found to influence the adoption of these services ( 29 – 33 ). Additionally, latent attitudinal factors have been found to influence the adoption of shared ride-sourcing. For example, Lavieri and Bhat ( 20 ) found that individuals who displayed greater levels of privacy sensitivity were less likely to have used shared ride-sourcing, whereas Spurlock et al. ( 32 ) found that respondents who valued minimizing environmental impacts were more likely to be adopters. Similarly, Amirkiaee and Evangelopoulos ( 34 ) found that attitudes toward ride-sourcing and perceived risk influenced the intention to use shared ride-sourcing.
Aside from the adoption of shared ride-sourcing, there have also been efforts to explore the factors influencing the willingness to use these services using SP experiments. Studies of this nature typically involve the estimation of a discrete choice model to examine the factors influencing the choice between exclusive and shared ride-sourcing for a given trip. Despite their relatively lower costs, studies on the topic typically find evidence of an aversion toward using shared services ( 13 , 17 , 33 ). Additionally, the decision to use shared ride-sourcing can be influenced by factors such as household income, age, gender, travel habits, and attitudes toward sharing and environmentalism ( 12 , 13 , 17 , 33 ). A similar approach was taken by Azimi and Jin ( 35 ), whose survey asked respondents to choose between the mode they used for a trip they make regularly, exclusive ride-sourcing, and shared ride-sourcing. In addition to corroborating the findings of studies concerning the choice between exclusive and shared services, the results also highlight the influence of attitudes toward cost-effectiveness and on-demand services on the propensity to use shared services. Although these studies shed light on the factors influencing the use of shared ride-sourcing, additional work is needed to understand how these services could affect demand for other modes.
This study aims to contribute to the literature by quantifying the potential impacts of introducing shared ride-sourcing on the demand for existing modes using a joint RP–SP model. Although previous studies have combined RP and SP data to examine the decision to use shared ride-sourcing, they focused on analyzing the value of travel time ( 31 , 33 ), the value of travel time savings ( 36 ), or the willingness to share a ride with other customers ( 31 , 33 ). Consequently, this study appears the first to use a joint RP–SP model to explore the potential impacts of the introduction of shared ride-sourcing on the demand for existing modes. Prior studies exploring the impacts of these services focused on the percentage of ride-sourcing trips made using shared services ( 13 ), focused on the impacts of shared ride-sourcing on VMT ( 15 ), were based on the application of graph-based methods ( 9 ), treated ride-sourcing as a single alternative ( 37 ), or relied solely on SP data ( 38 ). Using a joint RP–SP model offers the ability to gain insights into the factors influencing the choice of alternatives that are not available in the market while using information from observed choices as a reference point ( 39 ). The findings of this study can offer insights into the factors influencing the decision to use shared ride-sourcing and the extent to which these services could influence demand for existing modes. This information can help inform policies that aim to ensure that shared ride-sourcing is able to reduce the VMT associated with ride-sourcing while limiting its impacts on more sustainable modes of travel.
Data Description
Survey Conduct and Administration
The data used in this study were collected through the Survey on the Effects of Ride-sourcing in the Vancouver Region (SERVR). SERVR was a web-based survey conducted in April 2022 to understand the utilization of ride-sourcing services in Metro Vancouver. Comprising Vancouver and the surrounding municipalities, Metro Vancouver was home to 2.57 million residents as of 2021 ( 40 ). Ride-sourcing was introduced to Metro Vancouver relatively late compared to other metropolitan areas in North America, with exclusive ride-sourcing having been introduced in January 2020 and shared ride-sourcing introduced in February 2023 ( 41 , 42 ).
SERVR was administered through a market research company, which invited a random sample of its panel members who live in the study area to participate in the survey. The market research company provided participants with non-monetary compensation after completing the survey. As part of SERVR, a residential location quota was used to help ensure that the distribution of the home locations of the respondents was reasonably consistent with that of the Canadian census. SERVR respondents were asked to provide information about their socio-demographic attributes, ride-sourcing experience, and ride-sourcing use. Respondents were also asked to complete RP questions with regard to their typical commuting trip and a recent non-commuting trip. Specifically, respondents were asked to indicate the origin, destination, departure time, and mode used for the reported commuting and non-commuting trips. Additionally, respondents were asked to complete a series of attitudinal questions and SP experiments. For more information about the design of SERVR, see Ong ( 43 ). A total of 1,967 respondents completed the survey; after removing responses from participants living outside the study area, responses from 1,851 individuals remained.
Experimental Design
In SERVR, SP experiments were used to gain insights into the factors influencing the decision to use ride-sourcing services. The alternatives that were included in the SP experiments, as well as the corresponding attribute values, are summarized in Table 1. The design of the SP experiments was informed by the modes available in the study area and the design of similar studies concerning mode choice decisions. In the experiments, five modes were conditionally available to respondents.
The drive yourself mode was available to respondents who indicated that they possess a driver's license, have access to a private vehicle, and regarded driving as a feasible mode for non-commuting trips once COVID-19 is no longer a public health threat.
The driven by someone you know mode was available to respondents who indicated that they had access to a private vehicle, lived with at least one household member who possesses a driver’s license, and regarded being driven as a feasible mode for non-commuting trips once COVID-19 is no longer a public health threat.
The regional transit mode was available to respondents whose reported non-commuting trip began and ended in municipalities served by the rapid transit system.
The bicycle mode was available to respondents who indicated that bicycling would be feasible for non-commuting trips once COVID-19 is no longer a public health threat.
The walk mode was available to respondents who indicated that walking would be feasible for non-commuting trips once COVID-19 is no longer a public health threat.
Summary of Alternatives, Attributes, and Attribute Levels Used in the Stated Preference Experiments
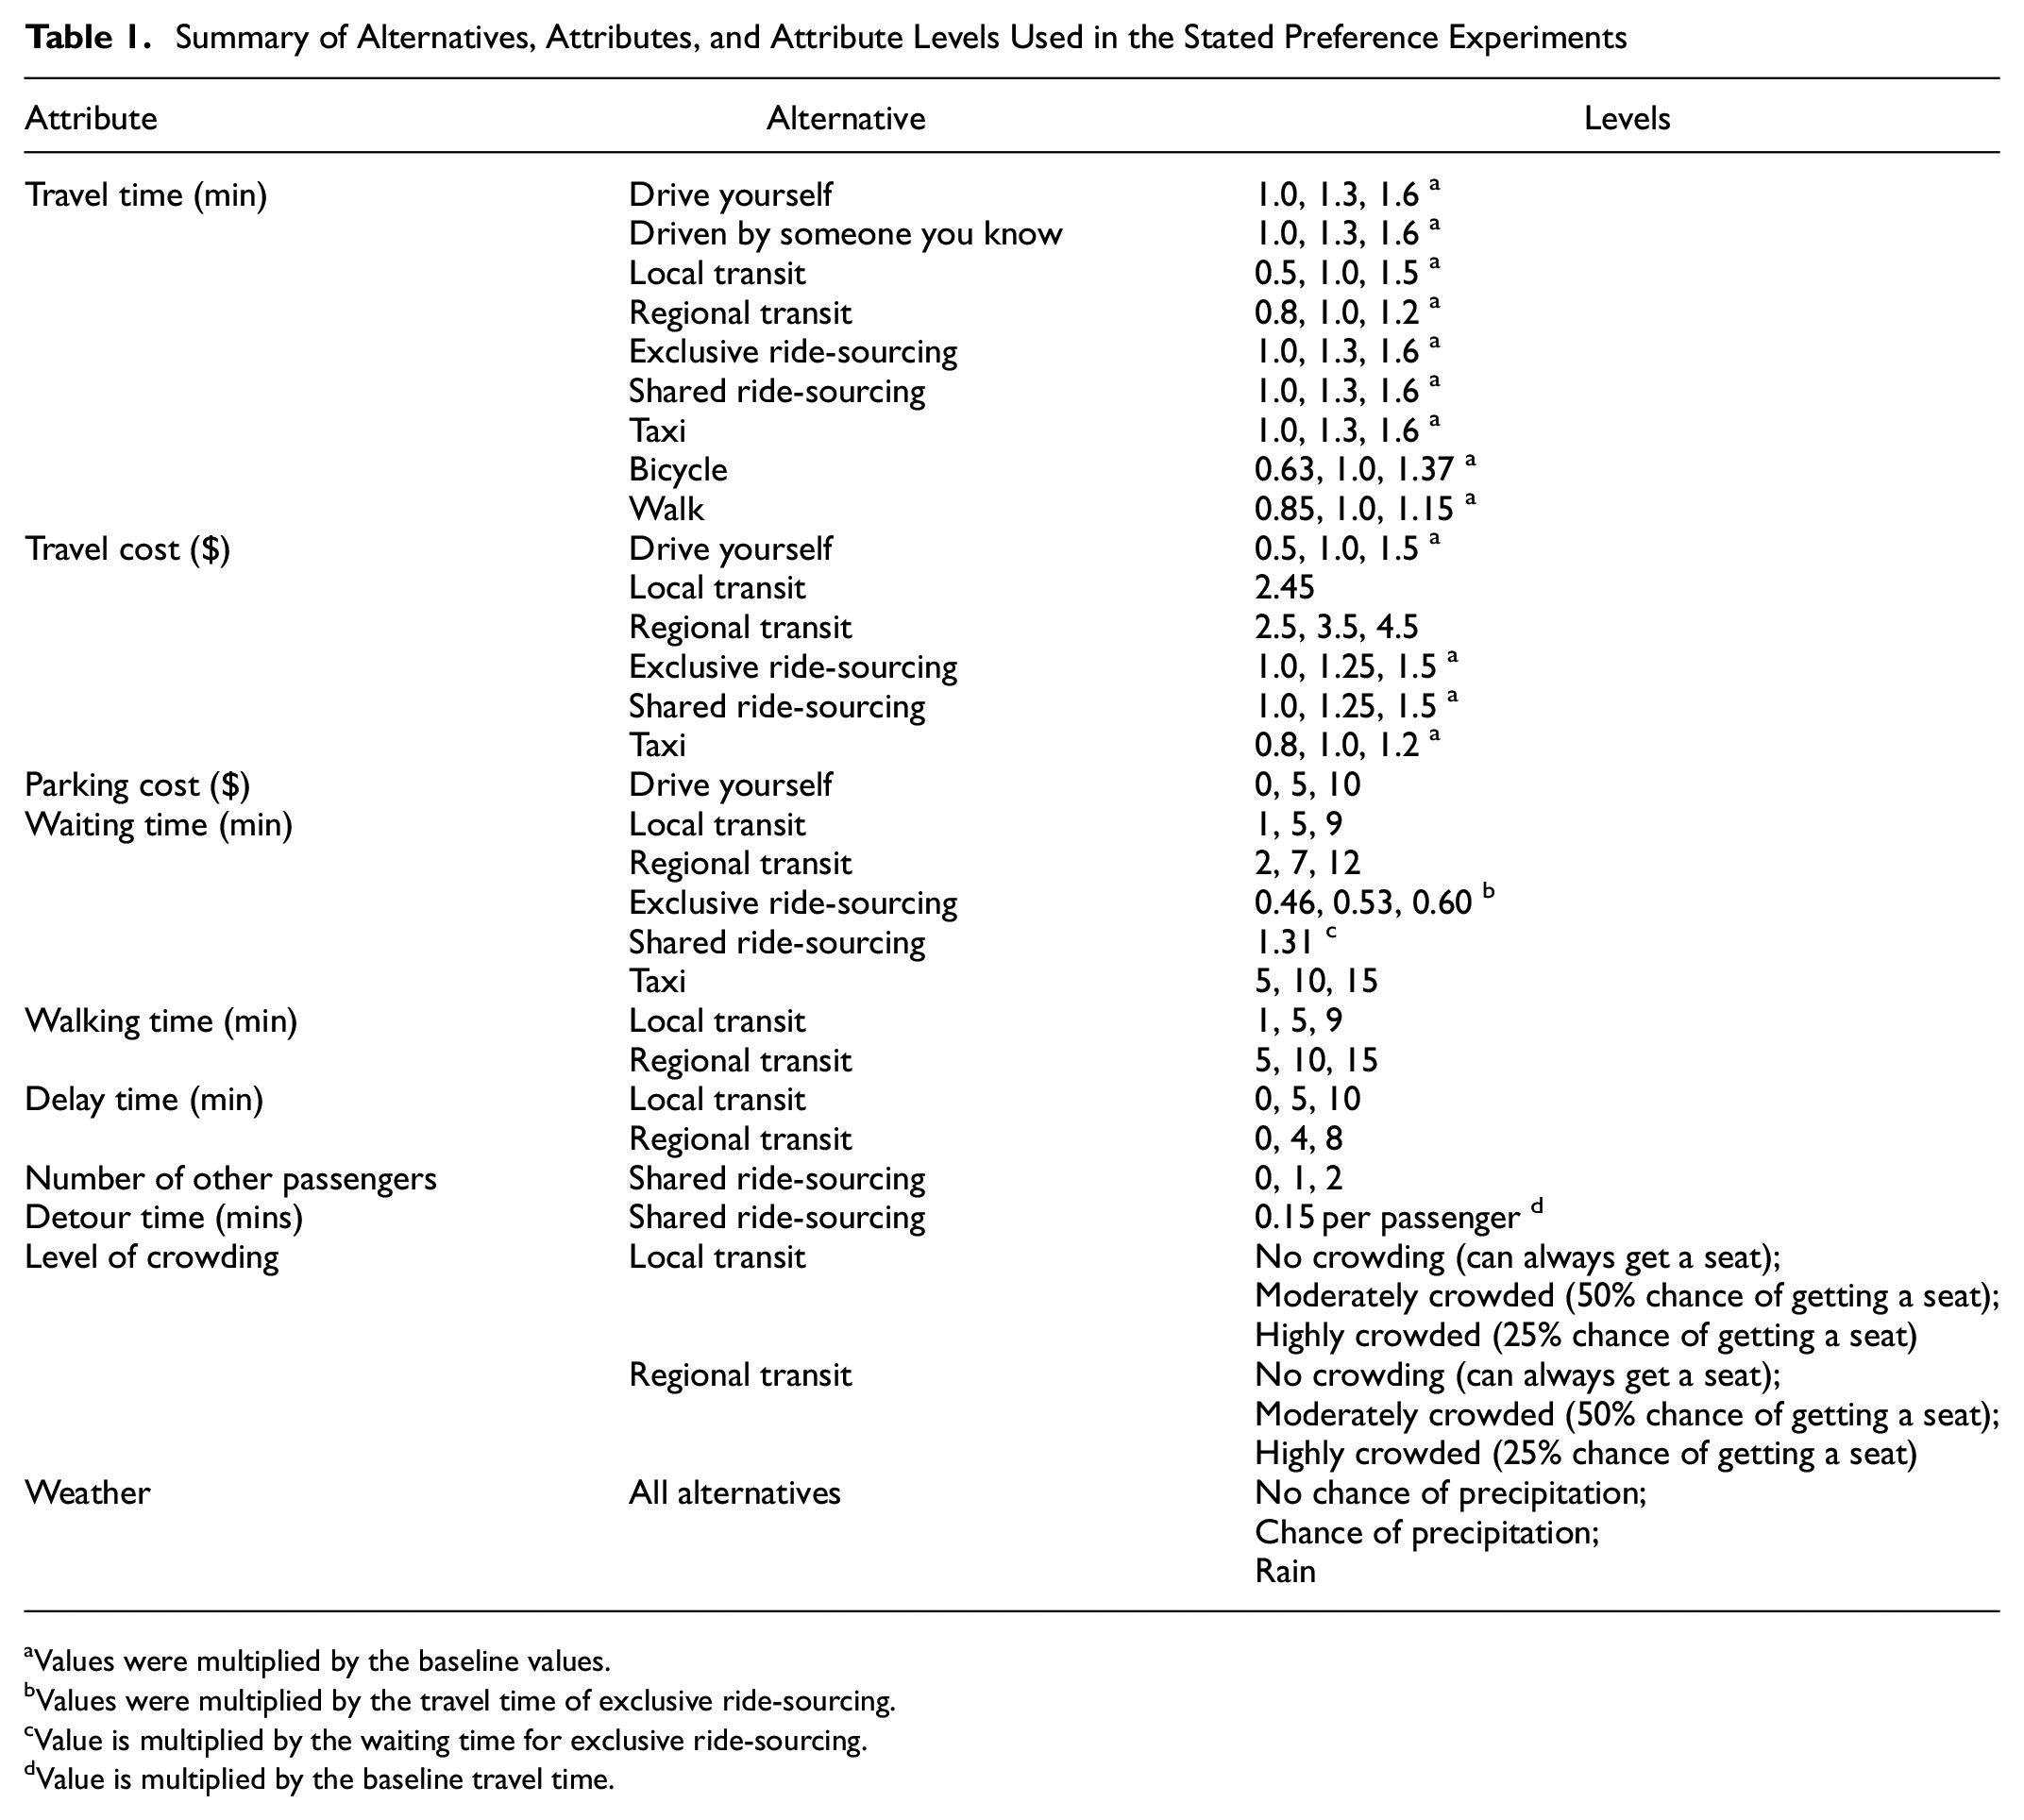
Values were multiplied by the baseline values.
Values were multiplied by the travel time of exclusive ride-sourcing.
Value is multiplied by the waiting time for exclusive ride-sourcing.
Value is multiplied by the baseline travel time.
The SP scenarios were designed based on a hypothetical non-commuting trip whose attributes were determined using data from the most recent iteration of the regional household travel survey—the 2017 Trip Diary. As part of the experimental design, the public transit alternatives were grouped together, as were the motorized alternatives (i.e., drive yourself, driven by someone you know, exclusive ride-sourcing, shared ride-sourcing, and taxi). The reference values for the length of trips made using the motorized and transit alternatives were determined based on the average distance of the trips made using these modes in the 2017 Trip Diary. Similarly, the reference value corresponding to the bicycle alternative was based on the 85th percentile value, while the trip length for the walk mode was based on the 97th percentile value. This approach was taken to ensure that the travel times of the alternatives were reasonably competitive.
These reference values were used to determine baseline values for travel time and travel cost corresponding to each alternative. The baseline travel times for the motorized and regional transit alternatives were calculated based on an assumed travel speed of 40 km/h. Similarly, speeds of 20 km/h, 19 km/h, and 4 km/h were assumed for the local transit, bicycle, and walk alternatives, respectively. The baseline cost associated with the drive yourself mode was based on the per-kilometer cost ($ 0.22/km) of owning and operating a mid-size car published by the British Columbia Automobile Association ( 44 ). The cost of the local transit alternative was based on the bus fare in the study area, while the costs associated with the regional transit alternative were based on the zone-based fare system used by the rapid transit system. The baseline cost of the exclusive ride-sourcing alternative was based on a combination of the fare structures used by Uber and Lyft in the study area, calculated based on a base fare of $2.25 and a booking fee of $2.25 plus $ 0.70/km and $ 0.33/minute; correspondingly, the baseline cost of the shared ride-sourcing alternative was defined as 81% of the cost of exclusive ride-sourcing based on the findings of Brown ( 7 ). Finally, the baseline cost of the taxi alternative was determined based on the posted rates for taxi fares, calculated as $3.35 plus $1.93/km ( 45 ).
The values of the waiting and walking times associated with the public transit alternatives were informed by the service guidelines published by TransLink, which operates public transit services in the study area ( 46 ). A similar approach was used to determine the waiting times associated with the taxi alternative ( 47 ). The waiting times associated with the exclusive ride-sourcing alternative were determined based on the work of Komanduri et al. ( 48 ), who analyzed information on ride-sourcing trips made in Austin; similarly, the waiting times for the shared ride-sourcing alternative were determined based on the work of Young et al. ( 49 ) who analyzed data on shared ride-sourcing trips made in Toronto. The values of the delay time attribute for the local and regional transit alternatives were determined based on the on-time performance information published by TransLink. In the experimental design, the number of other passengers attribute was included to reflect the potential for customers to be matched with another traveler. Additionally, attributes related to crowding onboard transit vehicles and the weather were included in the design to help explore the potential for contextual factors to influence mode choice decisions.
The SP experiments were designed using the D-efficient approach in the software Ngene ( 50 ), with the values of the priors being taken from a previous study on ride-sourcing use in Toronto ( 51 ). Additionally, values with low magnitudes and the expected sign were assumed for attributes that were not included in the reference study. As part of the design process, four constraints were implemented to help improve the realism of the choice experiments:
Motorized modes should have the lowest travel time
The travel time for all motorized modes should be the same
Regional transit should be faster than local transit
Bicycling should be faster than walking
Through the experimental design process, three choice experiments were produced for each possible choice set. Before respondents completed the SP experiments, they were presented with a short description of the exclusive ride-sourcing, shared ride-sourcing, local transit, and regional transit alternatives. An example of a choice experiment presented to SERVR respondents is shown in Figure 1.
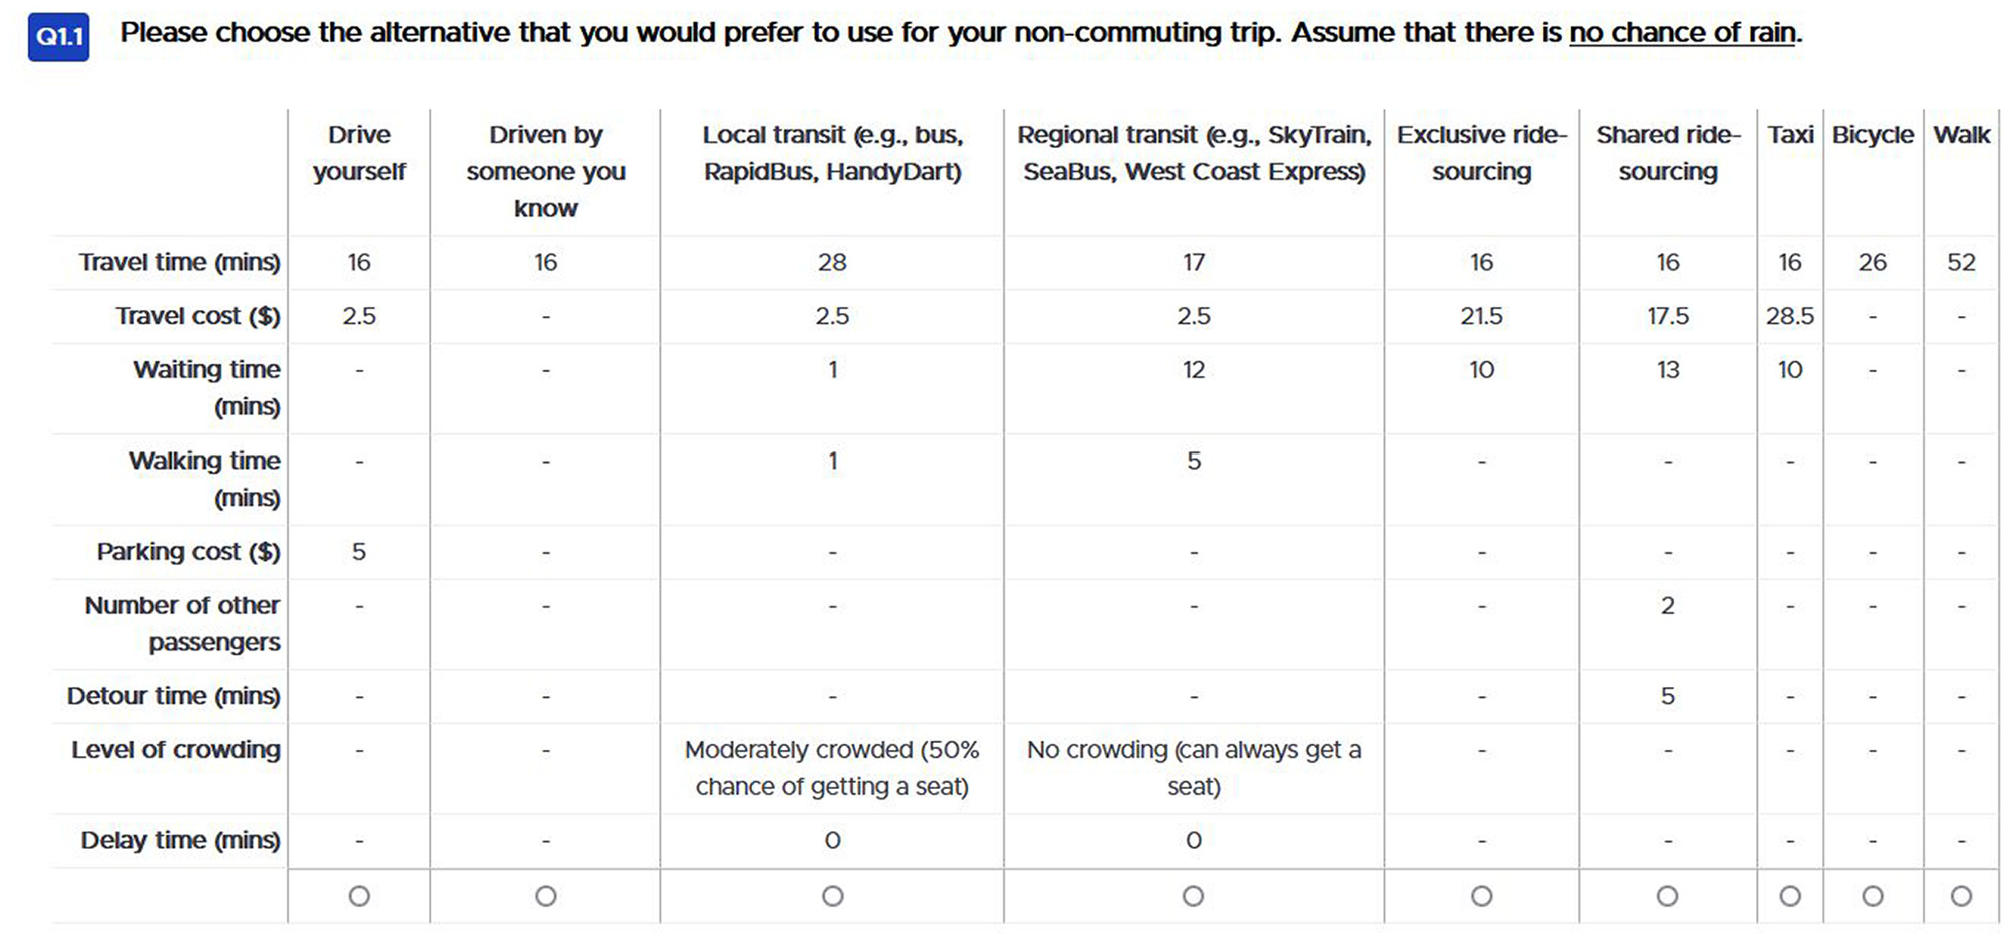
An example of a choice experiment for a specific choice set.
Sample Description
To help improve the extent to which the sample represents the residents of the study area, weight-adjustment factors were developed using the methodology outlined in Wang et al. ( 52 ). Specifically, the weight-adjustment factors were determined using a bi-proportional iterative procedure that used the distribution of age and household size in the study area as control variables. The distributions of key socio-demographic attributes in the weighted sample are compared with those from the 2021 Canadian census in Figure 2. The distributions of gender, age, and household income are relatively consistent with those of the study area. However, men are slightly under-represented in the sample, as are those from households who earn less than $50,000 or over $100,000 annually. Correspondingly, respondents from households earning between $50,000 and $99,999 annually are slightly over-represented in the weighted sample. Additionally, individuals under the age of 20 are under-represented, which is likely the result of the administration of the survey to a market research panel.
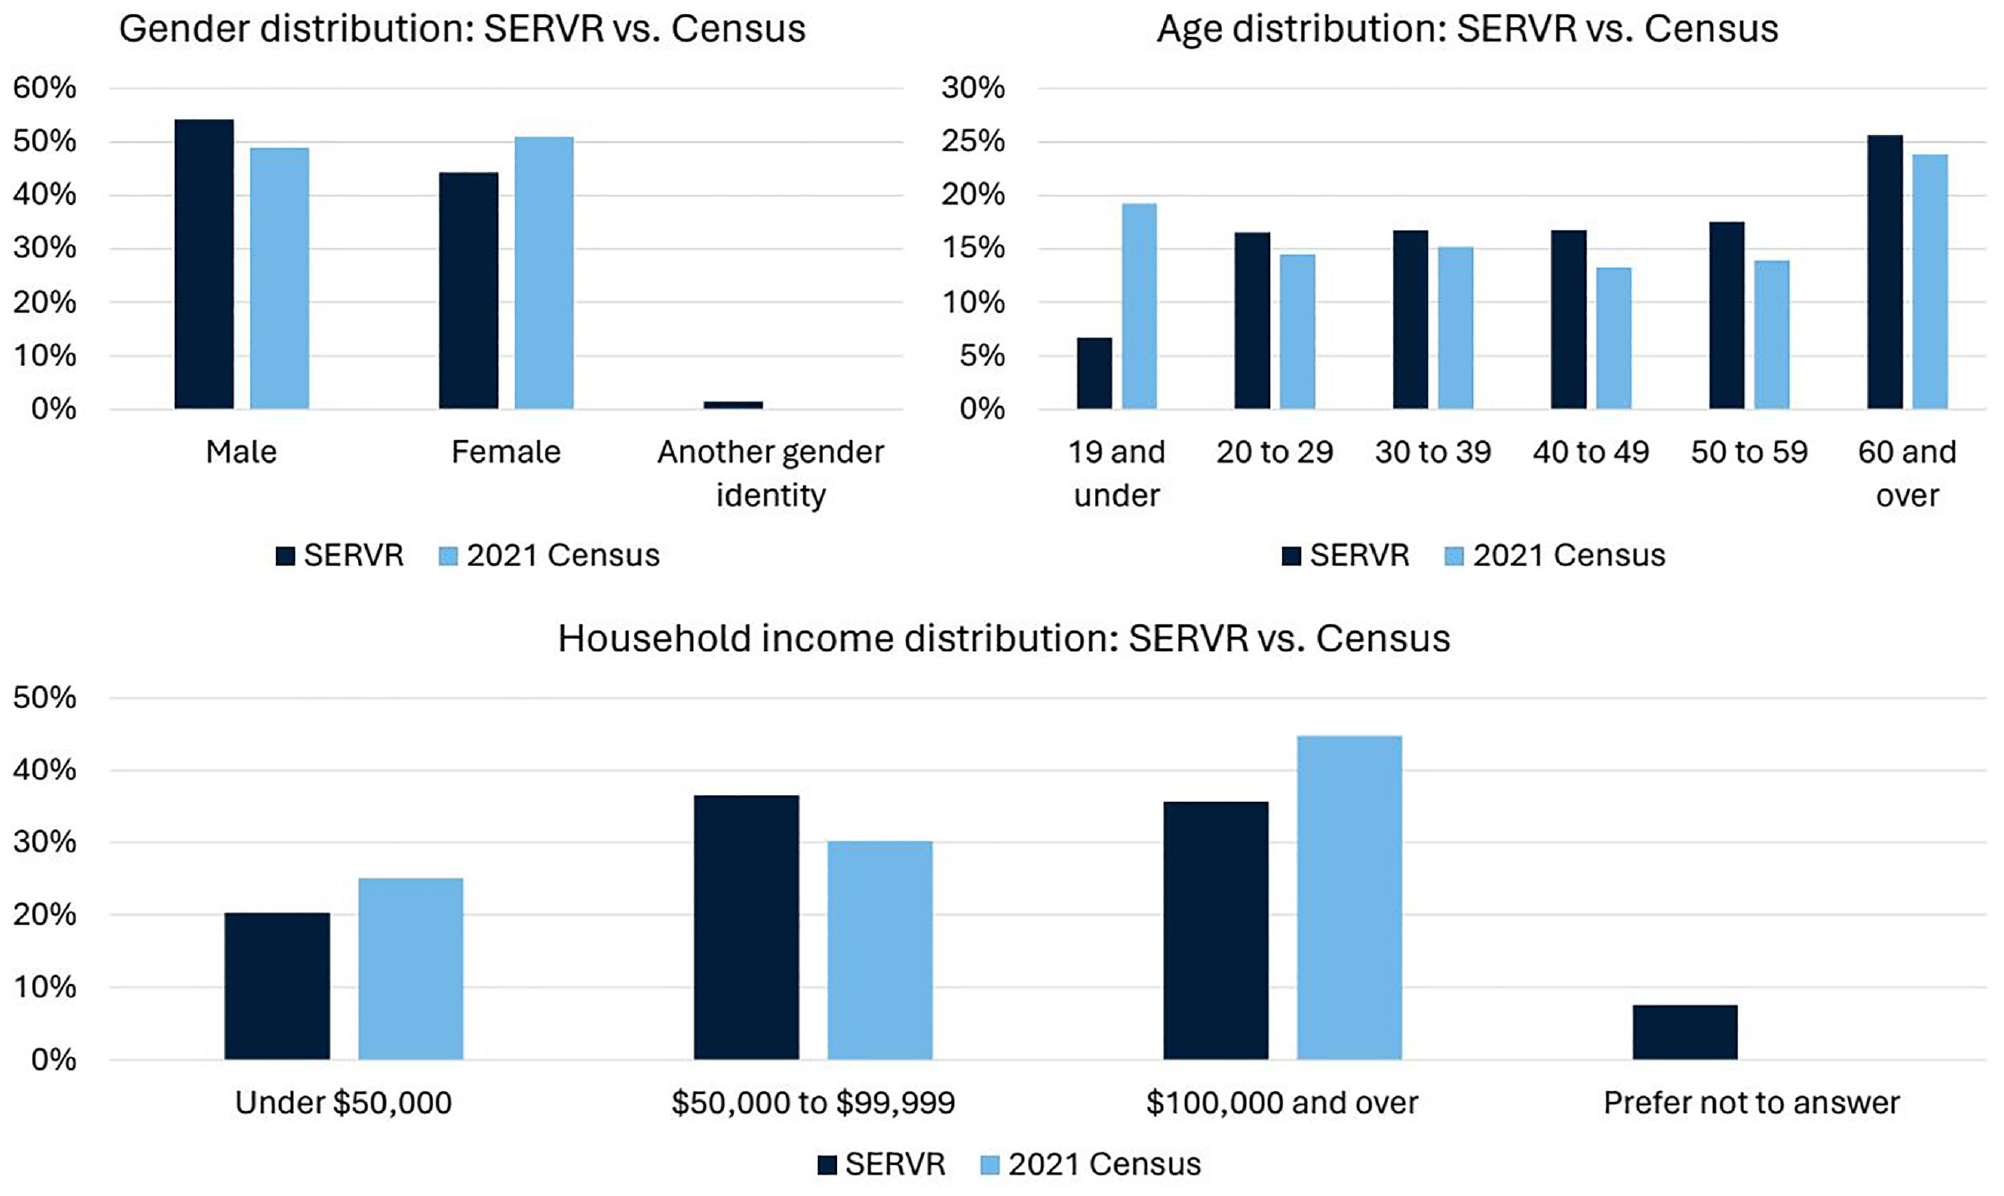
Comparison of gender, age, and household income: Survey on the Effects of Ride-Sourcing in the Vancouver Region (SERVR) versus 2021 Canadian Census.
As shown in Figure 3, the distribution of the modes used in the reported non-commute trips appears to differ from those chosen in the SP experiments. In particular, the drive yourself and walk alternatives were chosen less often in the SP experiments, while the being driven by someone you know and the public transit alternatives were chosen more often. This shift appears to be driven by respondents who drove and walked for their non-commuting trip selecting the local and regional transit alternatives in the SP experiments.
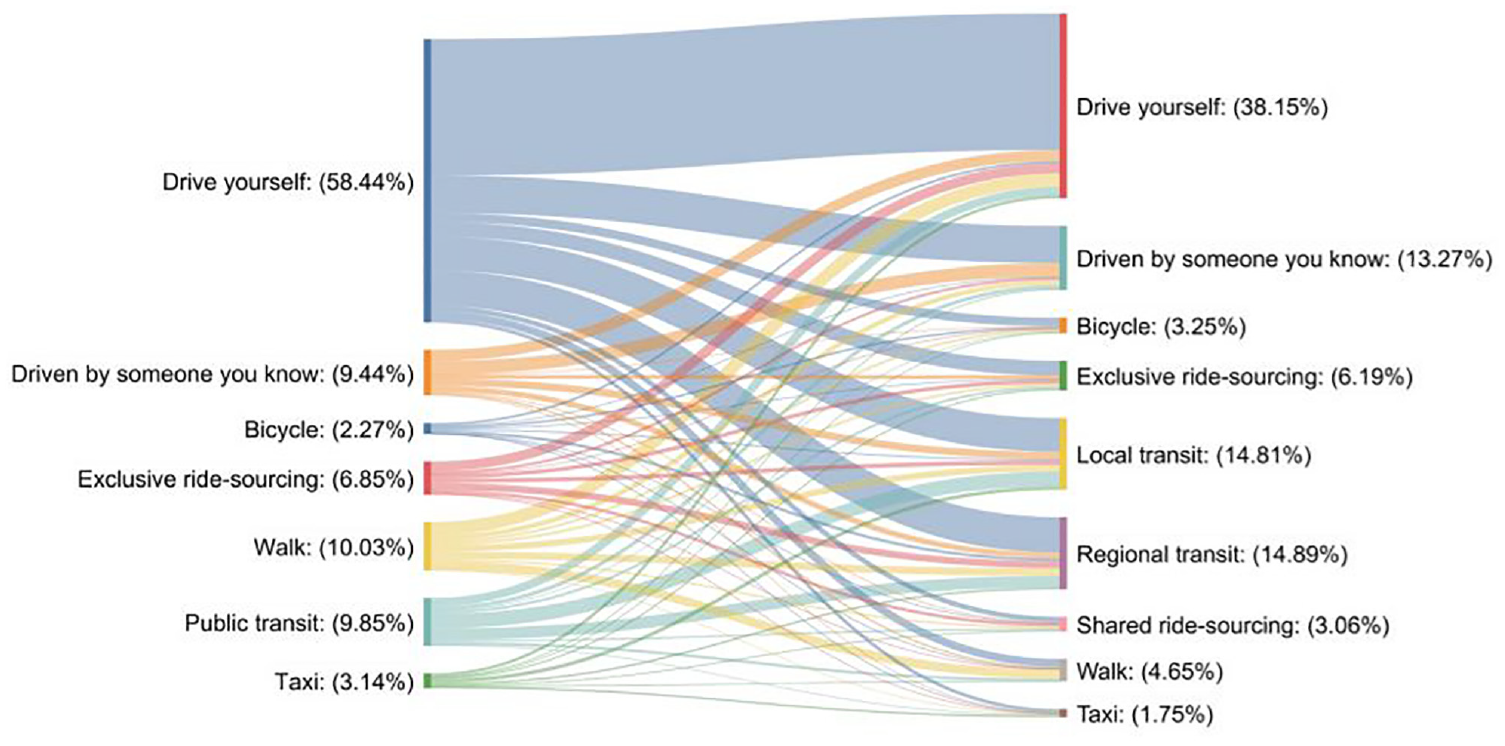
Sankey diagram of revealed preference (RP) (left) and stated preference (SP) (right) mode choices.
Model Formulation
The information obtained through the RP and SP questions were used to develop a joint RP–SP model of mode choice decisions for non-commuting trips. The mode chosen for the reported non-commuting trip was modelled using the multinomial logit (MNL) model. In contrast, the modes chosen in the SP scenarios were modelled using the error component mixed logit model. Let

where
Similarly, the utility associated with choosing alternative j in the SP experiments can be decomposed into:

where
For both the RP and SP choices, the random components of utility were assumed to be independent and identically distributed and follow the Type I Extreme Value distribution ( 53 ). In the RP choice scenario, the probability of individual i choosing alternative j is given by:

where
Similar to prior studies, the value of

where
Because the respondents were asked to complete three choice experiments, the probability of individual i choosing alternatives

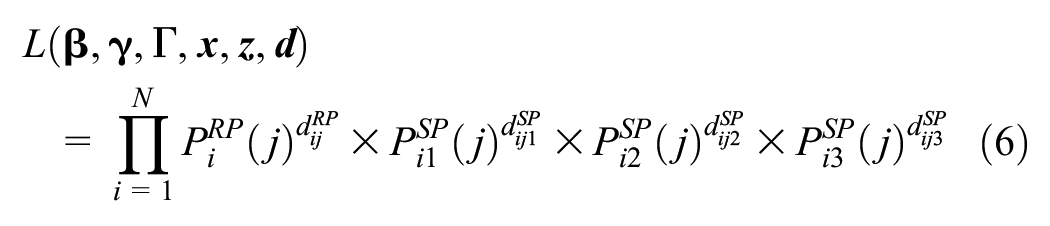
Combining Equations 3 and 5, the likelihood function of the joint RP–SP model is defined as:
where
N denotes the final sample size
The joint RP–SP model was estimated using the MaxLik package written for the GAUSS programming language ( 54 ).
Results
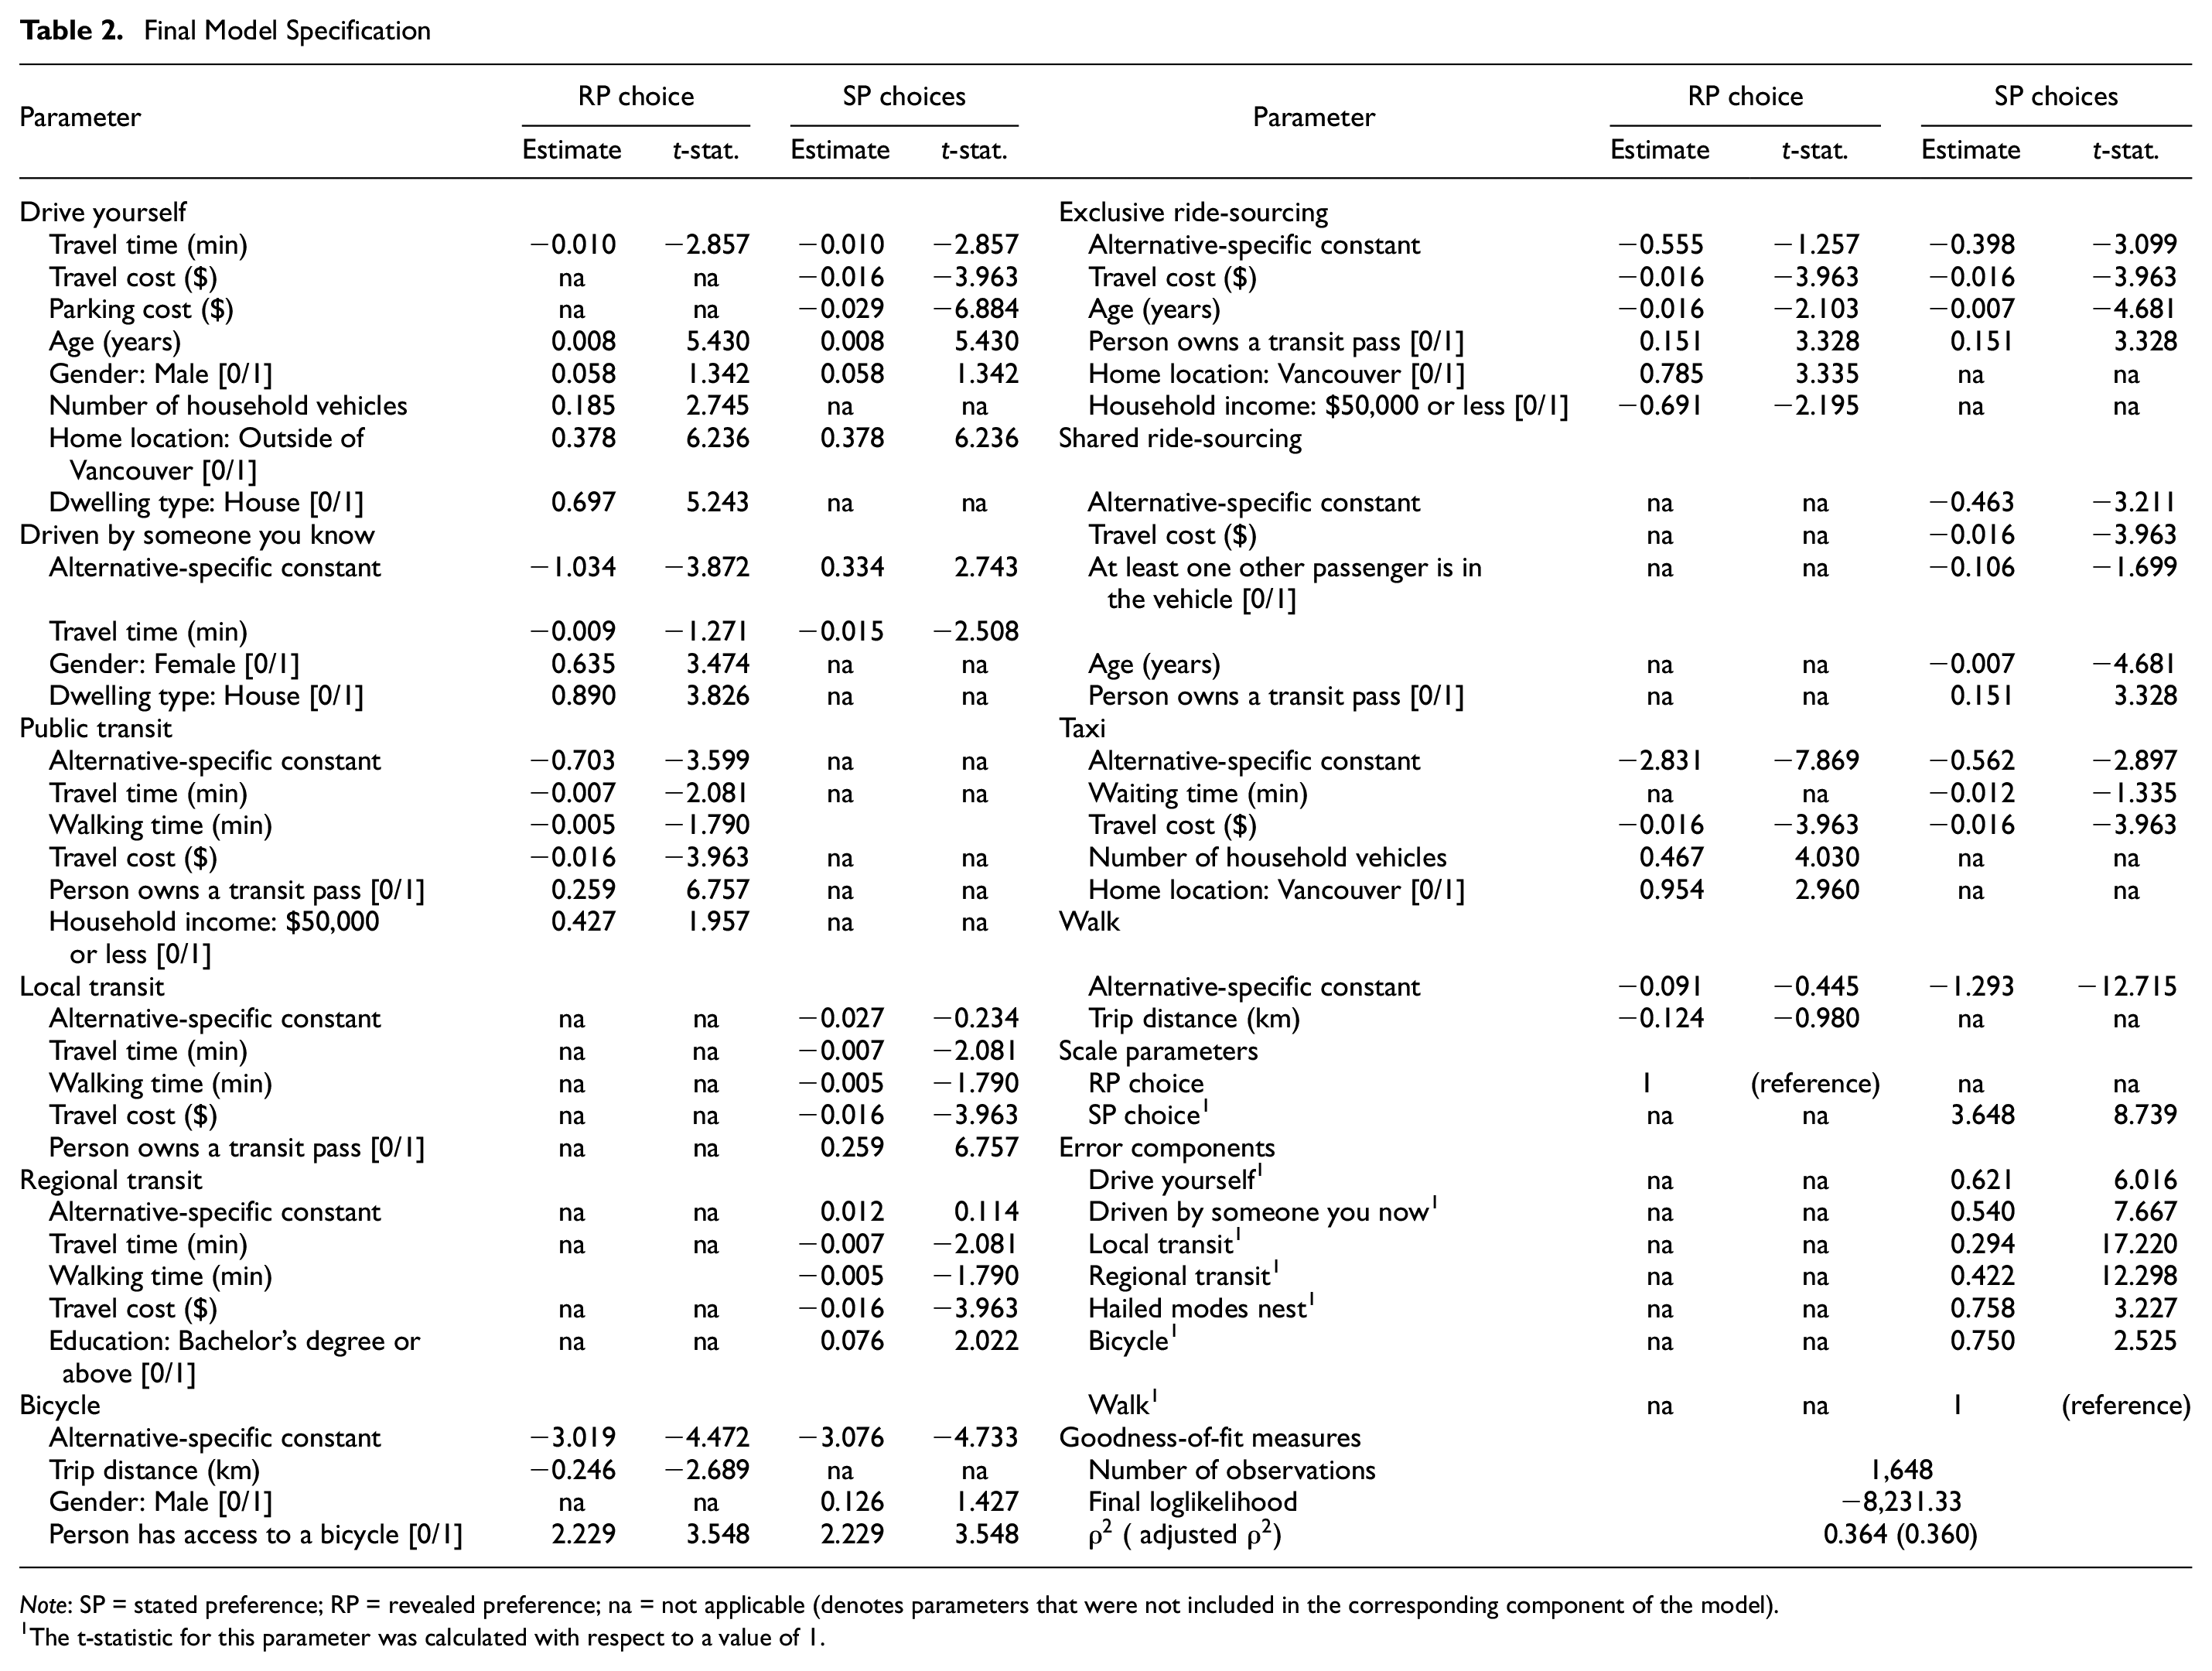
Final Model Specification
The final specification of the joint RP–SP model is summarized in Table 2. OpenTripPlanner (OTP) ( 55 ) was used to impute the level-of-service (LOS) attributes associated with each mode available in the RP choice scenario. The travel time and trip distance corresponding to each mode shown in Figure 2 were obtained directly from the OTP API based on the origin, destination, and departure time of the reported non-commuting trip. The trip distances were used to calculate the cost associated with the drive yourself, exclusive ride-sourcing, and taxi alternatives using the same methodology that was applied to calculate these values in the SP experiments. The cost associated with the public transit alternative was determined based on the origin and destination of the trip and whether the trip involved the use of a rapid transit line. Additionally, OTP produced estimates of the waiting time, walking time, and number of transfers associated with each transit trip. Trips whose origin or destination were outside the study area and trips that could not be made using public transit were removed from the analysis, leaving 1,648 observations.
Final Model Specification
Note: SP = stated preference; RP = revealed preference; na = not applicable (denotes parameters that were not included in the corresponding component of the model).
The t-statistic for this parameter was calculated with respect to a value of 1.
Variables related to socio-demographic attributes, level-of-service attributes, and mobility tool ownership were tested as part of the model estimation process. The decision to retain a parameter in the model was made based on its sign and the value of the corresponding t-statistic. However, a small number of variables that were not statistically significant at the 95% confidence level were retained because they were found to influence mode choice decisions in prior studies. Several nesting structures were tested for both the RP and SP alternatives. A hailed modes nest consisting of the exclusive ride-sourcing, shared ride-sourcing, and taxi alternatives was supported by the SP data; however, a nesting structure was not supported by the RP data. The adjusted
The results are consistent with the expectation that travel time, cost, and access and egress time are negatively associated with the probability of choosing a mode. The final specification of the model also highlights the influence of socio-demographic attributes on mode choice decisions. For example, older individuals were more likely to have driven for their reported trip and more likely to choose the drive yourself alternative in the SP experiments. Moreover, these individuals were also less likely to have used exclusive ride-sourcing and less likely to have chosen exclusive or shared ride-sourcing in the SP experiments. This finding is consistent with studies on ride-sourcing adoption, which consistently find that younger individuals are more likely to be ride-sourcing users ( 1 ).
Moreover, men were more likely to choose the drive yourself and bicycle alternatives in the SP experiments, whereas women were more likely to have been driven for the reported trip. Besides, household income was also found to influence mode choice decisions. Specifically, respondents from households that earn less than $50,000 annually were more likely to have used public transit and less likely to have used exclusive ride-sourcing for the reported trip. Additionally, respondents who live in Vancouver were more likely to have used taxi and exclusive ride-sourcing. In contrast, those living outside of Vancouver were more likely to have driven themselves for the reported trip and to choose the drive yourself alternative in the SP experiments. Prior studies have highlighted the positive influence of living in urban areas on the propensity to use ride-sourcing ( 1 – 3 ).
Aside from socio-demographic attributes, mobility tool ownership also influenced mode choice decisions. Specifically, household vehicle ownership increased the likelihood of using the drive yourself and taxi modes for the reported trip. Besides, access to a bicycle increased the likelihood that the reported trip was made by bicycle and that the bicycle alternative was chosen in the SP experiments.
Additionally, transit pass ownership increased the probability of public transit and exclusive ride-sourcing being used for the reported trip. Moreover, transit pass ownership also increased the probability of the local transit and exclusive ride-sourcing alternatives being chosen in the SP experiments. This is consistent with prior studies, which found that ride-sourcing users are more likely to possess a transit pass than non-users ( 23 , 56 , 57 ).
The probability of the shared ride-sourcing alternative being chosen in the SP experiments was influenced by the cost associated with the trip but not the travel time. This could stem from these services offering customers reduced fares in exchange for the potential for longer travel times (owing to the detours associated with picking up and dropping off other customers). This echoes the work of Lazarus et al. ( 12 ), who found that respondents who were offered discounted fares were more likely to choose shared ride-sourcing. Aside from travel costs, the presence of other passengers in the vehicle reduced the probability that shared ride-sourcing was chosen in the SP experiments. This is consistent with the findings of prior studies that have utilized data from SP experiments ( 13 , 33 ). Additionally, transit pass ownership increased the probability that the shared ride-sourcing alternative was chosen. This could stem from the tendency for transit users to display a greater propensity to use these services ( 12 , 30 , 33 ).
Impacts of Shared Ride-sourcing on Existing Modes
To explore the potential impacts of shared ride-sourcing on the use of existing modes for non-commuting trips in Metro Vancouver, the joint RP–SP model was applied to the SERVR data. However, before the model could be applied to forecast market shares, the utility function of the shared ride-sourcing alternative had to be brought from the SP domain to the RP domain. This was done using an approach similar to that of Bhat and Sardesai ( 58 ) in their study of commute mode choices in the Austin metropolitan region. This allows predictions to be made based on parameters derived from information about observed choices rather than hypothetical choices.
As part of this process, the average difference in utility between the exclusive and shared ride-sourcing alternatives was calculated in the SP domain before being transferred to the RP domain by multiplying the value by the ratio of the scale parameters in the RP and SP domains (defined as
The updated model was then applied to the same dataset that was used to estimate the joint RP–SP model to predict the probability of each respondent choosing each alternative in their choice set. These values were used to calculate the predicted market shares presented in Table 3 through sample enumeration. The introduction of shared ride-sourcing appears to have the greatest impact on the market share of exclusive ride-sourcing, which is reasonable given the similarities between the two services. Additionally, the market shares of the public transit, bicycle, and walk modes declined to a greater extent following the introduction of shared ride-sourcing compared with the drive yourself, driven by someone you know, and taxi modes. This finding validates concerns that the relatively low fares offered by shared ride-sourcing services have the potential to attract demand from more sustainable modes ( 9 , 16 ). Moreover, the introduction of shared ride-sourcing had the smallest impact on the market share of the drive yourself and driven by someone you know modes. Interestingly, this finding is consistent with the results of studies such as Azimi and Jin ( 35 ), Lazarus et al. ( 12 ), and Naumov and Keith ( 17 ), who found that individuals who drive tend to be less likely to use shared ride-sourcing.
Comparison of Observed and Predicted Market Shares
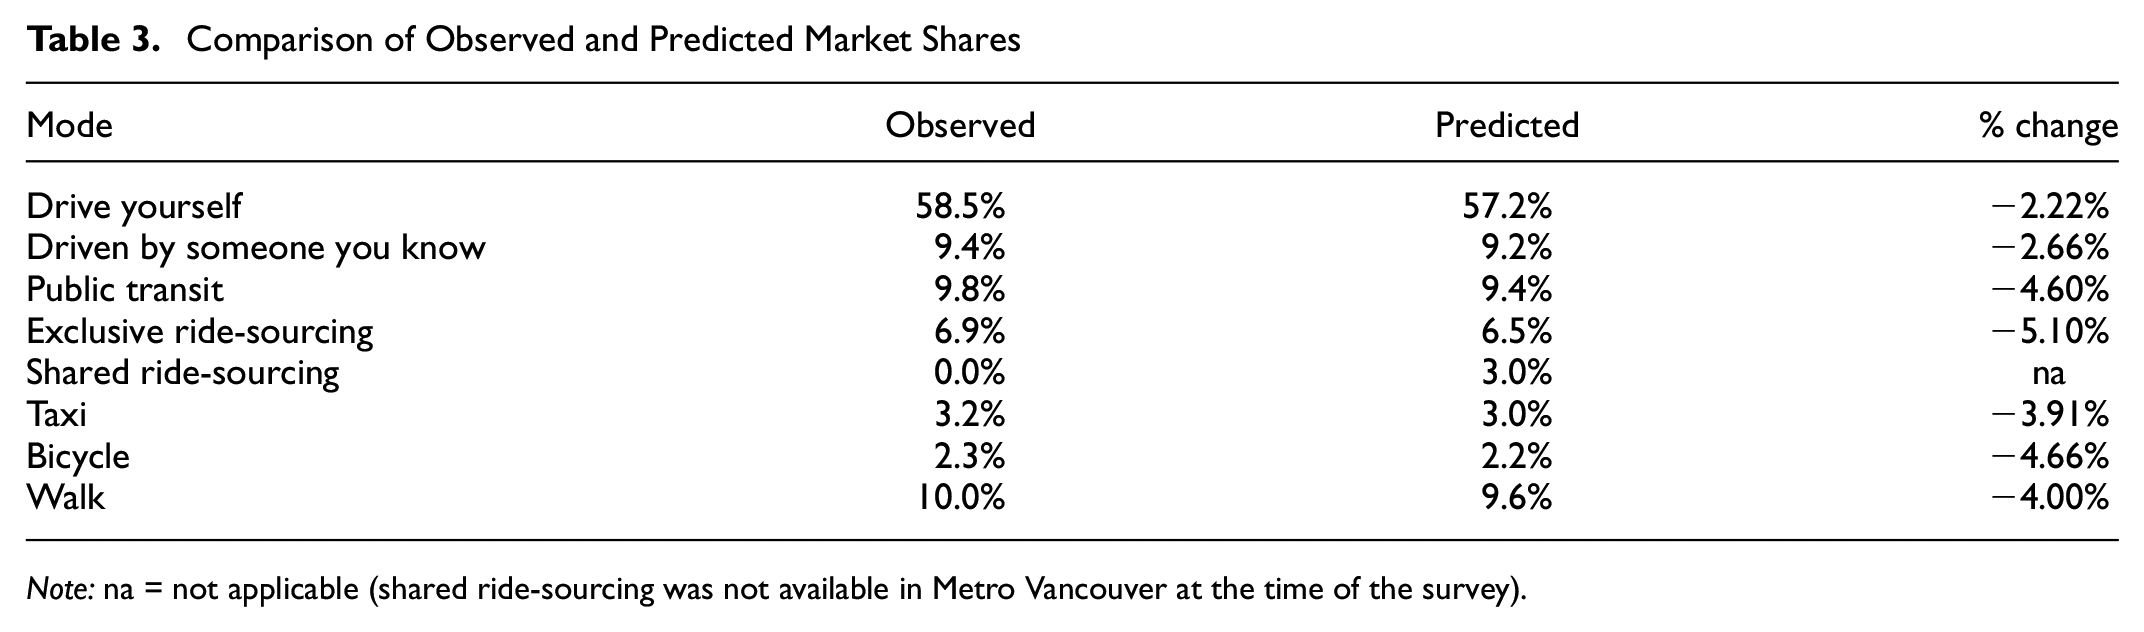
Note: na = not applicable (shared ride-sourcing was not available in Metro Vancouver at the time of the survey).
Discussion
The results shed light on the factors influencing the decision to use shared ride-sourcing and the potential for these services to influence the demand for existing modes. Additionally, the results highlight two factors that could influence the impacts of shared ride-sourcing on the transportation network—the willingness to use these services and the potential for these services to replace trips made using more sustainable modes. The former could be addressed through policies that aim to increase the difference between the cost of exclusive and shared ride-sourcing services, given that cost considerations tend to influence the decision to use shared ride-sourcing ( 11 , 14 ). This could be achieved by implementing a surcharge for exclusive ride-sourcing trips or a subsidy for trips made using shared services. Additionally, ride-sourcing users who have only used exclusive services could be sent promotional offers to encourage them to try using shared services. The results of Lazarus et al. ( 12 ) suggest that promotions such as offering respondents discounted fares on their next ride-sourcing trip or transit trip and the existence of a rewards system increased the likelihood that shared ride-sourcing was chosen.
Aside from costs, the willingness to use shared ride-sourcing could also be influenced by policies that target the perceptions of these services. For example, given that attitudes toward the environment have been found to influence shared ride-sourcing use ( 32 , 33 ), public campaigns highlighting the potential environmental benefits could help encourage the use of these services. The results of studies examining the determinants of the adoption of shared ride-sourcing could help inform policies of this nature by identifying segments of the population that may be more receptive to shared ride-sourcing use. Additionally, the willingness to use shared ride-sourcing could be improved by addressing the perceived risks associated with these services. This could be achieved by highlighting the safety features available to customers during their trip and introducing additional features that can be used in situations where customers are feeling unsafe or experiencing discrimination ( 59 ).
Similarly, the potential for shared ride-sourcing to attract demand from transit and active modes could also be addressed through policies that discourage using these services for shorter trips and trips made near transit stations. This could include an additional surcharge for shared trips that fall below a certain distance threshold, with the funds ideally being used to improve pedestrian and cycling infrastructure. A similar policy could be implemented for trips that both begin and end within a certain distance of transit stations, which would ideally be used to help transit agencies fund operating costs. Additionally, the influence of transit pass ownership on the probability of choosing the shared ride-sourcing alternative in the SP experiments highlights the potential for these services to act as an access and egress mode in areas where transit services are offered on an infrequent basis. This could be implemented through partnerships between transit agencies and TNCs to provide services similar to that of demand-responsive transit.
A critical aspect of reducing the extent to which shared ride-sourcing attracts demand from more sustainable modes is ensuring that these modes are reasonably competitive with ride-sourcing. For public transit, this could be done by ensuring that service is offered relatively frequently, introducing priority lanes for transit vehicles, and improving the coverage of the transit network to reduce access and egress distances. In particular, access and egress distances have been found to contribute to the difference in the travel time when a trip is made with transit compared with when it is made using shared ride-sourcing ( 60 ). For active modes, their competitiveness with ride-sourcing can be improved by increasing the connectivity of cycling and sidewalk infrastructure and expanding cycling infrastructure.
Conclusion
This study presented the results of an investigation into the factors influencing the use of shared ride-sourcing in the context of mode choice decisions and the potential impacts of introducing these services on demand for existing modes. A joint RP–SP model of mode choices for non-commuting trips was developed using data collected through a web-based survey of Metro Vancouver residents. The model was then applied to explore the potential impacts of shared ride-sourcing on the demand for existing modes. To the authors' knowledge, this is the first study to use a joint RP–SP model to explore the potential impacts of shared ride-sourcing services. The final specification of the model suggests that transit pass ownership and the presence of other passengers can affect the decision to use shared ride-sourcing. Additionally, based on the predictions produced by the model, introducing these services can potentially affect demand for exclusive ride-sourcing, public transit, and active modes. Overall, the findings of this study suggest that policy interventions may be required to help ensure that the benefits of shared ride-sourcing (such as reductions in VMT and congestion) are realized.
While this study builds on earlier studies by offering insights into the use and impacts of shared ride-sourcing, there are two important limitations. First, the data used in the study were collected through a web-based survey, creating the potential that the respondents are more technologically savvy on average than the residents of the study area. Given that technological savvy has been found to influence the use of shared ride-sourcing ( 33 ), this could influence the extent to which the results can be generalized to the study area population. Second, the modal shares following the introduction of shared ride-sourcing were calculated based on the responses to SERVR. While the responses were weight-adjusted to improve the extent to which they represent the study area, the distribution of the modes used by the respondents for their reported non-commuting trip may not represent the study area. Moreover, it is difficult to assess the representativeness of this distribution because the most recent household travel survey was conducted before the introduction of ride-sourcing in its current form.
Future studies can build on the work presented in this study by developing joint RP–SP models for a wider variety of trip purposes. For example, studies that have used SP experiments to explore the factors influencing the choice between exclusive and shared services have considered trip purposes such as commuting, shopping, and social trips, as well as trips to the airport ( 12 , 17 , 33 ). This approach would offer further insights into whether the use and impacts of shared ride-sourcing differ based on trip purpose. Similarly, future studies could include additional contextual variables in their SP design to explore whether these factors influence the relationship between shared ride-sourcing and existing modes. Moreover, future studies could incorporate random parameters into their model to capture taste heterogeneity among respondents. Finally, given the potential for attitudes and perceptions to influence travel behavior ( 61 ), future studies should incorporate latent attitudinal factors into their models.
Supplemental Material
sj-docx-1-trr-10.1177_03611981241257510 – Supplemental material for How Does the Introduction of Shared Ride-Sourcing Services Affect Demand for Existing Modes for Non-Commuting Trips? Evidence from a Joint RP-SP Study in Metro Vancouver
Supplemental material, sj-docx-1-trr-10.1177_03611981241257510 for How Does the Introduction of Shared Ride-Sourcing Services Affect Demand for Existing Modes for Non-Commuting Trips? Evidence from a Joint RP-SP Study in Metro Vancouver by Patrick Loa, Felita Ong and Khandker Nurul Habib in Transportation Research Record
Footnotes
Author Contributions
The authors confirm their contribution to the paper as follows: study conception and design: P. Loa, K.N. Habib; data collection: P. Loa, F. Ong, K.N. Habib, analysis and interpretation of results: P. Loa, F. Ong, K.N. Habib, draft manuscript preparation: P. Loa, F. Ong, K.N. Habib. All authors reviewed the results and approced the final version of the manuscript.
Declaration of Conflicting Interests
The authors declared no potential conflicts of interest with respect to the research, authorship, and/or publication of this article.
Funding
The authors disclosed receipt of the following financial support for the research, authorship, and/or publication of this article: TransLink partially funded SERVR through its New Mobility Research Grant program. However, the authors are solely responsible for errors and interpreting the results.
Supplemental Material
Supplemental material for this article is available online.